Measuring gaps in tropical cyclone rainbands using Level II radar reflectivity data Corene Matyas...
15
Measuring gaps in tropical cyclone rainbands using Level II radar reflectivity data Corene Matyas Department of Geography, University of Florida Funding: NSF CAREER Award BCS1053864 1
-
Upload
joshua-miles -
Category
Documents
-
view
216 -
download
0
Transcript of Measuring gaps in tropical cyclone rainbands using Level II radar reflectivity data Corene Matyas...
Measuring gaps in tropical cyclone rainbands using Level II radar
reflectivity data
Corene Matyas Department of Geography, University of Florida
Funding: NSF CAREER Award BCS1053864
1

Early Work on Spatial Patterns of TC Rain Fields
Stationary Band Complex schematicWilloughby, Marks, and Feinberg (1984)
J. Atmos. Sci.
41 dBZ regions of H. Frederic (1979)Parrish, Burpee, Marks, Grebe (1982)
Mon. Wea. Rev.
2

Using a Geographic Information System for TC Rain Field Analysis
40 dBZ regions Ivan (2004)Matyas (2010)
International Journal of Applied Geospatial Research
30, 35, and 40 dBZ regions Hurricane Charley (2004) over Florida
Matyas (2009, JAMC)3

Broad Research Goals• Construct a 3D mosaic of interpolated Level II
radar reflectivity returns*• Calculate metrics relating to the spatial
dimensions of TC rain fields • Use metrics to compare TCs and relate patterns
to environmental forcings• Use metrics to compare observational and
model-derived TCs
*Tang and Matyas to be submitted to JTECH March 2015 4
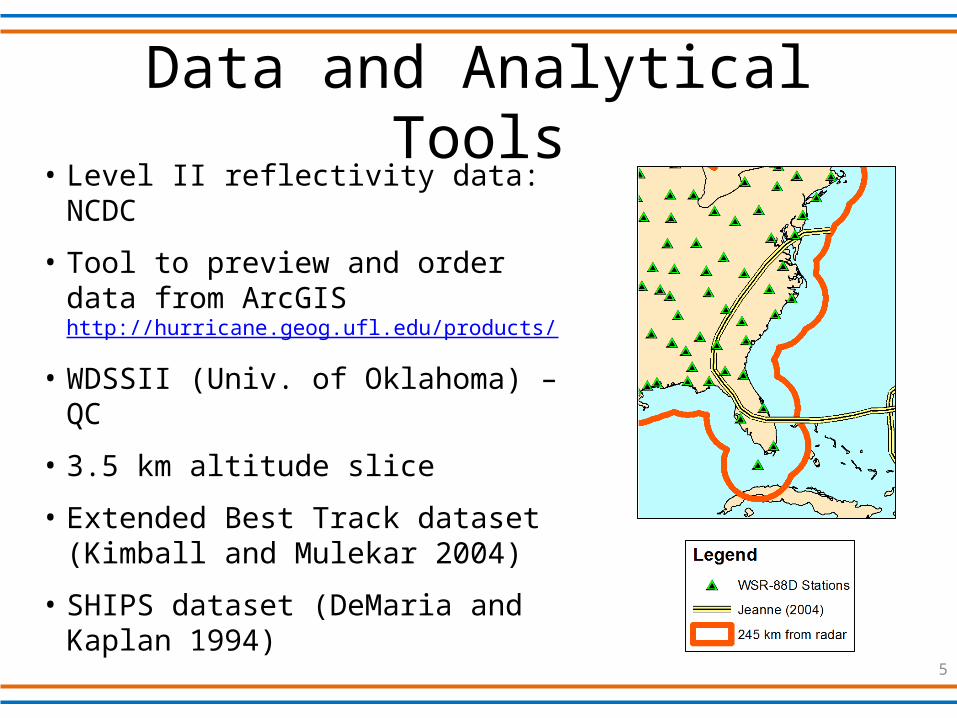
Data and Analytical Tools• Level II reflectivity data: NCDC
• Tool to preview and order data from ArcGIS http://hurricane.geog.ufl.edu/products/
• WDSSII (Univ. of Oklahoma) – QC
• 3.5 km altitude slice
• Extended Best Track dataset (Kimball and Mulekar 2004)
• SHIPS dataset (DeMaria and Kaplan 1994)
5
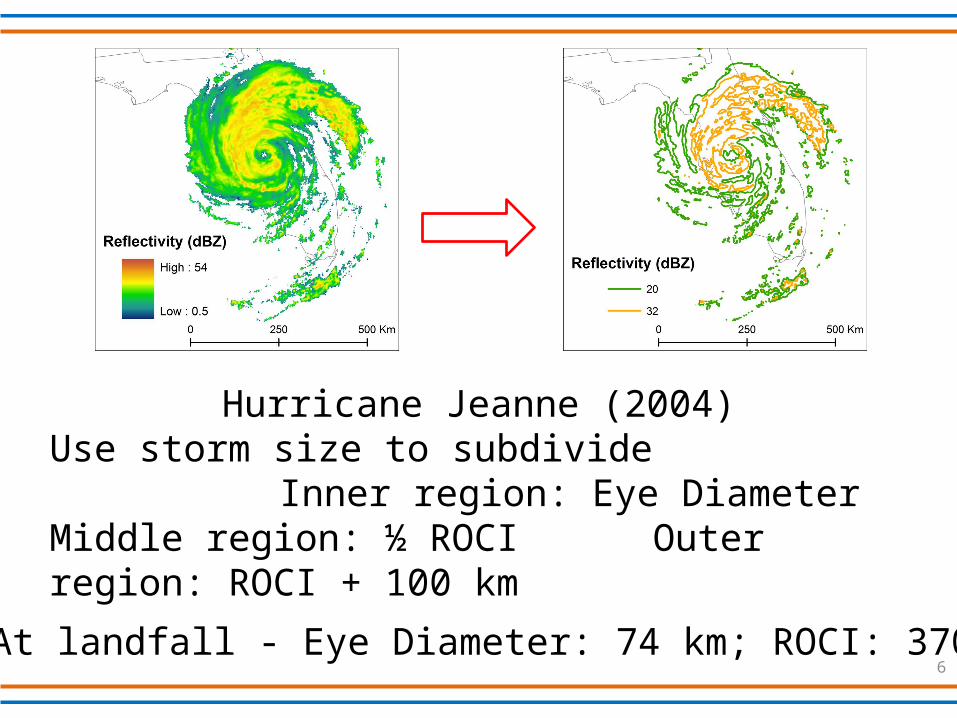
Hurricane Jeanne (2004)Use storm size to subdivide
Inner region: Eye DiameterMiddle region: ½ ROCI Outer region: ROCI + 100 km
At landfall - Eye Diameter: 74 km; ROCI: 370 km6

Delimitations to Establishing Gaps
• Gap must be at least 10° wide
• Reflectivity-filled regions between gaps must be at least 10° wide
• Gap must last at least 30 minutes
• 30 minute smoothing window applied
7

Storm Motion and 200-850 hPa Vertical Wind Shear
Chen et al. (2006,) Fig. 14
8

32 dBZ Contour Intersections
9/26 1500 UTC
9/27 1500 UTC
9/28 1500 UTC
Storm Motion
200-850 hPa Shear
Roge
rs e
t al.
(200
3)
Fig.
21
9
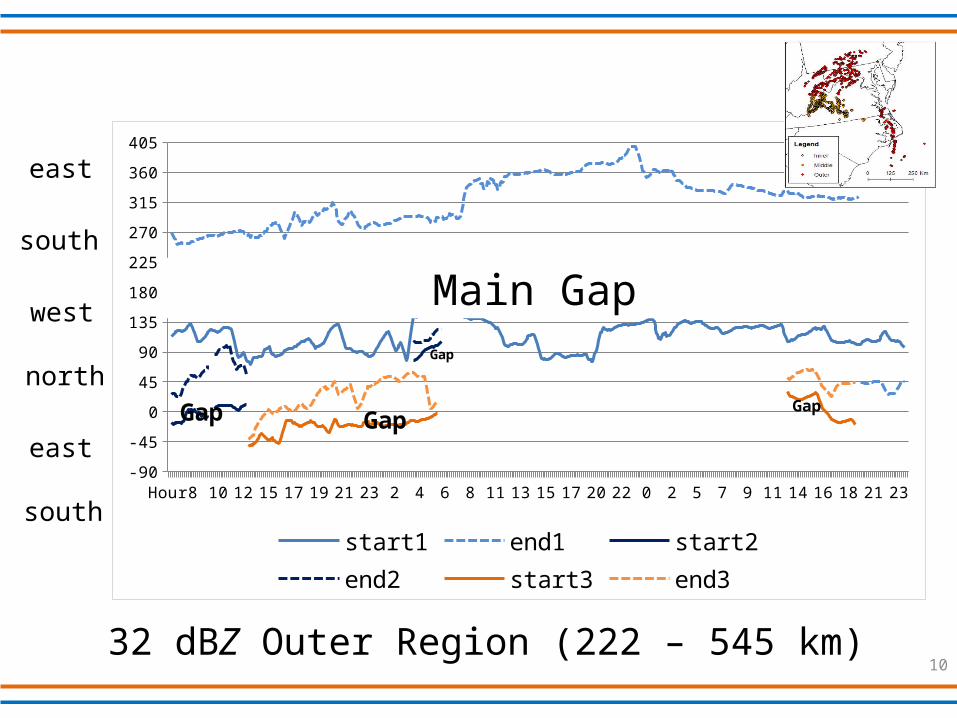
32 dBZ Outer Region (222 – 545 km)
Hour 7 9 11 13 15 17 19 21 23 0 2 4 6 8 10 12 14 16 18 19 21 23 1 3 5 7 9 11 13 15 16 18 20 22-90
-45
0
45
90
135
180
225
270
315
360
405
start1 end1 start2end2 start3 end3
east
north
west
south
east
south
Main Gap
GapGapGap
Gap
10

32 dBZ Middle Region (74-222 km)
7 9 11131516182022 0 2 4 6 8 9 11131517192123 1 2 4 6 8 10121416182022 0-45
0
45
90
135
180
225
270
315
360
b1 e1 b2 e2 b3 e3 b4 e4
Gap Area
Gap Areaeast
north
west
south
east
FilledFilled Area
Gap Area
Gap
11
Findings• Gaps in reflectivity correspond well to motion and
shear vectors (Corbosiero and Molinari 2002, 2003; Chen et al. 2006; Lonfat et al. 2007)
• Outer region exposed to west landfall - end• Middle region shrinks in coverage from 360° to
90°• Outer region offset from middle until shear and
motion align/ velocities increase • Size measures good approximation for division
12
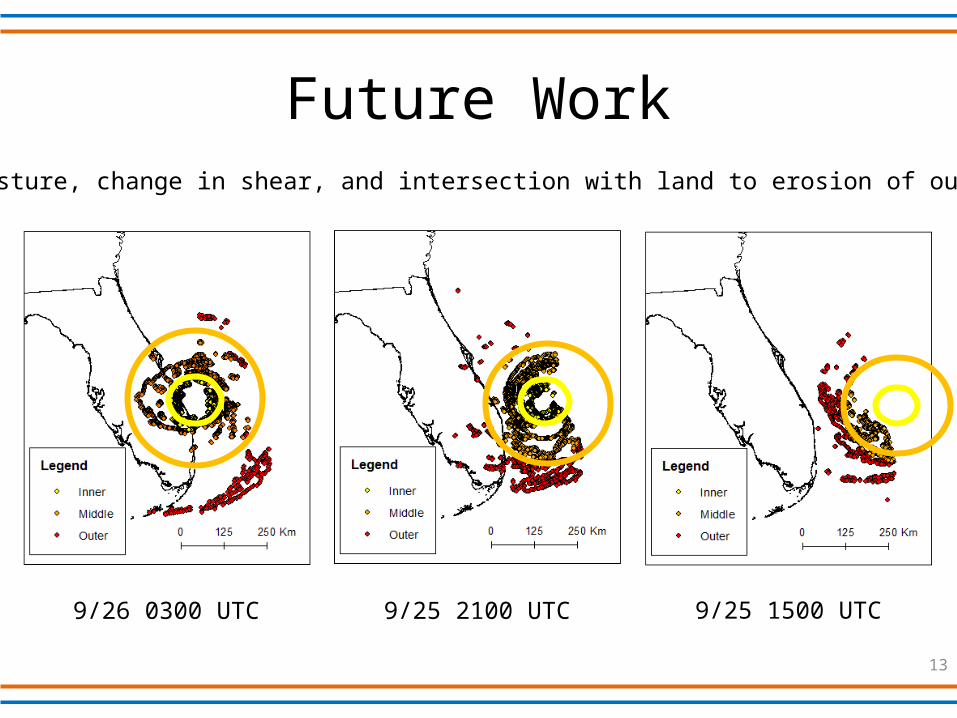
Future Work
9/26 0300 UTC 9/25 2100 UTC 9/25 1500 UTC
Relate moisture, change in shear, and intersection with land to erosion of outer region
13
Future Work• Look at Frances (2004) for comparison (Matyas
and Cartaya 2009, Southeastern Geographer)• Role of moisture (NARR) – Zick and Matyas
(2015, JGR-A), paper 2 in analysis • Use to assess accuracy of rainband
representation in WRF
Thanks to Jingyin Tang for computer code14
References• Chen, S. Y. S., J. A. Knaff, and F. D. Marks, 2006: Effects of vertical wind shear and storm motion on tropical cyclone rainfall
asymmetries deduced from TRMM. Mon. Wea. Rev., 134, 3190-3208.• Corbosiero, K. L., and J. Molinari, 2002: The effects of vertical wind shear on the distribution of convection in tropical cyclones. Mon.
Wea. Rev., 130, 2110-2123.• Corbosiero, K. L., and J. Molinari, 2003: The relationship between storm motion, vertical wind shear, and convective asymmetries in
tropical cyclones. J. Atmos. Sci., 60, 366-376.• DeMaria, M., and J. Kaplan, 1994: A statistical hurricane intensity prediction scheme (SHIPS) for the Atlantic basin. Wea. Forecasting, 9,
209-220.• Kimball, S. and S. Mulekar, 2004: A 15-year climatology of North Atlantic tropical cyclones. Part I: Size parameters. J. Clim, 17, 3555-
3575.• Lonfat, M., R. Rogers, T. Marchok, and F. D. Marks, 2007: A parametric model for predicting hurricane rainfall. Mon. Wea. Rev., 135,
3086-3097.• Matyas, C. J., 2009: A spatial analysis of radar reflectivity regions within H. Charley (2004). J. Appl. Meteorol. Climatol., 48, 130-142.• Matyas, C. J., 2010: A geospatial analysis of convective rainfall regions within tropical cyclones after landfall. International Journal of
Applied Geospatial Research, 1, 69-89.• Matyas, C. J., and M. Cartaya, 2009: Comparing the rainfall patterns produced by Hurricanes Frances (2004) and Jeanne (2004) over
Florida. Southeastern Geographer 49, 132-156.• Parrish, J. R., R. W. Burpee, F. D. Marks, and R. Grebe, 1982: Rainfall patterns observed by digitized radar during the landfall of
Hurricane Frederic (1979). Mon. Wea. Rev., 110, 1933-1944.• Rogers, R. F., S. S. Chen, J. Tenerelli, and H. E. Willoughby, 2003: A numerical study of the impact of vertical shear on the distribution of
rainfall in Hurricane Bonnie (1998). Mon. Wea. Rev., 131, 1577-1599.• Willoughby, H., F. Marks, R. Feinberg, 1984: Stationary and moving convective bands in hurricanes. J. Atmos. Sci., 41, 3189 - 3211.• Zick, S. E., and C. J. Matyas, 2015: Tropical cyclones in the North American Regional Reanalysis: An assessment of spatial biases in
location, intensity, and structure. Journal of Geophysical Research: Atmospheres, DOI: 10.1002/2014JD02241715