Measuring Frequency Response - Ridley...
12
1 ©Copyright 2006 Switching Power Magazine
Transcript of Measuring Frequency Response - Ridley...

1©Copyright 2006 Switching Power Magazine
Measuring Frequency Response.qxp 8/7/2006 4:30 PM Page 1

are challenging. Simulation is ineffective in showingall the behaviors we see in power converters. EMI ispervasive everywhere, and nanosecond transitionscan introduce noise and create chaotic operation inthe audible range of frequency, all the way down tosubsonic events.
Components are not usually characterized or specifiedproperly by manufacturers for use in such a demandingenvironment. Our completed power stages are usuallycomplex, very changeable over their range of power,voltage and temperature operation, and always noisy.Measurement is an integral part of such a world, andfrequency response measurement is just as essential astime-domain measurement.
What is a Frequency ResponseAnalyzer?A good frequency-response analyzer is a very special-ized instrument which has the following features:
● Operating frequency range from below 1 Hz to greater than 10 MHz
● Swept-sine output oscillator to drive circuit under test
requency response measurements are morecrucial to the power supply industry than anyother. We use a frequency response analyzerfor measuring complete and partial powercircuits, and each of the frequency-dependentbuilding blocks of power circuits.
In this article, we will explain why this is soimportant to us, and how to obtain the maximum bene-fit from this essential piece of test equipment.
In our work as power supply designers, we face some-thing unique: a wide time-constant separation encom-passing events slower than 1 second, and faster than 1ns. If you work on the bench with power supplies,you’ll find yourself turning the time-base scale morefrequently, and over a wider range, than any otherindustry due to this phenomenon.
And we expect our components to work over this range.This leads to power components being dominated notby their main value, but by their parasitic elements.
The wide separation of time constants that we see is thefundamental reason why so many of the things we do
F
2©Copyright 2006 Switching Power Magazine
Measuring Frequency Response.qxp 8/7/2006 4:32 PM Page 2

● Dual receiver channels to measure ratio of signals and phase shift of signals at the frequency of the oscillator
● High noise rejection with selectable bandwidth of the receiver channels
● Direct interface to a computer for post-processing of data
The oscillator outputs a test frequency, and the tworeceiver channels measure the ratio at that same fre-quency in the test circuit. The frequency is increment-ed in discrete steps from the start to the stop fre-quency, with a dwell time at each point to allow thecircuit to stabilize.
There are no instruments that do exactly the same job.A spectrum analyzer is similar in that it can measure atest channel with a very selective bandwidth, but it doesnot do gain and phase comparisons.
Time-domain based equipment, such as oscilloscopes,do not have the necessary noise filters, dynamic range,tracking oscillator and measurement processing neededto perform the same function.
A signal generator in association with an oscilloscopecan perform partial functions, but with very limiteddynamic range of operation, and only as part of atedious and lengthy laboratory process.
Available EquipmentThe list of available frequency response analyzersgrows shorter every year. The power supply industry’sneeds for loop measurement, and wideband, low-fre-quency, component characterization are unique in theworld of electronics. There is not enough demand forthe major equipment manufacturers to develop newproducts for us.
For many years, Hewlett Packard made the best piece ofequipment available– the HP4194A. Capable of meas-uring from 10 Hz to 100 MHz in gain-phase mode, andup to 40 MHz in impedance mode, the instrument wasprecisely calibrated with many specialized fixtures formeasuring components accurately. This instrument,
priced at over $45,000, is no longer available, althoughyou can find them on the used equipment market forabout half the original sticker price.
The Hewlett Packard HP4195 added a spectrum analyz-er to the list of features available, at a higher stickerprice– but this, too, is no longer available. The latestofferings from Agilent have only 50 ohm input capa-bilities, geared towards the much more lucrative RFtest industry.
Since the early days of loop measurement, other equip-ment manufacturers have come and gone. The Bafco916XH was an early all-analog instrument capable of 100kHz operation. It even came equipped with an analog penplotter, which is good fun for any analog engineer.
Venable Industries has been a founding presence in theindustry for over 20 years, and when Dean Venable waswith the company, he did a great job of spreading theword about the need to measure loop gains of powersystems. Their equipment is beyond the price range ofmost power supply groups– around $30,000 or more.The frequency range is also limited to only 2.2 MHz,and as we will see later, this is inadequate for capturingthe characteristics of many important components thatwe use in power electronics.
AP Instruments is now the dominant leader in the field.Founded by Alan Phillips, who formerly worked forHewlett Packard, they make the most practical, easy-to-use, and cost-effective analyzer on the market today.The new product, Model 200, was announced recentlyat the APEC 2002 conference in Dallas. Model 200offers a notebook computer parallel interface for theanalyzer, without sacrificing any features. This instru-ment is marketed and supported exclusively by RidleyEngineering. We never meant to be in the business ofselling network analyzers, but it was such a good prod-uct when we bought the first one for our own use in1994 that it was a very natural product for us to carry.In addition, we needed to make sure that this type ofequipment would always be available to our industryas a lab tool.
As we will see later in this article, the process of analogloop injection and measurement will be with us fordecades to come. New digital control technologies willnot change this fact, and we are delighted that APInstruments will continue to develop new products to
3©Copyright 2006 Switching Power Magazine
Measuring Frequency Response.qxp 8/7/2006 4:32 PM Page 3

keep pace with modern technology, and provideus all with a tool that is essential to power sup-ply design efficiency.
Component ImpedanceMeasurementEarly in my career as a power supply designer,I learned the need for frequency response meas-urements. At my first job at Prime Computer inMassachusetts, Dean Venable visited to showthe latest equipment for automated loop gainmeasurement. Prior to this, Dr. DavidMiddlebrook had shown how to use manualinstruments for high-noise measurements usinga narrow band voltmeter in his famous analogdesign course.
Once we purchased a network analyzer, we quicklyfound that it had many uses beyond just transfer func-tions of completed converters. We found it an essentialpart of the development process to do a complete fre-quency response of all of the power components beingused to build the power supply.
Once you get familiar with the use of a frequencyresponse analyzer, you will find yourself measuringeverything in sight. You’ll also be surprised and diss-appointed in the innacuracy of printed data frommanufacturers.
Today, there is a higher level of awareness of the effectsof component parasitics. We have much better compo-nents available, but the vendors are still not doing acomprehensive job in providing the full data that we
Figure 1: The lastest new analyzer available from APInstruments– AP200 Frequency Response Analyzer
need to use them. Nor should we expect them to. Theirjob is to make better parts for the least amount ofmoney. No one is prepared to pay for the engineeringtask of measuring them properly. That has become ourjob as component users since we insist on performancewith low cost.
Every power capacitor, inductor, and transformer that Iput into a power supply is first characterized on a fre-quency response analyzer. It’s a step that savesselecting poorly designed parts, avoids manufac-turer’s errors in data, and lets me choose themost effective parts for the particular function.
Manufacturers of parts, naturally, do a good job ofmeasuring the headline feature of a part they make. If
it’s a 100 µF capacitor, it will be properlydesigned to measure 100 µF plus orminus the appropriate percentage. This isthe one thing on a capacitor that youactually DON’T need to measure– itscapacitance.
If you have a decent frequency responseanalyzer, you can very easily convert itinto an impedance-measuring device withsufficient range and accuracy for imped-ance measurements for power compo-nents.
Figure 2a: AP200 Frequency Response Analyzer Ready forHigh-Impedance Measurement
4©Copyright 2006 Switching Power Magazine
Measuring Frequency Response.qxp 8/7/2006 4:32 PM Page 4

High Impedance MeasurementThere are two setups used to obtain accurate impedancemeasurements. One is for high impedances, and one forlow impedances. The high impedance measurementsetup is useful for inductors, transformers, and low-value capacitors. The basic setup for this measurementis shown in Figure 2.
This setup is a very important circuit that can be usedwith any frequency response analyzer, and even with asignal generator and oscilloscope (albeit with limitedrange). It has the important characteristic of being ableto measure capacitances much lower than the inputcapacitance of the measurement channels, and values aslow as 2 pF can be measured without any special cali-bration. This is very important for characterizingtransformer and inductor winding capacitances andresonant frequency.
Figure 3 shows example measurements performed withthis setup. These measurements are the open and short-circuit impedances of a power transformer. From thisdata, you can extract magnetizing inductance, leakageinductance, winding capacitance, resonant frequency,and Q. The second plot shows how a single layer ofinsulating tape omitted from a sample transformer ledto a significant shift of the frequency response, and fail-ure in the power supply.
In power supply design, collecting this data across thefull range from 10 Hz to 15 MHz is an important partof the design documentation. It provides a completepicture of component performance over the full fre-
quency range of operation, and a good basis for com-parison of alternate source parts, and magnetics provid-ed by manufacturers during the progress of your proj-ect. Simple RLC numbers at a single frequency aremuch less revealing of potential changes and compro-mises in design.
This setup works well for impedance greater than thevalue of the sense resistor of Figure 2b. The range canbe shifted up or down by changing the sense resistor,but for low impedances, it is preferable to switch to alow-impedance setup with proper Kelvin connections.
Figure 2b: Schematic of High-Impedance Measurement
Figure 3: Example Transformer Measurements
5©Copyright 2006 Switching Power Magazine
Measuring Frequency Response.qxp 8/7/2006 4:32 PM Page 5
Being able to accurately extract the ESRfor the capacitors you are using is veryimportant during product development. Wehave learned over the years that manufac-turers specify ESR very loosely. It is oftenspecified much higher that it measures.While this gives a better power perform-ance than the data sheet promises, it is abig problem when you are relying on theESR for loop compensation, or filterdamping, as is often the case in powersupply design. We will see an example ofthis in the loop gain section of this article.
Figure 6 shows the total dynamic range ofimpedance measurements using the Model200 Analyzer. This requires only two dif-ferent sense resistor setups, and is usually
sufficient to cover the range of all the power compo-nents that you will encounter in your design. The rangecan be extended further in special cases by changing thesense resistor values.
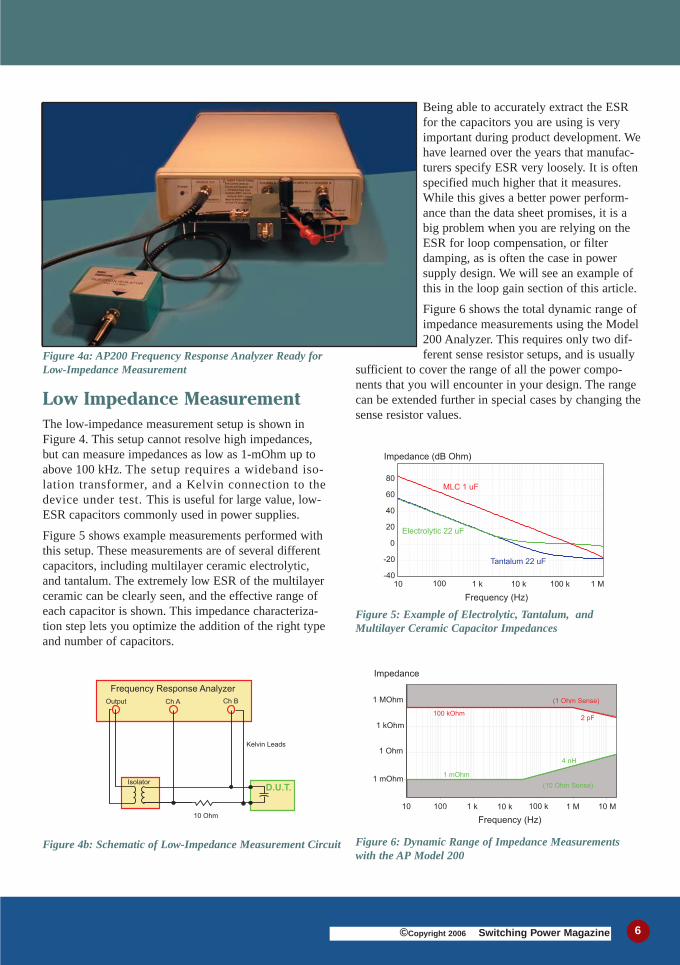
Low Impedance MeasurementThe low-impedance measurement setup is shown inFigure 4. This setup cannot resolve high impedances,but can measure impedances as low as 1-mOhm up toabove 100 kHz. The setup requires a wideband iso-lation transformer, and a Kelvin connection to thedevice under test. This is useful for large value, low-ESR capacitors commonly used in power supplies.
Figure 5 shows example measurements performed withthis setup. These measurements are of several differentcapacitors, including multilayer ceramic electrolytic,and tantalum. The extremely low ESR of the multilayerceramic can be clearly seen, and the effective range ofeach capacitor is shown. This impedance characteriza-tion step lets you optimize the addition of the right typeand number of capacitors.
Figure 4a: AP200 Frequency Response Analyzer Ready forLow-Impedance Measurement
Figure 4b: Schematic of Low-Impedance Measurement Circuit
Figure 5: Example of Electrolytic, Tantalum, andMultilayer Ceramic Capacitor Impedances
Figure 6: Dynamic Range of Impedance Measurementswith the AP Model 200
6©Copyright 2006 Switching Power Magazine
Measuring Frequency Response.qxp 8/7/2006 4:32 PM Page 6

Transfer Function and LoopGain MeasurementThe most widely known use of a frequency responseanalyzer is for loop gain measurement. This is the mostchallenging application for the instrument, and somecare must be applied in making these measurements. Atypical power supply loop gain will push the frequencyresponse analyzer’s specifications of dynamic range andnoise rejection to the limit.
First, we’ll explain the difficulties involved in makingthese measurements. Figure 7 shows a typical powersupply loop gain measured with a frequency responseanalyzer. At the low frequency end of a power supplyloop measurement, the gain of thesystem will be very high– in excessof 60 dB, and sometimes as high as80 dB. Consider the size of the sig-nals needed to make this measure-ment. You must ensure that you aremeasuring “small-signal” with asmall AC perturbation on top of theDC operating point. For this, theinjected perturbation signal ridingon the output will typically be 100 mV or less.
The input signal to the loop, fora 100 mV output, will be 0.1 mVfor a gain of 60 dB, and 10 µVfor a gain of 80 dB. It is com-mon, however, to have severalhundred mV of noise in the sig-
nals, as shown in Figure 8. It is impossible to meas-ure the test signal in so much noise without a spe-cialized instrument. This is where a true frequencyresponse analyzer provides its value– extracting thetest frequency only, with a very narrow bandwidth,so system noise does not interfere with the meas-urements.
Figure 7: Typical loop gain showing high gain at lowfrequency, and 5 kHz crossover frequency.
100 mV/div
5 us/div
Figure 8: Typical test signal to be measured, with switch-ing spikes and other noise. Less than 0.1 mV test signalmust be accurately measured in the presence of over 200 mV noise.
Figure 9a: Frequency Response Analyzer Ready to MeasureLoop Gain of a Power Supply
7©Copyright 2006 Switching Power Magazine
Measuring Frequency Response.qxp 8/7/2006 4:33 PM Page 7

This is shown in Figure 9. The only complication withthis technique is that the signal injected into the circuitmust be injected differentially across the resistor, notwith respect to ground. The output signal from the net-work analyzer is coupled through an isolation trans-former. This is preferable to an active device that mayinteract with the circuit.
Loop Gain TestSetupPower supplies are extreme-ly high DC-gain systems.They use integrators tomaximize the DC gain, andensure that the output volt-age DC regulation is tight.The power supply and con-trol circuits cannot, there-fore, be run with the loopopen. It’s simply not possible tohold the DC operating pointsteady with an open loop system.
Fortunately, there are established and documented tech-niques for measuring the open loop gain of a systemwhile the loop is kept physically closed. The only inva-sion into the circuit is through the insertion of a testresistor. The technique is very accurate as it does indeedmeasure the true open loop gain of the system, not again modified by the injection technique itself.
Figure 9b: Feedback loop system showing frequency response analyzerconnection and injection resistor.
Figure 10: Signal distribu-tions at different loop gains–high gain, crossover, andlow gain. The injected signalsize stays constant acrossthe whole frequency range,and gets distributed betweenthe input and output of theloop, depending on the loopgain.
(a) Low Frequency (b) Crossover Frequency (c) High Frequency
8©Copyright 2006 Switching Power Magazine
Measuring Frequency Response.qxp 8/7/2006 4:33 PM Page 8

It’s a little unusual how this works– the signal sizeacross the resistor is constant, determined by the outputsource of the analyzer. The vector sum of the injectedsignal and return signal are exactly equal to this inject-ed signal. The power supply feedback system willadjust the signal sizes according to the gain of the loop.For example, if the gain of the system is 60 dB, and theinjected signal is 100 mV, almost the entire injected sig-nal appears across the output and only 0.1 mV acrossthe input.
At the crossover frequency, the injected signal is distrib-uted equally between input and output signals. And,when the gain of the system is very low, beyond thecrossover frequency, most of the signal is applied to theloop input, and only a small fraction to the loop output.Signal distribution at different frequencies are shown inFigure 10.
An animated example of this process can be seenat the Ridley Engineering web site,www.ridleyengineering.com showing graphically how the injected signal is dividedbetween loop input and output.
In order not to disturb the operating point of the system,the injection resistor is kept small relative to other com-ponents in the circuit. Typically, a 20 or 50 ohmresistor is used.
During measurement, it is usually advisable to monitorcritical waveforms of the control system to make surethat they remain in the small-signal region. An oscillo-scope probe on the output of the error amplifier, andoutput of the power supply, is usually sufficient. As thegain of the loop changes, it is customary to adjust the sizeof the signal injection to keep the signals large enough tobe measured, but small enough keep the system linear.
When you first make loop measurements, you maybecome frustrated with the noise level at low frequen-cies compared to the textbook loop measurements thatyou may see in papers. It takes a great deal of time tocollect data and smooth out all of the noise, with manyaveraged sweeps.
Example Loop MeasurementA printer power supply company was ready to release adesign to manufacturing. A substantial amount of mod-eling and prediction ensured system stability. The powersupply was considered ready for production with quan-tities exceeding 100,000 units per month.
The company had a frequency response analyzer inhouse, ready for evaluation. But, like many of us, theengineer was too wrapped up in the production detailsto take loop gain measurements.
Finally, he was persuaded to do a quick test with theanalyzer on this latest product. Reluctantly, he did, tak-ing a couple of hours out of his schedule.
Figure 11a: Predicted and measured power supply loopgains using manufacturer’s data for capacitor ESR. Over 50 degrees phase error!
Figure 11b: Same measured loop gain as Fig. 11a, but predicted loop gain using measured values of capacitor ESR (30 times lower).
9©Copyright 2006 Switching Power Magazine
Measuring Frequency Response.qxp 8/7/2006 4:33 PM Page 9

susceptibility are all important meas-ures of system performance. Thequestion is often asked of us–can you measure this?
The answer is usually the same: Wecan measure anything, if you can perturb it enough togive us something to measure. And that is not always aneasy task, frequently requiring custom test circuits toinject into your power stage.
For example, we were recently asked if we could meas-ure the impedance of the input connections to a powersupply. The problem was that the input bus was at 300V, and there was 700 A flowing into the power supply.Yes, it can be measured. Putting a signal into the systemin order to make the measurement is much more diffi-cult.
There is no standard, off-the-shelf equipment for doingthis type of function. Over the years, engineers havecreated their own perturbation circuits, and we havesome favorites of our own. Figure 12 shows a few sim-ple test circuits that can be used for measuring outputimpedance at different power levels. Figure 13 shows atest circuit for injecting a test signal into the input bus
To his amazement, the power supply was almost unsta-ble, with only 35 degrees of phase margin at the select-ed nominal operating point– 50 degrees lower thanexpected. The production release was delayed for a dayto correct the problem.
The model the engineer was using was fine, and all thevalues corresponded to the manufacturer’s data for thepassive components. And that’s where the problem lay–the wrong value of ESR for the output capacitor wasbeing used. It was correct according to the data sheets,which called out a maximum value of 7.5 ohms for atantalum capacitor. The real value of the ESR was only0.25 ohms, which is a factor of 30 lower than the pub-lished maximum! This corresponded to a change in gainof 30 dB at higher frequency. And, since we often cross acontrol loop over in the region where the output capaci-tors are resistive, the whole loop gain was depending onthis value.
A refinement to the model values confirmed the meas-ured loop gain, and the need to add a couple of addi-tional compensation components to the board. Cost tothe program was only a few hours engineering time,and the changes were incorporated in the final produc-tion board run the next day. The savings in potentialproduct recall and re-engineer-ing were substantial.
This example is more the normthan the exception. We are sur-prised when measuring theloop. That’s one of the keyreasons that this stepremains a critical part of ourindustry.
Other TransferFunctionMeasurementsThere are many more quantitiesthat can be measured in apower supply. Input impedance,output impedance, and audio-
Fig 12a: Low-Power Output Impedance Measurement (<100 W)
Fig 12b: High-Power Output Impedance Measurement (>100 W)
10©Copyright 2006 Switching Power Magazine
Measuring Frequency Response.qxp 8/7/2006 4:33 PM Page 10

of a power supply in order to make either input imped-ance or audiosusceptibility (input-to-output transferfunction) measurements. This test is the most invasiveof all the frequency response measurements since youmust cut into the main power bus.
This test brings up the problem of how to interfacethe measurement channels to high-power and high-voltage circuits.
All frequency response analyzers have limitations ofvoltage that can be applied to their input terminals, andcare must be taken to protect them. In the early days ofmeasurements, Dr. Middlebrook taught us the neat trickof buffering the signals with an oscilloscope if theywere too high or not ground referenced, but it is becom-ing harder to find scopes that still provide the analogoutput signal. Fortunately, battery-powered differentialisolation probes are readily available to solve this prob-lem. These provide complete isolation for the input
channels up to 1000 VAC, both common and differen-tial mode. The probes are used extensively by instrumentmakers, and can measure accurately to 20 MHz.
The Future: Digitally ControlledPower SystemsAs we mentioned in the last issue of SPM, it is nolonger a question of whether digital controllers willdominate the world of power supplies, but when. Thisview was reinforced by the recent APEC 2002 confer-ence where several companies and universityresearchers presented viable controllers serving all thefunctions of the PWM controller, including the pulse-width modulator itself.
This gives rise to the following questions:Will we need to continue to make analog loop gainmeasurements in the future? Why can’t the embeddedprocessor measure its’ own loop? These are good questions, and there are several impor-tant reasons why analog loop measurement will remaina part of our industry for many years to come.
Firstly, it takes far too much circuitry and processingpower to inject, filter, process, and measure the equiva-lent of an analog loop with an imbedded processor. Themicroprocessor would have to fill the entire function ofthe frequency response analyzer to do this. That simplydoesn’t make sense. The hardware and software neededwould burden the cost of the power system.
So why can’t the processor measure the system, andwork strictly in the digital control, or z-domain? Themain reason for this goes back to the starting topic ofthis article– the very large separation of time constantsin a switching power supply. The new digital processorscan sample the power supply states very rapidly, but westill have a low pass filter in the power system– the fundamental building block of the PWM converter.Some of the states can be moved rapidly from one cycleto the next, such as controller states and inductor cur-rent, for example. But other filter states, such as theoutput capacitor, barely move from one cycle to thenext, even under maximum drive.
Fig 13: Input Injection for Audiosusceptibility and InputImpedance Measurements
11©Copyright 2006 Switching Power Magazine
Measuring Frequency Response.qxp 8/7/2006 4:33 PM Page 11

This leads to discrete time poles of the system that clus-ter just inside the +1 point of the unit circle. It isextremely difficult to design such a system in the discretetime domain, and it is also numerically unstable toattempt to measure the poles with sufficient accuracy topredict the slow-moving transients of the power systems.
This effect has long been known. Computer-controlledsystems have been with us for decades in other indus-tries. Chemical processes, and other industrial processesare frequently controlled by microprocessors, but theslow-moving process is measured and compensatedwith analog means.
In summary, measurement of control loops and compo-nents with a frequency response analyzer is an integralpart of developing power supplies. Learning the tech-niques and skills in this article will help you designyour power systems faster and better. And frequencyresponse analyzers are now affordable, easy-to-use, andvery powerful.
12©Copyright 2006 Switching Power Magazine
Measuring Frequency Response.qxp 8/7/2006 4:33 PM Page 12