Measuring Food Policy Research Capacity
52
IFPRI Discussion Paper 01263 April 2013 Measuring Food Policy Research Capacity Indicators and Typologies Suresh Chandra Babu Paul Dorosh Partnership, Impact and Capacity Strengthening Unit Development Strategy and Governance Division
Transcript of Measuring Food Policy Research Capacity

IFPRI Discussion Paper 01263
April 2013
Measuring Food Policy Research Capacity
Indicators and Typologies
Suresh Chandra Babu
Paul Dorosh
Partnership, Impact and Capacity Strengthening Unit
Development Strategy and Governance Division

INTERNATIONAL FOOD POLICY RESEARCH INSTITUTE
The International Food Policy Research Institute (IFPRI) was established in 1975 to identify and analyze
national and international strategies and policies for meeting the food needs of the developing world on a
sustainable basis, with particular emphasis on low-income countries and on the poorer groups in those
countries. IFPRI is a member of the CGIAR Consortium.
PARTNERS AND CONTRIBUTORS
IFPRI gratefully acknowledges the generous unrestricted funding from Australia, Canada, China,
Denmark, Finland, France, Germany, India, Ireland, Italy, Japan, the Netherlands, Norway, the
Philippines, South Africa, Sweden, Switzerland, the United Kingdom, the United States, and the World
Bank.
AUTHORS
Suresh Chanda Babu, International Food Policy Research Institute
Senior Research Fellow, Partnership, Impact and Capacity Strengthening Unit
Paul Dorosh, International Food Policy Research Institute
Division Director, Development Strategy and Governance Division
Notices
IFPRI Discussion Papers contain preliminary material and research results. They have been peer reviewed, but have not been subject to a formal external review via IFPRI’s Publications Review Committee. They are circulated in order to stimulate discussion and critical comment; any opinions expressed are those of the author(s) and do not necessarily reflect the policies or opinions of IFPRI.
Copyright 2013 International Food Policy Research Institute. All rights reserved. Sections of this material may be reproduced for personal and not-for-profit use without the express written permission of but with acknowledgment to IFPRI. To reproduce the material contained herein for profit or commercial use requires express written permission. To obtain permission, contact the Communications Division at [email protected].

iii
Contents
Abstract v
Acknowledgments vi
1. Introduction 1
2. Literature Review 3
3. Conceptual Framework 9
4. Food Policy Capacity Index 17
5. Results 24
6. Analysis 28
7. Discussion 37
8. Concluding Remarks 41
References 42

iv
Tables
3.1—Assessment of country capacity to create, maintain, and effectively utilize human capacity for
food policy research 15
3.2—A typology of capacity to create, maintain, and effectively utilize human capacity for food
policy research 16
4.1—Food policy research capacity indicators, 2011 21
5.1—Food policy research capacity index, 2011 24
6.1—Country index and typology scores 29
Figures
3.1—The six stages of the policy process 10
3.2—The players of the policy process 10
3.3—Production-function approach to measuring food policy capacity 11
3.4—Stages of the food policymaking process and potential measures of the relevant capacity in each
stage 12
5.1—Global Hunger Index and the Food Policy Research Capacity Index 25
5.2—Global Food Security Index and the Food Policy Research Capacity Index 26
6.1—Capacity transformation for agricultural transformation 31
6.2—Gross domestic product (GDP) per capita and agriculture value added per worker, 2011 Food
Policy Research Capacity Index countries 32
6.3—Gross domestic product (GDP) per capita and agriculture value added per worker, expanded
dataset 2011 33
6.4a—Food Policy Research Capacity Index and agriculture value added per worker, disaggregated
by number of researchers per million rural residents 34
6.4b—Food Policy Research Capacity Index and agriculture value added per worker, disaggregated
by number of publications per researcher 34
6.4c—Food Policy Research Capacity Index and agriculture value added per worker, disaggregated
by deviation from mean of government effectiveness 35

v
ABSTRACT
Addressing emerging global poverty, hunger, and malnutrition challenges requires prudent evidence-
based policymaking at the country level. Capacity for generating evidence remains a major constraint in
the policy process in developing countries. We surveyed 30 countries to measure the capacity of their
individuals, organizations, and policy process system to undertake food and agricultural policy research.
Our Food Policy Research Capacity Index, constructed using measures of human capacity (PhD full-time
equivalent researchers per million rural residents), human capacity productivity (publications per PhD
full-time equivalent researcher), and strength of institutions (the government effectiveness pillar of the
Worldwide Governance Indicators), showed substantial variation across countries, with the Republic of
South Africa, Colombia, and Ghana scored far higher than countries with similarly sized rural populations
such as Liberia, Laos, Burundi, and Afghanistan. Initial analysis showed that the index is strongly
positively correlated with the Global Food Security Index and negatively correlated with the Global
Hunger Index. Further work is planned to refine the indicators, particularly with regard to the effects of
country size (population) and quality of the underlying data.
Keywords: capacity indicators, Food Policy Research Capacity Index, country typologies

vi
ACKNOWLEDGMENTS
The authors thank Shenggen Fan, Director General of IFPRI for initiating the study and Margaret
McMillan, Catherine Ragasa and Regina Birner for the initial discussion on the capacity indicators. Data
reported in this paper was a collective effort of several in-country collaborators. We thank them for their
collaboration and for providing insights on the food policy research capacity of their countries. Gershon
Feder provided feedback on the indicator collected. Nilam Prasai and Sylvia Blom provided research
assistance in compiling the data and preparing the paper. We alone are responsible for the contents of this
paper.

1
1. INTRODUCTION
The world food system is facing a new set of challenges. The policy issues that confront us on global,
regional, and local levels range from high food prices and climate change to biodiversity loss and water
scarcity (FAO 2012). Their nature and magnitude necessitate a renewed focus on localized research and
policymaking in the developing world, where such issues exacerbate the problems of food insecurity and
poor economic growth (IFPRI 2012a). Despite massive investments by donors and developed countries
into food and agricultural research and food assistance programs, low-level in-country capacity continues
to thwart the design of relevant, evidence-based policies and the implementation of country-led and
country-owned programs.
In the past three decades, discussion has increased regarding evidence-based policymaking in an
attempt to replace “ideologically-driven politics with rational decision making” (Sutcliffe and Court
2005). The definition of evidence-based policymaking is still evolving in the literature and can refer to the
use of pilot program evaluations conducted by governments or research conducted by independent,
politically neutral organizations to inform policy (Marston and Watts 2003). In general, it refers to the
transformation of a policy process to a more systematic, rational, decision-making approach to designing
policy. However, evidence-based policymaking is dependent on both supply, the capacity of countries to
undertake high-quality evidence generation that is relevant to policymakers and conducted in a
transparent manner, and demand, the capacity of policymakers to acknowledge the importance of such
evidence to inform policymaking and to allocate sufficient resources for evidence-generation activities.
The centrality of the agricultural sector in developing-country economies, and the dependency on
agriculture of up to 80 percent of developing-country populations, reinforce the need for strong state
capacity in the agricultural sector (World Bank 2008). Kydd (2009) points out the paradox that state
failure is most prevalent in the early stages of development, when it is needed the most. Kherallah et al.
(2000) offer three arguments for weak agricultural development: (1) overintervention or arbitrary
intervention in the markets; (2) declines in public investment in research, extension, and infrastructure;
and (3) weak attention to policies that improve market coordination. All three arguments boil down to
weak state capacity, in particular, to weak policy research and policy formation capacity.
Local capacity is important to design policies that are highly context specific. This requires not
only building up technical and analytical skills but also enhancing the level of trust between
policymakers, politicians, constituents, researchers, and advocators as well as the credibility and
reputation of each of these players. As these factors improve, everyone’s incentives to enhance their own
contributions to the policymaking process will improve, thereby increasing ownership of policies and
programs.
Technical assistance and technical cooperation, well intentioned though they may be, can
undermine local capacity. When external efforts dominate local policy strategy and development, policies
are less likely to be appropriately designed for the local socioeconomic environment, and the ownership
of policies and programs deteriorates. Moreover, excessive reliance on external assistance causes
underinvestment in local capacity-strengthening activities and may cause a downward spiral of local
capacity and an increasing reliance on assistance. As such, strengthening the capacity of the partner
countries in terms of policymaking, implementation, and monitoring and evaluation is a key commitment
in the Paris Declaration on Aid Effectiveness (OECD 2005).
The development community spends an estimated US$20–$25 billion1 per year on capacity
development (Otoo, Agapitova, and Behrens 2009); however, it has not been able to enhance the
effectiveness of policy design and implementation at the local and national levels. Most of these efforts of
capacity development are fragmented and uncoordinated (Otoo, Agapitova, and Behrens 2009). Although
some capacities may have been enhanced by past interventions, the specific areas, levels, or stages of the
development processes that require further capacity development are not clear. An understanding of
where the capacity bottlenecks lie can help to maximize their return on investment in capacity building.
1 All dollar amounts are expressed in U.S. dollars. 2 Food policy and agricultural policy are used interchangeably here. 3 Organizations and institutions have often been used interchangeably in the literature; in this paper we use the term

2
Where and how do countries fall short in their capacity to conduct evidence-based food policy
research? Significant capacity constraints at individual, organizational, institutional, and policymaking
levels are faced by many developing countries, and these severely impede the effective research and
design of evidence-based policies. Furthermore, since individual, organizational, and institutional
capacities are codependent, should any one of them fall short, the whole process short circuits.
Little is known about what capacity is needed to design policies and programs, or how available
capacities can be effectively mobilized or strengthened to enhance the policymaking process. The
importance of measuring public-sector capacity to assess the ability of countries to research, develop, and
implement policies in order to stimulate and sustain development has been recognized globally (Poulton
2006; Polidano 2000; World Bank 1997). However, efforts to measure and monitor policy research
capacity remain in infancy. The intention of this study is to conduct a preliminary assessment of the
existing food policy research capacity of countries by identifying and measuring selective indicators and
typologies.
To date, there is no service assessment of policy research capacity within a country. Studies that
systematically look at capacity constraints and bottlenecks in development and policy processes within a
country are limited. Development of a multicountry database that measures and classifies various
countries in terms of their capacity for research and policymaking in food and agriculture would facilitate
an assessment and comparison of in-country policy research capacities.
Capacity assessments for the purpose of enhancing development efforts are a major challenge;
they involve assessing a number of different sectors, organizations, and individuals as well as the
interactions between them. Our focus is food policy2 research capacity, defined here as the ability of a
country—including its policy process system, organizations, and individuals—to support and undertake
socioeconomic or policy-related research in the food, agriculture, and natural resource sectors. These
sectors include a wide range of subsectors from input (fertilizer, seeds, machinery) markets, storage and
distribution, transportation, marketing, and export markets, to research and development, extension, and
community development. We address the capacity to conduct policy-oriented research in these
subdomains—not technical agricultural research, which is covered by other data sources (such as IFPRI’s
Agricultural Science & Technology Indicators).
The motivation for developing the Food Policy Research Capacity Index (FPRCI) stems from a
pressing need to understand a country’s primary constraints to undertake food policy research and for that
research to be effectively used in the policymaking process. Given the centrality of the agricultural sector
in developing-country economies and development strategies, as well as the high prevalence of food
insecurity, malnutrition, and hunger, a focus on the food policy system could provide widely impactful
insights. The FPRCI was conceived as a first step in evaluating the level of a country’s current food
policy research capacity and to be able to compare these levels of capacity longitudinally and cross-
sectionally. This will have a three-fold benefit of sensitizing domestic policymakers to the importance of
various components of food policy research, of allowing donors to set priorities for interventions across
countries, and lastly, of identifying the specific areas of capacity in which to invest to maximize returns.
More specifically, the FPRCI will provide insights as to which countries to invest in, how much to invest
(based on their capacity shortcomings) at each level of capacity, and how to combine capacity-
strengthening investments at the system, organizational, and individual levels.
Within this context, the intention of this paper is to identify and collect data on a set of indicators
that could be combined to form an index that is theoretically justified, simply constructed, empirically
meaningful, and practically useful. The rest of the paper is set up as follows: Section 2 reviews the
literature on policy process capacity and on capacity and development indexes. Section 3 presents two
conceptual frameworks—the first discusses food policy research within the policy process and the second
assesses a country’s investments in the formation, maintenance, and effective utilization of human
capacity. Section 4 describes our food policy research capacity indicators, details the data collection
methodology, and presents our food policy research capacity index. The results of our index construction,
along with our robustness checks and comparisons to other indexes, are presented in Section 5. The
analysis follows in Section 6, the discussion is presented in Section 7, and Section 8 concludes.
2 Food policy and agricultural policy are used interchangeably here.
3
2. LITERATURE REVIEW
The primary objective of capacity-strengthening efforts is to enable developing countries to take on the
roles that development and technical agencies and bilateral partners currently perform; however, the ideal
process to achieve this is unclear. Definitions of capacity vary from organization to organization and from
country to country, and hence assessments of capacity and capacity-building initiatives vary immensely as
well. This is due in part to the complexity of the issue of capacity; the multitude of factors that affect it
and that it affects; a country’s individual social, economic, historical, and environmental characteristics
that contribute to or hinder capacity building at different levels; and the stage of development that a
country is in, necessitating individualized, country-specific capacity-strengthening strategies and action
plans. However, some trends in capacity assessments have emerged over the years, which provide us with
a starting point for defining capacity and identifying the best indicators of policy process capacity. We
start with a discussion of the different types of capacity and their interactions, and then review indicators
and indexes that assess different types of capacity or development progress.
Capacity for Public Policy Research
The subjective nature of capacity has resulted in a variety of definitions and assessment techniques.
Capacity, in the context of public-sector management, generally refers to the “ability of an organization to
act effectively on a sustained basis in pursuit of its objectives” (Polidano 2000). The United Nations
Development Programme (UNDP) defines capacity as “the ability of individuals, institutions, and
societies to perform functions, solve problems, and set and achieve objectives in a sustainable manner”
(UNDP 2010, 2). It measures capacity development through the transformation of inputs such as human,
financial, and physical resources as well as competencies in four outputs: institutional arrangements,
leadership, knowledge, and accountability. The European Centre for Development Policy Management 5-
C approach describes capacity as the intersection of five core capabilities of organizations: capability to
commit and engage, capability to carry out tasks, capability to relate and attract resources and support,
capability to adapt and self-renew, and capability to balance diversity and coherence. It assesses
individual and system-level capacities through the lens of the organization (Baser and Morgan 2008). In
this paper, capacity is defined as the summation and interaction of the capabilities of the food policy
research system’s individuals and organizations, as well as the enabling environment that sets the
conditions and incentives for such interaction.
Various combinations of these capacities are used in different public-sector capacity assessments.
The African Capacity Building Foundation used a three-pronged approach of assessing individual,
organizational, and institutional capacities in the formation of their 2012 Africa Capacity Indicators
Report on agricultural transformation and food security (ACBF 2012). Similarly, in a chapter on national
innovative capacity in the 2001-2002 Global Competitiveness Report, Porter and Stern (2002, 107) notes
that “national innovative capacity depends in part on the technological sophistication and the size of the
scientific and technical labor force in a given economy, and it also reflects the array of investments and
policy choices of the government and private sector.” In other words, it is the combination of individual
skills and the way that the public and private sectors are managed.
Individual capacity consists of the aggregate skills and qualifications of a population and reflects
the capability of individuals to engage in a specific type of work. Educational attainment is frequently
used to proxy for individual capacity and is commonly used in indexes that measure technological and
innovation achievements (for example, the United Nations’ Technology Achievement Index, the National
Innovative Capacity index, and the Knowledge Economy Index). Akin to needing a certain level of
knowledge in order to make substantial contributions to science or technological fields, individuals within
the policy realm must also reach a minimum level of capacity to effectively engage in policy analysis and
discussions. Poor understanding of the issues or weak analytical ability will either restrain certain players
from participating effectively or result in overly simplistic solutions being passed through.

4
Organizational capacity reflects the ability of organizations to attract, retain, and effectively
utilize their amassed individual capacity; to set clear objectives; and to efficiently allocate resources so
that their objectives can be met. Some elements of organizational capacity can be measured by employee
retention rates, incentive structures, or output per individual, although it is difficult to obtain a
comprehensive picture of organizational capacity by one measure alone. The UNDP measures capacity
development progress using three measures: performance, stability, and adaptability. Performance refers
to the effectiveness of the organization in its ability to meet its objectives and the efficiency in which it
does so. The stability of an organization can be seen from its institutionalization and sustainment of
performance improvements and the risk-mitigation measures it has taken. An organization’s adaptability
to the environment in which it operates is reflected in the investments it makes for improvement and its
follow-through on those investments (UNDP 2010).
The interactions of individuals and organizations within the policymaking system depend on the
institutions that govern the system, which is also referred to as the enabling environment. North (1991,
97) defines institutions3 as “the humanly devised constraints that structure political, economic, and social
interactions.” Proper institutions foster the relationships between players in the research, analysis, and
policy processes. This includes both formal and informal institutions at the household, community,
regional, and national levels as well as the political environment of a country.
Within this definition of the enabling environment, it is important to distinguish between the
political economy of a country and the policy process system itself. Political economics dictate the way in
which players interact with each other within the policy process. The policy process refers to the
pathways through which a policy issue is introduced or reintroduced, discussed, researched, and analyzed
and how policy changes are implemented, monitored, and evaluated.
Richerzhagen and Scholz (2007) refer to the creation of an enabling environment as systemic
capacity4, which the UNDP (2010, 9) defines as being structured by the “policy, economic, regulatory,
and accountability frameworks within which individuals and organizations operate,” and includes the
mandates of organizations and their formal and informal interactions among one another. Richerzhagen
and Scholz suggest that there are three parts of systemic capacity: economic-technical, political-
institutional, and cognitive-informational. The first two dimensions are contained within North’s
definition of institutions, but the third dimension suggests that systemic capacity is also dependent on the
existence of information or data and public perceptions about the issues under discussion. Richerzhagen
and Scholz also emphasize that sectoral capacity is dependent on government effectiveness, which in turn
is dependent on policy coordination, rule of law, and control of corruption. This differs from the political-
institutional dimension of systemic capacity in that the latter refers to the structural arrangements,
procedures, and activities of public administrative bodies and any relevant laws and regulations.
Both institutions and human (individual) capacity have been carefully scrutinized in the literature
for their causal effect on economic growth. Acemoglu, Johnson, and Robinson (2002) argue that
European colonial powers shaped the institutions of African nations 500 years ago, which dictated
countries’ current relative levels of wealth. However, Glaeser et al. (2004) argue that the instruments used
in this paper were unsuitable and find evidence suggesting that human capital5 is a stronger predictor of
growth. Acemoglu and Dell (2010) find similar evidence of both human capital and institutions
influencing between-country and between-municipality income differences in the Americas. Human
capital is a much easier concept to measure, facilitating more rigorous analysis, whereas analyses of
institutional effects on growth will always be thwarted by a lack of objective data. Human capital is also
3 Organizations and institutions have often been used interchangeably in the literature; in this paper we use the term
organizations to refer to a coordinated group of individuals and institutions to refer to a society’s norms, rules, and customs as
defined by North (1991). 4 In this paper, we use the term systemic capacity and enabling environment interchangeably to refer to North’s (1991)
definition of institutions. 5 Human capital is a component of human capacity, where human capital refers to the skillset or educational achievement of
a populace, and human capacity refers to the broader ability of a population to use and adapt their skills to adapt to changing
environments and identify opportunities for growth and development.
5
much less variable than institutions in both the short and long run; institutions can fluctuate for a variety
of reasons, whereas human capital degrades or improves as generations pass on. Even so, South Korea
and China exemplify how political institutions can play a key role in stimulating economic growth.
Despite promoting the evidence that human capital is the predominant predictor of growth, Shleifer
(2012) iterates the importance of institutions in political cycles, the financial sector, the judiciary system,
and other public systems; and he acknowledges that the difficulty in measuring institutions should not
exclude them from economic growth analyses.
Organizational capacity in the public sector is arguably more difficult to monitor than institutions,
although there is a host of literature on organizational capacity within firms and its relationship with
profitability (Armour and Teece 1978; Chandler 1992; Covin and Slevin 1991). While all three types of
capacity (individual, organizational, and systemic) have been assessed in the literature with regard to
long-term growth, only limited research exists on the way in which these capacities affect the functioning
of the policy process and the channels through which they do so, particularly in the context of
agricultural-sector growth. A more thorough understanding of these capacities in the context of food
policy processes in developing countries and how and where weak capacities are restricting the
functioning of the policy process is essential to determining how and where to concentrate capacity-
strengthening efforts.
Efforts from both researchers and development agencies to pinpoint the key aspects of capacity in
the context of public-sector management have yielded differing approaches to capacity strengthening;
however, a convergence to the tridimensional definition of systemwide capacity is evident in terms of
individual, organizational, and institutional capacities. Measurements of these dimensions of capacity,
however, vary widely due to choice of indicator and valuation technique. Moreover, the importance of the
different aspects of capacity will vary depending on the context. For example, the availability of
laboratory supplies affects technical research capacity more than it would policy research capacity. This
has yielded a variety of indicators and indexes that rank or score the capacity of various sectors or
dimensions of an economy, government, or society.
Capacity and Development Indicators and Indexes
Although no food or agricultural policy research capacity indexes exist to our knowledge, indicators and
assessments of technical agricultural research capacity and policymaking capacity in general do exist. The
Agricultural Science and Technology Indicators (ASTI) initiative, facilitated by IFPRI, reports technical
agricultural research indicators including spending on research and development and number of full-time
equivalent researchers. The Statistics on Public Expenditure for Economic Development data reports
agricultural public expenditure for economic development and the ratio of this expenditure to agricultural
gross domestic product (GDP). Another indicator, loosely indicative of agricultural policy capacity, is
agricultural total factor productivity (TFP). It is suggested that a high agricultural TFP may indicate
strong agricultural policies through its valuation of the efficiency of input use (IFPRI 2012a). Josling and
Valdes (2004) suggest possible quantitative agricultural policy indicators: rate of protection, rate of
assistance, and producer subsidy equivalent. Such indicators, while having the advantage of being
objective, are dependent on a country’s growing environment, input and output markets, availability of
technology, and other factors, and hence serve better as longitudinal comparison indicators within a
country than as cross-sectional comparators.
Objective indicators of policy capacity are sparse primarily because of the subjective nature of
capacity. However, Delpeuch and Poulton (2011) suggest a quantitative approach, measuring state
capacity as a function of resources (for example, research staff or budget) and incentives (wage rates or
divergence between budgeted and actual research expenditures). As food policy research is usually a
subsection of agricultural or economics research and hence these share overhead costs and resources, the
precise expenditure allocated specifically to food policy research is difficult to parse. KPMG and the
Overseas Development Institute (ODI) argue the case for a capability index that measures states’ abilities
to manage change. They suggest measuring three pillars—economic capabilities, governance and

6
institutional capabilities, and social capabilities—but do not offer indicators for these pillars (KPMG and
ODI 2012). USAID (2000) uses questionnaires and scorecards that ask organizations to self-report their
ability to fulfill their mission, retain staff, provide adequate compensation, train staff, and implement
transparent and democratic processes to elect board members to assess their organizational capacity.
USAID acknowledges that this strategy does not yield cross-sectionally comparable data, but it can be
used for longitudinal assessments, which are important for government entities such as federal ministries
of agriculture.
Development Indexes: A Review
A plethora of indexes has been created in the last few decades in an attempt to measure and compare
advancements in science and technology, levels of governance, public-sector capacity and corruption,
poverty, economic development, and other qualitative concepts; however, the quality of these indexes
varies as widely as the indexes themselves. These indexes tend to be mash-up indexes (Ravallion 2010),
composed of indicators of the constructor’s choosing, which are also aggregated as the constructor sees
fit. Herein lies the problem of the credibility of an index and, as Ravallion (2010) notes, necessitates
transparency in the conceptual intention of the index, in the trade-offs made in its construction, in data
collection methods and data quality, and in aggregation methodology, as well as a comprehensive analysis
of the index’s robustness.
Perhaps the most commonly referenced index in development is the Human Development Index
(HDI), constructed with the intention of generating a single statistic “to serve as a frame of reference for
both social and economic development” (UNDP 2012). It has three dimensions: health, proxied by life
expectancy at birth; education, proxied by mean years of schooling and expected years of schooling; and
living standards, proxied by gross national income per capita. Each indicator is normalized using goal-
posted minimum and maximum values, and the index is aggregated by geometric averaging. Prior to
2010, the index was composited by arithmetic mean, which implied direct substitutability of its
components, an assumption not thought to be robust in the case of the HDI, resulting in the change to
geometric averaging in 2010. Although the HDI has served well to bring a voice to the social aspect of
development, a number of criticisms have emerged on the grounds of data quality (Wolff, Chong, and
Auffhammer 2011), choice of indicators and goal posts (Caplan 2009), and its inability to allow for
intertemporal comparisons (McGillivray 2006).6
Subjective though the choice of indicators may be, the use of hard data in the HDI has contributed
to its continued acceptance and recognition as a general indicator of progress. The HDI, however, does
not necessarily reflect a country’s capacity to contribute to economic and social progress, as the HDI does
not differentiate between contributions to progress initiated by the country itself or through foreign
assistance. Transparency International’s Corruption Perceptions Index (CPI), the World Bank’s Country
Policy and Institutional Assessment (CPIA), and the World Bank’s Worldwide Governance Indicators
(WGI) have attempted to gauge a country’s institutional and public-sector capacity to both actively
engage in the policy process and successfully implement policy changes and resulting programs or
projects. These indexes are primarily constructed from soft data—surveys of individuals’, firms’, or
organizations’ opinions or subjective assessments by experts in the field. Extensive use of soft data
decreases the reliability of an index; however, the nature of governance, institutions, and public-sector
capacity does not allow for the sole use of hard data, and thus a balance must be sought (Polidano 2000).
The CPI is a well-established country ranking that assesses both administrative and political
aspects of corruption in the public sector using surveys from 13 institutions. Because of the subjectivity of
corruption, country scores are the rescaled rankings of countries on specific factors related to
transparency, accountability, and corruption. Although this allows for cross-country comparisons in a
6 Intertemporal comparisons are a problem for this index because some components are calculated relative to the minimum
or maximum levels of the underlying variable for other countries for that year. Because the minimum and maximum values
change each year, an increase in a country’s relative score from year to year may occur even when the absolute level of the
underlying variable declines or is unchanged.

7
specific year, it does not allow for longitudinal comparisons of countries (Transparency International
2011). Regardless, the media attention given to the CPI has increased discussions about public-sector
corruption, particularly in developing countries where the potential returns to public-sector investment are
the highest.
The CPIA was initiated by the World Bank in the 1970s as a tool to allocate funds where they
may be most effectively used. It attempts to “measure the extent to which a country’s policy and
institutional framework supports sustainable growth and poverty reduction” (World Bank 2007, 260)
through 16 criteria rated on a scale of 1 to 6 and grouped into four equally weighted clusters: economic
management, structural policies, policies for social inclusion and social equity, and public-sector
management and institutions. Criticisms of the CPIA are similar to those of subjective indexes in general,
such as choice of indicators and their weightings, and assessment methodology (IEG 2009). An
assessment commissioned by two German ministries added more specific criticisms to this list, including
the lack of attention given to education, poverty reduction, and environmental issues (Steets 2008).
The WGI measure six categories of governance: voice and accountability, political stability and
absence of violence, government effectiveness, regulatory quality, rule of law, and control of corruption.
For their calculation, the World Bank draws on data from 30 different sources, rescales the data within the
data range, and then aggregates the indicators into the six dimensions using an unobserved components
model. This methodology assumes the data to be a linear function of an unobserved level of governance,
which corrects for the noncomparability of the various data used and weights highly correlated data
sources more heavily. The dimensions are reported as units of a standard normal distribution, with an
error term that reflects the relative number of data sources used, which must be taken into account when
analyzing countries longitudinally and cross-sectionally (Kaufmann, Kraay, and Mastruzzi 2010).
The World Bank, in collaboration with the International Finance Corporation, also assesses
countries on their private-sector regulations through their Ease of Doing Business Index (EDB). EDB
uses standardized case studies to measure 11 quantitative indicators of four aspects of doing business—
starting a business, expanding a business, the operations of a business, and insolvency—in 183
economies. It focuses on understanding regulations and policies as they apply to small and medium-sized
enterprises in an attempt to gauge the extent to which a government stimulates private-sector growth
through the entrepreneurial activities of its lowest income earners. Following trial constructions of the
index using such methods as principal components and unobserved components, it was determined that
rankings were robust to different construction types; and hence the simplest method—arithmetic average
of equally weighted pillars composed of equally weighted components—was used (World Bank and IFC
2012).
In addition to the HDI, a number of indexes reflecting development outcomes have been
constructed, including two complementary indexes that reflect a country’s food security: the Economist
Intelligence Unit’s Global Food Security Index (GFSI) and IFPRI’s Global Hunger Index (GHI). The
GFSI is constructed from 25 indicators of drivers of food security within the categories of affordability,
accessibility, and quality and safety (Economist Intelligence Unit 2012), whereas the GHI is the
arithmetic average of three indicators of food insecurity in a country: proportion of the population that is
undernourished, prevalence of underweight in children under age five, and proportion of children dying
before the age of five (IFPRI 2012b).
IFPRI’s Women Empowerment in Agriculture Index (WEAI) is one of the newest development
indexes, developed to monitor the impact of the U.S. Feed the Future7 interventions on women’s
empowerment. The WEAI is the first attempt to assess women’s empowerment in the field of agriculture,
which will serve to augment discussions on both agricultural development and gender equality (IFPRI
2012c). It is an index constructed from two subindexes; the first measures women’s empowerment in their
households and communities across five domains (production, resources, income, leadership, and time),
and the second assesses gender parity at the household level, based on the five domains of empowerment.
The first subindex is calculated using the Alkire-Foster measurement method of multidimensional
7 Feed the Future is the U.S. government’s global hunger and food security initiative.

8
poverty, which accounts for both the incidence and the intensity of poverty. The intensity is determined
by the number of deprivations an individual or household suffers, which indicates the extent to which
people are impoverished and in which regard.
Although the methodologies for index conceptualization, data collection, and index construction
vary widely across indexes, several trends are clear across indexes that have sustained the test of time.
First, the indexes have all been carefully conceptualized by teams of in-house experts in consultation with
external experts for additional verification. Several have requested formal assessments, and most update
previously published indexes as new data become available. Following such external assessments, the
UNDP changed its methodology after 20 years from arithmetic averaging to geometric averaging.
Second, data sources have been scoured for validity and quality and are either updated or expanded upon
each index update. Third, the index constructions have been carefully selected based on their robustness,
interpretability, and applicability. The transparency of these discussions, in addition to the transparency of
the methodology itself, lends to the overall validity of these indexes.
Understanding why countries end up with different rankings on such indexes has led to the
development of a number of typology assessments. Yu, You, and Fan (2010), concerned about how to
assist developing countries affected by the recent food and financial crises, categorized countries into five
levels of food security based on their status of trade security (secure or insecure), level of food
production, soil fertility, and favorability of their climate. Their results suggest that developing countries
is too vague a classification in terms of food security and that external interventions need to be
individualized to country-specific conditions. Zhang, Rockmore, and Chamberlin (2007) classify
countries in Africa South of the Sahara (SSA) by their risk related to agriculture in attempts to determine
how to target investment in agricultural development, which they argue is essential to improving the
socioeconomic status of SSA countries. They determine each country’s level of agricultural risk by its
rainfall and growth period, and they differentiate each country within each level by its resource
endowment and adjacency to a coast.
We used the aforementioned literature on capacity, indicators, indexes, and typologies to develop
two frameworks to analyze food policy research capacity and assess the relevancy of our selected food
policy research capacity indicators.

9
3. CONCEPTUAL FRAMEWORK
Understanding the capacity to undertake food policy research requires an understanding of the food
policymaking process itself as well as an understanding of a country’s commitment to building the
capacity of the policymaking process. We first explore the policy process in general, to determine how
and where research capacity comes into play and who affects the demand and supply of research for
policymaking. We broaden the scope to understand the potential implications of a strong research
capacity on livelihoods and well-being, given the existence of other relevant capacities, and then narrow
our focus to identify the specific dimensions of food policymaking to identify tractable indicators.
Our second conceptual focus aims to understand the formation and maintenance of human
(individual) capacity. We look at the three dimensions of capacity (individual, organizational, and
systemic) and examine the effect of formal and informal institutions and organizational capacity of a
country’s government on human capacity formation, management, and utilization. Understanding how
organizations and institutions affect individual capacity will further shed light on how and where to
prioritize capacity-strengthening investments within a country. From this framework we develop country
typologies based on past investments in individual capacity so as to understand why countries have fared
the way they have.
Food Policymaking Process
Prior to assessing the food policy research process and the myriad of complexities this introduces due to
its cross-sectoral nature, we must assess the policymaking process to understand how and where policy
research capacity comes into play. This requires an overview of the policy process cycle, its stages, and
potential short-circuit sites; the players and actors involved, their relationships with each other, and their
interactions within the policy process system; and the capacity required at all levels for the system to
function productively. This understanding will aid in indicating appropriate indicators of food policy
research capacity.
The policy process can be thought of, at its simplest, as a six-stage cycle with a one-directional
feedback loop, and at its most complex, as a cycle with feedback loops between all stages and short-
circuit opportunities at and between every stage. Figure 3.1 depicts the former cycle in its simplest form,
which commences with problem identification and policy-agenda setting and then cycles in turn through
the stages of policy analysis formulation, policy decisionmaking, policy implementation, monitoring and
evaluation, and policy revision, before returning to the stage of problem identification and policy-agenda
setting. In reality, the policy process is much more complex because of the myriad players involved, the
varying capacities of each of the players, the organizational capacities of the entities involved, and the
enabling environment. The process can be further complicated when multiple tiers of government are
involved, when the problem itself is viewed differently by different stakeholders and their incentives for
finding a solution are misaligned, or when different social or cultural groups within a country are affected
differently by the issue.

10
Figure 3.1—The six stages of the policy process
Source: Authors.
The various players in a policy process can be categorized into six groups: government officials,
agricultural research organizations, higher education institutes, policy think tanks, civil-society
organizations (CSOs), and the private sector (see Figure 3.2). These individuals and organizations come
together at various stages and with different purposes, and may also be involved in national task forces or
subject-specific research or advocacy groups composed of representatives from different sectors and
organizations. Each entity’s role within the policy process is formed by its individual and organizational
capacities, which are in turn influenced by factors ranging from its level and source of funding,
educational achievement and experience of its members, the structure of the entity, its interactions with
parent or sibling organizations, and the history of its formation.
Figure 3.2—The players of the policy process
Source: Authors.
Notes: CSO, civil-society organization; NGO, nongovernmental organization.
Problem identification
/Setting policy agenda
Policy analysis/
Formulation
Polic y decisionmaking
Policy implementation -
Polic y monitoring/
Impact assessment
Polic y revision/
Correction / abandonment
Food
policy
process
Food Policy
Research Capacity
Higher Education Institutes
Ministry
of Agriculture
Agricultural Research Institutes
Think Tanks
Private Sector
Local or International CSOs/
NGOs

11
The interactions between the players in a policy process will change as their individual and
organizational capacities change and as the sector in which they operate transforms. Theoretically, as the
policy process and its elements improve, it will lead to policy outcomes that yield improved agricultural
productivity and growth, which will in turn lead to improved capacities through increased demand for
such capacities, which will be facilitated by economic growth. Improved capacity will then continue to
facilitate stronger policymaking, and the cycle will continue. This hypothesis is expanded upon in
Section 6.
The intention of strengthening the policymaking process is to effect ground-level outcomes.
Because food and agriculture play such important roles economically and socially in developing
countries, well-implemented policies can have strong effects, positive or negative. Figure 3.3 presents a
production-function approach to illustrate the transformation of inputs to outputs to outcomes to impact,
where research capacity is affected by the provision of inputs and affects their translation into policy
outputs. The policymaking process, which generates the outcomes in the production function in Figure
3.3, is illustrated in detail in Figure 3.4, which outlines a modified, five-stage policymaking process in the
context of the food and agriculture sector and suggested indicators of capacity at each stage.
Figure 3.3—Production-function approach to measuring food policy capacity
Source: Authors.
Inputs
•Researchers
•Funding
•Physical resources
•Technology
Outputs
•Publications
•Conferences, meetings, and presentations
•Policy briefs, opinion pieces, articles
Outcomes
•New policies
•Modified policies
•Cancelation of irrelevant, inefficient, or ineffective policies
Impacts
•Change in citizens' well-being
•Agricultural growth
•Economic growth

12
Figure 3.4—Stages of the food policymaking process and potential measures of the relevant capacity in each stage
Generating Evidence
(Research and Analysis)
Designing Policies
Consultative and Political Process
Policy Implementation
Monitoring and Evaluation
Food Policymaking Process
Capacity Indicators (potential): -Research and development expenditure (ASTI) -Number of agricultural researchers as a ratio of the total population (ASTI) -Number of PhDs as a ratio of the total population
Capacity Indicators (potential): - Number of agriculture and food-related policies, laws, or bills passed in the last 5 years
Capacity Indicators (potential): - Corruption Perceptions Index 4(TI) -Level of Democracy/Autocracy Index -Media Freedom Index - Government effectiveness index - Measure of civil-society organizations’ involvement in policy process
Capacity Indicators (potential): - Number of technicians or extension workers as a ratio of total population - Density of INGOs and NGOs - Quality of civil service index - Implementation authority index - Operational efficiency index - Average public-sector salary or index on effectiveness of tax policies - Average waiting time in years for new telephone lines (WDI)
Capacity Indicators (potential): - Completeness of country’s data in international publications - Indicator of strength of statistical system
Policy Research
Capacity Index
Capacity Index for
Policy Design
Capacity Index for Consultative and
Political Processes
Implementation
Capacity Index
Source: Based on consultations with Catherine Ragasa and Regina Birner.
Food Policy Capacity Index
M&E
Capacity Index

13
Food policy research is defined here as any socioeconomic or policy-related research in the food,
agriculture, and natural resource sectors. The capacity to conduct such research that results in policy
impact requires the effective functioning and interacting of all three types of capacity: individual,
organizational, and systemic. CSOs and the private sector play a part in initiating the food and agriculture
policymaking process illustrated in Figure 3.4, by drawing policymakers’ attention to specific food and
agriculture issues. This creates demand for evidence, which characterizes the first stage. Higher education
institutes, agricultural research institutes, and think tanks play a substantial role here in supplying
unbiased evidence. Strong research capacity at these organizations is needed to be able to generate the
requisite information, while sufficient demand for this information and respect for and trust in its
suppliers and their methods are essential to ensuring that the research is used in the policymaking process.
A country’s ministry of agriculture (or equivalent organization) leads the second stage, drafting of
policies, based on the research produced in the first stage. This requires individual analytical capacity and
an environment that incentivizes efficient use of time and commitment to producing high-quality policy
strategies. However, high-quality policy strategies are not drafted in silos; they require consultations with
all relevant stakeholders. The third stage requires strong interpersonal skills from all players, as the
quality of policy documents requires that all perspectives are voiced and that these views are recognized
and respected by the policymakers. Researchers and analysts must communicate their research results,
and CSOs and private-sector representatives must deliver the opinions of the individuals and firms they
represent. A strong enabling environment is required to facilitate such consultative processes, and strong
capacities are needed from all players to be able to make substantial contributions to these dialogues.
The fourth stage involves the implementation of the policy, which requires overseeing capacity of
the ministry, an adequate number of trained extension workers, and cooperation with relevant CSOs and
the private sector. Organizational capacity of the ministry of agriculture is essential in this stage as it
involves vertical and horizontal information flows—the policy is signed into motion by the minister of
agriculture but its implementation will depend on how directives are passed from the top leadership ranks
down through the ministry and out to its extension and other implementation arms. Depending on the
implementing agency, it may also require strong organizational capacity of regional or subregional
departments of agriculture as well.
The final stage, often overlooked, is the monitoring and evaluation of the implemented policies.
Strong informal institutions within a government ensure that government officials take ownership of their
policies and monitor their progress to determine if the desired impact occurred. This ownership should
result in sufficient demand for organizations, governmental or nongovernmental, to undertake evaluations
and publish their data. This stage is essential for holding politicians and policymakers accountable for
their work. It also completes the policy process loop; the information gathered in this stage should be fed
back to policymakers to determine if policies should be continued, amended, or discarded.
This initiative focuses primarily on research capacity and its potential use in the policy process,
and hence aims to capture the active capacity of the first stage and the potential capacity of the second
and third stages. The difference between active and potential capacity is that the former is a measure of
the actual activity through the assessment of the outputs as a function of the inputs, whereas the latter
measures the inputs alone. The assessment of both inputs and outputs enables an analysis of the efficiency
of the inputted resources. This further indicates the quality of the research environment vis-à-vis the
implication that a high output-to-input ratio implies the existence of incentives encouraging the efficient
undertaking of research.
The next subsection takes an alternative look at policy research capacity by assessing the extent
to which conscious decisions are made about investments in one specific input—human capacity.

14
Country Typology
Although the Food Policy Research Capacity Index (FPRCI) can indicate the relative performance of
different countries and provide an overarching view of food policy research capacity in developing
countries, it does not explain why certain countries perform better than others, nor does it differentiate
between low-performing countries by the constraints that hinder their capacity development. The
typology presented here is intended to be a starting point to understand why some countries have stronger
food policy research capacities than others and to delineate the variables that contribute to the
development of adequate and effective research capacity that is sustained over time. It will also indicate
where to focus investments in capacity-strengthening efforts so as to make the largest impact.
A country’s individual and organizational capacities depend on its ability to develop, maintain,
and effectively utilize its human capacity, which in turn, depends on its investment choices and
governance effectiveness. A country must invest in the creation of human capacity to ensure its store of
researchers and analysts will be replenished, while an effective governing system should be in place to
ensure this human capacity is retained and used effectively. A country that invests in creation of human
capacity must either have a strong and accessible higher education system or provide incentives (through
scholarships or bursaries) to students who seek training abroad. A country can maintain its amassed
human capacity by ensuring that it has competitive salaries and optimal incentives to prevent brain drain
to the private sector or foreign soil. Lastly, the effective utilization of human capacity depends on
organizational factors such as sufficient support or resources to fulfill one’s job duties or the correct
incentives to ensure effective use of one’s time, and informal institutions such as personal motivation and
work ethic.
In this section, we classify countries into typologies based on their ability to create human
capacity, maintain human capacity, and effectively utilize human capacity. We have identified three
factors here for our typology framework to keep our analysis tractable, but we recognize that many others
also contribute to the development and sustainment of effective human capacity. Each country is
measured on a three-point scale (low, medium, or high) with regard to its capacity to create human
capacity, maintain human capacity, and effectively utilize human capacity for food policy research. The
scores are based on several sources of information. First, the country collaborators who conducted the
surveys of the food policy organizations contributed brief country summaries that identified issues,
constraints, and challenges to developing and managing food policy research capacity. Second, key local
informants were consulted to locate their country in the typology, and finally, international experts who
have worked in the countries provided additional feedback to corroborate the first two information
sources.
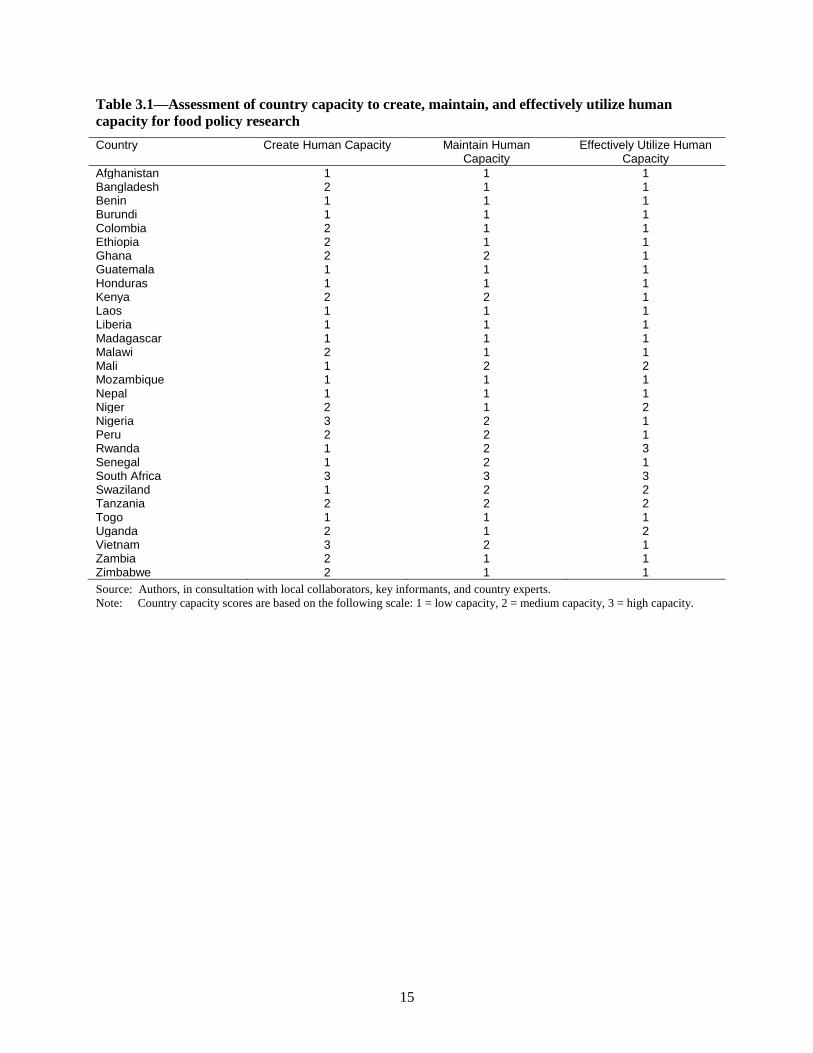
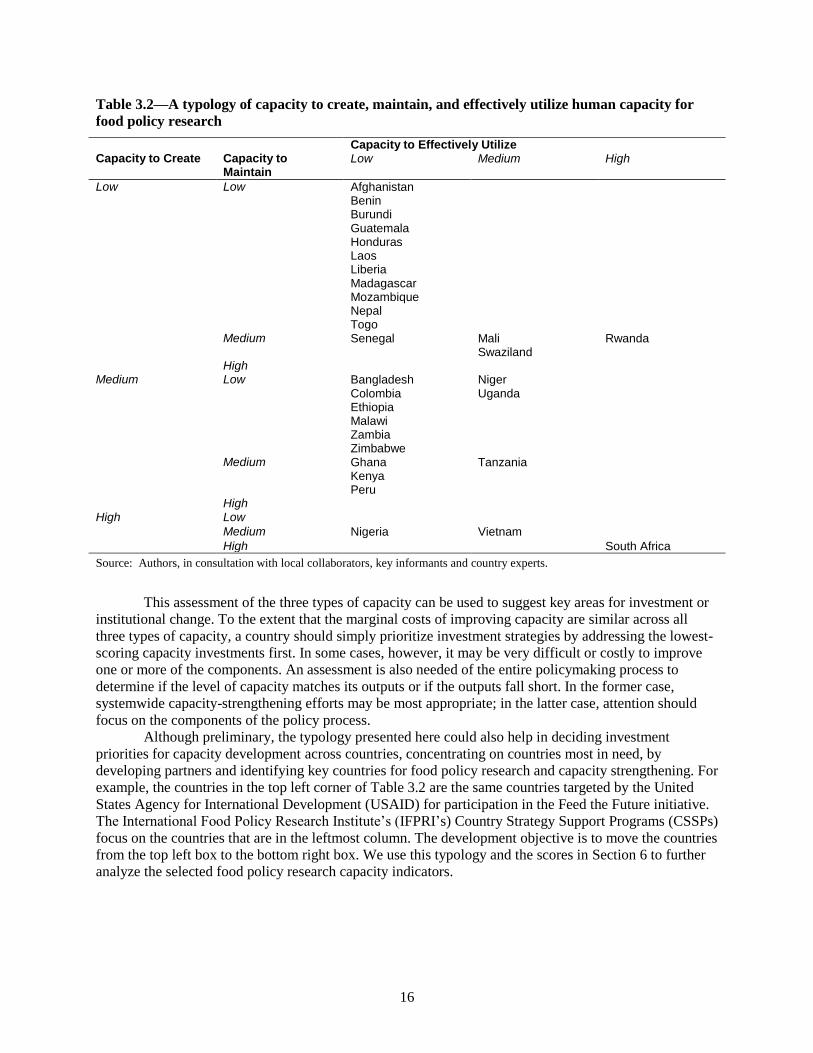
The scores for each country can be found in Table 3.1, and the corresponding typology can be
found in Table 3.2. Although there are 27 potential typologies, the countries presented here fall into only
1 of 11 of these typologies, with the majority falling in the typology characterized by low capacity to
create, maintain, and effectively utilize human capacity for food policy research.
15
Table 3.1—Assessment of country capacity to create, maintain, and effectively utilize human
capacity for food policy research
Country Create Human Capacity Maintain Human Capacity
Effectively Utilize Human Capacity
Afghanistan 1 1 1 Bangladesh 2 1 1 Benin 1 1 1 Burundi 1 1 1 Colombia 2 1 1 Ethiopia 2 1 1 Ghana 2 2 1 Guatemala 1 1 1 Honduras 1 1 1 Kenya 2 2 1 Laos 1 1 1 Liberia 1 1 1 Madagascar 1 1 1 Malawi 2 1 1 Mali 1 2 2 Mozambique 1 1 1 Nepal 1 1 1 Niger 2 1 2 Nigeria 3 2 1 Peru 2 2 1 Rwanda 1 2 3 Senegal 1 2 1 South Africa 3 3 3 Swaziland 1 2 2 Tanzania 2 2 2 Togo 1 1 1 Uganda 2 1 2 Vietnam 3 2 1 Zambia 2 1 1 Zimbabwe 2 1 1
Source: Authors, in consultation with local collaborators, key informants, and country experts.
Note: Country capacity scores are based on the following scale: 1 = low capacity, 2 = medium capacity, 3 = high capacity.
16
Table 3.2—A typology of capacity to create, maintain, and effectively utilize human capacity for
food policy research
Capacity to Effectively Utilize Capacity to Create Capacity to
Maintain Low Medium High
Low Low Afghanistan Benin Burundi Guatemala Honduras Laos Liberia Madagascar Mozambique Nepal Togo
Medium Senegal Mali Swaziland
Rwanda
High Medium Low Bangladesh
Colombia Ethiopia Malawi Zambia Zimbabwe
Niger Uganda
Medium Ghana Kenya Peru
Tanzania
High High Low
Medium Nigeria Vietnam
High South Africa
Source: Authors, in consultation with local collaborators, key informants and country experts.
This assessment of the three types of capacity can be used to suggest key areas for investment or
institutional change. To the extent that the marginal costs of improving capacity are similar across all
three types of capacity, a country should simply prioritize investment strategies by addressing the lowest-
scoring capacity investments first. In some cases, however, it may be very difficult or costly to improve
one or more of the components. An assessment is also needed of the entire policymaking process to
determine if the level of capacity matches its outputs or if the outputs fall short. In the former case,
systemwide capacity-strengthening efforts may be most appropriate; in the latter case, attention should
focus on the components of the policy process.
Although preliminary, the typology presented here could also help in deciding investment
priorities for capacity development across countries, concentrating on countries most in need, by
developing partners and identifying key countries for food policy research and capacity strengthening. For
example, the countries in the top left corner of Table 3.2 are the same countries targeted by the United
States Agency for International Development (USAID) for participation in the Feed the Future initiative.
The International Food Policy Research Institute’s (IFPRI’s) Country Strategy Support Programs (CSSPs)
focus on the countries that are in the leftmost column. The development objective is to move the countries
from the top left box to the bottom right box. We use this typology and the scores in Section 6 to further
analyze the selected food policy research capacity indicators.

17
4. FOOD POLICY CAPACITY INDEX
The central aim of this paper is to introduce an index that is theoretically valid, easily and annually
expandable and replicable, and simple to understand. We first describe our selected indicators and explain
our practical and theoretical rationale for their inclusion in the index, then detail how we collect the data
to construct our indicators, and last, present our index construction.
Food Policy Capacity Indicators
The realization of a simply constructed index is dependent on using a set of easily and annually
obtainable indicators. To assess the feasibility of collecting primary data on food policy research capacity,
a survey that assessed human resources, financial and physical capacity, research–policy linkages,
evidence-based policymaking, and policymaking capacity was distributed to collaborators in 30 countries.
Collaborators consistently reported that the collection of human resources data was the easiest to obtain
accurately, while financial and policy data proved to vary widely due to misinterpretation of the
questions. The frequent use of human resource or educational achievement data in other capacity indexes
(Knowledge Economy Index, National Innovative Capacity Index, and Human Development Index)
implies that this is also conceptually sound. Shleifer (2012) compared human capital and institutions with
regard to their predictive power of economic growth and income per capita and found that the empirical
literature suggests that human capital is a more consistent predictor of growth than institutions. Even so,
he does not discount the importance of institutions in political cycles, public-sector efficiency, and
economic outcomes. This suggests that human capital also predicts the long-term success of a food policy
research environment within a country, as public-sector capacity and economic growth are bicausal,
whereas institutions predict the shorter-term effectiveness of food policy research. This further justifies
the selection of human resources as the first indicator in the Food Policy Research Capacity Index
(FPRCI).
We measure human capacity here as the number of food policy researchers scaled by their
education level, and suggest that this is indicative of individual capacity. Individual capacity may be built
by recruiting foreign researchers in the short term and investing in a country’s higher education system in
the long term. Although the latter strategy is optimal for ensuring a steady supply of researchers in the
future, the former is a potential first step for countries in the earliest stages of development. However, an
abundance of human capacity is not sufficient to ensure quality outputs and outcomes; it must be used
effectively and efficiently within the policy process. Because effective use of human capacity depends on
organizational capacity and strong institutions, countries that have a high number of researchers but use
them inefficiently or ineffectively are likely in the earliest stages of development.
Efficiency, vis-à-vis outputs per unit of input, can be thought of as publications per researcher in
the research realm. The inclusion of outputs in innovation capacity indexes or science and technology
assessments is common (National Innovative Capacity Index, Global Competitiveness Index, Technology
Achievement Index); however, the inclusion of an efficiency indicator measured as outputs per input in a
(capacity) index does not seem to be common practice. We argue that this efficiency measure is
representative of organizational capacity of research organizations as it suggests that the organization has
a focused vision and dedicated research resources and efficiently manages its financial, physical, and
human resources to achieve its goals. It is also partially representative of a country’s informal institutions
because the social norms and cultural practices that govern work ethic, commitment to one’s job, and
motivation also play a strong role in the quality of outputs. This is particularly true in the research field,
where one must take initiative to stay up-to-date on current research and methodology, to connect with
external researchers for collaboration and peer review, to make a concerted effort to produce
internationally publishable research, and to prepare journal-specific research papers.

18
The third indicator in this index must be representative of the country’s enabling environment to
utilize the research outputs within the policymaking cycle. This indicator should holistically assess a
country’s public-sector capacity to engage in the policy process and implement reforms such that it
represents a country’s ability to produce relevant, evidence-based, and sustained reforms and to
effectively make use of foreign assistance, which is of particular concern to donors attempting to
maximize the social returns on their investments. The enabling environment is determined by a country’s
institutions, and Shleifer (2012) asserts that although institutions are quite volatile, they do matter for
current public-sector and legal-system functioning.
Although an enabling environment is a subjective concept, a number of objective indicators were
compared in an attempt to use only objective data for the FPRCI. One indicator considered but discarded
due to lack of data was the nominal rate of assistance, a measure that assesses the extent to which a
government intervenes to raise farmers’ incomes (Anderson 2009). Other objective measures compared
were a country’s information and communication technology infiltrations rates (the Knowledge Economy
Index, or KEI) and public research expenditure as a percentage of agricultural gross domestic product (the
Agricultural Science and Technology Indicators, or ASTI), but these were thought to not sufficiently
represent a country’s current institutions or its enabling environment for the policy process.
A number of well-established institutional indicators and indexes are constructed from subjective
or objective assessments, or both, including the economic incentive regime pillar of the KEI, the
government effectiveness pillar of the Worldwide Governance Indicators (WGI), the institutional
environment pillar of the Innovation Capacity Index (ICI), and the Public Sector Management pillar of the
Country Policy and Institutional Assessment (CPIA) index. Comparisons of these pillars yielded
correlation coefficients between 70 percent and 91 percent, implying that a subjective assessment as to
which indicator best represents the enabling environment for the policy process can be made without
cause for concern.
In comparing index constructions using different institutional indicators, the index with the WGI
government effectiveness pillar as the institutional indicator yielded the highest and most consistent
correlation coefficients to the Global Hunger Index (GHI) and Global Food Security Index (GFSI). This
pillar “captures perceptions of the quality of public services, the quality of the civil service and the degree
of its independence from political pressures, the quality of policy formulation and implementation, and
the credibility of the government’s commitment to such policies” (Kaufmann, Kraay, and Mastruzzi 2010,
4). It is constructed from a plethora of surveys and assessments that incorporate the views from a variety
of respondents including citizens, firms, public officials, nongovernmental organizations (NGOs), donors,
and international agencies, facilitating a comprehensive view of government effectiveness. Moreover, it is
also the most expansive dataset, covering more than 200 countries, and is updated annually.
The government effectiveness pillar captures both formal and informal institutions in that it
assesses the policy process and public-service systems as well as the quality of these systems. It is also
indicative of the organizational capacity of government entities and, to a lesser extent, of the capacity of
individuals who work for the government. Although strong government effectiveness undoubtedly
influences the efficient use of human resources, a strong score of output efficiency and a low score of
government effectiveness suggests that government effectiveness does not play a strong role in research
organizations (perhaps they are more autonomous in this hypothetical country), and more importantly, it
suggests that the research is not being put to good use. Conversely, strong government effectiveness and
poor research efficiency suggests that there is likely sufficient demand for research but weak supply,
which may be an organizational or institutional problem.
Combined, these three indicators—human capacity, human capacity efficiency, and institutions—
are representative of individual, organizational, and systemic capacity. Inconsistent levels of these
indicators may also be indicative of countries in different stages of development; for example, strong
human capacity but poor efficiency and institutions may suggest that a country is in early stages of
development, while a country with high government effectiveness suggests a country in a higher level of
development and the human capacity and human capacity efficiency indicators represent the
government’s commitment, or lack thereof, to building capacity.

19
Data Collection and Indicator Standardization Methodology
Below we detail how data for each of the three indicators, human capacity, human capacity efficiency,
and institutions, are collected and standardized.
Human Capacity
Human resource capacity is representative of the quantity of inputs allocated by a country to food policy
research. Because of the scaling by educational achievement, it can also be thought of as indicative of the
financial inputs dedicated to food policy, a figure much harder to capture particularly in institutions where
a variety of research is undertaken and overhead costs are often shared. These data were obtained by
surveying government agencies, research organizations and think tanks, and higher education institutes
that were engaged in food policy research. Local food and agricultural experts were consulted to ensure
that at least 80 percent of a country’s research capacity was assessed through the organizations selected
for surveying. The quality of the data was also checked by a comparison with the ASTI database, which
collects data on full-time equivalent (FTE) agricultural researchers, which yielded a correlation of 68
percent, ensuring the validity of the data.
A country’s aggregate human resources capacity is valued as the number of FTE PhD-level
researchers per one million rural inhabitants, weighted by the researcher’s education, where a PhD degree
is equivalent to either two master’s degrees or four bachelor’s degrees, and by the time the researcher
spends on research specific to food policy. The latter factor determines the full-time equivalency of the
number of food and agricultural policy researchers by type of organization and research focus. The
guiding assumptions are as follows: agricultural policy think tanks and agricultural-policy-specific
research groups or units: 70 percent; agricultural economics departments at higher education institutes: 50
percent; ministries of agriculture: 30 percent; and general policy think tanks, other government ministries,
technical agricultural research organizations, and other departments at higher education institutes: 10
percent.
These estimates were determined from a combination of stakeholder interviews and surveys;
however, where firsthand knowledge of an organization’s specific research activities and foci are
available, this is used instead.
In constructing the index, we divide the number of FTE PhD-level researchers by the rural
population. Such an approach is typical for assessing the size of a country’s extension effort relative to the
number of farmers or the level of financial and manpower commitment relative to population. To the
extent that the size of the rural population reflects the complexity of food policy, calculating per capita
values of FTE PhD-level researchers is an improvement over simply using the number of FTE
researchers. The per capita variable is also a better indication of government (or society’s) commitment to
policy analysis. However, food policy is complex, and a minimum level of analysis (and number of
analysts) may be required to cover all the production, market, trade, consumption, and nutrition issues,
even in a small country. Thus, five FTE researchers in a country of 50 million people (one FTE researcher
per 10 million people) may be far more effective than one sole FTE researcher in a country of 10 million
people. Because of these issues of scale, comparisons of human capacity are most valid for countries with
similar sizes, and data for countries with very small (less than 10 million) or very large (greater than 100
million) populations should be treated with caution.
Human Capacity Efficiency (Productivity)
To assess the efficiency (productivity) of a nation’s human capacity in terms of its research outputs, the
number of internationally published journal articles related to food policy was determined. This is
representative of the quality of research undertaken and, when divided by the number of PhD FTE
researchers, representative of the efficiency of a country’s inputs. We used the number of articles
published in the last five years to account for the length of the research and publishing process and the

20
variability this would create if only annual data were used. It is an objective indicator that can be easily
updated annually through desk research.
The number of articles was found through comprehensive searches of the Web of Science and
EconLit databases. In Web of Science, articles were searched using the following criteria: year published
(2007–2011 for our 2011 data), author’s organizational affiliation (in the country of interest, its capital
city or major city identified by the existence of an organization conducting food policy research), topic
(policy or policies), and subject area (nonnutrition medical fields excluded).8 The resulting articles were
then filtered to exclude any articles that were not relevant according to our above definition of food policy
research or that were authored at organizations not known to conduct food policy research. A quality
check was then performed by searching for any articles written by affiliates at the surveyed organizations
that were related to food policy. EconLit was searched using the same criteria for year published and
author’s affiliation (country, capital, or other major city). The search criteria were then refined by subject
area, where articles in pure macroeconomics or finance were filtered out. Any articles authored by
organizations not surveyed were removed, as well as articles not related to food policy research according
to our definition. Articles from both databases were cross-checked to ensure no double counting.
Institutions
The WGI government effectiveness data were obtained from the World Bank (2011). The data and its
methodology are freely available online. The WGI uses data from 30 sources from household and firm
surveys, commercial business information providers, NGOs, and public-sector organizations. The
government effectiveness pillar uses survey questions related to concepts such as bureaucracy,
institutional effectiveness, infrastructure, primary education, transportation system, provision of public
goods, public administration, budgetary and financial management, rural development investment, trust in
government, independence of public service and political system, policy process, consensus building, and
resource efficiency. The data are initially rescaled to range from 0 to 1, and then the unobserved
components model is used to construct a weighted average of the data from each source for each country.
The WGI are reported in standard normally distributed units, with a mean of zero and standard deviation
of 1.
The raw data and scaled data of these three indicators can be found in Table 4.1, and the
methodology to construct the Food Policy Research Capacity Index using these three indicators is
outlined in the following section.
8 Note that the use of these English language literature databases likely misses significant research in non-English-speaking
countries. Further work is needed to capture this other literature.

21
Table 4.1—Food policy research capacity indicators, 2011
Country
Human Capacity Human Capacity Efficiency Institutions
Head count of
researchers
PhD FTE researchers per
million rural residents
Publications (2007–2011)
Publications per PhD FTE researcher
WGI government effectiveness pillar (standard normally
distributed)
Afghanistan 43 0.11 0 0 –1.46
Bangladesh 66 0.212 39 1.703 –0.85
Benin 38 0.858 18 4.186 –0.46
Burundi 39 0.671 0 0 –1.07
Colombia 85 0.556 24 3.721 0.24
Ethiopia 74 0.318 28 1.253 –0.4
Ghana 95 1.687 46 2.269 –0.03
Guatemala 45 1.606 5 0.42 –0.7
Honduras 33 1.651 4 0.653 –0.58
Kenya 155 0.999 55 1.741 –0.54
Laos 9 0.423 1 0.571 –0.91
Liberia 34 1.437 0 0 –1.21
Madagascar 187 0.802 7 0.607 –0.87
Malawi 50 0.812 6 0.57 –0.43
Mali 60 0.975 0 0 –0.83
Mozambique 37 0.286 16 3.404 –0.55
Nepal 27 0.144 4 1.096 –0.79
Niger 29 0.669 3 0.34 –0.67
Nigeria 349 0.946 22 0.284 –1.12
Peru 54 1.069 16 2.238 –0.15
Rwanda 37 0.362 1 0.313 0.07
Senegal 71 1.268 5 0.538 –0.44
South Africa 198 2.617 217 4.312 0.37
Swaziland 32 3.391 3 1.053 –0.69
Tanzania 91 0.613 12 0.578 –0.54
Togo 81 1.789 11 1.612 –1.36
Uganda 34 0.375 14 1.281 –0.51
Vietnam 175 0.537 5 0.154 –0.28
Zambia 29 0.647 8 1.509 –0.65
Zimbabwe 42 1.134 16 1.803 –1.4
Source: Authors; World Bank 2011.
Notes: FTE, full-time equivalent; WGI, Worldwide Governance Indicators.

22
Index Construction
A common approach to constructing an index in the field of social sciences is to first identify
conceptually the thematic dimensions that influence the index of interest. Each theme, or pillar, is then
constructed using a set of indicators that can be subjectively or objectively measured, and the pillars are
then combined to formulate the final index. The identification of component dimensions, indicators, and
the variables should be rooted in a theoretical framework and empirically tested (OECD 2008).
The variables used to track indicators are often not measured with the same units or are scaled
differently. To allow for aggregation, raw data must be transformed by rescaling, ranking, or
standardizing. This eliminates the scale effects of the different units of measurement without changing the
ranking of observations. Rescaling or normalizing, which is done by subtracting the mean and dividing by
the range, shifts the data to fall within the interval [0,1] but is highly susceptible to skewing if the dataset
contains outliers. The range can be calculated using the dataset’s maximum and minimum values, 95
percent of the range (removing outliers in the 2.5 percent tails), or can represent specifically chosen
subsistence levels or optimal goal posts, which require careful consideration to avoid unintentional
skewed weighting of certain indicators in the final index. The Human Development Index is constructed
using the latter strategy for the choice of minimum values; for example, the minimum life expectancy was
chosen to be 20 years. In the FPRCI, this implies that maximum levels of capacity must be determined,
which is no small task and likely to be country specific. Ranking the data has the benefit of being robust
to outliers as it utilizes only the relative positions of the data; however, it ignores the relative levels of the
data, which is important for the purposes of this index. It also makes longitudinal comparisons impossible
if the dataset either shrinks or expands.
Standardizing data converts data to have a mean of zero and standard deviation of 1, creating
unitless data that can easily be aggregated. This requires the broad assumption of having normally
distributed data, an assumption that will likely increase in validity as this index expands in the future.
Despite this assumption, standardization is conceptually the most useful technique for the FPRCI as it
retains relative differences in levels between countries and eliminates the need for “optimal” levels of
capacity. Correlation checks of the final index constructed from normalized data (using the actual range
and a goal-posted range) and our standardized data yielded coefficients greater than 0.96, suggesting the
data transformation technique is not significantly influential on the index.
Since the normalization procedure depends on the variance and mean of each dataset, which are
expected to change from year to year, longitudinal comparisons to earlier calculated indexes will be
inaccurate. However, previously published indexes can easily be recalculated each year using aggregated
data allowing for longitudinal analyses of countries.
The weighting of the indicators in each pillar and of the pillars themselves in the final index may
be determined by regression analysis, factor analysis, or principal component analysis, or through expert
consultations (OECD 2008). The pillars are then aggregated, depending on the intention of the index, its
conceptual framework, thematic dimensions, indicators, and data quality and availability (Rehman and
Askari 2010). Indexes that are constructed to represent a concept or subjective issue more frequently base
index constructions on expert opinions because the endogeneity problem in regressions is harder to
overcome (OECD 2008). The importance of human capacity versus institutions is still a debated topic in
development economics (Shleifer 2012) and, by extension, in understanding policy process effectiveness.
Because of this, and the objective of constructing an index that can be easily interpreted, the indicators
were given equal weighting. The robustness of these weightings and their influence on the final rankings
is described in the following section.
An index may be constructed by arithmetic or geometric averaging, each with its own pros and
cons. Arithmetic averages are the simplest constructions but imply substitutability of the thematic pillars,
whereas geometric averaging accommodates codependent pillars. Because the results of food policy
research are dependent on the existence and strength of all three of the indicators simultaneously,
geometric averaging was the method chosen for composition of the index. This construction forces any

23
index value to zero if any of the components have a value of zero, and thus all standardized indicators
were shifted to have a mean of 10 (maintaining a standard deviation of 1) to avoid this.
Thus, the final construction of the food policy research capacity index is as follows:
(1)
where HC is human capacity, the standardized and shifted number of FTE PhD-equivalent researchers per
one million rural residents; HCE is human capacity efficiency, the standardized and shifted number of
internationally published journal articles per FTE PhD-equivalent researcher; and Inst is the standardized
and shifted government effectiveness pillar of the WGI. The index values have been normalized by their
own range to lie in the interval [0,10].
The scores and rankings of the FPRCI are presented in the following section, along with
robustness checks, comparing the index to measures of food security, to other development and capacity
indexes, and to alternative indicator standardization methods and index construction types.

24
5. RESULTS
The index and resulting rankings of the 30 countries surveyed in 2011 are reported in Table 5.1. The
distribution of scores is strongly left skewed, with six countries achieving scores above 5, and almost half
of the countries with scores between 2.5 and 3.5. The highest scorer is unsurprisingly South Africa,
buoyed by its efficient research capacity and effective government scores. South Africa is generally
thought to be the most developed country of the 30 in this sample and a hub of research, particularly in
Africa. Both factors—strong economic performance and a solid research base—aid in facilitating self-
sustaining food policy research capacity.
Table 5.1—Food policy research capacity index, 2011
Rank Country Raw Score
Normalized Score
Standardized and shifted PhD FTE researchers per
million rural residents
Standardized and shifted
publications per PhD FTE
researcher
Standardized and shifted WGI
government effectiveness
pillar
1 South Africa 12.289 10.0 12.243 12.434 12.191
2 Colombia 11.038 6.5 9.444 11.961 11.906
3 Ghana 11.028 6.5 10.980 10.797 11.312
4 Swaziland 10.880 6.0 13.294 9.823 9.862
5 Benin 10.801 6.0 9.854 12.333 10.367
6 Peru 10.647 5.5 10.141 10.773 11.048
7 Mozambique 10.262 4.5 9.077 11.707 10.169
8 Kenya 10.203 4.5 10.046 10.374 10.191
9 Honduras 10.162 4.0 10.931 9.503 10.103
10 Senegal 10.066 4 10.411 9.411 10.411
11 Guatemala 9.988 3.5 10.870 9.316 9.840
12 Rwanda 9.923 3.5 9.180 9.230 11.532
13 Zambia 9.898 3.5 9.567 10.189 9.949
14 Malawi 9.878 3.5 9.792 9.436 10.433
15 Togo 9.858 3.5 11.119 10.271 8.389
16 Ethiopia 9.851 3.5 9.121 9.983 10.499
17 Uganda 9.810 3.0 9.198 10.006 10.257
18 Vietnam 9.735 3.0 9.418 9.103 10.763
19 Tanzania 9.713 3.0 9.521 9.443 10.191
20 Zimbabwe 9.601 2.5 10.229 10.424 8.301
21 Bangladesh 9.594 2.5 8.977 10.344 9.510
22 Niger 9.581 2.5 9.597 9.252 9.905
23 Madagascar 9.569 2.5 9.778 9.466 9.466
24 Mali 9.506 2.5 10.013 8.980 9.554
25 Nepal 9.452 2.0 8.884 9.858 9.642
26 Liberia 9.409 2.0 10.640 8.980 8.719
27 Laos 9.359 2.0 9.263 9.437 9.378
28 Nigeria 9.355 2.0 9.974 9.207 8.916
29 Burundi 9.198 1.5 9.600 8.980 9.026
30 Afghanistan 8.655 0.0 8.838 8.980 8.169
Source: Authors.
Notes: FTE = full-time equivalent, WGI = Worldwide Governance Indicator.

25
Three of the five lowest-scoring countries are those marked by substantial periods of civil war or
violence in recent decades: Liberia, Burundi, and Afghanistan. These countries are either still in conflict
or are struggling to maintain order, and their development efforts are prioritized to security issues and
national cohesion efforts rather than food and agricultural policy issues.
The results unsurprisingly support the hypothesis that richer, more developed countries have
stronger food policy research capacities (correlation coefficient of 0.71) and, to a lesser extent, that
countries with larger rural populations have relatively weaker food policy research capacities (0.25) as
they have achieved some economies of scale from food policy research investments.
Comparisons to other Development and Capacity Indexes
An index’s validity must be verified by comparisons to conceptually similar indicators or indexes. As
there is no perfect measure of a country’s food policy research outcomes and the impact they yield, two
complementary proxies were chosen: the International Food Policy Research Institute’s (IFPRI’s) Global
Hunger Index (GHI) and the Economist Group’s Global Food Security Index (GFSI). The former is
constructed from health and development indicators that represent individual-level outcomes of a
country’s food security situation; while the latter measures the affordability, availability, quality, and
safety, which are indicative of policy efforts to improve food security. Comparisons yielded correlations
of 67 percent and 68 percent with the GHI and GFSI, respectively. Graphical representations of these
comparisons can be seen in Figures 5.1 and 5.2. Note that neither the GHI nor the GFSI covers the same
set of countries as the Food Policy Research Capacity Index (FPRCI), and the country coverage drops to
29 and 25 countries for the GHI and GFSI, respectively. Neither the GHI nor the GFSI report figures for
the lowest-scoring country, Afghanistan.
Figure 5.1—Global Hunger Index and the Food Policy Research Capacity Index
Source: Authors; IFPRI 2012b.

26
Figure 5.2—Global Food Security Index and the Food Policy Research Capacity Index
Source: Authors; Economist Intelligence Unit 2012.
The index was also compared with general indicators of socioeconomic development, including
the Human Development Index, which yielded a correlation coefficient of 0.56 (n = 30). The correlation
coefficient between the index and the Innovation Capacity Index (ICI) is 0.76 (n = 26) and 0.71 (n = 29)
between the index and gross domestic product per capita.
Robustness of Methodology
Choice of Institutions Variable
Using the same methodology (equally weighted geometric mean of standardized variables), indexes were
constructed and compared using three alternate institutions proxies: the institution environment pillar of
the ICI, the public-sector management pillar of the Country Policy and Institutional Assessment, and the
economic incentives pillar of the Knowledge Economy Index. All three are strongly correlated
(coefficients greater than or equal to 0.92) to the index using the Worldwide Governance Indicators’
government effectiveness pillar. Additionally, none of the three alternate indexes is more strongly
correlated with the GHI or GFSI than our proposed index.
Indicator Calculation
The index was also constructed using indicators that were normalized by different methods, which did not
yield substantially different results. The index constructed using indicators that were normalized by their
own range yielded a correlation coefficient of 99 percent with the index constructed using standardized
variables, and the index constructed with indicators that were goal posted9 yielded a correlation
coefficient of 96 percent.
9 The goal posts chosen were as follows: 5 for researchers, 5 for publication per researcher, and 2.5 for government
effectiveness.

27
Index Construction
The index (calculated by geometric mean of its indicators) yielded a correlation coefficient of 99.93
percent with the index calculated by arithmetic mean with the same standardized variables and was
similarly correlated with the GHI and GFSI.
Weightings
The robustness of the index to varying weightings for each indicator was also tested. Three comparison
indexes were constructed, weighting one indicator 50 percent and the remaining two at 25 percent. All
three indexes yielded correlation coefficients more than 95 percent with the equally weighted index and
more than 89 percent with each other. The index that weighted the number of full-time equivalent PhD
researchers more heavily performed better than the equally weighted index when using the GHI and GFSI
as metrics of comparison, but only minimally.

28
6. ANALYSIS
The above results warrant further analysis to understand the main determinants of the scores and rankings
of the various countries. We first analyze the index scores in the context of the country typologies
presented earlier. The country typologies indicate a country’s current investments in creating,
maintaining, and effectively utilizing human capacity, while the Food Policy Research Capacity Index
(FPRCI) theoretically reflects past capacity-strengthening investments made. Ideally, the optimal
comparison would be between typologies that reflect the situation 5 to 10 years ago and current FPRCI
scores; however, as we are still in the early stages of this research, our typology analysis is restricted to
same-year comparisons. The second portion of our analysis assesses the relationship between food policy
research capacity and the agricultural transformation process.
Country Typology
We compare the country typology presented earlier to our FPRCI with the aim of determining to what
extent a country’s food policy research capacity can be explained by its commitment to creating,
maintaining, and effectively utilizing human capacity. We calculate an average typology score for each
country by taking the mean of its scores for creating, maintaining, and effectively utilizing human
capacity, as reported in Table 4.1. These mean typology scores are presented in Table 6.1, along with the
index scores. The correlation between the two scores is 50 percent, which suggests that for a significant
number of countries, their investments in human capacity are yielding lower returns than expected
because of weak organizational and institutional capacity at the national level. In other words, the
typology score is overinflated because it fails to account for the fact that the lowest capacity will
bottleneck a country’s capacity. For example, even if a country demonstrates strong abilities to create and
maintain capacity, its potential capacity is limited by the degree to which it can effectively utilize its
capacity. The weakest link, or lowest capacity, bottlenecks the entire system. Geometric averaging
accounts for this minimally, are increasing the correlation by 2 points. Comparing the lowest score of the
three capacities to the index is futile, as 28 of the 30 countries have the lowest possible score for at least
one capacity.
Nigeria is the greatest anomaly in this dataset, with the second highest typology score and the
third lowest food policy research capacity score. This may be due to a number of reasons. First, it may
reflect the time delay in the translation of capacity investments to enhanced food policy research capacity.
Second, Nigeria has the highest head count of researchers engaged in food policy research capacity,
which accurately reflects its investments in creating and maintaining capacity; however, when scaled by
education and time spent on food policy research capacity, it has only average human capacity. This
suggests that Nigeria may have invested in increasing the quantity but not the quality of its researchers,
and that its research capacity may be stretched too thin and involved in too many nonfood policy projects
to produce high-quality food policy research. Last, Nigeria has a very low government effectiveness
score, so despite efforts to invest in capacity, other governance factors may be hindering its food policy
research capacity. The typologies developed here are designed to be a starting point to understand a
country’s bottlenecks, but case study analysis is required to shed light on potential historical, economic,
cultural, social, or geographical factors that may have helped or hindered a country to develop its food
policy research capacity. Such analyses would illustrate the high variability in a country’s total capacity
and the various factors that obstruct a country from actively engaging its full capacity, from which one
can learn that there is no one-size-fits-all ideal policy process or institutional framework. This means that
countries must take careful stock of their own capacities and identify internal bottlenecks, and look to
countries with similar historical, cultural, political, and economic characteristics for possible reform
measures or best practices.

29
Table 6.1—Country index and typology scores
Rank Country Index Score Typology Score
1 South Africa 10 3
2 Colombia 6.5 1.3
3 Ghana 6.5 1.7
4 Swaziland 6 1.7
5 Benin 6 1
6 Peru 5.5 1.7
7 Mozambique 4.5 1
8 Kenya 4.5 1.7
9 Honduras 4 1
10 Senegal 4 1.3
11 Guatemala 3.5 1
12 Rwanda 3.5 2
13 Zambia 3.5 1.3
14 Malawi 3.5 1.3
15 Togo 3.5 1
16 Ethiopia 3.5 1.3
17 Uganda 3 1.7
18 Vietnam 3 2
19 Tanzania 3 2
20 Zimbabwe 2.5 1.3
21 Bangladesh 2.5 1.3
22 Niger 2.5 1.7
23 Madagascar 2.5 1
24 Mali 2.5 1.7
25 Nepal 2 1
26 Liberia 2 1
27 Laos 2 1
28 Nigeria 2 2
29 Burundi 1.5 1
30 Afghanistan 0 1
Source: Authors.
Development, Agricultural Transformation, and Levels of Capacity
Economic development is typically characterized by a reduction in the share of agriculture in the
economy even in countries that experience a rise in agricultural productivity. Our index scores yielded a
correlation coefficient of –0.58 with agriculture value added (as a percentage of gross domestic product,
or GDP), indicating an inverse relationship between food policy research capacity and dependency on
agriculture. Certainly this relationship is bicausal—countries whose economies are more dependent on
industries that are more profitable than agriculture are often richer and thus have more resources available
to invest more in food policy research, while countries that invest more in food policy research are able to
more quickly transform their agricultural sector, ultimately steering their economies away from
agriculture to more profitable industries.
Agricultural transformations have been analyzed in great detail in an attempt to generate the
wealth that the Green Revolution brought in Asia to Africa. Understanding the channels through which
policy changes triggered the Green Revolution and other such agricultural transformations is crucial to
facilitating similar transformations in other countries.
30
Timmer (1988) characterizes four stages of agricultural transformation by economic criteria:
1. Agricultural productivity per laborer increases, generating a surplus of agricultural
commodities.
2. The surplus generates direct or indirect resources, which incentivizes nonagricultural-sector
growth.
3. The agricultural sector’s importance within the macroeconomy increases, noticeable through
improved infrastructure and market-equilibrium linkages.
4. The agricultural sector reaches the same status as other sectors, such as the manufacturing or
financial sectors.
In the traditional, land-constrained model, this transformation can also be viewed through
increases in agricultural intensification. Intensification of agriculture is achieved by intensifying the use
of the factors of production, relative to the factor with the highest opportunity cost (Delgado 1995).
Byerlee (1992) contextualizes four stages of agriculture transformation relative to the Green Revolution:
The pre–Green Revolution stage is characterized by increased land productivity; the Green Revolution
stage is defined by widespread use of newly developed crop varieties; the post–Green Revolution stage
sees intensification of input usage; and the post-post–Green Revolution stage occurs when there is an
efficiency gain in input use. Classification of countries into these stages will indicate the type of strategy
necessary for agricultural development. Lele and Stone (1989) emphasize the role that policymaking had
in facilitating the Green Revolution, whereby policies led to a widespread increase in irrigation and
fertilizer use to cultivate the new crop varieties designed for such increased input use.
We suggest that a country’s progress through the levels of agricultural transformation is
accompanied by simultaneous transformations of its policy process capacity, as illustrated in Figure 6.1.
Although the entities that interact within the policy process system remain the same, the quality and
quantity of their contributions and interactions will increase as their individual and organizational
capacities improve. Systemic improvements in capacity will also be characterized by improved informal
institutions, such as increased trust between players and actors, increased accountability of the policy
system to the country’s citizens, improved accountability of the processes, and increases in both the
quality and quantity of discussions taking place. This transformation of the policy process is likely
triggered by three factors: First, the improvements in the agriculture sector will increase demand for
additional policy support if agricultural-sector entities can attribute agricultural-sector growth to policy
changes. Second, agricultural growth will induce economic growth, with spillovers to all sectors and
profits to be reinvested in further agricultural development including capacity building. Third, ownership
of policies that caused the initial agricultural transformation will entice contributors to the policy process
to improve their own capacity to be able to further contribute.

31
Figure 6.1—Capacity transformation for agricultural transformation
Source: Authors.
Notes: CSO, civil-society organization; NGO, nongovernmental organization.
Following Timmer’s lead, we seek to characterize the 30 countries in our dataset into stages of
agricultural transformation using agriculture value added per worker as our proxy for agricultural
development. In Figure 6.2, we see a strong correlation between agricultural laborer productivity and
GDP per capita, and we identify three potential stages of agricultural transformation: The first is the
cluster in the lower left corner, characterized by low productivity and low income; the second contains
countries that have reached a minimum agriculture valued added of $1,000 per worker; and the third
contains only South Africa. With the exception of Peru, we see a step sequence, suggesting that for each
minimum level of agriculture value added per worker reached, a corresponding level of GDP per capita is
attained. Peru is most likely an outlier because its dependency on agriculture is extraordinarily low—only
1 percent of its employed population is employed in agriculture.
Higher Education Institutes
Ministry of Agriculture
Agricultural Research Institutes
Think Tanks
Private Sector
CSOs/ International
NGOs
Higher Education Institutes
Ministry of Agriculture
Agriculural Research Institutes
Think Tanks
Private Sector
CSOs/ International
NGOs
Level 1
Agriculture
Transformation
Level 2
Agriculture
Transformation
Level 1
Policy Capacity
Level 2
Policy Capacity
Food Policy
Research
Capacity
Food Policy
Research
Capacity

32
Figure 6.2—Gross domestic product (GDP) per capita and agriculture value added per worker,
2011 Food Policy Research Capacity Index countries
Source: World Bank 2011.
Notes: PPP = purchasing power parity, Int$ = International dollar.
We expanded our dataset to include all countries with a GDP per capita under $10,000 and
agriculture valued added per worker under $10,000, and find similar evidence of such steplike stages (see
Figure 6.3). Here we find that when a country reaches a threshold level of $1,500 agriculture valued
added per worker, it has a minimum GDP per capita of approximately $2,200, with most countries
averaging $6,000. A second step is evident when agriculture value added reaches approximately $4,500,
with no country having a GDP per capita lower than $4,500. The increasing noise above the parity line is
in line with evidence that as countries progress economically, they expand into nonagricultural sectors,
facilitating larger gains in income.

33
Figure 6.3—Gross domestic product (GDP) per capita and agriculture value added per worker,
expanded dataset 2011
Source: World Bank 2011.
Notes: PPP – purchasing power parity, Int$ – International dollar.
Which capacities are required for each step of the transformation process? This question is
illustrated in Figure 6.4. Figure 6.4a disaggregates countries by the number of researchers; Figure 6.4b
disaggregates countries by the number of publications per researcher; and Figure 6.4c disaggregates
countries by their level of government effectiveness. We assess countries here on a case-by-case basis to
understand the various constraints to their food policy research capacity. Figures 6.4a–c demonstrate that
countries’ food policy research capacity varies for different reasons.

34
Figure 6.4a—Food Policy Research Capacity Index and agriculture value added per worker,
disaggregated by number of researchers per million rural residents
Source: Authors; World Bank 2010.
Figure 6.4b—Food Policy Research Capacity Index and agriculture value added per worker,
disaggregated by number of publications per researcher
Source: Authors; World Bank 2010.
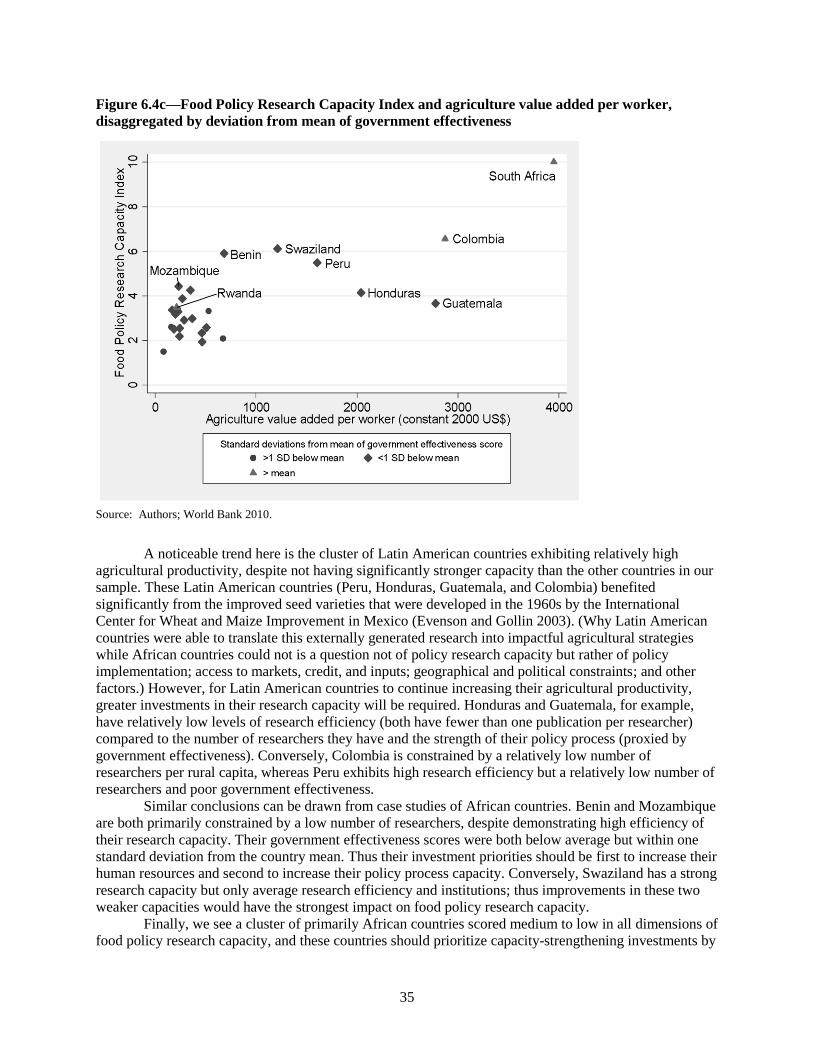
35
Figure 6.4c—Food Policy Research Capacity Index and agriculture value added per worker,
disaggregated by deviation from mean of government effectiveness
Source: Authors; World Bank 2010.
A noticeable trend here is the cluster of Latin American countries exhibiting relatively high
agricultural productivity, despite not having significantly stronger capacity than the other countries in our
sample. These Latin American countries (Peru, Honduras, Guatemala, and Colombia) benefited
significantly from the improved seed varieties that were developed in the 1960s by the International
Center for Wheat and Maize Improvement in Mexico (Evenson and Gollin 2003). (Why Latin American
countries were able to translate this externally generated research into impactful agricultural strategies
while African countries could not is a question not of policy research capacity but rather of policy
implementation; access to markets, credit, and inputs; geographical and political constraints; and other
factors.) However, for Latin American countries to continue increasing their agricultural productivity,
greater investments in their research capacity will be required. Honduras and Guatemala, for example,
have relatively low levels of research efficiency (both have fewer than one publication per researcher)
compared to the number of researchers they have and the strength of their policy process (proxied by
government effectiveness). Conversely, Colombia is constrained by a relatively low number of
researchers per rural capita, whereas Peru exhibits high research efficiency but a relatively low number of
researchers and poor government effectiveness.
Similar conclusions can be drawn from case studies of African countries. Benin and Mozambique
are both primarily constrained by a low number of researchers, despite demonstrating high efficiency of
their research capacity. Their government effectiveness scores were both below average but within one
standard deviation from the country mean. Thus their investment priorities should be first to increase their
human resources and second to increase their policy process capacity. Conversely, Swaziland has a strong
research capacity but only average research efficiency and institutions; thus improvements in these two
weaker capacities would have the strongest impact on food policy research capacity.
Finally, we see a cluster of primarily African countries scored medium to low in all dimensions of
food policy research capacity, and these countries should prioritize capacity-strengthening investments by

36
their lowest score. One notable exception in this cluster is Rwanda. Since the devastating civil war in the
early 1990s and the horrific genocide in 1994, Rwanda has made great strides in rebuilding its
government and improving the effectiveness of its limited resources. In 2011, it was ranked fourth out of
more than 50 countries in Africa south of the Sahara on Transparency International’s Corruption
Perceptions Index, indicating that political commitment to good governance and public-sector services
exists. Despite prioritization of agricultural and food security issues, Rwanda is hindered by a young,
uneducated workforce that is unable to fill all the positions in its public sector (World Bank 2004), and
this is true in the agricultural research sector as well (Flaherty and Munyengabe 2011). In the short term,
Rwanda recruited foreigners to fill its vacancies but must invest in enhancing its higher education
institutes to ensure a steady supply of researchers in the future (Musafiri 2011).
These results suggest that catalyzing an agricultural transformation is not as simple as developing
and implementing policies that improve agricultural productivity. With regard to policy research alone,
countries vary widely in their capacities, and hence in their constraints and capacity-strengthening needs.
Strengthening the weakest link in a country’s food policy research capacity is a good step toward
improving their food policy capacity and hence in enabling a country to move to the next stage of the
agricultural transformation process.

37
7. DISCUSSION
The primary intention of this research project is to initiate a discussion on food policy research capacity.
Little is known about what constitutes sufficient capacity, in quantity and quality; how to strengthen
capacity; what factors affect the development, maintenance, and effective utilization of capacity; and to
what extent capacity is affected by intangible, immeasurable factors. Assessing a country’s capacity to
undertake food policy research is the first step in developing a capacity-strengthening strategy; diagnostic
work must be done first to determine what and where capacity-building activities will be most effective.
We present our preliminary findings in this paper with cautionary words. Broad ambitions to
assess physical, financial, and human capacities in developing countries were thwarted by logistical
challenges, and the data presented in this paper represent those that were both easily obtainable and
representative of the most important aspects of capacity, in our opinion. However, data collection
methods are still being refined, and we continue to research alternative indicators. By no means do we
intend to imply that the three indicators presented here are fully representative of a country’s capacity to
do food policy research, but we suggest that they provide a good starting point for measuring food policy
research capacity.
The first indicator is the number of domestic PhD full-time equivalent (FTE) food policy
researchers. This variable is indicative of a country’s potential capacity to undertake research but not
necessarily its active capacity for a number of reasons. First, the quality of researchers’ education cannot
be ascertained. Second, the availability of resources (financial, technical, physical) limit the ability of
researchers to undertake high-quality research. Third, weak organizational capacity in terms of poor
management of research staff, ineffective resource allocation, and inadequate incentives discourage
researchers from undertaking rigorous research projects. Poor organizational structure may also result in
PhD-level researchers being promoted to managerial positions, making ineffective use of their research
skills. Informal institutions, particularly the social norms that govern work ethic and commitment, can
dramatically influence the effective utilization of human capital.
The head count of researchers within each country ranged from 27 (Nepal) to 349 (Nigeria).
Following scaling by time spent on food policy research, educational attainment, and number of rural
residents, the number of researchers dropped to a comparable range between 0 and 3, with one outlier:
Swaziland. However, Swaziland’s apparently inflated number of researchers is justifiable from a
theoretical standpoint and a logistical one. Food policy research capacity can achieve economies of scale
in a country with a large population and homogeneous agricultural production. We scaled human capacity
on a per capita basis but did not account for economies of scale, because information is insufficient to
indicate when or at what rate a country achieves economies of scale in its food policy research capacity.
The low-populated Swaziland has likely not yet been able to achieve such economies of scale in its food
policy research capacity. Additionally, Swaziland’s relatively high gross domestic product per capita
(fourth highest in our dataset) suggests that it has the resources to invest in building a higher-than-average
per capita research capacity.
Scaling the number of researchers by a country’s rural population rather than its total population
may underestimate capacity in some countries and overestimate it in others. Heavily urban countries that
suffer from food-insecurity issues unrelated to their agricultural production will have overestimated
capacity relative to their needs. Conversely, heavily rural but relatively food-secure countries will appear
to have a weak research capacity relative to their needs.
Human capital is worthless unless it is effectively managed and utilized. We assess the efficiency
of human capital by calculating a simple input–output ratio of researchers to internationally published
journal articles. The condition that research is published internationally ensures that a minimal level of
quality has been met, since the quality of local publications varies tremendously. We recognize that the
capability to publish, particularly in international journals, is only one facet of research, and that
publications do not necessarily reflect other research communication avenues, such as policy briefs,
research seminars, opinion pieces in local media, and meetings with policymakers or politicians.
38
However, we do feel that international publication is indicative of the existence of several elements of
strong research capacity, such as creativity, knowledge of current research methods and similar research
projects, strong analytical skills, and the ability to write cogently and persuasively. We do not mean to
suggest that publishing research is a stepping-stone in the pathway to achieving ground-level impacts, but
simply that it is indicative of the strength of a country’s policy research capacity and moreover of the
strength of the organizational capacity of the institutions where research is conducted.
The strong ability of Mozambique’s researchers to publish in international journals has buoyed its
food policy research capacity, perhaps even overinflating it. Although we average our indicators
geometrically to account for the independence of the dimensions of capacity, this may not have
sufficiently restrained Mozambique’s overall food policy research capacity score. A case study analysis
may shed light on how its research capacity came to be so efficient despite its relatively few researchers
and average government effectiveness and, more importantly, why it has yet to yield food-secure
outcomes.
We find that the number of journal articles is a right-skewed distribution; although research
requires a high initial investment (for example, in data collection, identification of novel research ideas, or
learning how to write publishable journal articles), at some point research investments demonstrate
increasing returns to scale. This is because research projects are rarely isolated initiatives; successful
projects often have several related offshoots that benefit from accumulated knowledge and the sunk costs
of data collection for the original project. South Africa exemplifies this. It has become a hub of research
in Africa, with a strong reputation, and is able to capitalize on its earlier research success and
accumulated resources and expertise to continue producing high-quality research. However, the impacts
of policy research will not be realized unless a country has a strong policy process environment to
translate research results into policies. This enabling environment includes both formal and informal
institutions and the structure and flow of the policy process itself. Due to the difficulty of condensing this
concept into one quantitative measure, we looked to external indexes of public-sector management and
governance, opting for the Worldwide Governance Indicator (WGI) government effectiveness pillar to be
our third indicator. The lack of objective data reflecting a country’s enabling environment, particularly the
inclusiveness, transparency, effectiveness, and impartiality of its policy process, hinders the possibility of
constructing an entirely objective index; but our robustness checks suggest that the WGI is the next best
thing.
The correlations between the three indicators are low: 0.17 between researchers and publications
and 0.11 and 0.51 between the WGI governance effectiveness pillar and publications and researchers,
respectively. This suggests that the dimensions of food policy research capacity identified here are unique
to each other, justifying their inclusion in an aggregated index.
We constructed a Food Policy Research Capacity Index (FPRCI) by standardizing the indicators
and calculating their geometric mean. The index was positively correlated with measures of food security
(67 percent with the Global Hunger Index and 68 percent with the Global Food Security Index). However,
although we measure food policy research capacity, an unmeasured gap remains, comprised of policy
implementation capacity, monitoring and evaluation capacity, and policy revision capacity. This requires
individual and organizational capacity of the entities responsible for implementing or policing policies,
the existence and functioning of a data collection system, data analysts themselves, and commitment of
policymakers and politicians to ensuring that their policies are creating ground-level impacts—a
dimension of informal institutions that goes beyond ownership.
39
Informal institutions, the term given to intangible aspects of culture, society, and history that
govern how people interact with each other in various conditions, are probably the most elusive
dimension of capacity. Personal motivation, work ethic, trust, dedication, and integrity are not only
difficult to measure but also difficult to instill. The causation of these factors and the extent to which they
affect country capacity will vary from country to country, so even if they could be quantified, appropriate
strategies will have to be developed on a case-by-case basis to address the underlying causes of the weak
institutions.
To understand the extent to which informal institutions matter in the context of capacity, further
analysis of how a country’s formal institutions dictate its potential capacity should be undertaken. The
gap between a country’s potential and active capacity will indicate the influence of informal institutions
on its capacity and allow more directed capacity-strengthening efforts.
Our proxy for food policy research outcomes, the Global Hunger Index (GHI) and Global Food
Security Index (GFSI), are measures of food security within a country, which is subject to a number of
factors external to the policy process, such as geography, endowment of natural resources, internal or
external conflict, and socioeconomic factors, among others. This is noted as a reminder of two issues.
First, the FPRCI is not to be indicative of a country’s ability to improve its food security on the whole,
but to highlight some elements that can be improved by political and social will in order to enhance
policies relevant to food security. Second, neither the GHI nor the GFSI can be regarded as perfect
metrics for assessing the impacts of food policy research capacity because of the plethora of other
elements that affect food security outcomes as well as the gap between policy research and policies in
action.
Furthermore, the vastly differing conditions that each country faces with regard to food security
imply that no universally ideal level of capacity exists. Some countries have better growing conditions,
stronger markets, and better economic conditions that lead to a more food-secure population and less need
for strong policy research capacity. The rankings are intended to initiate a discussion on what capacities
are important for different countries and why. The typologies introduced in this paper are intended to
provide additional context for this, in understanding the capacity investments made by countries and how
they translate into efficient policy research environments. The number of different typologies that
emerged from our analysis indicates that capacity-strengthening priorities differ broadly across countries,
with varying outcomes. Two implications emerge from the analysis: (1) Attention should be given to
components of the index with the lowest scores for consideration for concerted efforts to improve country
food policy research capacity, and (2) significant opportunities exist to learn from countries that have
achieved high levels of food policy capacity and from the policies and strategies they implemented.
Furthermore, as exemplified by Swaziland, economies of scale exist in policy research capacity.
Given relatively homogeneous growing conditions, a doubling of a country’s population will require less
than a doubling of its capacity as policy research outcomes will be widely applicable. Conversely, a
country with a high degree of heterogeneity in its agricultural production, geography, climate,
socioeconomic factors, infrastructure, access to communication, technology, and market conditions will
require substantially higher policy research capacity to generate localized, condition-specific policies that
address the differing environments.
Within the cluster of countries that scored low on the FPRCI and demonstrate less than $1,000
agriculture value added per worker, variation is noticeable in the bottlenecks that various African
countries face. These countries must prioritize capacity investments by their lowest-scoring dimension of
capacity. Mozambique exemplifies this: it has fewer researchers than average, high efficiency of its
researchers, and midlevel government effectiveness
Looking cross-country, Rwanda’s highly effective government and low, ineffective human
capacity imply that even minimal investments in improving its human capacity may yield high returns.
Although this research is a starting point to understand how and why countries fall short in their ability to
design effective food policies and understand how similar countries rank, determining effective strategies
to improve their capacity will require further individualized analysis. A country may be short on food
policy researchers simply because of a lack of supply—in which case, it might need to recruit external

40
researchers in the short-term and invest in higher education institutes and scholarship programs in the
long term. If there is a sufficient supply, a country may need to reevaluate the incentives it has in place to
recruit and maintain employees in order to compete with international organizations, the private sector, or
other industries altogether. Sufficient demand for high-quality research to develop evidence-based
policies may also be a restricting factor. There is no one correct method to approach this problem, but a
solid contextual understanding of its current capacity and how it was developed or, in some cases,
diminished will suggest opportunities to move from a capacity assessment to a capacity-strengthening
strategy.

41
8. CONCLUDING REMARKS
Capacity for food policy research and analysis is a key determinant of how evidence-based policies are
conceived, designed, and implemented. Development partners and country governments alike have
attempted to rebuild such capacity in the developing world but with little success. However, several
developing countries have shown increased capacity to do their own research and analysis and effectively
use such capacity to guide the food policy process. By measuring and comparing country capacity for
food policy research, factors that contribute to improved capacity could be identified and strengthened. In
this paper, we document a set of indicators of food policy research capacity collected from a set of 30
developing countries. We use the data collected to generate useful information on where countries stand
compared with their peers in regard to their food policy research capacity, and we develop a typology of
food policy research capacity. Further research will refine these indicators and expand the data collection
to a wider spectrum of countries, particularly more populated countries such as the BRIC countries
(Brazil, Russia, India, and China), Pakistan, and Indonesia. This will aid in generating a benchmark for
food policy research capacity in different geographical and cultural contexts and allow us to test two
hypotheses: first, whether economies of scale in food policy research capacity lead to a decreasing per
capita number of researchers as population increases, and second, whether research hubs develop in more
capable countries, yielding a more-than-linear increase in publications as researchers increase.
42
REFERENCES
ACBF (African Capacity Building Foundation). 2012. African Capacity Indicators 2012. Harare, Zimbabwe.
Acemoglu, D., and M. Dell. 2010. “Productivity Differences between and within Countries.” American Economic
Journal: Macroeconomics, American Economic Association 2 (1): 168–188.
Acemoglu, D., S. Johnson, and J. Robinson. 2002. “Reversal of Fortune: Geography and Institutions in the Making
of the Modern World Income Distribution.” Quarterly Journal of Economics November:117.
Anderson, K., ed. 2009. Distortions to Agricultural Incentives: A Global Perspective, 1955-2007. Washington, DC:
The International Bank for Reconstruction and Development/The World Bank.
Armour, H. O., and D. Teece. 1978. “Organizational Structure and Economic Performance: A Test of the
Multidivisional Hypothesis.” The Bell Journal of Economics 9 (1): 106–122.
Baser, H., and P. Morgan. 2008. Capacity, Change and Performance. Discussion Paper No 59B. Maastricht, the
Netherlands: European Centre for Development Policy Management.
Byerlee, D. 1992. “Technological Change, Productivity, and Sustainability in Irrigated Cropping Systems of South
Asia: Emerging Issues in the Post-Green Revolution Era.” Journal of International Development 4 (5):
477–496.
Caplan, B. 2009. “Against the Human Development Index.” Library of Economics and Liberty. Accessed October
15, 2012. http://econlog.econlib.org/archives/2009/05/against_the_hum.html.
Chandler, A. D. 1992. “Organizational Capabilities and the Economic History of the Industrial Enterprise.” The
Journal of Economic Perspectives 6 (3): 79–100.
Covin, J. G., and D. Slevin. 1991. “A Conceptual Model of Entrepreneurship as Firm Behavior.” Entrepreneurship
Theory & Practice 16: 7–25.
Delgado, C. 1995. Agricultural Transformation: The Key to Broad-based Growth and Poverty Alleviation in Sub-
Saharan Africa. Markets and Structural Studies Division (MSSD) Discussion Paper No.7. Washington,
DC: International Food Policy Research Institute.
Delpeuch, C., and C. Poulton. 2011. Can State Capacity for Agricultural Development Be Compared across
Countries? Insights from Africa. Research Paper 21. London: Climate & Development Knowledge
Network.
Economist Intelligence Unit. 2012. Global Food Security Index 2012: An Assessment of Food Affordability,
Availability and Quality. New York.
Evenson, R., and D. Gollin. 2003. “Assessing the Impact of the Green Revolution, 1960 to 2000.” Science 300
(5620):758–762.
FAO (Food and Agriculture Organization of the United Nations), WFP (World Food Programme), and IFAD
(International Fund for Agricultural Development). 2012. The State of Food Insecurity in the World 2012.
Rome: FAO.
Flaherty, K., and J. M. Munyengabe. 2011. Rwanda: Recent Developments in Agricultural Research (Country Note).
Accessed September 20, 2012. http://www.asti.cgiar.org/pdf/Rwanda-Note.pdf.
Glaeser, E., R. La Porta, F. Lopez-de-Silanes, and A. Shleifer. 2004. “Do Institutions Cause Growth?” Journal of
Economic Growth 9 (3): 271–303.
IEG (Independent Evaluation Group). 2009. The World Bank’s Country Policy and Institutional Assessment: An
Evaluation. Accessed October 15, 2012.
http://siteresources.worldbank.org/EXTCPIA/Resources/cpia_full.pdf.
IFPRI (International Food Policy Research Institute). 2012a. 2011 Global Food Policy Report. Washington, DC.
________. 2012b. 2012 Global Hunger Index, The Challenge of Hunger: Taming Price Spikes and Excessive Food
Price Volatility. Washington, DC.

43
________. 2012c. Women’s Empowerment in Agriculture Index. Accessed October 12, 2012.
www.ifpri.org/sites/default/files/publications/weai_brochure.pdf.
Josling, T. E. and A. Valdes. 2004. Agricultural Policy Indicators. Agriculture and Economic Development
Analysis Division Working Paper No. 04-04. Rome: FAO.
Kaufmann, D., A. Kraay. and M. Mastruzzi. 2010. The Worldwide Governance Indicators: Methodology and
Analytical Issues. Policy Research Working Paper No. 5430. Washington, DC: World Bank.
Kherallah, M., C. Delgado, E. Gabre-Madhin, N. Minot, and M. Johnson. 2000. The Road Half Travelled:
Agricultural Market Reform in Sub-Saharan Africa. Washington, DC: IFPRI.
KPMG and Overseas Development Institute (ODI). 2012. 2012 Change Readiness Index. London: KPMG
International.
Kydd, J. 2009. “A New Institutional Economic Analysis of the State and Agriculture in Sub-Saharan Africa.” In
Institutional Economics Perspectives on African Agricultural Development, edited by J. Kirsten, A.
Dorward, C. Poulton, and N. Vink, 429–460. Washington, DC: IFPRI.
Lele, U., and S. Stone. 1989. Population Pressure, the Environment, and Agricultural Intensification: Variations of
the Boserup Hypothesis. Managing Agricultural Development in Africa (MADIA) Discussion Paper No. 4.
Washington, DC: World Bank.
Marston, G., and R. Watts. 2003. “Tampering with the Evidence: A Critical Appraisal of Evidence-Based
Policymaking.” The Drawing Board: An Australian Review of Public Affairs 3 (3): 143–163.
McGillivray, M., and H. White. 2006. “Measuring Development? The UNDP’s Human Development Index.”
Journal of International Development 5 (2): 183–192.
North, D. 1991. “Institutions.” The Journal of Economic Perspectives 5 (1): 97–112.
Musafiri, I. 2011. Country Brief: Assessment of Organizational Capacity in Food Policy Research and Food
Policymaking in Rwanda 2008–2010. Unpublished. Obtained from author. October 2011.
OECD (Organization for Economic Cooperation and Development). 2005. “Paris Declaration on Aid Effectiveness.”
High Level Forum, Development Assistance Committee, Paris, March.
________. 2008. Handbook on Constructing Composite Indicators: Methodology and User Guide. Paris.
Otoo, S., N. Agapitova, and J. Behrens. 2009. The Capacity Development Results Framework: A Strategic and
Results-Oriented Approach to Learning for Capacity Development. Washington, DC: World Bank.
Polidano, C. 2000. “Measuring Public Sector Capacity.” World Development 28 (5): 805–820.
Porter, M., and S. Stern. 2002. “National Innovative Capacity.” In The Global Competitiveness Report 2001–2002,
edited by K. Schwab, M. Porter, J. Sachs, 102-119. New York: Oxford University Press.
Poulton, C., J. Kydd, and A. Dorward. 2006. “Overcoming Market Constraints on Pro-Poor Agricultural Growth in
Sub-Saharan Africa.” Development Policy Review 24 (3): 243–277.
Ravallion, M. 2010. Mashup Indices of Development. Policy Research Working Paper No. 5432. Washington, DC:
World Bank.
Rehman, S., and H. Askari. 2010. “How Islamic Are Islamic Countries?” Global Economy Journal 10 (2): 1524–
5861.
Richerzhagen, C., and I. Scholz. 2007. “China’s Capacities for Mitigating Climate Change.” World Development 36
(2): 308–324.
Shleifer, A. 2012. “Discussion of Institutions.” Presented at Nobel Symposium on Growth and Development,
Stockholm, Sweden, September 4.
Steets, J. 2008. Adaptation and Refinement of the World Bank’s “Country Policy and Institutional Assessment”
(CPIA). Discussion Paper. Eschborn, Germany: Deutsche Gesellschaft für Technische Zusammenarbeit.

44
Sutcliffe, S., and J. Court. 2005. Evidence-Based Policymaking: What Is It? How Does It Work? What Relevance for
Developing Countries? London: Overseas Development Institute.
Timmer, C. P. 1988. “The Agricultural Transformation.” In Handbook of Development Economics, Volume 1, edited
by H. Chenery and T. N. Srinivason, 275–331. Elsevier Science.
Transparency International. 2011. Corruption Perceptions Index 2011. Berlin.
UNDP (United Nations Development Programme). 2010. Measuring Capacity. Accessed October 12, 2012.
www.undp.org/content/dam/aplaws/publication/en/publications/capacity-development/undp-paper-on-
measuring-capacity/UNDP_Measuring_Capacity_July_2010.pdf.
________. 2010. Monitoring Guidelines of Capacity Development in Global Environment Facility Projects.
Accessed October 12, 2012. www.undp.org/content/dam/aplaws/publication/en/publications/environment-
energy/www-ee-library/mainstreaming/monitoring-cd-gef/Monitoring%20Guidelines%20Report-final.pdf
________. 2012. Human Development Index. Accessed October 12, 2012. http://hdr.undp.org/en/statistics/hdi/
USAID (United States Agency for International Development). 2000. Recent Practices in Monitoring and
Evaluation TIPS: Measuring Institutional Capacity. Center for Development Information and Evaluation
Report. Washington, DC.
Wolff, H., H. Chong, and M. Auffhammer. 2011. “Classification, Detection and Consequences of Data Error:
Evidence from the Human Development Index.” Economic Journal 121 (553): 843–870.
World Bank. 1997. World Development Report 1997: The State in a Changing World, Volume 1. Washington, DC.
RECENT IFPRI DISCUSSION PAPERS
For earlier discussion papers, please go to www.ifpri.org/pubs/pubs.htm#dp. All discussion papers can be downloaded free of charge.
1262. Does freer trade really lead to productivity growth?: Evidence from Africa. Lauren Bresnahan, Ian Coxhead, Jeremy
Foltz, and Tewodaj Mogues, 2013.
1261. Data needs for gender analysis in agriculture. Cheryl Doss, 2013.
1260. Spillover effects of targeted subsidies: An assessment of fertilizer and improved seed use in Nigeria. Lenis Saweda
Liverpool-Tasie and Sheu Salau, 2013
1259. The impact of irrigation on nutrition, health, and gender: A review paper with insights for Africa south of the Sahara.
Laia Domenech and Claudia Ringler, 2013.
1258. Assessing the effectiveness of multistakeholder platforms: Agricultural and rural management councils in the
Democratic Republic of the Congo. Thaddée Badibanga, Catherine Ragasa, and John Ulimwengu, 2013.
1257. The impact of Oportunidades on human capital and income distribution: A top-down/bottom-up approach. Dario
Debowicz and Jennifer Golan, 2013.
1256. Filling the learning gap in program implementation using participatory monitoring and evaluation: Lessons from farmer
field schools in Zanzibar. Elias Zerfu and Sindu W. Kebede, 2013.
1255. Agricultural mechanization in Ghana: Is specialization in agricultural mechanization a viable business model?: Nazaire
Houssou, Xinshen Diao, Frances Cossar, Shashidhara Kolavalli, Kipo Jimah, and Patrick Aboagye, 2013.
1254. A partial equilibrium model of the Malawi maize commodity market. Mariam A. T. J. Mapila, Johann F. Kirsten,
Ferdinand Meyer, and Henry Kankwamba, 2013.
1253. Exchange rate policy and devaluation in Malawi. Karl Pauw, Paul Dorosh, and John Mazunda, 2013.
1252. A regional computable general equilibrium model for Honduras: Modeling exogenous shocks and policy alternatives.
Samuel Morley and Valeria Piñeiro, 2013.
1251. Agricultural trade: What matters in the Doha Round? David Laborde and Will Martin, 2013.
1250. Opportunities and challenges for community involvement in public service provision in rural Guatemala. Johanna Speer
and William F. Vásquez, 2013.
1249. Rising wages in Bangladesh. Xiaobo Zhang, Shahidur Rashid, Kaikaus Ahmad, Valerie Mueller, Hak Lim Lee, Solomon
Lemma, Saika Belal, and Akhter Ahmed, 2013.
1248. How are farmers adapting to climate change in Vietnam?: Endogeneity and sample selection in a rice yield model.
Bingxin Yu, Tingju Zhu, Clemens Breisinger, and Nguyen Manh Hai, 2013.
1247. Evaluating the local economywide impacts of irrigation projects: Feed the Future in Tanzania. Mateusz Filipski, Dale
Manning, J. Edward Taylor, Xinshen Diao, and Angga Pradesha, 2013.
1246. Factor endowments, wage growth, and changing food self-sufficiency: Evidence from country-level panel data . Keijiro
Otsuka, Yanyan Liu, and Futoshi Yamauchi, 2013.
1245. Impact of food price changes on household welfare in Ghana. Nicholas Minot and Reno Dewina, 2013.
1244. Parametric decomposition of the Malmquist Index in an output-oriented distance function: Productivity in Chinese
agriculture. Bingxin Yu, Xiyuan Liao, and Hongfang Shen, 2013.
1243. Extreme weather and civil war in Somalia: Does drought fuel conflict through livestock price shocks? Jean-Francois
Maystadt, Olivier Ecker, and Athur Mabiso, 2013.
1242. Evidence on key policies for African agricultural growth. Xinshen Diao, Adam Kennedy, Ousmane Badiane, Frances
Cossar,Paul Dorosh, Olivier Ecker, Hosaena Ghebru Hagos, Derek Headey, Athur Mabiso, Tsitsi Makombe, Mehrab
Malek, and Emily Schmid, 2013.
1241. A global assessment of the economic effects of export taxes. David Laborde, Carmen Estrades, and Antoine Bouёt, 2013.
1240. The Women’s Empowerment in Agriculture Index. Sabina Alkire, Ruth Meinzen-Dick, Amber Peterman, Agnes R.
Quisumbing, Greg Seymour, and Ana Vaz, 2012.

INTERNATIONAL FOOD POLICY RESEARCH INSTITUTE
www.ifpri.org
IFPRI HEADQUARTERS
2033 K Street, NW Washington, DC 20006-1002 USA Tel.: +1-202-862-5600 Fax: +1-202-467-4439 Email: [email protected]