Measuring efficiency of lean six sigma project ...
22
Journal of Industrial Engineeringand Management JIEM, 2013 – 6(2): 401-422 – Online ISSN: 2013-0953 – Print ISSN: 2013-8423 http://dx.doi.org/10.3926/jiem.582 Measuring efficiency of lean six sigma project implementation using data envelopment analysis at NASA David Meza, 1 Ki-Young Jeong 2 1 National Aeronatics and Space Administration - Johnson Space Center 2 University of Houston-Clear Lake (United States) [email protected] , [email protected] Received: November 2012 Accepted: January 2013 A bstract: Purpose: This study aims to review the implementation of the Lean Six Sigma project methodology in the Johnson Space Center (JSC) business environment of National Aeronautics and Space Administration (NASA) with an objective of evaluating performance of individual projects and to develop recommendation for strategies to improve operational efficiencies based on Data Envelopment Analysis (DEA). Design/methodology/approach: In this study, authors propose the Lean Six Sigma project performance evaluation model (LSS-PPEM) based on Data DEA where Critical Success Factors (CSFs) and Total Team Hours serve as inputs while Process Sigma and Cost avoidance are used as outputs. The CSFs are factors that critically affect the performance of LSS at JSC. Six of those are identified by the Black Belts through Analytical Hierarchical Process, and the values of those are decided by project leaders and Green Belts through survey. Eighteen LSS projects are evaluated, and their results are analyzed. Findings: Eventually, four out of the six CSFs are adopted for this study based upon Pearson correlation analysis, and those four include Project execution and follow up of results; Top management’s commitment and participation; The use of data analysis with easily obtainable data; Attention given to both long and short term targets. Using data between the years 2009 and 2011, seven of the eighteen projects are found to be efficient. The benchmark analysis and slack analysis are conducted to provide further recommendation for JSC managers. Three out of those seven efficient projects are most frequently used as an efficient peer. -401-
Transcript of Measuring efficiency of lean six sigma project ...

Journal of Industrial Engineering and ManagementJIEM, 2013 – 6(2): 401-422 – Online ISSN: 2013-0953 – Print ISSN: 2013-8423
http://dx.doi.org/10.3926/jiem.582
Measuring efficiency of lean six sigma project implementation using
data envelopment analysis at NASA
David Meza,1 Ki-Young Jeong2
1National Aeronatics and Space Administration - Johnson Space Center2University of Houston-Clear Lake (United States)
[email protected], [email protected]
Received: November 2012Accepted: January 2013
Abstract:
Purpose: This study aims to review the implementation of the Lean Six Sigma project
methodology in the Johnson Space Center (JSC) business environment of National Aeronautics
and Space Administration (NASA) with an objective of evaluating performance of individual
projects and to develop recommendation for strategies to improve operational efficiencies
based on Data Envelopment Analysis (DEA).
Design/methodology/approach: In this study, authors propose the Lean Six Sigma project
performance evaluation model (LSS-PPEM) based on Data DEA where Critical Success
Factors (CSFs) and Total Team Hours serve as inputs while Process Sigma and Cost avoidance
are used as outputs. The CSFs are factors that critically affect the performance of LSS at JSC.
Six of those are identified by the Black Belts through Analytical Hierarchical Process, and the
values of those are decided by project leaders and Green Belts through survey. Eighteen LSS
projects are evaluated, and their results are analyzed.
Findings: Eventually, four out of the six CSFs are adopted for this study based upon Pearson
correlation analysis, and those four include Project execution and follow up of results; Top
management’s commitment and participation; The use of data analysis with easily obtainable
data; Attention given to both long and short term targets. Using data between the years 2009
and 2011, seven of the eighteen projects are found to be efficient. The benchmark analysis and
slack analysis are conducted to provide further recommendation for JSC managers. Three out
of those seven efficient projects are most frequently used as an efficient peer.
-401-

Journal of Industrial Engineering and Management – http://dx.doi.org/10.3926/jiem.582
Practical implications: Traditionally, DEA has been considered as a data-driven approach. In this
study, authors incorporate the survey-based CSFs into the DEA frame. Since many
organizations may have different CSFs, the framework presented in this study can be easily
applied to other organizations.
Originality/value: This study provides a DEA-based framework and case study of LSS project
evaluation in the government sector, which is very unique application to author’s best
knowledge. The framework is unique in terms of its input factor selection and quantification
procedures.
Keywords: performance measurement, Data Envelopment Analysis; Lean Six Sigma; government sector
1. Introduction
Lean Six Sigma (LSS) is an integrated business process improvement methodology where Lean
Manufacturing and Six Sigma systems are combined to improve the quality of business
processes through elimination of any non-value adding activities or wastes. LSS has generated
substantial benefits and savings within the private sector. For example, the application of LSS
within the private sector has proven profitable to companies such as Lockheed Martin, $5
million savings on one project and Stanford Hospital and Clinics, lowering their material costs
by $25 million. GE credits LSS in adding $2 billion in profits to the 1999 total of $10.7 billion,
and ITT Industries increased profits by $130 million in the second year of their LSS
implementation (George, 2003).
Government agencies have surveyed private industry when those come to improving the
processes of delivering services related to their mission. Methodologies such as TQM, Just-In-
Time, and Plan Do Check Act (PDCA) have been used with some success over the years.
However, these programs have generally failed due to an inability to properly quantify their
performance. The most recent move toward continuous improvement methodologies has
steered many government agencies into utilizing LSS for process improvement. The Johnson
Space Center (JSC) at Houston, one of the National Aeronautics and Space Administration
(NASA) centers, embarked on an initiative to implement LSS in 2009 across the Center in an
effort to improve operational results.
In general, LSS programs in the private sector can easily be measured in monetary terms
given the implementers clear definition of the success of the program. However, the story
changes within the public sector, where profit is not a motivating factor. Instead a government
organization has a primary goal of completing its mission assigned to it by the current US
government administration. Government agencies operate under a controlled budget where
profit is not a motivating factor, instead each organization within the agency is held
accountable for meeting its performance metrics in relation to reaching the agency's mission.
-402-

Journal of Industrial Engineering and Management – http://dx.doi.org/10.3926/jiem.582
The government budget process is structured in such a way as to encourage the spending of
allocated funds instead of cost savings or profit generation. Hence, some managers regard cost
savings or avoidance as a potential loss in their budget because senior management could
decide to use the savings elsewhere. Bissell, Garcia and Telles (2006) identified this as a
uniquely governmental issue. They noted that savings realized by process improvement were
often consumed by preplanned budget cuts by headquarters eliminating the possibility of any
reinvestment. Therefore, offices involved in the process improvement were not able to share or
benefit in the cost savings. They concluded that it must be made clear that increases in
efficiency and elimination of waste are the true benefits to the government, and this fact
should not be seen as a disincentive despite the probable lack of direct tangible benefit to the
saver.
This study aims to review the implementation of the LSS methodology in the JSC business
environment with an objective of evaluating performance of individual projects and to develop
recommendation for strategies to improve operational efficiencies.
1.1. Lean Six Sigma at NASA-JSC
The JSC was established in 1961 as the Manned Spacecraft Center and, in 1973, renamed in
honor of the late President and Texas native, Lyndon B. Johnson. From the early Gemini, Apollo
and Skylab projects to today’s space shuttle, International Space Station and Exploration
Programs, the center continues to lead NASA’s efforts in human space exploration. The Center
resides on 1,620 acres with over 100 buildings housing the civil service and contractor
workforce. The JSC civil service workforce consists of about 3,000 employees, the majority of
whom are professional engineers and scientists. About 50 companies provide contractor
personnel to JSC with more than 12,000 contractors working onsite or in nearby office
buildings and other facilities. JSC’s organization structure is divided into 19 programmatic and
institutional directorates supporting the overall NASA’s mission. Each directorate is broken
down into multiple divisions then branches and in some cases, to project team levels. While
each directorate is committed to meeting JSC’s mission, directors are given latitude in how
they chose to manage. This is an important perception to understand as management
philosophy and tactics have been observed to vary from group to group, from the highest to
the lowest. This provides a great deal of complexity in implementing a continual improvement
methodology, such as LSS. Furthermore, there are 109 identified business functions that
spread out across the directorates. Each business function has tens of documented processes,
bringing the total to several thousand processes which can be reviewed for improvement.
The primary objectives of LSS at JSC are to enhance mission success, improve on cost quality
and schedule, reduce variability, and enable consistently high quality products and services. To
accomplish this, NASA decided to focus its LSS events on product/process development
Kaizens and Value Stream Mapping (VSM) instead of the more traditional Design, Measure,
Analyze, Improve and Control (DMAIC) project approach. A “Kaizen event” is a short-term (3
-403-

Journal of Industrial Engineering and Management – http://dx.doi.org/10.3926/jiem.582
to 5 days) team-based improvement project focused on eliminating waste in and increasing
the performance of a specific process or product line, through low cost, creativity-based
solutions (Melnyk, Calantone, Montabon & Smith, 1998; Bicheno, 2001). Kaizen events are
often associated with the implementation of lean production practices (Vasilash, 1997; Kirby &
Greene, 2003) and often employ lean concepts and tools such as, Value Stream Mapping,
Failure Mode Effect Analysis, and Work Standardization (Bodek, 2002; Melnyk et al. 1998;
Oakeson, 1997).
During this Kaizen event period, participants spend 100% of their time on the project and are
removed from the regular responsibilities, while e-mails, voicemails, and other distractions are
minimized or forbidden. Additionally Black Belts and team leads in conjunction with the
sponsor and champion develop a well-defined project charter and scope prior to the event. All
basic data to evaluate the process is gathered by the Black Belt or team lead prior to the
event. At the conclusion of the event the proposed solutions are acted upon immediately. The
rationale for this method is the belief of doing something now, which is roughly right, is better
versus waiting the 3 to 6 months it normally takes for the standard DMAIC approach.
1.2. Motivation and Problem Descriptions
This study analyzes the performance of LSS projects implemented at the National Aeronautics
and Space Administration-Johnson Space Center (NASA-JSC). JSC’s initiative to infuse lean
principles into the Directorates has been slowed by management acceptance and
understanding. While a majority of the managers have received training as to the methodology
and benefits of LSS, there is an apparent reluctance to implement within their offices due to a
lack of understanding of how to gauge the success of the projects in terms a government
program manager can relate with. Hence, it would be very useful to systematically evaluate
and analyze the performance of LSS conducted at JSC. This systematic evaluation approach
includes some common factors which critically affect the performance of the LSS, and the
project evaluation method.
From a project standpoint, NASA uses the Earned Value Management (EVM) as a means to
measure performance. EVM provides a mechanism for measuring the performance of the
project against its stated baseline. As long as the project meets the milestones set forth in the
project plan, within scope, schedule and budget, it is deemed successful. However, EMV cannot
be used to measure how efficiently a project applied its resources or how it is compared with
other projects in the same domain. Lean projects differ from traditional projects since they
generally do not deliver a unique product but rather are conducted to remove waste and
variation within processes. Hence, since both cost savings and EVM fail to adequately measure
the true benefit achieved by implementing Lean Six Sigma, a different methodology is
required.
A key criterion in understanding the value of a LSS project is to determine how well it has been
implemented within an organization. To understand this, one would need to identify and
-404-

Journal of Industrial Engineering and Management – http://dx.doi.org/10.3926/jiem.582
prioritize the important attributes or critical success factors (CSFs) which significantly affect
the LSS project performance. Then, the identified CSFs can be viewed as key input factors to
the LSS project performance evaluation model (LSS-PPEM). In this study, authors used the
Analytical Hierarch Process (AHP)-based survey to identify and prioritize the critical success
factors. The critical success factors necessary for implementing a successful LSS project have
been discussed in detail in a subsequent section.
The LSS-PPEM is to compare the efficiency of one LSS project to others based on CSFs and
other input and output factors. This comparison will give JSC managers insights into the value
that the LSS project contributes to the Center. Data Envelopment Analysis (DEA) lends itself to
this problem as it provides a model to measure the relative efficiency in situations where there
is no clear approach of aggregating pre-determined multiple inputs and outputs into a
meaningful index of productive efficiency. Based on the results of the DEA, organizational-wide
efficiency can be evaluated and ranked. In DEA, the organization under study is called a
decision making unit (DMU). Generically, a DMU is regarded as the entity responsible for
converting inputs into outputs and whose performances are to be evaluated – each LSS project
in this study. For the purpose of securing relative comparisons, a group of DMUs is used to
evaluate each other with each DMU having a certain degree of managerial freedom and
decision making (Cooper, Seiford & Tone, 2007).
The specific objective of this study is to develop a LSS-PPEM using AHP-based survey and DEA
to provide a mechanism for JSC – possibly for government agencies – to measure the
performance of LSS process improvement projects. This study provides several benefits to JSC.
Some of them include 1) it can provide a JSC-specific LSS-PPEM based on its own CSFs; 2) the
results from LSS-PPEM can provide specific benchmark opportunities among DMUs in terms of
inputs and outputs, allowing JSC management insights into possible inefficiencies in systems
and management techniques across the Center; 3) this method can be extended into other
government agencies.
-405-

Journal of Industrial Engineering and Management – http://dx.doi.org/10.3926/jiem.582
2. Introduction
2.1. Critical Success Factors
Rockart (1979) defined CSFs as “the limited numbers of areas in which results, if they are
satisfactory, will ensure competitive performance for the organization”. Brotherton and Shaw
(1996) defined CSFs as the essential things that must be achieved by the company or which
areas will produce the greatest “competitive leverage”. They emphasized that CSFs are not
objectives, but are the actions and processes that can be controlled or affected by
management to achieve the organization’s goals. They also stated that the CSFs are not static,
but depend on a combination of where the organization is and where it wants to be. This
definition again comes from the private (service) sector and is more a way of managing rather
than an assessment of a project’s success. Both definitions emphasize gaining a competitive
edge, which is not a feature of public sector organizations. Boynton and Zmud (1984) defined
CSFs as “those few things that must go well to ensure success”. This is a more universal
definition which is equally applicable to both the public and private sectors and not restricted
to a particular type of project. The importance of defining the CSF for implementation is to
increase the success rate, reduce costs and prevent disillusionment with continuous
improvement programs.
There are several models of CSFs for the deployment of LSS projects in the literature, and
those include various factors identified as critical for success in deploying Six Sigma projects,
each of the following authors proposed a different model: Zu, Fredendall and Douglas (2008),
Su and Chou (2008), Schroeder, Lindermana, Liedtkeb and Choo (2008), Choo, Linderman and
Schroeder (2007), Kwak and Anbary (2006), and Smith (2003).
No Critical Success Factor
1 Top management’s commitment and participation
2 Business strategy based on customer demands
3 Establishment of the Six Sigma framework
4 Project execution and follow-up of the results follow-up of the results
5 Investment of essential resources
6 Investment and training framework for trainers and mentors (such as Black Belts)
7 Incentive/Reward system
8 The use of data analysis with data that is easily obtainable
9 Attention given to both long and short term targets
10 Coordination with knowledge management system
11 Project meshes with company’s business strategy
12 Cooperation and Communications
13 Utilization of Six Sigma tools
Table 1. List of Critical Success Factors studies (Ho et al., 2008)
With a growing demand for the measurement of LSS implementations, arises the overall goal
of this research, to develop a LSS-PPEM based on the most influential CSFs exhibited by the
-406-

Journal of Industrial Engineering and Management – http://dx.doi.org/10.3926/jiem.582
organization. The research by Ho, Chang and Wang (2008) highlighted 13 CSFs out of Six
Sigma, citing several authors who mentioned each CSF. The study includes a literature review
period from 2000 to 2005. The 13 CSFs are listed in Table 1 below. Studies on critical success
factors related to Six Sigma and LSS implementation conducted by Coronado and Anthony
(2002), Burton and Sams (2005), Furterer (2004) and Hayes (2002) identified many of the
factors highlighted by Ho et al. (2008). Based on the review of literature of the CSFs, authors
accept the factors identified and displayed below as those factors that must be embodied
within an organization to ensure the successful implementation of a LSS project.
2.2. Data Envelopment Analysis for LSS
DEA has been widely researched over the last 30 years. Emrouznejad, Parker and Tavares
(2008) provided a compilation of most of the references published in the field of DEA from
1978 through 2007. The article demonstrated the growth of DEA as an accepted operational
tool in a diverse set of fields. Banking, education (including higher education), health care, and
hospital efficiency were found to be the most popular application areas. In total, 2500 distinct
authors have been identified, with the average number of authors per publication being nearly
two. Based on approximately 75% of the database, about 2000 distinct keywords were found,
with an average of 3.5 per publication as seen in Table 2.
List of the most popular keywords by number or publication
Keywords No. of
publications
Keywords No. of
publications
DEA or Data Envelopment Analysis 1637 Mathematical programming 118
Efficiency 558 Optimization 112
Decision making unit(s) 392 Health care or hospital 103
Linear programming 341 Multivariate analysis 89
Decision theory 269 Production 84
Mathematical models 216 Parametric 80
Productivity 215 Benchmarking 78
Operations research 215 Regression analysis 76
Economics 192 Production control 73
Management 181 Statistical models or methods 72
Performance (management or evaluation) 176 Humans resources allocation 61
Bank or banking 135 Statistical analysis 58
Nonparametric 120 Education 44
Technical efficiency 120 Nonparametric statistics 40
Table 2. DEA popular key words (Excerpted from Emrouznejad, et.al., 2008)
An exploration of the keywords discovered that only 43 of the over 4000 articles were
regarding the use of DEA in a government environment, be it municipality, state or federal.
Many of those articles pertained to efficiency in accounting practices, employment issues,
policy concerns and spending. Hence, authors attempted to search articles that applied DEA to
a project for the evaluation purpose. Ferris, Groesbeck, Aken and Letens (2006) applied DEA
-407-
Journal of Industrial Engineering and Management – http://dx.doi.org/10.3926/jiem.582
to evaluate the performance of engineering design projects. They addressed that DEA could fill
a gap not addressed by common project evaluation by comparing a project to its peers with
similar characteristics. Linton, Morabito and Yeomans (2007) applied DEA to assess, analyze,
and prioritize R&D project. Eliat, Golany and Shtub (2008) embedded the balanced score card
in DEA to evaluate the R&D project. All authors mentioned above used a project as a DMU in
DEA.
Few articles were found with the keyword of process improvement and one combining the use
of DEA and Six Sigma. Kumar, Saranga, Ramírez-Márquez and Nowicki (2007) applied DEA as
a method for the selection of Six Sigma projects. More recently, Feng and Anthony (2009)
proposed integrating DEA into the Six Sigma framework adding it as a tool for Black Belts.
Lengacher (2010) wrote an exploratory article for iSixSima extoling the benefits of DEA as a
method to calculate the efficiency of process improvement. Yüksel (2012) also claimed that
DEA can be applied to evaluate Six Sigma projects and however, he also addressed that this
application was not much discussed in the literature. To the best knowledge of authors in the
review of the literature, authors feel that the application of DEA to LSS was not much studied.
3. Overall research procedure
3.1. Overview of research methodology
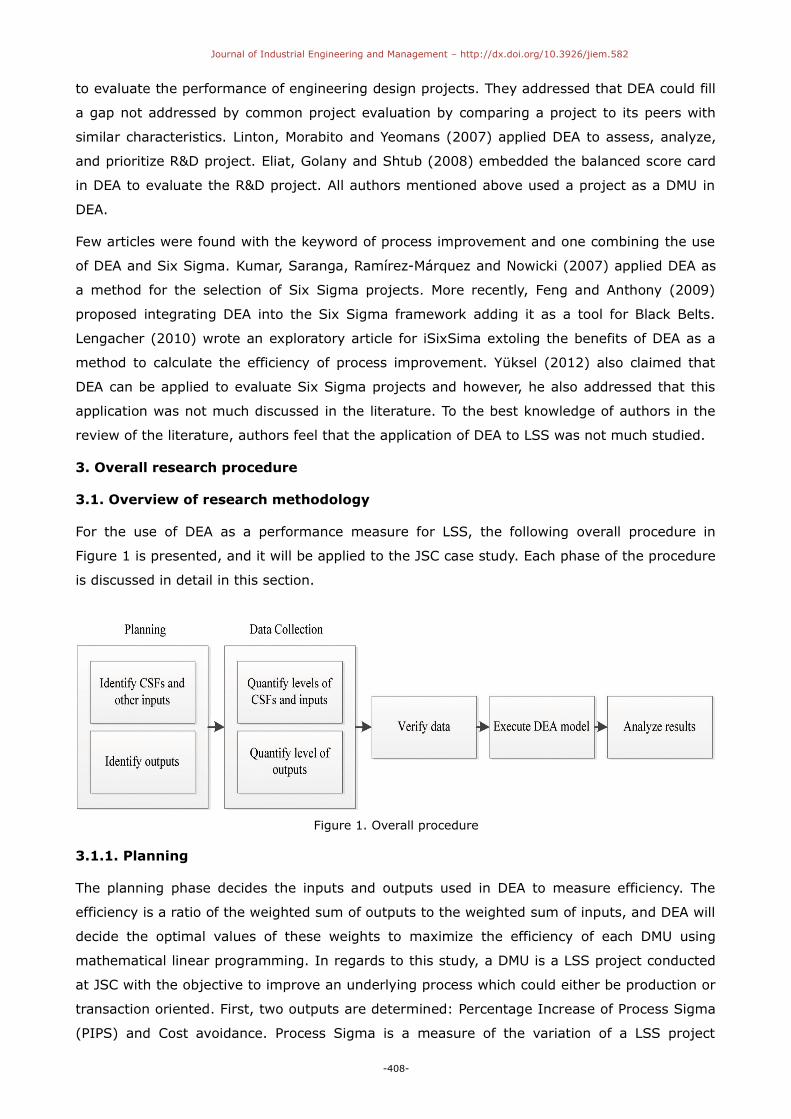
For the use of DEA as a performance measure for LSS, the following overall procedure in
Figure 1 is presented, and it will be applied to the JSC case study. Each phase of the procedure
is discussed in detail in this section.
Figure 1. Overall procedure
3.1.1. Planning
The planning phase decides the inputs and outputs used in DEA to measure efficiency. The
efficiency is a ratio of the weighted sum of outputs to the weighted sum of inputs, and DEA will
decide the optimal values of these weights to maximize the efficiency of each DMU using
mathematical linear programming. In regards to this study, a DMU is a LSS project conducted
at JSC with the objective to improve an underlying process which could either be production or
transaction oriented. First, two outputs are determined: Percentage Increase of Process Sigma
(PIPS) and Cost avoidance. Process Sigma is a measure of the variation of a LSS project
-408-

Journal of Industrial Engineering and Management – http://dx.doi.org/10.3926/jiem.582
performance (e.g., lead time reduction, defects etc.) in a project relative to the project
customer requirements. The higher Process Sigma, the fewer defects. Cost avoidance
represents the expected amount of cost saving due to the project. Although there is no exact
rule or guideline in selecting inputs and outputs, Malhotra, Malhotra and Lermack (2009)
suggested that the level of resources or factor to be minimize should be considered as the
inputs while the level of economic variable factors and the degree of their contribution to the
overall efficiency should be considered as the outputs. From this perspective, the selection of
outputs seems to be very intuitive and straightforward. However, some input factor
identification is not so straightforward. First, authors select the Total Team Hours (TTH) spent
as an input since it well represents amount of efforts spent for a project – TTH represents the
total calendar hours spent by teams to complete a project. Now, authors need to identify what
CSFs are meaningful in JSC. For this, authors initially consider 14 CSFs – note that we add
‘efficiency of training materials’ as an additional factor to those 13 factors listed in Table 1
based on several Black Belts’ opinions during the planning phase.
However, the use of 15 inputs – 14 CSFs and TTH – into the DEA model posed an issue. As the
number of inputs and outputs increases, the power of DEA decreases, to some degree.
Malhotra et al. (2009) suggested that the number of samples is greater than or equal to two to
three times of the total number of the inputs and outputs to appropriately utilize the power of
DEA. Hence, meaningful inputs and outputs selection should be undertaken before DEA
implementation. Since TTH is considered as an important quantitative factor, authors decide to
keep it. Instead, authors decide to identify the relevant CSFs from those 14 CSFs. At JSC, each
unique project has a project lead supported by a LSS Black Belt and Green Belt. The project
lead is responsible for the execution and implementation of the project, while the Black Belt
and Green Belt are responsible for facilitating the event and assisting in deriving the
improvement by using the LSS tool set. Hence, a questionnaire based on the Analytical
Hierarchal Process (AHP) is sent to all Black Belts, as the recognized experts in their area on
LSS.
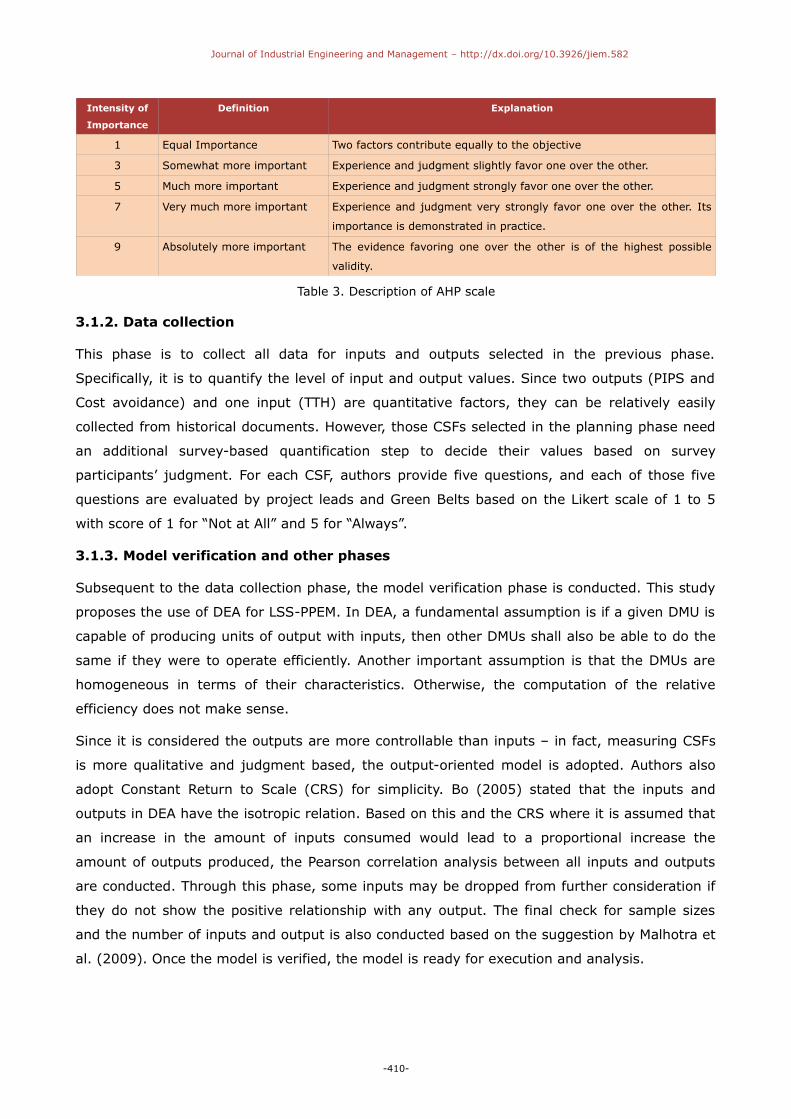
AHP is a decision analysis approach developed by Saaty (1980). AHP is capable of extracting
the judgment of multiple experts and decision makers, and is mainly applicable to handling the
problems arising in an uncertain environment in which multiple evaluation criteria exist. It
conducts the pair-wise comparison of any two objects based on the scale displayed in Table 3.
Any Consistency Ratio (CR) greater than 10%, the decisions are considered unreliable because
they are too close to randomness and the exercise is insignificant or must be repeated.
Readers are encouraged to refer to Saaty (1980) for further details for AHP. The AHP results
provide a prioritized ranking and weight of the importance of the CSFs to events conducted in
the Black Belt’s area. The acquired weight distribution is expected to be more objective than
setting the weight for individual factors. A Pareto chart is constructed using the results of the
AHP questionnaires, and the top 70% CSFs are selected as meaningful inputs.
-409-
Journal of Industrial Engineering and Management – http://dx.doi.org/10.3926/jiem.582
Intensity of
Importance
Definition Explanation
1 Equal Importance Two factors contribute equally to the objective
3 Somewhat more important Experience and judgment slightly favor one over the other.
5 Much more important Experience and judgment strongly favor one over the other.
7 Very much more important Experience and judgment very strongly favor one over the other. Its
importance is demonstrated in practice.
9 Absolutely more important The evidence favoring one over the other is of the highest possible
validity.
Table 3. Description of AHP scale
3.1.2. Data collection
This phase is to collect all data for inputs and outputs selected in the previous phase.
Specifically, it is to quantify the level of input and output values. Since two outputs (PIPS and
Cost avoidance) and one input (TTH) are quantitative factors, they can be relatively easily
collected from historical documents. However, those CSFs selected in the planning phase need
an additional survey-based quantification step to decide their values based on survey
participants’ judgment. For each CSF, authors provide five questions, and each of those five
questions are evaluated by project leads and Green Belts based on the Likert scale of 1 to 5
with score of 1 for “Not at All” and 5 for “Always”.
3.1.3. Model verification and other phases
Subsequent to the data collection phase, the model verification phase is conducted. This study
proposes the use of DEA for LSS-PPEM. In DEA, a fundamental assumption is if a given DMU is
capable of producing units of output with inputs, then other DMUs shall also be able to do the
same if they were to operate efficiently. Another important assumption is that the DMUs are
homogeneous in terms of their characteristics. Otherwise, the computation of the relative
efficiency does not make sense.
Since it is considered the outputs are more controllable than inputs – in fact, measuring CSFs
is more qualitative and judgment based, the output-oriented model is adopted. Authors also
adopt Constant Return to Scale (CRS) for simplicity. Bo (2005) stated that the inputs and
outputs in DEA have the isotropic relation. Based on this and the CRS where it is assumed that
an increase in the amount of inputs consumed would lead to a proportional increase the
amount of outputs produced, the Pearson correlation analysis between all inputs and outputs
are conducted. Through this phase, some inputs may be dropped from further consideration if
they do not show the positive relationship with any output. The final check for sample sizes
and the number of inputs and output is also conducted based on the suggestion by Malhotra et
al. (2009). Once the model is verified, the model is ready for execution and analysis.
-410-

Journal of Industrial Engineering and Management – http://dx.doi.org/10.3926/jiem.582
4. Implementation of overall research procedure
The overall research procedure in the previous section is applied to the JSC. 51 LSS projects
were conducted between March of 2009 and December of 2011. Of that total, 30 projects were
for process improvement. Project leads, Black Belts, Green Belts of these events were asked to
participate in the questionnaires and surveys. All data was gathered during the normal course
of operations. Participants were sent an email containing either a questionnaire or survey
depending on their participation in the project. All information was gathered between
September 2012 and December 2012. While JSC management supported the effort, no
direction was given to event participants requiring them to submit responses. The timing of the
data gathering could pose a bias in the study. Some of the responses were for projects
conducted over a year ago.
4.1. AHP questionnaire
To identify and prioritize the CSFs, a macro enabled Excel® spreadsheet was developed
establishing a pair-wise comparison matrix of the 14 CSFs. The spreadsheet is coded to accept
a value or judgment in a cell based on the AHP rating scale and automatically inserts the
reciprocal value in the corresponding cell. The spreadsheet calculates the priority vector and
eigenvalue as the participant completes the form as well as CR. All cells other than those
requiring input by the participant were locked. The spreadsheet was sent to a total of 67 civil
servants and contractor Black Belts across JSC with a request to complete and return within a
week. They were instructed to maintain CR value less than or equal to 10% while they rate the
CSFs based on their expert perception of its importance in the success of a LSS project. Thirty-
three forms were returned and evaluated. The ratings from each Black Belt were totaled and
averaged across the comparison matrix to create a prioritized ranking of each CSF. Table 4
displays the final ranking of the CSFs. The calculated CR for the matrix result was 0.071.
Therefore the judgments are considered trustworthy and reliable. As noted above, DEA loses
some of its power when too many inputs and outputs are used. To solve this, a decision was
made to use the top 70 percentile of the CSFs in the DEA model. The bold type in Table 4
indicates the resultant set of CSFs used in the subsequent survey.
-411-

Journal of Industrial Engineering and Management – http://dx.doi.org/10.3926/jiem.582
CSF AHP Rating
1. Project execution and follow up of results 16.4%
2. Top management’s commitment and participation 14.9%
3. Business strategy based on customer demands 13.2%
4. Investment of essential resources 10.9%
5. The use of data analysis with data that is easily obtainable 7.4%
6. Attention given to both long and short term targets 7.0%
7. Investment and training framework for trainers and mentors 5.9%
8. Project aligns with JSC's and/or Directorate business strategy 5.6%
9. Cooperation and communication 5.6%
10. Establishment of the Lean Six Sigma Framework 4.3%
11. Utilization of Lean Six Sigma tools 3.1%
12. Efficacy of training material 2.3%
13. Incentive / Reward system 1.8%
14. Coordination with knowledge management system 1.6%
Overall Consistency Index: 7.1%
Table 4. Final CSF ranking
4.2.1. CSF Input measure survey
Upon identifying the top CSFs, the following survey in Table 5 was sent out to quantify the
level of each CSF. The survey consisted of 6 critical success factors with 5 items each, a total
of 30 questions. A Likert scale of 1 to 5 was used with a score of 1 for “Not at All” and 5 for
“Always”. The survey validation was done by the Cronbach’s Alpha test.
As previously described, surveys representing 18 projects were returned by the Project Lead,
Green Belt or both in the time frame required. The survey validation was tested with the
Cronbach alpha coefficient, with an overall result of 0.8976. The Cronbach alpha coefficient
value for each CSF was also larger than 0.89 for all CSFs, indicating that the questionnaire is
reliable. Using the Likert scale described above, participants entered a value for each set of
questions per CSF. The questions were designed to gauge the CSF level the survey participants
observed within their organization.
The scores for each CSF were averaged and divided by 5, the maximum Likert value, to derive
a percentage ranking. Table 6 illustrates the survey results from one project. In this particular
organization, it is observed that business strategy that focuses on customer demand (CSF3)
and a willingness to invest in resources (CSF4) are high, however top management
commitment (CSF2) is below 70%, which could possibly explain why project execution and
follow up of results is below 50%. If top management is not fully committed, then why should
project leads expend resources on execution and follow up. The calculated levels of the CSF for
each project will be used as the input values for the DEA model.
-412-

Journal of Industrial Engineering and Management – http://dx.doi.org/10.3926/jiem.582
CSF Evaluating Questions
1. Project
execution and
follow up of
results
• I must regularly report on my Green Belt project’s progress
• After my Green Belt project is completed, I am required to report the results of its
implementation
• My manager or the Black Belt in charge comes to me and asks about the execution and progress
of my Green Belt project
• Black Belts submit yearly reviews of the results of Green Belt projects
• If a Green Belt’s project is behind schedule, he/she must submit a report explaining why
2. Top
management’s
commitment
and
participation
• Top management periodically requests a report on my Green Belt project progress
• I can ask for management assistance when I encounter problems with my Green Belt project
• Top management requires organizations to carry out Green Belt projects
• Top management requires that each organization regularly report on the progress of Green Belt
projects
• Top management will assign organizations to carry out specific Green Belt projects
3. Business
strategy based
on customer
demands
• My Green Belt project is related to customer demands
• I know what kind of customer demands our department needs to satisfy
• My organization regularly researches customer demands
• My organization regularly reviews customer complaints
• My organization's strategy is based on customers’ demands and complaints
4. Investment
of essential
resources
• If I need manpower assistance to complete my Green Belt improvement project, my manager
will help coordinate this
• If items need to be purchased for my Green Belt project, I can request my manager’s assistance
in procuring them
• My company will adjust my workload to ensure that I have sufficient time to complete my Green
Belt project
• My company allows me to work overtime (credit or comp time) to complete my Green Belt
project
• My manager will help me obtain any resources needed for my Green Belt project
5. The use of
data analysis
with data that
is easily
obtainable
• The data needed for the analysis of my Green Belt project are easy to obtain
• I can find relevant data in my company’s database
• All data from daily work is recorded
• When data is needed but not available, I can ask the IT department or members of the Green
Belt project for assistance
• There are guidelines for data preservation that I must follow while working on my Six Sigma
project
6. Attention
given to both
long and short
term targets
• My Green Belt project is related to my organization's long-term goals (2 or more years)
• My Green Belt project is related to my organization's short-term goals (less than 1 year)
• One of the foremost considerations in selecting a Green Belt project is whether it can be easily
completed
• My Green Belt project is related to my daily work
• Following evaluation of a proposed project, if the project is considered beneficial, it will be
carried out, even if more than a year is needed to complete it
Table 5. Survey questions for evaluating CSF level
-413-

Journal of Industrial Engineering and Management – http://dx.doi.org/10.3926/jiem.582
Critical Success Factor Organizational Level
CSF1 Project Execution and Follow up of results 0.48
CSF2 Top management's commitment and participation 0.68
CSF3 Business Strategy based on customer demands 0.80
CSF4 Investment of essential resources 0.80
CSF5 The use of data analysis with data that is easily obtainable 0.60
CSF6 Attention given to both long term and short term targets. 0.68
Table 6. Sample CSF level score
It is important to recognize that CSFs are qualitative factors. Qualitative factors may work
differently from the quantitative factors in terms of their intensity and magnitude. For
example, 4 in the Likert scale does not necessarily mean that its intensity or magnitude is
higher than 2 by two times. Several authors have recently proposed diverse DEA models to
overcome the limitation of the standard DEA with the qualitative factors. However, none of
those can completely manage all issues regarding the qualitative factors. Hence, instead of
using those DEA models, authors assumed that all Likert scales can be treated in a numerical
sense. Cooper, Seiford and Shu (2011) stated that this is one approach and used by some
marketing researchers.
4.2.2 Model verification
The Pearson correlation analysis was conducted on the data to determine if any of the inputs
could have negative effect on the DEA model, and the results were shown in Figure 2 and Table
7. The analysis revealed CSF 3, Business Strategy based on customer demands and CSF 4,
Investment of essential resources, have a negative correlation to one of the outputs. A
decision was made not to include them in the final DEA model. Hence, the final total number of
inputs and outputs became seven, and 18 samples (DMUs) are available. Therefore, it still
satisfies the recommendation from Malhotra et al. (2009).
In terms of homogeneity of DMUs, all DMUs evaluated here were from a collection of Lean Six
Sigma projects conducted at JSC using the same Kaizen or rapid improvement procedure. All
the events addressed JSC service-oriented transactional business processes operating within a
specific Directorate, Division or Branch. In a few cases, the processes were Center wide or
spanned across Divisions, however, none went outside JSC. Similar resources and activities
were required to operate within the processes to produce the end product(s). The teams
worked under the same guidelines, requiring the generated solutions capable of
implementation within a 3 to 6 month time frame. The solutions requiring a longer time frame
to implement were put on hold for future evaluation. In-house Black Belts and Green Belts,
similarly trained in NASA’s Lean Six Sigma approach, facilitated the events. The combination of
these characteristics sufficiently clusters the projects as comparable DMUs. Therefore, authors
believe that all DMUs are homogeneous.
-414-

Journal of Industrial Engineering and Management – http://dx.doi.org/10.3926/jiem.582
0.700.450.20 0.80.60.4 0.80.60.4
40
30
20
10
0.90.60.3
$1,500,000.00
$1,000,000.00
$500,000.00
$0.00
1.000.750.50 0.80.60.4 900600300
(O)P
roce
ss S
igm
a
(I)CSF1
(O)C
ost
Av
oid
an
ce
(I)CSF2 (I)CSF3 (I)CSF4 (I)CSF5 (I)CSF6 (I)Total Team Hours
Matrix Plot of Outputs vs Inputs
Figure 2. Correlation charts
CSF1 CSF2 CSF3 CSF4 CSF5 CSF6 Team Hours
Process Sigma 0.534 0.429 -0.241* 0.273 0.145 0.190 0.288
Cost Avoidance 0.421 0.392 0.215 -0.324* 0.283 0.020 0.010
*Negative correlation between input and output
Table 7. Correlation coefficient
4.2.3. Input and Output Data
Table 8 displays the final raw input and output data from each LSS project. Each project was
given a number and will be represented as such throughout the remaining paper. The
organizational level of each CSF as determined by the surveys and the Total Team Hours
attributed to the project can be seen across each row identified as an input. The last two
columns, ‘PSPI’ and ‘Cost Avoidance’, are the calculated output values for each project.
5. Empirical Analysis
The final input and output variables in Table 8 are solved by the software DEA-Solver by
Cooper et al. (2007) using the output-oriented CCR (Charnes, Coopers, Rhodes) model with
Constant Scale Return for this study. The application runs the DEA model against the input
data providing a summary table, an efficiency score, a ranking of each DMU, a projection to
make each DMU efficient with the weights of each input and output, and the input excesses
and outputs shortfalls known as slack.
-415-

Journal of Industrial Engineering and Management – http://dx.doi.org/10.3926/jiem.582
LSSProject
Input Output
CSF1 CSF2 CSF3 CSF4 CSF5 CSF6Total Team
Hours PSPI Cost Avoidance
1 0.48 0.68 0.8 0.8 0.6 0.68 192 13 $31,200
2 0.56 0.56 0.44 0.64 0.36 0.64 240 28 $222,560
3 0.64 0.64 0.76 0.76 0.44 0.88 384 36 $96,720
4 0.36 0.6 0.72 0.32 0.28 0.56 192 28 $32,240
5 0.36 0.6 0.72 0.32 0.28 0.56 312 13 $64,480
6 0.36 0.6 0.72 0.32 0.28 0.56 312 15 $314,080
7 0.36 0.6 0.72 0.32 0.28 0.56 768 18 $218,400
8 0.36 0.2 0.56 0.48 0.44 0.4 264 9 $2,080
9 0.28 0.32 0.96 0.44 0.92 0.68 312 13 $15,720
10 0.2 0.24 0.4 0.36 0.4 0.44 600 16 $20,800
11 0.2 0.36 0.52 0.4 0.36 0.4 480 7 $15,600
12 0.2 0.6 0.48 0.56 0.44 0.48 456 37 $26,000
13 0.2 0.44 0.72 0.68 0.52 0.56 240 13 $68,640
14 0.2 0.2 0.72 0.72 0.68 0.36 408 26 $20,800
15 0.86 0.8 0.4 0.4 0.8 0.44 1032 39 $41,600
16 0.74 0.72 0.78 0.3 0.82 0.5 432 21 $1,352,000
17 0.36 0.2 0.56 0.48 0.44 0.4 624 19 $24,960
18 0.7 0.44 0.72 0.68 0.52 0.56 288 33 $48,880
Table 8. Data for DEA
Total 18 LSS projects were analyzed and identified as DMU 1 through 18 in Table 9. Eight
projects – DMU’s {2, 4, 6, 12, 14, 15, 16, 18} – were identified as efficient with a Score of 1
and ten projects – DMU’s {1, 3, 5, 7, 8, 9, 10, 11, 13, 17} – were inefficient with a Score
range from 0.992 to 0.292 as displayed in Score column. Table 9 also displays the Rank,
reference set, lambda value for each DMU in the reference set.
In essence, DMUs with Score 1 were the most efficient in utilizing their input resources when
compared to the other DMUs in the study. The reference set consists of four columns, and each
column is comprised of the DMU’s on the efficient frontier that an inefficient DMU is evaluated
against and its associated lambda. The reference set for an inefficient DMU may differ from a
DMU to a DMU. The lambda values are the weights given to each DMU in the reference set in
order to make the inefficient DMU efficient. For example, the most inefficient project, DMU11,
has a reference set of DMU’s 12, 14, 16, and 18 with lambda values of 0.160, 0.133, 0.025,
and 0.090, respectively. If DMU11 could attain the input and output values derived by adding
the product of the lambda values of each input and output values of the DMUs in their
reference set, it would be efficient. In this sense, each of DMUs, 12, 14, 16, and 18 is
considered as an efficient peer for DMU 11. In addition, DMU11 is more comparable to DMU 12
based on its lambda value.
-416-

Journal of Industrial Engineering and Management – http://dx.doi.org/10.3926/jiem.582
No. DMU Score Rank Reference set with Lambda
1 1 0.483 16 4 0.943 16 0.025
2 2 1.000 1 2 1.000
3 3 0.992 9 2 0.340 4 0.140 12 0.572 18 0.052
4 4 1.000 1 4 1.000
5 5 0.542 14 4 0.692 6 0.308
6 6 1.000 1 6 1.000
7 7 0.952 11 4 0.300 6 0.700
8 8 0.449 17 14 0.459 18 0.246
9 9 0.510 15 4 0.270 14 0.566 16 0.004 18 0.095
10 10 0.782 12 12 0.179 14 0.372 16 0.006 18 0.122
11 11 0.292 18 12 0.460 14 0.133 16 0.025 18 0.090
12 12 1.000 1 12 1.000
13 13 0.618 13 4 0.204 12 0.374 16 0.070
14 14 1.000 1 14 1.000
15 15 1.000 1 15 1.000
16 16 1.000 1 16 1.000
17 17 0.953 10 14 0.459 16 0.004 18 0.240
18 18 1.000 1 18 1.000
Table 9. Efficiency and reference set
From Table 9, useful managerial information can be calculated. The target values of the inputs
and outputs that an inefficient DMU needs to attain to become an efficient DMU are easily
calculated. These target values can be connected with any operational plan to improve the
efficiency. In this respect, DEA is a powerful tool for managers. Senior managers often want to
identify a group of projects that they can use as standards for future projects and a means to
understand the importance of critical success factors on performance. Theoretically, all efficient
DMUs can be a standard DMU. However, authors believe that practically DMUs that most
frequently serve as an efficient peer can be a clearer target for this purpose. Hence, the
frequency of DMU’s service as an efficient peer is calculated from Table 9, and summarized in
Table 10.
DMU 2 4 6 12 14 15 16 18
Frequency 2 7 3 5 6 1 7 7
Table 10. Frequency of service as an efficiency peer
According to this efficiency peer analysis, DMUs 4, 16 and 18 serve most frequently as an
efficient peer. This may indicate impact of efficient DMUs on the organization. Specifically,
managers may narrow down their benchmarking focus on these three DMUs to improve any
inefficient DMU’s efficiency. While DEA does not provide any mechanism to compare efficient
DMUs, the frequency of efficiency peer services may be used to evaluate the potential impact
of those efficient DMUs.
-417-

Journal of Industrial Engineering and Management – http://dx.doi.org/10.3926/jiem.582
Table 11 below shows the amount of excess of input factors and shortage of output factors,
called as the slack analysis. In theory, the level of the input could be lowered by the amount
suggested without affecting the efficiency score. It shows that CSF6 has a higher frequency of
slack, indicating that ‘amount of attention given to both long-term and short-term target’ is
very different from project to project, and very uncontrollable. In other words, this is a critical
input that a manager should pay attention to. The same is true to TTH in this sense. It is noted
that DMU1 has many excess input factors while DMU5 has one big excess factor (TTH).
Practically speaking, DMU1 may require more managerial attention since managers need to
consider all aspects of input factors.
DMU Score Excess Excess Excess Excess Excess Shortage Shortage
CSF1-
Execution
CSF2-Mgmt
Commitment
CSF5-Use of
Data Analysis
CSF6-Long
Term/Short Term
Total Team
Hours
Process
Sigma
Cost
Avoidance
S-(1) S-(2) S-(3) S-(4) S-(5) S+(1) S+(2)
1 0.483 0.122 0.096 0.315 0.139 0.000 0.000 0.000
2 1.000 0.000 0.000 0.000 0.000 0.000 0.000 0.000
3 0.992 0.249 0.000 0.000 0.281 0.000 0.000 0.000
4 1.000 0.000 0.000 0.000 0.000 0.000 0.000 0.000
5 0.542 0.000 0.000 0.000 0.000 83.049 0.000 0.000
6 1.000 0.000 0.000 0.000 0.000 0.000 0.000 0.000
7 0.952 0.000 0.000 0.000 0.000 492.057 0.000 0.000
8 0.449 0.096 0.000 0.000 0.097 5.902 0.000 16933.625
9 0.510 0.000 0.000 0.407 0.270 0.000 0.000 0.000
10 0.782 0.000 0.000 0.000 0.149 328.827 0.000 0.000
11 0.292 0.000 0.000 0.000 0.069 179.443 0.000 0.000
12 1.000 0.000 0.000 0.000 0.000 0.000 0.000 0.000
13 0.618 0.000 0.043 0.241 0.231 0.000 0.000 0.000
14 1.000 0.000 0.000 0.000 0.000 0.000 0.000 0.000
15 1.000 0.000 0.000 0.000 0.000 0.000 0.000 0.000
16 1.000 0.000 0.000 0.000 0.000 0.000 0.000 0.000
17 0.953 0.098 0.000 0.000 0.099 365.974 0.000 0.000
18 1.000 0.000 0.000 0.000 0.000 0.000 0.000 0.000
Table 11. Slack value table
6. Summary and conclusions
The objective of this study is to develop a Lean Six Sigma – Project Performance Evaluation
Model (LSS-PPEM) at Johnson Space Center (JSC). LSS Black Belts and Green Belts at JSC
were surveyed in an attempt to develop the input and output criteria for such a model. Once
the model was developed, several process improvement projects were identified at JSC to be
measured for their efficiency using this model. The resulting analysis, described above,
provided a wealth of information for the researcher.
Over the years, DEA has proven to be a successful method for measuring the efficiency of
similar decision making units (DMUs). The key is to appropriately identify the input and output
-418-

Journal of Industrial Engineering and Management – http://dx.doi.org/10.3926/jiem.582
variables to be used in the evaluation. It is the responsibility of the DMU under evaluation to
convert the inputs into outputs thereby creating a ratio to be measured. Therefore, if the
variables are not properly identified, resultant scores could be useless. It is the opinion of
authors that the use of the commonly accepted Critical Success Factors (CSFs), as input
variables, was appropriate for this study. In addition, the output variables were sufficient to
measure the success of the improvement event. The Process Sigma output variable measures
the capability of the process while the Cost Avoidance output variable measures the funds
saved by the project, allowing the funds to be reallocated to other uses. Based on the case
study, authors believe that the CSFs identification and resulting LSS-PPEM successfully
customize DEA for the government agency.
The results of this study provide management with an abundance of data to aid them both
strategically and tactically. Managers can review the data to visualize how their project
performed compared to other projects. From a strategic standpoint, understanding the
correlation between the levels of outputs achieved and the inputs used, managers can map out
a plan to help increase the CSF level within the organization, thereby potentially increasing the
level of outputs or reducing the level of inputs of future projects. Tactically, managers can work
within their organization to improve areas based on information they can obtain from other
organizations within the reference set. More specifically, based on efficient peer frequency
analysis, managers can narrow down the benchmarking target DMUs. Additionally they can
focus on those variables that provide the greatest impact to performance by reviewing the
weights table.
Another major significance identified is the value the DEA analysis has from a programmatic
standpoint. It can provide greater insight into the utilization of resources projects achieve as
compared to earned value management. Earned value management focuses on the
effectiveness of a project based on its stated baseline, whereby if a project closely follows its
plan, it is deemed to be performing appropriately. However, EVM cannot tell managers if the
project is utilizing its resources better or worse than other projects. For example, if both a $10
million and $1 million software project report their EVM in line with their stated baseline, they
are both deemed to be on target. In contrast, DEA can be used to determine whether these
projects are utilizing their resources in the most efficient manner to produce a determined
output, such as lines of code. DEA would be able to determine to what level the projects are
efficient and those areas needing improvement, something EVM cannot do.
Several opportunities exist for potential future studies using DEA to measure the efficiency of
LSS projects. The model developed in this study can be used to measure the efficiency of LSS
projects within different categories or groups. For example, within JSC, projects can be
grouped by directorate or program and analyzed for efficiency within their group. Additionally,
the same study can be applied to all LSS initiatives at each of the NASA Centers, thereby
seeing how each Center compares in the implementation of LSS. Another opportunity exists to
-419-

Journal of Industrial Engineering and Management – http://dx.doi.org/10.3926/jiem.582
study whether there is a difference in efficiency for projects grouped by NASA mission
directives, Aeronautics Research, Exploration, Science, and Space Operations,
Possibilities exist to utilize DEA to measure efficiencies of projects in combination with earned
value management or how well a contractor is performing against their stated deliverables.
Further analysis would need to be conducted to determine the appropriate input and output
variables to be used within the model. Once obtained, the analysis has potential to be used as
a method to determine performance-based fees, areas to focus on for improvement and
benchmarks for future projects or contracts to strive for.
References
Bicheno, J. (2001). Manufacturing operations and supply chain management: The LEAN
approach. In Taylor, D. and Brunt, D., (Ed.). Kaizen and Kaikaku. London, UK: Thomson
Learning, pp. 175-184.
Bissell, D., Garcia, M., & Telles, D. (2006). Lean Implementation at White Sands Missile Range:
A Case Study of Lean Thinking Applied in a Government Organization. Master Thesis, Naval
Postgraduate School.
Bo, C.P. (2005). Performance evaluation of data envelopment analysis. Wu-Nan Book Inc.,
Taiwan.
Bodek, N. (2002). Quick and Easy Kaizen. IIE Solutions, 34(7), 43-45.
Boynton, A., & Zmud, R. (1984). An assessment of critical success factors. Sloan Management
Review, 25(4), 17-27.
Brotherton, B., & Shaw, J. (1996). Towards an identification and classification of critical success
factors in UK hotels plc. International Journal of Hospitality Management, 15(2), 113-135.
http://dx.doi.org/10.1016/0278-4319(96)00014-X
Burton, T.T., & Sams, J.L. (2005). Six Sigma for Small and Mid-sized Organizations. Florida: J.
Ross Publishing.
Choo, A., Linderman, K., & Schroeder, R. (2007). Method and context perspectives on learning
and knowledge creation in quality management. Journal of Operations Management, 25,
918-931. http://dx.doi.org/10.1016/j.jom.2006.08.002
Cooper, W., Seiford, L.M., & Shu, J. (2011). Handbook on Data Envelopment Analysis. New
York: Springer-Verlag. http://dx.doi.org/10.1007/978-1-4419-6151-8
Cooper, W.W., Seiford, L.M., & Tone, K. (2007). Data envelopment analysis: A comprehensive
text with models, applications, references, and DEA-solver software. Boston, Mass.; London:
Kluwer Academic.
Coronado, R., & Antony, J. (2002). Critical Success Factors for the Successful Implementation
of Six Sigma projects in Organizations. The TQM Magazine, 14(2), 92-99.
http://dx.doi.org/10.1108/09544780210416702
-420-

Journal of Industrial Engineering and Management – http://dx.doi.org/10.3926/jiem.582
Eliat, H. Golany, B., & Shtub, A. (2008). R&D project evaluation: An integrated DEA and
Balanced Scorecard approach. Omega, 35(5), 895-912.
http://dx.doi.org/10.1016/j.omega.2006.05.002
Emrouznejad, A., Parker, B.R., & Tavares, G. (2008). Evaluation of research in efficiency and
productivity: A survey and analysis of the first 30 years of scholarly literature in DEA. Socio-
Economic Planning Sciences, 4(3), 151-157. http://dx.doi.org/10.1016/j.seps.2007.07.002
Ferris, J.A., Groesbeck, R.I. Aken, E.M.V., & Letens, G. (2006). Evaluating the relative
performance of engineering design projects: A case study using Data Envelopment Analysis.
IEEE Transaction on Engineering Management, 53(3), 471-482.
http://dx.doi.org/10.1109/TEM.2006.878100
Feng, Q., & Antony, J. (2009). Integrating DEA into six sigma methodology for measuring
health service efficiency. Journal of the Operational Research Society, 61, 1112-1121.
http://dx.doi.org/10.1057/jors.2009.61
Furterer, S. (2004). A framework roadmap for implementing Lean Six Sigma in local
governmental entities. Doctoral Dissertation, University of Central Florida.
George, M.L. (2003). Lean Six Sigma for Service. New York, New York: McGraw-Hill.
Hayes, B.J. (2002). Six sigma critical success factors, retrieved 12 February 2012 from
http://www.isxsigma.com.
Ho, Y., Chang, O., & Wang, W. (2008). An empirical study of key success factors for six sigma
green belt projects at an Asian MRO company. Journal of Air Transport Management, 14(5),
263-269. http://dx.doi.org/10.1016/j.jairtraman.2008.05.002
Kirby, K., & Greene, B. (2003). How Value Stream Type Affects the Adoption of Lean
Production Tools and Techniques. Proceedings of the 2003 Industrial Engineering and
Research Conference.
Kumar, U. D., Saranga, H., Ramírez-Márquez, J. E., & Nowicki, D. (2007). Six sigma project
selection using data envelopment analysis. The TQM Magazine, 19(5), 419-441.
http://dx.doi.org/10.1108/09544780710817856
Kwak, Y., & Anbari, F. (2006). Benefits, obstacles, and future of six sigma approach.
Technovation, 26, 708-715. http://dx.doi.org/10.1016/j.technovation.2004.10.003
Lengacher, D. (2010). Calculating the efficiency of process improvement. iSixSigma Magazine,
6(6), 56-57.
Linton, J.D., Morabito, J., & Yeomans, J.S. (2007). An Extension to a DEA support system used
for assessing R&D projects. R&D Management, 37(1), 29-36. http://dx.doi.org/10.1111/j.1467-
9310.2007.00456.x
-421-

Journal of Industrial Engineering and Management – http://dx.doi.org/10.3926/jiem.582
Malhotra, R., Malhotra, D.K., & Lermack, H. (2009). Using data envelopment analysis to
analyze the performance of North American class I freight railroads. Applications of
Management Science, 13, 113-131.
Melnyk, S.A., Calantone, R.J., Montabon, F.L., & Smith, R.T. (1998). Short-term action in
pursuit of long- term improvements: introducing Kaizen events. Production and Inventory
Management Journal, 39(4), 69-76.
Oakeson, M. (1997). Kaizen Makes Dollars & Sense for Mercedes-Benz in Brazil. IIE Solutions,
29(4), 32-35.
Rockart, J. (1979). Chief Executives Define Their Own Information Needs. Harvard Business
Review, 2, 81-92.
Saaty, T.L. (1980). The Analytic Hierarchy Process, McGraw-Hill.
Schroeder, R.G., Lindermana, K., Liedtkeb, C., & Choo, A.S. (2008). Six Sigma: definition and
underlying theory. Journal of Operations Management, 26, 536-554.
http://dx.doi.org/10.1016/j.jom.2007.06.007
Smith, B. (2003). Lean and Six Sigma: A One-Two Punch. Quality Progress, April 2003.
Su, C., & Chou, C. (2008). A systematic methodology for the creation of six sigma projects: A
case study of semiconductor foundry. Expert Systems with Applications, 34, 2693-2703.
http://dx.doi.org/10.1016/j.eswa.2007.05.014
Vasilash, G.S. (1997). Getting Better-Fast. Automotive Design & Production, 109(8), 66-68.
Yüksel, H. (2012). Evaluation of the success of Six Sigma Projects by Data Envelopment
Analysis. International Journal of Business and Management, 7(13), 75-83.
http://dx.doi.org/10.5539/ijbm.v7n13p75
Zu, X., Fredendall, L., & Douglas, T. (2008). The evolving theory of quality management: The
role of six sigma. Journal of operations Management, 26, 630-650.
http://dx.doi.org/10.1016/j.jom.2008.02.001
Journal of Industrial Engineering and Management, 2013 (www.jiem.org)
Article's contents are provided on a Attribution-Non Commercial 3.0 Creative commons license. Readers are allowed to copy, distribute
and communicate article's contents, provided the author's and Journal of Industrial Engineering and Management's names are included.
It must not be used for commercial purposes. To see the complete license contents, please visit
http://creativecommons.org/licenses/by-nc/3.0/.
-422-