Measuring Educational Attainment in Cross … Educational Attainment in Cross-National Surveys: The...
43
Measuring Educational Attainment in Cross-National Surveys: The Case of the European Social Survey * Silke L. Schneider Nuffield College, Oxford Silke.Schneider@nuffield.ox.ac.uk November 2007 Draft version Educational attainment is a core social background variable covered in each and every single social survey. Cross-national surveys are particularly vulnerable to sub-optimal measurement of education. In this paper, the cross- national measurement of educational attainment is evaluated using data of the European Social Survey (ESS). After discussing some theoretical background of cross-national measurement of education generally, the most commonly used comparable measures are introduced. A brief overview over previous evaluations is given. In the main part of the paper, the implementation of a simplified version of the International Standard Classification of Education 1997 (ISCED–97) in the ESS is discussed and evaluated in several ways: By looking at the consistency of the reclassification of national education variables into the comparable variable; at how the comparable variable is distributed, how much explanatory power of educational attainment is lost by harmonising the national variables (using occupational status as the criterion), and which steps of the harmonisation process affect the results most strongly in the single countries. Finally, an alternative way of simplifying the ISCED–97 is * Paper presented at the EDUC Research Group Workshop of the EQUALSOC network in Dijon, France, 22nd-24th of November 2007. Previous versions of this paper were presented at the 2007 Spring Meeting of the Research Committee on Social Stratification and Mobility (RC28) of the International Sociological Association (ISA), Brno, Czech Republic, May 24-27 and at the 8th conference of the European Sociological Association (ESA) in Glasgow, 3-6 September 2007. This paper is largely inspired by the research team “Evaluation of ISCED 1997 for Comparative Research” of the EQUALSOC network (see www.equalsoc.org). I would like to thank all members of the group for their support. 1
Transcript of Measuring Educational Attainment in Cross … Educational Attainment in Cross-National Surveys: The...

Measuring Educational Attainment inCross-National Surveys:
The Case of the European Social Survey∗
Silke L. SchneiderNuffield College, Oxford
November 2007Draft version
Educational attainment is a core social background variable covered ineach and every single social survey. Cross-national surveys are particularlyvulnerable to sub-optimal measurement of education. In this paper, the cross-national measurement of educational attainment is evaluated using data of theEuropean Social Survey (ESS). After discussing some theoretical backgroundof cross-national measurement of education generally, the most commonlyused comparable measures are introduced. A brief overview over previousevaluations is given. In the main part of the paper, the implementation of asimplified version of the International Standard Classification of Education1997 (ISCED–97) in the ESS is discussed and evaluated in several ways: Bylooking at the consistency of the reclassification of national education variablesinto the comparable variable; at how the comparable variable is distributed,how much explanatory power of educational attainment is lost by harmonisingthe national variables (using occupational status as the criterion), and whichsteps of the harmonisation process affect the results most strongly in thesingle countries. Finally, an alternative way of simplifying the ISCED–97 is
∗Paper presented at the EDUC Research Group Workshop of the EQUALSOC network in Dijon,France, 22nd-24th of November 2007. Previous versions of this paper were presented at the 2007Spring Meeting of the Research Committee on Social Stratification and Mobility (RC28) of theInternational Sociological Association (ISA), Brno, Czech Republic, May 24-27 and at the 8thconference of the European Sociological Association (ESA) in Glasgow, 3-6 September 2007. Thispaper is largely inspired by the research team “Evaluation of ISCED 1997 for Comparative Research”of the EQUALSOC network (see www.equalsoc.org). I would like to thank all members of the groupfor their support.
1

proposed, which could improve the measure’s comparability and predictivepower.
Over the last decades, more and more international data sets including more and morecountries became available to researchers. Cross-nationally comparable measurement isone of the most important challenges of comparative social research. While harmonisedmeasurement of educational attainment is more or less relevant to most areas of socialresearch, it is crucial for comparative social stratification and mobility research (see e.g.Shavit and Blossfeld, 1993; Müller, 1996; Shavit and Müller, 1998). Despite the wideutilisation of measures of education in cross-national research, validation studies of suchharmonised measures are scarce (but see e.g. Braun and Müller, 1997; Kerckhoff andDylan, 1999; Kerckhoff, Ezell, and Brown, 2002), and time and again, cross-nationalcomparability remains a mere assumption.
The aim of this paper is to validate the cross-national measure of educational attainmentused in the European Social Survey (ESS, Jowell and the Central Co-ordinating Team,2003, 2005), a reduced version of the International Standard Classification of Education1997 (ISCED–97; UNESCO, 2006 [1997]).1
In the first part of the paper (section 1), some general challenges around the cross-nationally comparable measurement of years and levels of educational attainment arediscussed, and two international classifications for measuring levels of education arepresented. Furthermore, the results of the above mentioned validation studies will bebriefly summarised.
In the main part of the paper (section 2), after a short section on the methodsapplied, the measurement of educational attainment in the European Social Survey will bediscussed and evaluated in several ways: firstly by looking closely at how the ISCED–97was implemented in the survey (section 2.1), secondly by checking the compliance of theresulting supposedly comparable variable with the criteria as set out by the UNESCO(2006 [1997]; 1999) and the OECD (1999) (section 2.2), and thirdly by looking at theconsequences of harmonising country specific measures of educational attainment intoa standard classification system on the distributions of educational attainment and theassociation between educational and occupational attainment (section 2.3).
As a result of this extensive evaluation, the usefulness of the ISCED–97 for compar-ative survey research in Europe will be discussed. Finally, a cross-national educationclassification that is more suitable for survey research in the European context will beproposed and evaluated.
1. Cross-nationally comparable measurement of educationalattainment
Measurement of educational attainment requires a clarification of the underlying concept,which is particularly important for comparative research. For social stratification research,
1Apart from the ESS, also the PISA studies (OECD, 2001, 2004) use the ISCED–97 (for the measurementof parental educational attainment).
2

the acquisition of educational certificates and credentials that “testify the acquisition ofparticular sets of skills and knowledge” (Braun and Müller, 1997, p. 168) is the mostimportant outcome of an individual’s educational career. Educational attainment in thissense means the highest level of formal education in terms of how much and what kindof education an individual has completed, as manifested by the educational certificatesawarded. These certificates are used as credentials for labour market entry, the marriagemarket etc., and are usually awarded through institutions that are officially recognised(or “accredited”) by the state. The notion of education is used in a wide sense here,covering general and academic education (“Bildung”) as well as vocational educationand training (“Ausbildung”), as it is impossible to draw the line between the two in aconsistent way cross-nationally. However, informal learning such as adult evening classes(unless leading to an important certificate which could also be acquired in the regulareducational system) and skills acquired later during working life are usually excludedfrom educational attainment measures.
Levels and types as well as the duration of specific educational programmes andthe certificates awarded depend on the institutional structure of educational systems.Therefore, there are complex differences between countries (and also within countriesover time) in the characteristics of different levels of attainment. In comparative research,there are two general ways of measuring educational attainment: using years of formaleducation or using a standardised set of categories.2
1.1. Years of education
Years of education measure either actual or “theoretical” (also called “virtual”) number ofyears spent in the educational system, or the length of educational experience. “Virtual”years of education refer to the number of years usually required to complete a certainlevel of education, and are derived from categorical measures. This measure builds on theassumption that firstly “the longer someone is exposed to education, the more skills andknowledge he or she can acquire, and the more he or she is socialised, directly or indirectly”(Braun and Müller, 1997, p. 170) and secondly “all kinds of skills and knowledge are ofsimilar value” (Braun and Müller, 1997, p. 170).
The advantage of this measure, which is used as an interval level variable, is that itcan be analysed in simple linear models and provides very parsimonious results whenused as a predictor or response variable (see e.g. Treiman and Yip, 1989). Using yearsof education as an interval level variable however relies on a strong assumption, namely
2A different, but related concept would be that of educational achievement, referring to an individuals’actual competencies and skills (e.g. reading, arithmetic or language skills). These are however verycostly to measure in a large-scale survey. Therefore, even for other areas of sociological research,educational attainment might be the best available proxy (e.g. for the explanation of values orpolitical involvement). With the PISA studies (OECD, 2001, 2004), academic achievement measuresbecame popular in social stratification research. Such measures are restricted to specifically designedachievement surveys and usually very selected populations. They will not be discussed in thispaper. There are also some other approaches to measuring educational attainment using educationalattainment categories in comparative research (e.g. Rosenfeld, Van Buren, and Kalleberg, 1998; Smits,Ultee, and Lammers, 1998). As they are not widely used, they will not be discussed here either.
3
the linearity of the relationship in question. No such assumption needs to be made forcategorical measures.
What is more, the number of years of schooling or formal education only measuresthe element of how much education one has received: years of schooling thereby hidequalitative differences in educational qualifications (Kerckhoff and Dylan, 1999, p. 760):The duration of very different educational programmes can be identical, within andbetween countries. In institutionally rather undifferentiated educational systems, like theUnited States, years of education are maybe a meaningful measure (see e.g. Braun andMüller, 1997), as from the end of compulsory schooling on, individuals face the decisionbetween staying in the educational system (high school or college) for another year orentering the labour market. This is surely not the case in Europe (Gambetta, 1987; Braunand Müller, 1997): most European educational systems are highly differentiated andinclude different, often parallel tracks of more or less fixed duration. Different educationalprogrammes often cover the same number of cumulative years of schooling, but arequalitatively different from each other in terms of the type of instruction, intellectualdemand and value in later life. In some countries, this differentiation starts just afterprimary school, in others it only starts after compulsory schooling. Actual years ofschooling in the European context thus can only be meaningfully interpreted in terms ofthe individual’s time-investment or time spent under the influence of a specific form ofsocialisation, but not in terms of the level of education achieved.3 In Europe, duration isonly one among several other attributes of education (Gambetta, 1987, p. 6). Althoughit is very difficult to harmonise national categorical variables measuring educationalattainment over time and for different countries, years of education is not much better, asthis measure is just nominally comparable by using a standard unit.
1.2. Categorical measures of educational attainment
Using a categorical variable, it is possible to measure what kind of education one achievedin terms of formal certificates and eligibility for subsequent educational or occupationalpaths, i. e. in a more functional way. In contrast to years of schooling, categorical measuresof education can e.g. specify distinct types of education, namely vocational or academictracks, additionally to the amount of education completed. This idea is fundamentalto the so-called CASMIN scheme, developed in the project “Comparative Analysis ofSocial Mobility in Industrial Nations” for data from the 1970s (e.g. König, Lüttinger,and Müller, 1988; Müller, Lüttinger, König, and Karle, 1990), and the InternationalStandard Classification of Education 1997 (ISCED–97, UNESCO, 2006 [1997], 1999;OECD, 1999).4 The basic idea of both international classifications of education is toprovide a framework with which national classifications can be “translated” into aninternationally standardised classification. Such a framework might be based on a setof definitions for the categories of the international classification (which can be more or
3It is however very useful to include years of education in surveys, as this variable can also be used forvalidation purposes.
4When the ISCED was first introduced by the UNESCO in 1976, types of education were not yetdistinguished. This is only the case since the major revision of the ISCED in 1997.
4
less explicit) like CASMIN, or provide explicit definitions plus detailed mappings linkingnational educational programmes (as the basic unit of classification) to internationallycomparable categories, like the ISCED–97. Both CASMIN and the ISCED–97 basicallydistinguish between primary, secondary and tertiary education, and then differentiatefurther within these levels. Not only are such measures more meaningful in Europeansocieties than years of education, but they can usually also be derived from nationaleducational attainment measures available in virtually all social surveys.
However, it is only one step to design an internationally comparable classification ofeducational qualifications. It is yet another to implement it in practice in large-scalecross-national surveys. Usually, the questionnaire would include an item on (usuallythe respondents’) highest level of education completed in the national format. But:comparative measures cannot be better than the national education variables (NEVs) theyare based on. Furthermore, it can be assumed that the recoding of national categoriesinto international ones will reflect the criteria as set out in the international classificationframework only imperfectly, particularly if it is performed by different people in differentcountries. The crucial questions that need to be addressed here are therefore firstlywhether the concepts of the harmonised measure are applied consistently and secondlywhether a reclassification of national education categories into international categories isequally (in-) adequate in all countries compared (Kerckhoff et al., 2002, p. 101).
1.2.1. Criteria for evaluating categorical cross-national measures of educationalattainment
The validity of cross-national measures of educational attainment largely depends on twofactors:
1. Content validity, which means that the assignment of national educational pro-grammes to international categories follows the definitions specified in the interna-tional classification framework in the same way in all countries, and
2. Construct validity, which means that educational programmes with different out-comes are assigned to different international categories. As international classifica-tions of education typically have fewer categories than national education measures,Kerckhoff et al. (2002, p. 106) note that, “collapsing the indigenous credentials intoeither set of standard categories [CASMIN or ISCED] is very likely to reduce thepower of the education measure to explain occupational outcomes. An evaluation ofa standard scheme thus does not depend on whether its use lowers the explanatorypower of educational attainment. Rather, it depends on the size of the reductionand how consistently it occurs across societies.”
The first factor mainly serves to achieve cross-national comparability, whereas the secondserves to maintain meaningfulness, predictive power and unbiased estimates. Typicalproblems with designing international classifications of education are consequently
1. ambiguous, incomplete or otherwise problematic definitions, leading to misclassifi-cations and controversial assignments of educational programmes to internationalcategories,5 and
5

2. the merging of several national categories in one international one, necessarilylowering the classifications’ discriminatory power.
Sometimes both aims conflict, and the researcher or the institution developing theinternational classification has to decide in favour of either aim, thereby decreasing theclassifications validity—or adjust the framework.
1.2.2. The problem of classifying dropouts
An important issue that is not formally reflected in neither CASMIN nor the ISCED–97is the treatment of dropouts and failures, i.e. the case when somebody attends a specificeducational programme without graduating. In a strict sense, educational attainment wasdefined as the ‘highest level of education completed ’, which is attested by a certificate ordiploma (see page 3). The criterion of “certification” however may need to be relaxed,as non-certified education, usually as a consequence of dropout or failure, can make adifference, too: Non-completed education (e. g. uncompleted university studies, commonin many countries) may be rewarded or penalised in the labour market, and in how farone or the other is the case can moreover be expected to differ over countries. This is anissue particularly for France, where failure rates at the level of baccalauréat or vocationalupper secondary education (BEP and CAP) are comparably high, and nevertheless, the‘educational biography’ matters a lot (Brauns and Steinmann, 1999, p. 34f.).
In order to reach comparable measurement, classifying dropouts should be resolved inan equal way in all countries. The prerequisite for this is that information on educationalprogrammes attended without graduating is collected wherever there are substantialamounts of dropout (either as a separate questionnaire item or using additional responsecategories and adapted wording of the “highest level of education”-item). There are thenthree ways of dealing with dropout: Firstly, dropouts could be consistently coded eitherupward or downward or in a category between the two categories in question. However,downgrading dropouts to their last completed level of education (which can usually onlybe inferred on theoretical grounds; e.g. dropouts from university will most probably—butnot necessarily—have a university entrance qualification as their highest completed levelof education) may introduce heterogeneity in that lower category. Upgrading would havethe same effect, and choosing a category “in the middle” (assuming ordinality between thecategories in question) may lead to a mixture of very different educational qualificationsin that category. Secondly, a criterion variable could be used in order to determine whicheducational attainment category comes closest to the dropout category with respect to a
5It is e.g. very problematic if the criteria are easily modifiable by national governments, as they mightbe interested in “boosting” their country’s educational profile without any actual improvement. Asan example, a central criterion of the ISCED–97 is access to subsequent educational programmes.Therefore, whenever a country opens access to a higher level educational programme (either byupgrading an existing qualification or introducing a new one), this leads to an assignment of the newlyaccess-granting educational qualification to the ISCED level of the previously required qualifications.Actual or typical rates of access are not reflected in the ISCED–97. This is in practice a problemwith many vocational upper-secondary qualifications (e.g. “bac pro” in France), which nominally giveuniversity access, but hardly any graduates actually proceed to university.
6
certain outcome, and code it there. Lastly, a specific dropout category could be introducedin the classification. Obviously none of these options is really satisfactory.
1.2.3. The CASMIN scheme of educational attainment
The CASMIN educational attainment scheme (König et al., 1988; Müller et al., 1990; ?)was designed for comparative social stratification and mobility research. It is based oncertificates and intends to classify functionally equivalent qualifications across countriestogether. The researchers developing the scheme aimed at categories which “should, tothe greatest extent possible, both optimally reflect the typical, class specific barriers inthe educational system, as well as grasp the differentiations relevant for utilization onthe labor market” (Müller et al., 1990, 67). Therefore, selectivity into and out of theeducational system are the central dimensions underlying its construction.
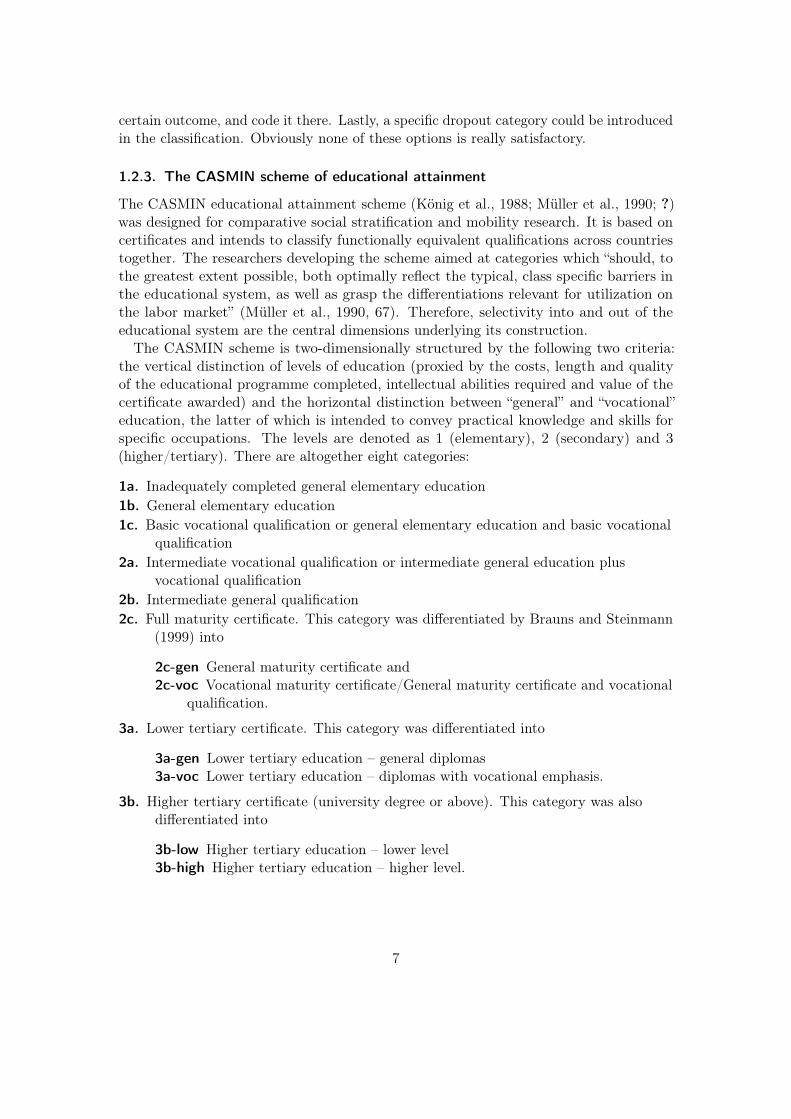
The CASMIN scheme is two-dimensionally structured by the following two criteria:the vertical distinction of levels of education (proxied by the costs, length and qualityof the educational programme completed, intellectual abilities required and value of thecertificate awarded) and the horizontal distinction between “general” and “vocational”education, the latter of which is intended to convey practical knowledge and skills forspecific occupations. The levels are denoted as 1 (elementary), 2 (secondary) and 3(higher/tertiary). There are altogether eight categories:
1a. Inadequately completed general elementary education1b. General elementary education1c. Basic vocational qualification or general elementary education and basic vocational
qualification2a. Intermediate vocational qualification or intermediate general education plus
vocational qualification2b. Intermediate general qualification2c. Full maturity certificate. This category was differentiated by Brauns and Steinmann
(1999) into
2c-gen General maturity certificate and2c-voc Vocational maturity certificate/General maturity certificate and vocational
qualification.
3a. Lower tertiary certificate. This category was differentiated into
3a-gen Lower tertiary education – general diplomas3a-voc Lower tertiary education – diplomas with vocational emphasis.
3b. Higher tertiary certificate (university degree or above). This category was alsodifferentiated into
3b-low Higher tertiary education – lower level3b-high Higher tertiary education – higher level.
7

As the CASMIN scheme was developed for use with data gathered in the 1970s, it wasupdated by Brauns and Steinmann (1999) in order to reflect more recent changes inthe educational systems in France, Germany and the UK. Still, the problem with usingCASMIN for comparative research today is that it has only been applied to a limitednumber of countries in the past, that there are no formal guidelines for its implementationin other countries. There is also generally not much documentation available on CASMIN.
1.2.4. The International Standard Classification of Education
The International Standard Classification of Education 1997 (ISCED–97, UNESCO,2006 [1997], 1999; OECD, 1999), is a multidimensional multi-purpose classification forharmonising national educational programmes into a cross-national framework for levelsand fields of education (the latter will not be discussed here). It is mostly used forenrolment statistics and other international statistical reports, but can be adapted forthe measurement of an individuals’ educational attainment. It firstly distinguishes sevenlevels of education:
ISCED level 0 Pre-primary education (early childhood education)ISCED level 1 Primary education (usually the first six years of formal schooling)ISCED level 2 Lower secondary education (usually coincides with the end of full-time
compulsory schooling after around nine years of schooling)ISCED level 3 Upper secondary education (where university entrance certificates and
vocational qualifications which require completion of level 2 are awarded)ISCED level 4 Post-secondary non-tertiary education (programmes that straddle the
boundary between level 3 and 5, e.g. university entrance certificates for adults ornon-tertiary vocational education after general upper secondary)
ISCED level 5 First stage of tertiary education (all university and vocational collegeeducation exclusive of PhD/doctorate and equivalent)
ISCED level 6 Second stage of tertiary education (leading to an advanced researchqualification, i. e. PhD/doctorate and equivalent).
The core criteria for the assignment of national educational programmes to the ISCED–97levels is programme content, proxied by minimum entrance requirements, typical startingage, certificates awarded, staff qualifications, and duration (among others). the ISCED–97secondly differentiates within some of these levels, along three dimensions:
• Programme orientation: at levels 2, 3 and 4 there is a distinction between vocational(V ) and general (G) programmes.
• Type of destination: At levels 2, 3, 4 and 5 there is a distinction between programmesleading to more advanced general/academic programmes (A); more advanced voca-tional programmes (A and B), and the labour market or other programmes at thesame ISCED level only (C). These subcategories A, B and C are defined somewhatdifferently at the different levels of education (see figure 1). ISCED 5B comprises vo-cational tertiary education and gives access to the labour market. ISCED 5A refers
8
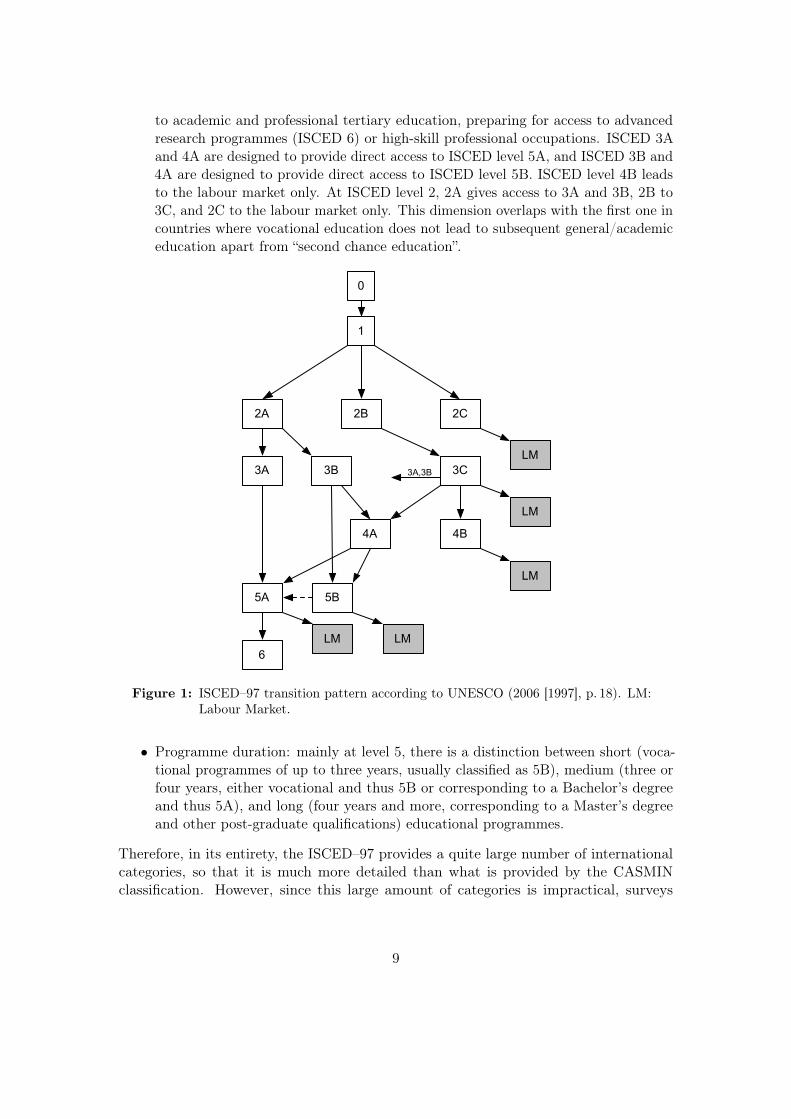
to academic and professional tertiary education, preparing for access to advancedresearch programmes (ISCED 6) or high-skill professional occupations. ISCED 3Aand 4A are designed to provide direct access to ISCED level 5A, and ISCED 3B and4A are designed to provide direct access to ISCED level 5B. ISCED level 4B leadsto the labour market only. At ISCED level 2, 2A gives access to 3A and 3B, 2B to3C, and 2C to the labour market only. This dimension overlaps with the first one incountries where vocational education does not lead to subsequent general/academiceducation apart from “second chance education”.
2A
1
2C2B
3A
0
3C
4A 4B
5A 5B
6
LM
LM
LM
LMLM
3A,3B3B
Figure 1: ISCED–97 transition pattern according to UNESCO (2006 [1997], p. 18). LM:Labour Market.
• Programme duration: mainly at level 5, there is a distinction between short (voca-tional programmes of up to three years, usually classified as 5B), medium (three orfour years, either vocational and thus 5B or corresponding to a Bachelor’s degreeand thus 5A), and long (four years and more, corresponding to a Master’s degreeand other post-graduate qualifications) educational programmes.
Therefore, in its entirety, the ISCED–97 provides a quite large number of internationalcategories, so that it is much more detailed than what is provided by the CASMINclassification. However, since this large amount of categories is impractical, surveys
9

usually work with a reduced version of the ISCED–97, only distinguishing the seven mainlevels (this will be referred to as “simplified the ISCED–97” or “sISCED–97”).
Compared to CASMIN, one of the biggest advantages of the ISCED–97 is the availabilityof background information. The OECD (1999) provides the most detailed documentationon the ISCED–97 for all OECD countries, mapping national educational programmesto the appropriate the ISCED–97 categories. Similar tables are available from Eurostat(2006) for all countries of the European Union and some none-member countries. Morerecently, UNESCO Institute for Statistics (2006) has published such mappings for 19developing countries. All these mappings are however only available from 1999 onwards;outdated qualifications that occur in all sample surveys among the adult population aretherefore not covered.
1.2.5. Previous evaluations of the ISCED and the CASMIN classification
Kerckhoff and colleagues published two articles concerned with the evaluation ofISCED–76 and CASMIN for a small number of countries, namely Great Britain, Ger-many, the Netherlands, Sweden and the United States (Kerckhoff and Dylan, 1999) andGreat Britain, the Netherlands and the US (Kerckhoff et al., 2002). ISCED–76 differsfrom the ISCED–97 in several respects: Firstly, in the earlier version, there were nocomplementary dimensions (A, B and C as well as vocational/general or programmeduration). Secondly, the ISCED–97 level 4 (post-secondary non-tertiary education) wasnot available. Thirdly, the ISCED–97 levels 5 and 6 version were split in three levels inISCED–76 (4: tertiary qualifications without academic degree; 5: first university degreeor equivalent; 6: post-graduate university degree or equivalent).
The methodological rationale of the analyses performed in these evaluations is thatthere are two sources of variation of the association of educational attainment with someconstruct of interest (e.g. occupational status) over countries:
• Firstly, the actual association with the construct of interest may differ over countries(this is what a researcher is actually interested in).
• Secondly, different measures of educational attainment measure the actual level ofattainment differently well, which may change the association depending on whichmeasure is used.
The latter can be checked by comparing the association produced by different comparablemeasures of educational attainment with the association produced by a good nationalmeasure within countries. If the results differ a lot, those “comparable” measures thatconsiderably distort the strength of the relationship should not be used to assess cross-national variations in the association of interest.
The comparison of CASMIN and ISCED–76 in Kerckhoff et al. (2002) shows that inGreat Britain and the Netherlands, CASMIN performs better than ISCED–76. This isbecause ISCED–76 does not differentiate between vocational and general education; adistinction which will prove to be very important in many European countries. In the USin turn, ISCED–76 works better. Therefore, as a first result, the reclassifications imposed
10

by either international framework are not equally adequate in all countries. It howeverremains unclear if ISCED–76 works “equally bad” in all European countries (which wouldactually be better than differences between countries in the appropriateness of ISCED).
For the evaluation of ISCED–76, Kerckhoff and Dylan (1999) use data from theInternational Adult Literacy Study (OECD and Statistics Canada, 1995) from GreatBritain and the United States. They compare R2s reached by regressing occupationalprestige scores (Treiman, 1977) and cognitive skills on education measured in threeways: Using the ISCED as implemented by the national researchers, using the nationaleducational attainment classification, and using the ISCED as recommended by theOECD. The national classification is used as a benchmark. The authors summarise theresults as follows:
1. “Relatively minor changes in the classification of the indigenous creden-tials into standard categories (in this case the ISCED categories) can alterthe associations between educational attainment and both occupationalprestige and cognitive skill.
2. Both constructions of standard categories underestimate the associationsbetween educational attainment and two important outcomes (occupa-tional prestige and cognitive skill).
3. Underestimation is much greater in one country (Great Britain) than inanother (the United States).
4. The different underestimates lead to misleading impressions of the relativeimportance of educational attainment in the two countries by makingthe differences look larger than they actually are” (Kerckhoff and Dylan,1999, p. 770).
Additionally, both articles also come to the conclusion that the ISCED is not alwaysimplemented in the way recommended by the OECD, and that it also matters whichcategories of the national classification are collapsed. In sum, “the important conclusionto be reached is that the way in which the standard categories are constructed fromthe indigenous categories can make a major difference in the kinds of results that areproduced in comparative research” (Kerckhoff and Dylan, 1999, p. 769). More generallyit is noted that neither CASMIN nor ISCED–76 offer enough categories to adequatelyrepresent the important distinctions in educational credentials.6
These results are certainly worrying and very instructive. However, the studies byKerckhoff and colleagues share three drawbacks: firstly, results achieved with ISCED–76might differ from those achieved with the ISCED–97. It is quite plausible that the majorrevision of the ISCED undertaken in 1997 improved the measure. Therefore, these studiesneed updating. Secondly, as the IALS data only included the major occupational categoriesof ISCO-88, the measures of occupational status and prestige used in both studies are verycrude, which might have influenced the results (probably by underestimating the degree of
6Braun and Müller (1997) and Kerckhoff et al. (2002) evaluate CASMIN more in depth and both proposea number of changes. As the main focus of this paper is a validation of the ISCED–97, these studieswill not be further discussed here.
11

underestimation resulting from harmonising education measures). Thirdly, Great Britainand the US are the focal countries of comparison, and we still lack knowledge about theeffects of harmonising education in other countries. It is therefore vitally important tocheck the implementation of the ISCED–97 in more recent cross-national surveys andassess its validity for a larger number of countries, using more detailed occupationalattainment measures.
Kolsrud and Skjåk (2005) in their discussion of the harmonisation of backgroundvariables in the ESS also touch on the measure of education in the ESS. They finddifferences within ISCED levels between lower secondary technical and general educationwith respect to attitudes towards immigrants in the Netherlands. Looking into the bridgingof NEVs into the ESS coding frame in three other countries, they also find inconsistent useof the two categories for tertiary education, not in line with the UNESCO’s documentationof the ISCED–97 (UNESCO, 2006 [1997]). The conclusions resemble those by Kerckhoffet al.: the aggregation of subcategories as a result of output harmonisation can lead toa loss of important characteristics of the data. Additionally, those implementing thereclassification might not have a common understanding of the intended comparablevariable. The authors therefore suggest that “a centrally coordinated review of the nationalinput instruments and the national bridging into the common ESS coding frames wouldhave to be considered” (Kolsrud and Skjåk, 2005, p. 176). This paper is one step in thisdirection.
2. Evaluating the measurement of educational attainment inthe European Social Survey
The European Social Survey (ESS, Jowell and the Central Co-ordinating Team, 2003,2005) is a biennial cross-national survey in the form of repeated cross sections. It coversthe general population from age 15 upward in (currently) 27 mostly European countries.7
For this study, the data for the first two rounds (collected in 2002/2003 for ESS 1and 2004/2005 for ESS 2) are analysed (data for round three will become availablein early 2008).8 The ESS “aims to pioneer and ‘prove’ a standard of methodology forcrossnational attitude surveys that has hitherto not been attempted anywhere in theworld” (Jowell and the Central Co-ordinating Team, 2003). Its main focus are people’sattitudes and underlying values, but it also contains a number of social backgroundvariables of individuals as well as their partners and parents, which makes it attractivefor comparative social stratification and mobility research.
The evaluation of the ISCED–97 in the ESS is performed in three steps. Firstly, it willbe explained how the ISCED–97 was implemented in the ESS (see section 2.1). As asecond step, content validity will be investigated (see section 2.2). In a third step, the
7These are Austria, Belgium, the Czech Republic, Denmark, Estonia, Finland, France, Germany, Greece,Hungary, Iceland, Ireland, Israel, Italy, Luxembourg, the Netherlands, Norway, Poland, Portugal,Slovakia, Slovenia, Spain, Sweden, Switzerland, Turkey, the Ukraine and the United Kingdom.
8The actual editions of the data used are edition 6 for ESS 1 and edition 3 for ESS 2.
12
consequences of harmonisation and the discriminatory power of the simplified ISCED–97are checked (see section 2.3).
2.1. The implementation of the ISCED–97 in the ESS
It can be assumed that a complex measure like the ISCED–97 is not easily implemented,so that the way this is done will have a considerable effect on the quality of the data. Itis also important because this is the point where potential improvements can be managedby the ESS co-ordinators.
The ESS includes three measures of educational attainment:
Years of education: Respondents were asked about how many years they spent in edu-cation.9 In the analyses presented in this paper, years of education are thus notderived from categorical data on the level of education completed (“virtual years ofschooling”).
National education variables (NEVs): Respondents were asked about their highest levelof education completed using country-specific response categories.10 A few countries(Finland, Iceland and Slovenia), however, used response categories which supposedlylink directly with the cross-national variable (see below) and thus did not provide anational variable. Turkey also did not provide a NEV.
Cross-nationally comparable variable (CCV): the NEVs were reclassified into the sim-plified ISCED–97, which was agreed upon centrally before fielding the survey, aftersome discussion (see Erikson and Jonsson, n.d.). This means that an “ex-anteoutput harmonisation approach” was chosen for the ESS. The reduced ISCEDvariable only distinguishes levels of education, but neither programme orientationnor programme destination (general/academic or vocational). Apart from this, theonly deviation of the cross-nationally comparable variable in the ESS from theISCED–97 is that ISCED 0, “pre-primary education” is changed into “not completedprimary education”, as appropriate for educational attainment measurement.11
The CCV is therefore much less detailed than originally recommended by Robert Eriksonand Janne O. Jonsson, who were consulted as academic specialists on the measurement ofsocial position during the ESS questionnaire development. In their proposal for measuringsocial structure to be included in the core module of the ESS, they had recommended tocollect educational attainment data with an open question and subsequent coding (i. e.the same procedure as used for the coding of occupations in the International Standard
9Questionnaire item F7, variable eduyrs: How many years of full-time education have you completed?[To be reported in full-time equivalents, including compulsory/mandatory years of schooling]
10Questionnaire item F6, variable edlvxx (with xx being a placeholder for the two-letter country codes):What is the highest level of education you have achieved?
11The resulting variable is edulvl, with the following response categories: 0: Not completed primaryeducation; 1: Primary or first stage of basic; 2: Lower secondary or second stage of basic; 3: Uppersecondary; 4: Post secondary, non-tertiary; 5: First stage of tertiary; 6: Second stage of tertiary; 7:Refusal; 8: Don’t know; 9: No answer.
13
Classification of Occupations 1988, ISCO–88). Erikson and Jonsson (n.d.) alternativelyrecommended to use a less simplified version of the ISCED covering ten categories, at leastdistinguishing general and vocational education at ISCED levels 2, 3, 4 and 5. The formerwas seen as unfeasible; why the latter was not implemented remains unclear. The resultis that one of the original reasons for using the ISCED rather than CASMIN in the firstplace, namely greater flexibility and a higher degree of differentiation, was compromisedduring the implementation process.
The recoding of the NEVs into the CCV was performed by the national teams in therespective countries, so that the reclassification decisions in the different countries weremost probably autonomous, which could have led to inconsistencies in the application ofthe ISCED–97. The Norwegian Social Science Data Services (NSD), hosting the ESS dataarchive, provided the following pieces of information about the ISCED–97 on a specialweb-site in order to support the national teams with the recoding work:12
• For ESS round 1, the UNESCO’s operational manual (UNESCO, 1999) as well as ashort description of the differences between the ISCED–97 and edulvl was provided.
• For ESS round 2, in addition to the UNESCO’s operational manual, a two-pagedocument (Norwegian Social Science Data Services, 2004) with more instructionson how to process the national education variables was provided, including table 1(levels of education at a glance) from UNESCO (2006 [1997], p. 19).
• For ESS round 3 finally, also the mappings linking national educational programmesto the ISCED–97 categories were provided, and the two-page document referred toabove was improved. National co-ordinators are however not asked to follow thesemappings – they are rather provided as an example on “how the ISCED–97 wascoded in other surveys.”
The instructional document (Norwegian Social Science Data Services, 2004) explicitlystates that
Countries should use the best possible nationally designed question(s) tomeasure respondent’s highest level of education. [. . . ] National measurementsmust when necessary be adjusted to ensure complete coverage of relevantcategories in edulvl. All categories 0-6 should be represented in nationalquestionnaire.
Therefore, more and more documentation about the ISCED–97 became available tonational teams in the ESS over the years, with the mappings of national categories tothe ISCED–97 unfortunately only from round three onwards. The quality of NEVs wasalso emphasised more strongly over the single rounds. It can thus be expected that theimplementation of the ISCED–97 in the ESS improved from round one to round two, andwill improve again in round three. Generally speaking, some effort was made centrally toensure adequate coding practice. It is unclear however how much effort and understanding12I would hereby like to thank the staff at NSD, especially Hilde Orten, for their co-operation and the
provision of information on the implementation of the ISCED–97 in the ESS.
14

the national teams in the different countries put into the recoding of the NEVs into edulvl,e.g. in terms of reading the documentation on the ISCED–97 provided, and thus if theyapplied consistent decision rules (which is problematic whenever national teams applyan international classification to the national data, Kerckhoff and Dylan, 1999). Thiscan only be evaluated if the reclassification practice is compared over countries by oneresearcher (or just a few people), which is the strategy followed here. Therefore, the nextsection will more closely look into how the recoding was actually done.
2.2. Evaluating the reliability of re-classifications
In order to evaluate how the NEVs were recoded into the supposedly cross-nationallycomparable variable in the ESS, the compliance of the ISCED-variable edulvl in theESS with the criteria set out by the UNESCO (UNESCO, 2006 [1997], 1999) and theOECD mappings (OECD, 1999) was checked. In order to find out how national educationvariables were translated into the ISCED–97 in the ESS countries, cross-tabulations ofthe national education variables by the cross-nationally comparable education variableare analysed in detail.
The original national response categories of the NEVs (edlvxx ) were reproduced fromthe country questionnaires, as the English value labels were often too generic. Whenexamining the cross-tables of edulvl and edlvxx, it turned out that in many instances,the national teams did not follow the definitions established by the UNESCO (2006[1997]) and the recommendations given in the OECD’s manual on the application of theISCED–97 (OECD, 1999). Different classification decisions were taken with respect tosimilar educational programmes in different countries, leading to edulvl in fact not beingcross-nationally comparable. Thus, a number of corrections are proposed and correctedsimplified ISCED–97 variables are coded. The most common classification errors andproblems are summarised in the following paragraphs.
Problems with respect to the distinction between ISCED levels 0, 1 and 2: Firstly,in seven countries,13 either ISCED level 0 or 1 was not used. These countries onlydistinguish between completed compulsory education or the lowest national certificate asISCED 2 and less than compulsory education or no certificate as ISCED 0 or 1. This isunderstandable, as the differentiation between ISCED 0 and ISCED 1 is insignificant (andthus inefficient) in most European countries (see also table 1 below). the ISCED–97 washowever developed for a wider range of countries. Here, in order to achieve comparability,ISCED 0 and 1 are distinguished post-hoc using years of education as a proxy variable:respondents with less than 4, 5 or 6 years of education are assigned to ISCED 0, andthose with more than 4, 5 or 6 years of education to ISCED 1 (depending on the durationof primary education in the respective country, taken from OECD, 1999).
Secondly, in a number of ESS countries, primary school and lower secondary schoolform one institution, internationally called “basic school”, which lasts 8 to 10 years andusually covers compulsory education. Most of these countries properly coded the endof basic school as ISCED 2, whereas in Hungary, Iceland, Slovenia and Sweden basic
13Namely Austria, the Czech Republic, Germany, Israel, Poland, Slovakia and Switzerland
15
education in the respective country was mistaken for “primary education” in terms of theISCED–97 and falsely coded as ISCED 1. Thus, completed basic education has to bere-coded to ISCED 2 in these countries, and uncompleted basic education to level 0 or 1,depending on the years of education necessary to complete ISCED 1 (again derived fromOECD, 1999).
Sometimes the distinction between ISCED 3 and ISCED 4 is difficult or even impossible,because the certificates awarded are the same, and just the pathway taken differs (thisis e.g. often the case when the university entrance certificate is acquired after initialvocational education at ISCED level 3, or the other way round).14
Problems with respect to the distinction between ISCED 4 and ISCED 5: The differ-entiation of what constitutes (particularly vocational) tertiary education is difficult inmany countries. As a general rule, the OECD manual was applied here: OECD usesthe duration of such programmes for the distinction between ISCED level 4B/C and5B, so that post-secondary vocational programmes with a duration of two years or moreare classified as 5B, whereas shorter programmes are classified as 4B/C. In the ESS,qualifications at level 5B (e.g. master craftsmen, higher technicians, nursing and in somecountries teacher qualifications) were falsely assigned to level 4 in a rather large numberof countries (namely Austria, the Czech Republic, Denmark, Greece, Hungary (in 2004),Ireland, Israel, Italy, Slovenia, Spain, Switzerland and the UK). One explanation for thisis probably that national teams wanted to distinguish these qualifications from academichigher education (ISCED 5A), as the ESS coding scheme for education does not providefor a distinction between 5A and 5B. Otherwise they could have had ISCED–76 ratherthan the sISCED–97 in mind when doing the reclassifications, where level 4 in fact referredto below-degree tertiary qualifications. In order to maintain the differentiation betweenvocational and academic/professional tertiary studies, it would indeed be very worthwhileto distinguish between ISCED 5B and ISCED 5A. This is unfortunately currently notimplemented in the ESS, but could be achieved by the appropriate recoding of the NEVsfor the large majority of the countries. The distinction between ISCED 5B and 5A is soimportant that most countries distinguish the respective national qualifications in theirNEV.
Problems with respect to the distinction between ISCED 5 and ISCED 6: In 17 ofthe 27 countries, ISCED level 6, “second stage of tertiary”, was mistaken to relate to allpost-graduate degrees, i. e. Master’s degrees and upward, or even all academic degrees.15
ISCED 6 however is actually “reserved for tertiary programmes which lead to the awardof an advanced research qualification” (UNESCO, 2006 [1997], p. 39) and should thusonly include PhDs and equivalent degrees. The reason for this mistake is probably thatnational teams wanted to differentiate between undergraduate/lower level tertiary andpostgraduate/upper level tertiary degrees or maybe again still had ISCED–76 in mindwhen doing the reclassifications, where level 6 in fact referred to all post-graduate degrees.
14This applies e.g. to Austria, Germany, Hungary and Switzerland.15This happened in Austria, Belgium, the Czech Republic, Estonia, France, Hungary, Iceland, Ireland,
Israel, Italy, Norway, Poland, Slovakia, Slovenia, Sweden, Switzerland, Turkey and the Ukraine.
16

Thus, the corrected detailed 7-level ISCED variable is only available for 13 countries.16
In order to achieve a comparable variable including all countries, a less precise thesISCED–97 variable with 6 categories (ISCED (6) was constructed, aggregating ISCED 5and 6 in one category covering all tertiary education.
There are also a number of problems with the NEVs: Firstly, several countries (Austria,Denmark, Greece, Hungary, Italy, Norway, Poland, Spain, the UK) changed their nationaleducation variables in-between the two first rounds of the ESS, probably in order to improvemeasurement quality. Austria added one category (which however mixes up different levelsof the ISCED–97) and changed the labelling of response categories in the questionnaire.Denmark omitted one marginal category and also changed the questionnaire wordingfor the higher education responses (in such a way that qualifications are distinguishedby programme duration rather than institution or certificate). Greece added a categoryfor PhDs, Italy a category for post-secondary non-tertiary education. Hungary addedtwo advanced vocational categories. Norway switched from register data to actuallyasking people for their level of education (no other country used register data in eitherround of the ESS). Poland omitted two categories measuring non-completed educationalprogrammes in 2002, and added a “other” category. Spain added three and changed twocategories at the primary/lower secondary level, in order to better accommodate for thechanges in primary and lower secondary education in the Spanish educational systemover the last 30 years. With so many response categories only for primary education, theSpanish questionnaire item looks now quite difficult though, and there is wide variationin the number of years of education in these lower categories. Moreover, the assignmentof lower and advanced vocational education to edulvl was changed in-between rounds.17
For the UK, vocational qualifications were not covered in the questionnaire in the secondround of the ESS at all, which was an accidental slip (this was corrected in round three).
Secondly, some countries (e. g. Hungary, Israel, Poland in 2002, Sweden) use specificcategories like “Uncomplete higher qualification”, “not completed University” or “dropoutsfrom . . . ”. These were re-coded downward so that the variable reflects the highest level ofeducation completed in all countries.
Thirdly, despite the NSD’s request, a number of countries did not collect sufficientlydetailed information on educational attainment for coding even into the simplified versionof the ISCED–97. With such sparse information, the correction of misclassifications,let alone refinement of the cross-nationally comparable variable, are ruled out. Themost problematic case in this respect is Austria. Apart from putting all ISCED 5Aqualifications into ISCED 6, coding ISCED 3A qualifications as ISCED 4 and not coveringISCED 1, in the second round of the ESS, programmes belonging to level 4A, 5B and5A(short) are mixed up in edulvl 4 (while such programmes are not explicitly covered inthe first round at all, although BAs might be included in edulvl 6). Edlvat thus cannotbe correctly coded into the sISCED–97 for either year.
16Four countries, namely Belgium, Estonia, Hungary and Norway distinguished Master degrees fromPhDs in the NEV.
17For the construction of the corrected the ISCED–97 variable here, the ESS 1 coding was applied to ESS2, thus following the OECD manual. The mean years of education of both vocational qualificationssuggest that this is more appropriate than the alternative.
17

Also very sparse is the information for the UK. In the second round, vocationalqualifications were not covered at all, so that these data cannot be compared cross-nationally. In the first round, the national variable just provides enough information forcoding into edulvl, but does not allow any distinction between vocational and generalqualifications (particularly GCSEs and NVQ 1 and 2 or A-Levels and NVQ 3) or firstand second degrees. The national team also did not follow the OECD manual in a casewhere the reclassification into the ISCED–97 is controversial. The issue here is that inthe UK, it is important to distinguish people who left school at age 15 or 16 withoutany credential from those who left school with GCSEs on the one hand, but also todistinguish people with GCSEs from those with A-Levels on the other hand. In Britishresearch, even the results achieved in GCSEs (A to C and D to G) are differentiated.Concerning the reclassification into ISCED, when the ISCED subcategories A, B and Care not used, one is confronted with the unpromising choice of merging GCSEs either withthe no qualification or the A-Levels category, each of which is unsatisfactory. The OECDmanual recommends the latter, which leads to an unrealistic upgrading of the Britishdistribution of education. However, the OECD solution was found to lead to much higherexplanatory power than the alternative (Kerckhoff and Dylan, 1999). In the correctedvariables, I thus followed the OECD manual. This is a prime example for the conflictbetween comparability and explanatory power, as GCSEs are, from an international pointof view, no upper secondary qualification. The only workable solution which would be inaccordance with the ISCED–97 really seems to distinguish ISCED 2A (GCSEs, givingaccess to more advanced general education) from ISCED 2B (leaving secondary schoolwithout a qualification giving access to upper secondary education, thus leading to somevocational education or the labour market), which is however not implemented in theESS. An alternative option which would however deviate from the ISCED–97 would beto include respondents without qualifications in ISCED level 1.
Lastly, in contrast, other countries collect quite detailed information, with sometimes 15“indigenous” categories or more (Switzerland, Luxembourg, Spain (2004)). In the case ofGermany, however, it was unclear how the comparable variable edulvl was constructed, asno obvious mapping emerged from the cross-tabulation of edlvde and edulvl. Nevertheless,as all source variables are available (data on educational attainment are collected withseveral questionnaire items like in the German microcensus), a very detailed NEV couldbe constructed and the ISCED–97 derived from it, with somewhat deviating results fromedulvl.
As the OECD manual can be assumed to provide a good coding standard, correctedcross-nationally comparable education variables were constructed, generally followingthe OECD’s mappings of national categories to the ISCED–97. Variable ISCED (7)corresponds to edulvl, but includes all corrections of misclassifications. It thus consistsof the full number of seven categories, but is only available for 13 countries. ISCED (6)summarises both stages of tertiary education into one category, resulting in six categories.18
18A detailed overview over the actual coding of the ISCED–97 in the ESS (edulvl) and coding accordingto the OECD manual is given in table 6 in the appendix.
18
2.3. Evaluation of the effects of harmonising national educationalattainment variables
This part consists of three evaluations: Firstly, the distributions of educational attainmentusing the ISCED–97 are analysed. Particular attention has to be paid to categories thatare very common as well as to empty categories.
Secondly, in order to establish the amount of and cross-national differences in the lossof predictive power introduced by harmonising the NEVs, a strategy similar to the oneused by Kerckhoff and Dylan (1999) and Braun and Müller (1997) is followed. Regressionanalyses of occupational attainment (measured using the International Socio-EconomicIndex of occupational status, short ISEI scores, Ganzeboom, de Graaf, and Treiman, 1992)on educational attainment, measured in three different ways, are conducted and comparedin the single countries included in the ESS. The measures of educational attainment arethe NEVs included in ESS;19 the corrected simplified ISCED–97 variables ISCED (7) andISCED (6), and years of education.
Thirdly, national education categories will be collapsed “step by step” in order to findout where exactly the aggregation of categories is most consequential. Otherwise theset-up is identical to the previous step.
With the exception of years of education, the education variables are included in themodels as dummy variables. Age and gender will be controlled for, but the results for theNEV without controls are shown as well. A comparison of adjusted R2s over measuresof education within countries will reveal the loss of discriminatory power resulting fromharmonisation. As the amount of loss might be influenced by the absolute level ofassociation, relative loss is computed (the adjusted R2s of the regression of ISEI scoreson the NEVs being set to 100%). A comparison of these relative losses over countrieswill show possible differences in the adequacy of the sISCED–97 and years of educationbetween countries.
ISEI scores were chosen as the criterion against which to validate the different educa-tional attainment measures because it is one of the variables with the closest associationwith education (also because education, measured in years, was implicated in the con-struction of the ISEI scale) and can thus be expected to be very sensitive with respectto the quality of measurement of educational attainment. ISEI scores are also more orless closely related to many other socio-economic variables, like social class membership,occupational prestige scores and income (Ganzeboom et al., 1992). The fact that ISEIscores are a quasi-continuous measure also means that firstly, simple OLS regressions canbe used, that secondly, the interpretation is more straightforward, and thirdly, samplesizes are less of a problem because of the higher statistical power.
For the following empirical analyses, the sample was restricted to the economicallyactive population (including the temporarily unemployed) for whom the variables onoccupation (ISCO–88), education (NEV), age and sex were not missing. Additionally, an
19If the country reported to collect the data using ISCED, the variable edulvl was copied into areconstructed NEV for the respective country (Finland, Iceland, Slovenia), as was done for Turkey, asthe NEV was missing.
19
age restriction (25-69) was applied. Therefore, respondents who indicated that their mainactivity was education are excluded.
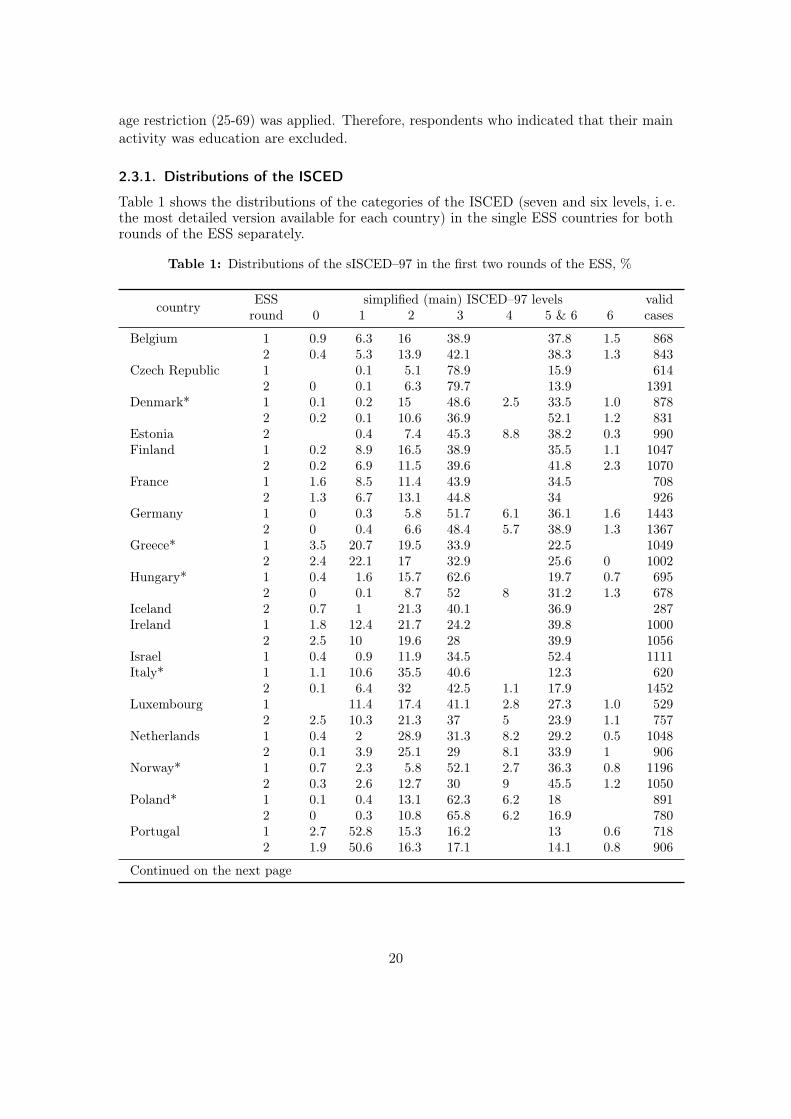
2.3.1. Distributions of the ISCED
Table 1 shows the distributions of the categories of the ISCED (seven and six levels, i. e.the most detailed version available for each country) in the single ESS countries for bothrounds of the ESS separately.
Table 1: Distributions of the sISCED–97 in the first two rounds of the ESS, %
country ESS simplified (main) ISCED–97 levels validround 0 1 2 3 4 5 & 6 6 cases
Belgium 1 0.9 6.3 16 38.9 37.8 1.5 8682 0.4 5.3 13.9 42.1 38.3 1.3 843
Czech Republic 1 0.1 5.1 78.9 15.9 6142 0 0.1 6.3 79.7 13.9 1391
Denmark* 1 0.1 0.2 15 48.6 2.5 33.5 1.0 8782 0.2 0.1 10.6 36.9 52.1 1.2 831
Estonia 2 0.4 7.4 45.3 8.8 38.2 0.3 990Finland 1 0.2 8.9 16.5 38.9 35.5 1.1 1047
2 0.2 6.9 11.5 39.6 41.8 2.3 1070France 1 1.6 8.5 11.4 43.9 34.5 708
2 1.3 6.7 13.1 44.8 34 926Germany 1 0 0.3 5.8 51.7 6.1 36.1 1.6 1443
2 0 0.4 6.6 48.4 5.7 38.9 1.3 1367Greece* 1 3.5 20.7 19.5 33.9 22.5 1049
2 2.4 22.1 17 32.9 25.6 0 1002Hungary* 1 0.4 1.6 15.7 62.6 19.7 0.7 695
2 0 0.1 8.7 52 8 31.2 1.3 678Iceland 2 0.7 1 21.3 40.1 36.9 287Ireland 1 1.8 12.4 21.7 24.2 39.8 1000
2 2.5 10 19.6 28 39.9 1056Israel 1 0.4 0.9 11.9 34.5 52.4 1111Italy* 1 1.1 10.6 35.5 40.6 12.3 620
2 0.1 6.4 32 42.5 1.1 17.9 1452Luxembourg 1 11.4 17.4 41.1 2.8 27.3 1.0 529
2 2.5 10.3 21.3 37 5 23.9 1.1 757Netherlands 1 0.4 2 28.9 31.3 8.2 29.2 0.5 1048
2 0.1 3.9 25.1 29 8.1 33.9 1 906Norway* 1 0.7 2.3 5.8 52.1 2.7 36.3 0.8 1196
2 0.3 2.6 12.7 30 9 45.5 1.2 1050Poland* 1 0.1 0.4 13.1 62.3 6.2 18 891
2 0 0.3 10.8 65.8 6.2 16.9 780Portugal 1 2.7 52.8 15.3 16.2 13 0.6 718
2 1.9 50.6 16.3 17.1 14.1 0.8 906
Continued on the next page
20

Table 1: Distributions of sISCED–97 in the first two rounds of the ESS, % (continued)
country ESS simplified (main) ISCED–97 levels validround 0 1 2 3 4 5 & 6 6 cases
Slovakia 2 0.3 0.8 6.4 73.6 3.4 15.5 715Slovenia 1 0 2 16.4 58.7 22.9 603
2 0.3 1.8 11.3 63.8 22.9 621Spain* 1 6 14 21.2 22.3 11 25.4 0.9 739
2 4 22.8 18.9 13.4 10.3 30.7 0.9 825Sweden 1 0.1 7 32.5 30.3 30.1 1152
2 0.1 6 31.6 30.9 31.4 1122Switzerland 1 0.2 0.2 8.7 54.4 36.6 1069
2 0.1 1.1 6.9 55.2 36.6 1149Turkey 2 8.5 45.4 11.8 21.5 12.8 550Ukraine 2 0 0.2 3.4 27 47.2 22.2 821United Kingdom 1 0 0.2 17.6 39.3 42.9 1.4 1014
average 1.4 8.2 15.5 42.3 8.5 29.7 1.1min 0.1 0.1 3.4 13.4 1.1 12.3 0.3max 8.5 52.8 35.5 79.7 47.2 52.4 2.3
Note: ESS 2002/2003, 2004/2005, own calculations. Respondents aged 25-69 and in the labourforce. *: NEV changed in-between rounds.
Three things stand out here: Firstly, the most substantial changes within countries overrounds can be observed in some of the countries where the NEV was changed. Particularlyfor Denmark, Hungary, Norway and maybe also Spain, comparability over time is possiblynot given. The changes in the Polish, Italian and Greek questionnaires were obviouslyless consequential. But even in those countries where the NEV was not changed at all in-between the two rounds, there are some substantial differences in the ISCED distributionsbetween ESS 1 and ESS 2 (e. g. in Luxembourg and Slovenia; both countries with rathersmall samples). This can hardly be attributed to actual change, but will rather be due tosampling variation, and maybe systematic differences in data collection between rounds(the reclassification of NEVs into the ISCED–97 was made identical in both rounds duringthe process of content validation and correction, if there were any differences). Secondly,there are enormous differences between countries in the distribution of the ISCED–97,with all but ISCED level 0 and 6 being substantial in at least some countries. Thesedifferences largely reflect differences in economic development and educational expansion,but also in the historically varied evolution of the 26 educational systems.
Thirdly, and most importantly, there are many instances where more than 40% ofthe population fall into a single the sISCED–97 category. This makes clear that thesISCED–97 in this reduced form does not reflect the diversity of national credentials,and will probably have less explanatory power than could be achieved with a moredifferentiated scheme. This is clearly worst at ISCED level 3, and particularly in Centraland Eastern European Countries: In the Czech Republic, Germany, Hungary, Norway(2002), Poland, Slovakia, Slovenia and Switzerland, close to or more than 50% of thepopulation are classified as ISCED level 3. In Denmark (2004), Israel, Ireland, Norway
21
(2004) and the UK, more than 40 % are classified as ISCED level 5 (or 5/6, where 5 and6 could not be distinguished). It is however also a problem at ISCED level 1 in Portugaland Turkey, and at ISCED level 4 in the Ukraine (which looks strange anyway, as ISCED4 is usually not a major category). Obviously distinguishing general and vocationalprogrammes at level 3 and academic/professional and vocational programmes at level5 would not only make the recoding of NEVs to CCV easier for national teams, but itwould also give a more adequate picture of educational distributions cross-nationally.
2.3.2. Predictive power of the sISCED–97
In this section, model fit measures of several regression models will be compared withincountries in order to answer the question of how much predictive power is lost (or byhow much the association between education and occupational status is attenuated)by reclassifying NEVs into the sISCED–97 (ISCED (7) and ISCED (6)), and how theNEVs compare with years of education. Then, it will be evaluated if these losses differover countries, which is the central question for assessing the validity of cross-nationalcomparisons with respect to these models. The amount of loss of explanatory power thatoccurs when using cross-nationally comparable educational attainment measures will bemeasured as the ratio between the adjusted R2s resulting from regressing ISEI scores onthe cross-nationally comparable measure of educational attainment and the adjusted R2sresulting from regressing ISEI scores on the national education variables (i.e. relativeadjusted R2s).
Table 2 shows the R2s from regressing ISEI scores on education as measured by theNEVs with and without controls for age and gender (absolute adjusted R2), the sISCED–97in two levels of detail (with 7 and 6 categories), and years of education for each of the 27countries included in the first two rounds of the ESS (all relative adjusted R2s in percentof the adjusted R2 of the NEV, all controlling for age and gender).
Let’s first have a look at the results with reference to the NEV (columns NEV, withand without controls for age and gender), which, needless to say, achieves the highestR2s compared to the other columns (i.e. the values in the other columns are usuallybelow 100%). Relatively high R2s here mean that firstly, there is a high associationbetween educational attainment and occupational status in a country, and secondly, thateducational attainment was probably measured with a high degree of discriminatorypower. Relatively low R2s using the NEV in turn do not necessarily mean that educationis less important for occupational attainment in the respective country. It could equallywell mean that important differences in educational attainment are not mirrored by theNEV. Although the NEVs are the most appropriate measures for educational attainmentavailable in the ESS, they must be assumed to produce still rather conservative estimatesfor those countries where the NEV is not sufficiently detailed.
22
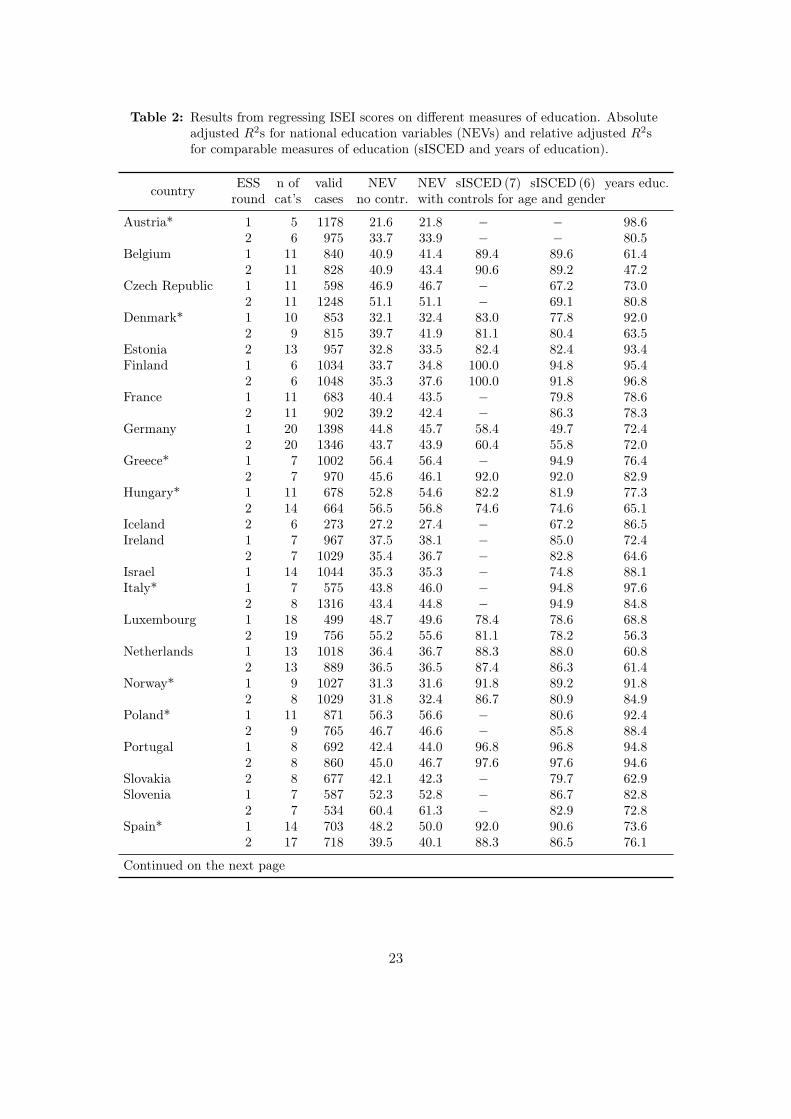
Table 2: Results from regressing ISEI scores on different measures of education. Absoluteadjusted R2s for national education variables (NEVs) and relative adjusted R2sfor comparable measures of education (sISCED and years of education).
country ESS n of valid NEV NEV sISCED (7) sISCED (6) years educ.round cat’s cases no contr. with controls for age and gender
Austria* 1 5 1178 21.6 21.8 − − 98.62 6 975 33.7 33.9 − − 80.5
Belgium 1 11 840 40.9 41.4 89.4 89.6 61.42 11 828 40.9 43.4 90.6 89.2 47.2
Czech Republic 1 11 598 46.9 46.7 − 67.2 73.02 11 1248 51.1 51.1 − 69.1 80.8
Denmark* 1 10 853 32.1 32.4 83.0 77.8 92.02 9 815 39.7 41.9 81.1 80.4 63.5
Estonia 2 13 957 32.8 33.5 82.4 82.4 93.4Finland 1 6 1034 33.7 34.8 100.0 94.8 95.4
2 6 1048 35.3 37.6 100.0 91.8 96.8France 1 11 683 40.4 43.5 − 79.8 78.6
2 11 902 39.2 42.4 − 86.3 78.3Germany 1 20 1398 44.8 45.7 58.4 49.7 72.4
2 20 1346 43.7 43.9 60.4 55.8 72.0Greece* 1 7 1002 56.4 56.4 − 94.9 76.4
2 7 970 45.6 46.1 92.0 92.0 82.9Hungary* 1 11 678 52.8 54.6 82.2 81.9 77.3
2 14 664 56.5 56.8 74.6 74.6 65.1Iceland 2 6 273 27.2 27.4 − 67.2 86.5Ireland 1 7 967 37.5 38.1 − 85.0 72.4
2 7 1029 35.4 36.7 − 82.8 64.6Israel 1 14 1044 35.3 35.3 − 74.8 88.1Italy* 1 7 575 43.8 46.0 − 94.8 97.6
2 8 1316 43.4 44.8 − 94.9 84.8Luxembourg 1 18 499 48.7 49.6 78.4 78.6 68.8
2 19 756 55.2 55.6 81.1 78.2 56.3Netherlands 1 13 1018 36.4 36.7 88.3 88.0 60.8
2 13 889 36.5 36.5 87.4 86.3 61.4Norway* 1 9 1027 31.3 31.6 91.8 89.2 91.8
2 8 1029 31.8 32.4 86.7 80.9 84.9Poland* 1 11 871 56.3 56.6 − 80.6 92.4
2 9 765 46.7 46.6 − 85.8 88.4Portugal 1 8 692 42.4 44.0 96.8 96.8 94.8
2 8 860 45.0 46.7 97.6 97.6 94.6Slovakia 2 8 677 42.1 42.3 − 79.7 62.9Slovenia 1 7 587 52.3 52.8 − 86.7 82.8
2 7 534 60.4 61.3 − 82.9 72.8Spain* 1 14 703 48.2 50.0 92.0 90.6 73.6
2 17 718 39.5 40.1 88.3 86.5 76.1
Continued on the next page
23

Table 2: Results from regressing ISEI scores on different measures of education (continued)
country ESS n of valid NEV NEV sISCED (7) sISCED (6) years educ.round cat’s cases no contr. with controls for age & gender
Sweden 1 12 1129 36.8 38.4 − 85.4 84.92 12 1100 40.8 42.8 − 88.6 85.7
Switzerland 1 15 1024 33.5 33.4 − 83.2 58.42 15 1125 33.1 33.1 − 67.7 58.0
Turkey 2 6 489 45.4 46.5 − 100.2 87.3Ukraine 2 7 791 45.6 45.8 − 99.1 74.7United Kingdom* 1 8 991 31.4 31.7 81.1 78.5 74.8
2 5 824 31.2 31.2 − − 58.3
average/total 38843 41.9 42.7 85.4 83.3 77.1min 5 273 21.6 21.8 58.4 49.7 47.2max 20 1398 60.4 61.3 100.0 100.2 98.6
Note: ESS 2002/2003, 2004/2005, own calculations. Respondents aged 25-69 and in the labourforce. * NEV changed in-between rounds; – variable not available. Adjusted R2 of the sISCEDand years of education relative to R2 of NEV.
The number of categories of the NEV (column n of cat’s) can be used to proxy thequality of the national measure. Of course less detailed measures are not necessarilybad (see e. g. Slovenia and Greece), and detailed measures not necessarily good. This isbest shown by looking at the changes of the NEVs for Denmark and Spain: Denmarkused one category less in 2004, but the discriminatory power of the NEV improved(probably because the wording of the response categories was improved), whereas in Spain,discriminatory power substantially decreased despite the addition of three categories.20
More generally it is clear that an appropriate degree of differentiation facilitates answeringthe questionnaire and improves discriminatory power, but there is probably no such thingas the optimal number of categories of a NEV. Particularly worrying are the NEVs forAustria, Finland, Ireland, Iceland, Turkey, the Ukraine and the UK (2004)—all beingno more or even less detailed than the intended seven-level ISCED variable, showingrather low associations with ISEI-scores and possibly not well representing the full rangeof educational qualifications in the respective countries. For Italy, Portugal, Slovakiaand the UK (2002) it does not look much better, as only eight national categories aredistinguished, and vocational qualifications are not always differentiated from general ones.The R2s with respect to the NEV in all these countries will possibly be underestimated.There is indeed a correlation of 0.2 between the R2s resulting from regressing ISEI scoreson the NEVs, and the number of categories in the national education measure. Theresults for the UK are also below the ones reported by Kerckhoff et al. (2002).
In the case of Estonia, Israel and (maybe surprisingly) the Netherlands and Switzerland,it rather looks as if educational attainment is really less important than in most othercountries, as the respective NEVs are relatively detailed (13 to 15 categories), and still
20Maybe the new categories in the Spanish questionnaire were too difficult to use for the respondents—there were e. g. seven response categories covering no to lower secondary education.
24
the R2s from regressing ISEI on educational attainment are comparably low. The highestR2s in turn are estimated for the Czech Republic, Greece, Hungary, Luxembourg, Polandand Slovenia. Apart from Greece and Slovenia, the NEVs in these countries distinguishat least 11 categories. Either the Greek and Slovenian NEVs work really well (e.g.because their educational qualifications are less diverse), or the actual association betweeneducational attainment and occupational status is even higher than estimated here. Forthose countries that changed their NEV between rounds, there is a clear improvementfor Austria, Denmark and Hungary, whereas in Poland and Spain, the NEV got actuallysubstantially worse. The changes are not substantial for Italy and Norway, and for Greece,the rather big change in association cannot be explained by the change of the classification.
Comparing the different measures of education, there is no country where years ofeducation are a better predictor of occupational status than education as measured by theNEV (i.e. the relative adjusted R2s are throughout below 100%), despite the fact that theISEI was developed using years of education. In Austria, where the NEV is particularlybad (see p. 17), years of education comes pretty close, as it does in Finland, Portugaland Italy (2002)—all countries with NEVs that do not distinguish between general andvocational education. More importantly, there are large differences between countries inthe appropriateness of years of education as compared to the NEV. The difference betweenthe explanatory power of years of education and NEVs is largest in Belgium, Luxembourg,the Netherlands, Slovakia and Switzerland, with years of education having only around60 % of the explanatory power of the respective NEV. These are all countries where theNEV is rather detailed and where vocational education, which is not reflected in years ofeducation, plays a crucial role in social stratification processes and is differentiated in theNEVs. There is also a substantial degree of association (r = −0.47) between the numberof categories of the NEV and the predictive power of years of education relative to theNEV: the more differentiated the national measure, the larger its advantage in predictivepower compared to years of education.
Let’s now turn to the effect of collapsing categories, from the national variable tothe sISCED with seven (where available) or six categories. Firstly, harmonising thenational education variables even into the sISCED–97 leads to a visible attenuation of theassociation between occupational status and education in almost all countries (i.e. therelative adjusted R2s are below 100%, with one exception, where actually no collapsingwas necessary). This effect is strongest for the Czech Republic, Germany and Switzerland(2004), where the ISCED (6) explains more than 30 % less variation in ISEI scores thanthe NEVs. The predictive power of the ISCED (6) is also rather low for Denmark, Estonia,France, Hungary, Israel, Luxembourg, Norway (2004), Poland (2002) and Slovakia. Asthe distribution of the ISCED–97 shows (see table 1), in the Czech Republic, Germany(2002), Hungary, Poland and Switzerland, more than 50 % of the respondents are classifiedas ISCED level 3, and in a number of countries, this is between 40 and 50 %. The loss ofexplanatory power is weakest in Finland, Greece, Italy, Portugal, Spain (2002), Turkeyand the Ukraine. In all these countries but Spain this could be attributed to the rathercrude NEVs with only six or seven categories, which means that harmonisation doeshardly entail any collapsing of categories. For Spain, this interpretation is implausible, asthe national measure consists of 14 (2002) and 17 (2004) categories and predicts ISEI
25
rather well. The association between the number of categories in the NEV and relativepredictive power of the ISCED (6) is −0.28. This supports the hypotheses put forwardby Kerckhoff and Dylan (1999, p. 769), that “the greater the diversity of the indigenouscredentials, the more heterogeneous the standard categories are bound to be, and themore they will underestimate the association between educational attainment and othervariables.” However it is again unclear in how far the “simple” NEVs in some countries areappropriate or already abstractions from an actually much more diverse reality. Even so,the rank-correlation between the R2s from the NEVs and the ISCED (6) is 0.82, which israther too low for a valid comparable measure. It means that when ranking countriesin terms of how important educational attainment is for occupational status, we wouldcome to quite different conclusions, depending on which education measure (harmonisedor not) is being used.
To summarise, it is pretty clear that important distinctions between educationalattainment categories in many countries are not well captured by the sISCED–97. In anumber of countries, years of education explains more variation in ISEI-scores than thesISCED–97 relative to the NEV; in other countries however it is the other way round.There is large variation over countries in terms of the adequateness of the sISCED–97and years of education. Although the measurement quality of the NEVs is often unclear,it is clear that neither is a satisfying measure for educational attainment, which is mostvisible for countries with very detailed NEVs. Overall it seems as if Central and EasternEuropean countries are most problematic, probably because the reduced version of theISCED–97 does not differentiate general from vocational qualifications—a distinctionwhich is essential in these countries. This was already suspected by just looking at thedistributions of the sISCED–97 in the different countries (see table 1). Thus, not onlyfrom the point of view of implementation and applicability by national teams, but alsofrom the point of view of discriminatory power, the implementation of the ISCED–97 inthe ESS needs serious improvement.
2.3.3. Step-by-step collapsing of adjacent categories
As a next step, national educational categories that are supposed to be merged into onecategory in the ISCED–97 are collapsed one after the other, for each single country. Asan example, how much of the adjusted R2 from predicting ISEI scores by educationalattainment in Germany is lost when “Abitur” and “Fachhochschulreife” (both ISCED 3A)are collapsed? How much is lost by aggregating all qualifications at ISCED 3A and 3B(“Abitur”, “Fachhochschulreife” and “berufliche Ausbildung”) into ISCED level 3? Usingthis procedure, more detailed results on how loss of predictive power comes about can beachieved. Additionally, it is tested if some distinctions are necessary, namely betweenISCED level 0 and 1, and between ISCED level 5A (long) and 6. The results of suchnumerous regression analyses are not easily presented in a concise way though. Thereforeonly a summary of the results is given. Losses are given in relative terms only, with theadjusted R2s of regressing ISEI scores on the NEVs without controls (see table 2, columnfive) being used as the benchmark.
26
How important is the differentiation between ISCED level 0 and 1? With respect toaggregating everything which is less than compulsory education, there are hardly anyconcerns for European countries. In all countries but Portugal, where the loss of R2 isalso only around 2% in relative terms, this distinction is irrelevant, as the numbers ofcases with less than primary or only primary education are very low or indeed often zero.For social stratification in Europe today, if somebody finished primary education or not(given no compulsory school certificate) is rather unimportant: ISCED 0 and 1 as finallevels of educational attainment are both extremely low.
Aggregating different educational qualifications within ISCED level 2 can only betested for those countries where lower secondary education is or was tracked in someway (by school types or final certificates) and where the NEV reflects this.21 In mostof these countries, the effect of aggregating different qualifications at ISCED level 2 isnegligible; effects are 1% or less in Belgium, Germany, Estonia, Spain, Hungary (2002)and Luxembourg. Only in the Netherlands and Sweden there is some loss of predictivepower when collapsing different ISCED 2-qualifications (NL: 6.6% for ESS 1 and 2.4%for ESS 2; SE: 1.6 and 2.0% respectively). For Sweden, the different qualifications atISCED 2 refer to different historical periods, and the loss of explanatory power is reducedwhen age is controlled for. For the Netherlands, there might be a substantial gap betweenlower secondary vocational and general education. It is therefore arguable if qualificationsat ISCED level 2 should be differentiated according to programme orientation (2(G) forgeneral and 2(V) for vocational qualifications) or programme destination.
Usually one would argue that dropouts from ISCED level 3 should also be classifiedas ISCED 2, but the ISCED–97 does actually not include any formal guidelines onclassifying dropouts. A few countries collected information on incomplete qualifications,so that here we can test what happens if these are classified “downward”: For France,putting ‘Brevet’ (2A) and dropouts from ‘CAP’ and ‘BEP’ (incomplete 3C) togetherdecreases explanatory power by 2.5 % in ESS 1: the occupational status of upper secondaryvocational dropouts is considerably lower. They should thus rather be coded as ISCED2C. In contrast, ‘non diplomés jusqu’à la fin 3ème, 2nde, 1ère filière générale’ (incomplete3A), which would be coded as ISCED 2B, can be summarised with ‘Brevet’ without anysubstantial loss of predictive power despite a lower average ISEI-score. For Hungary(2004), aggregating lower secondary (2A) with incomplete upper secondary (incomplete3A) leads to 2 % loss of explanatory power - but here, in contrast to France, dropouts havehigher ISEI-scores than lower secondary graduates. They should therefore be classified3C rather than 2A or 2B. These examples show that maybe there should not be anygeneral rule for classifying dropouts, as the social meaning and consequences of incompletequalifications vary significantly over countries. Documentation on this issue would thenbe very important though.
For ISCED level 3, it is very clear that a distinction between different qualificationshas to be made. This already became clear when just looking at the distribution of theISCED (6) (see table 1, page 20). The detailed step-by-step analyses support this result:
21The Swiss, Austrian and British NEVs e.g. do not differentiate between the different lower secondaryschool tracks/certificates offered, which is regrettable
27

aggregating the different qualifications at ISCED level 3 into one category decreases thepredictive power of educational attainment with respect to ISEI scores substantially (i.e.by more than 4 % compared to the NEV) in Austria, Belgium (2004), the Czech Republic,Estonia, France, Hungary, Luxembourg, the Netherlands (2004), Poland, Slovenia andSlovakia (no such test was possible for Finland, Greece, Ireland, Iceland, Italy, Portugal,Turkey, the Ukraine and the UK, due to lack of detail of the NEVs). The differences inthe amount of loss of explanatory power are enormous, reaching up to 31 % for the CzechRepublic, 21 % for Slovakia and around 15 % for Luxembourg, Poland and Slovenia. Thissuggests that the labour market returns to different forms of upper secondary educationvary substantially between countries. For Germany, Israel and Sweden, only addingincomplete tertiary education (university dropouts) to upper secondary qualificationsleads to problems, so that this should be avoided. Again, a simple ‘downgrading-approach’does not work well.
ISCED 4 is hardly used by the ESS countries, so that there are no issues with collapsingdifferent qualifications within that level (remains the issue of possible under-coveragethough). However it was also tested if the few ISCED 4 qualifications used in theESS can be merged with similar qualifications at ISCED level 3 or 5.22 This workedpretty well in most cases, as these qualifications are either equivalent with ISCED 3A,or they mean that somebody completed 3A and 3B or 3C successively, which mightalso come close to qualifications at ISCED level 5B. In Luxembourg, ‘Brevet de maîtriseartisanale’ (4B) can be collapsed with 5B, which makes sense, as ‘Meister’ in Germany isequivalent and already classified as 5B. In Norway, 5B is empty, but 4C (e.g. ‘tekniskfagskole’) is functionally equivalent with 5B in other countries again. The same appliesto Poland, ISCED 4B (pomaturalne, policealne). For Germany, 4A (‘Abitur’ plusapprenticeship/vocational school) could be aggregated with 3A (‘Abitur’) without losingpredictive power or comparability (other countries offer vocational qualifications includinga university access certificate, which are also classified as ISCED 3A). The same applies tothe second cycle of vocational education in Spain, ‘Nadstavbové štúdium’ in Slovakia andmaybe ‘specializzazione post-diploma’ in Italy. Only in Estonia collapsing 3A with 4Adoes not work very well: The reason is that all upper secondary qualifications in Estoniaare classified ISCED 3A, but vocational upper secondary is significantly less valuablethan vocational education after upper secondary (4A) and professional upper secondaryeducation. As 3B and 3C are empty in Estonia, and only around 10% of vocationalsecondary graduates continue to some form of higher education (Saar, 1997), I wouldsuggest coding vocational upper secondary as 3B or 3C rather than 3A. Then 3A and 4Acan be aggregated with hardly any loss of predictive power.
With respect to ISCED level 5, the results are again very clear: lower and higher aswell as vocational and academic tertiary qualifications should not be mixed up in onecategory. Aggregating all ISCED 5 categories substantially decreases the predictive powerof educational attainment with respect to ISEI-scores in most countries where this couldbe tested: there are more than 4% loss in Belgium, Switzerland, Germany, Denmark,Estonia, Spain, Finland, Hungary (2004), Ireland, Israel, Norway and the UK. Variation
22As there are usually only few respondents in this category, these results are rather tentative.
28
is again high, with the largest losses occurring in Germany (27-31 %), Denmark (17-20 %),Switzerland (2004, 17 %) and the UK (2002, 16 %).23 This is due to the big difference inlabour market value between qualifications from short vocational tertiary programmesand those from long academic or professional university programmes.
Even summarising different qualifications within ISCED 5A or 5B, e. g. ‘short’ or‘first’ (say BA) and ‘long’ or ‘second’ (say MA) or lower and upper tier qualificationshad implications in some of the few countries where this could be tested. In Germany,summarising technical college diploma (‘Fachhochschulabschluss’) and university degreeleads to some loss of predictive power (2-3 %). In Hungary, this is even worse with losses ofup to 10 % in 2004 when aggregating college (főiskolai) and university (egyetemi) diplomas.In Italy, aggregating ‘diploma universitario’ and ‘laurea’ entails a loss of 2 % in 2004. InSpain, university is covered in a very differentiated way: short and long polytechnic andshort and long academic studies (four categories). Successive collapsing of these categoriesshows that first degrees should be differentiated from long ones rather than polytechnicfrom academic ones: Collapsing according to duration, there is practically no loss inpredictive power; collapsing according to polytechnic and academic leads to losses of 7 %(2002) and 12 % (2004).24 Putting them all in one category 5A leads to losses in predictivepower of up to 12 % again. In Denmark in 2002, short and long non-degree qualificationsdiffer in terms of their labour market value (2% loss when aggregated); however, as thehigher one is not a university degree, aggregating with those (unfortunately BAs andMAs were not distinguished in the NEV) only makes things worse (8 % loss). In Norway,collapsing degrees with four years duration or less with longer ones decreases the R2 inthe prediction of ISEI scores by 8 % (2002) and 14 % (2004) compared to the model usingthe NEV.
Finally, is it worth keeping a separate ISCED level only for doctorates? Wheneverthere were national categories for long academic university studies (5A(long)) and PhDs,aggregating the two had hardly any effects. However, summarising PhDs with 5Agenerally (thus lower and higher degrees) leads to a loss of predictive power in quite afew countries (Switzerland, Germany, Hungary, Iceland, Italy, Luxembourg (2004) andNorway). Therefore, if low and high university degrees are differentiated as suggested inthe previous paragraph, doctorates can be added to the ‘high’ category (but, at the stageof data collection and in the NEVs, it is recommended to cover them separately).
To summarise, the most important distinctions within ISCED–97-levels are betweenISCED levels 3A and 3B/3C on the one hand and ISCED levels 5A and 5B on theother. Whenever these subcategories are aggregated to the simplified main levels of theISCED–97, substantial amounts of variation are lost, which affect the results of empiricalanalyses and the cross-national comparability of these.
23In those countries where categories 5 (long) and 6 were combined in the NEV, collapsing this categorywith other ISCED 5 qualifications leads to large losses in explanatory power, too.
24This also makes sense as the latter distinction would reflect fields of study rather then level of education,which should not overlap.
29

3. A European Survey Version of the ISCED–97
As a final step, an alternative version of the ISCED–97 will be proposed, which would bemore efficient and more powerful than the reduced version of the ISCED–97 commonlyused. Firstly however let’s review the main issues with the ISCED–97.
The design of the ISCED–97 with seven levels of education suggests that the biggestdifferences in education are found between these levels. As the previous analyses haveshown, this would be a misjudgement: The seven main the ISCED–97 levels do not reflectimportant differences between qualifications on the one hand, and do distinguish betweenqualification which are hardly relevant in the European context nowadays, on the otherhand. In the European context, in many countries lower secondary education is virtuallyuniversal, ISCED 0 and 1 are negligible (as is ISCED 6, for obvious reasons) and ISCED4 does not exist in all countries and is marginal in most others. Therefore, the bulk ofpeople are found at ISCED 2, 3 and 5, which are by no means homogeneous categories.This is most obvious at the upper secondary level of education. In some countries, morethan 50% of the respondents are classified in this category (see table 1), although lookingat the national variables, their qualifications differ substantially. The simplified ISCED–97is thus neither efficient nor sufficiently distinctive.
ISCED–97 provides for this by being inherently multidimensional (see section 1.2.4);a detailed version of the ISCED–97 is however hardly ever used in surveys, probablybecause of the complexity of the classification framework.25 At ISCED level 3, it wouldbe indispensable to distinguish programmes giving access to academic higher educationfrom programmes that prepare for the labour market or more advanced vocationaltraining. Similarly, it would be very important to distinguish academic/professional andvocational programmes at the tertiary level, thus differentiating ISCED 5B from 5A. Byalso distinguishing university degrees like Bachelor (BA) and Master (MA) and equivalentswithin 5A one could even go further, differentiating 5A (short) and 5A (long).26
In order to improve the comparability and distinctiveness of the comparable measure ofeducational attainment in the ESS and other cross-national surveys, I would like to proposea differently simplified version of the ISCED–97: The European Survey Version of theISCED–97, the ES–ISCED. ES-ISCED is a simplification of the ISCED–97 for classifyinglevels of educational attainment for use in survey research in European and possibly otherdeveloped countries, which tries to overcome some of sISCED-97’s shortcomings. It buildson the concepts and national mappings of the ISCED–97 as set out by the UNESCO(2006 [1997]), but also incorporates some of the crucial ideas behind the CASMIN scheme(König et al., 1988; Müller et al., 1990).
The differences between the ISCED–97 and the ES–ISCED are as follows: Firstly,whereas the ISCED–97 categorises educational programmes, the ES–ISCED is more
25In the PISA studies, for the measurement of parental education, since 2003 there is a distinction takenbetween 3A vs. 3B/C and 5A/6 and 5B.
26In fact many countries make these distinctions in their NEVs, so that for the ESS 2002/03 and 2004/05,a more detailed version of the ISCED–97 be achieved by more detailed recoding for the current data.This would however mean losing those countries that did not differentiate these qualifications, wheresome changes of the NEVs should be made in future rounds of the ESS.
30
specifically designed for the measurement of individuals’ educational attainment. Thebasic unit of classification is therefore not an educational programme, but an educationalqualification, usually in the form of a certificate or diploma (i. e. the formal outcome ofsuccessfully completing an educational programme).27 Secondly, for actual surveys, thefull ISCED–97 is inefficient and too complex to be implemented in all its detail. Thecommon practice is to simply collapse all sub-categories within the seven main levels of theISCED–97, which is neither a substantively meaningful nor statistically efficient strategy.In contrast, the ES–ISCED offers a more efficient simplification of the ISCED–97 bycollapsing certain (sub-)categories of the classification, but not others, so that importantdistinctions are maintained, whereas irrelevant ones are dropped. The main simplificationsare as follows:
• the ISCED–97 levels 0 and 1 (less than primary and primary education) are sum-marised in one category (ES–ISCED I), which covers respondents without anyeducational certificates or only primary education completed.
• The distinctions within ISCED levels 2 and 3 (into A, B, and C as well as vocationaland general) are simplified to a dichotomy: IIb and IIIb indicate qualifications whichdo not lead to more general/academic education, whereas IIa and IIIa indicatequalifications that are usually part of the academic path which is supposed to finallylead to university. IIa and IIIa and are thus the more selective and demandingprogrammes, whereas IIb and IIIb do rather prepare for the labour market or furthervocational training.
• ISCED level 4, which is somewhat vague, is absorbed into the adjacent levels:ISCED 4A is equivalent to 3A anyway, and ISCED 4B and 4C are firstly rareand secondly functionally equivalent with what is classified as ISCED 5B in othercountries. Therefore 4B, 4C and 5B are summarised in a new category IV, labelled“advanced vocational education”.
• ISCED level 6 is so small that it is not efficient to reserve an extra category forit (unless there is an explicit interest in respondents with PhDs, which howeverrequires a rather large sample size). It is much more worthwhile to distinguishbetween lower and higher level university qualifications instead, where lower onescomprise first/undergraduate degrees and higher ones are postgraduate degreesoriented towards the professions and academic research and include ISCED level 6.
The categories of the ES–ISCED are then defined in the following way:
I No qualification or only primary education. (If there is no certificate whatsoever awardedat the end of compulsory schooling, this category covers respondents with less thancompulsory education.) This category corresponds with ISCED levels 0 and 1 or
27What is to be classified is thus not the last educational programme attended, but the highest level ofeducation actually completed. There are few exceptions to this, when non-completion of a programmeforms a substantial additional skill over the last fully completed programme (mainly having attendedseveral years of university without graduating).
31

CASMIN category 1a, which are very small in most European countries today.For parental education and immigrants, the distinction between less than primaryeducation and at least primary education might however be more important. Thiscategory signifies people who have not received the “social minimum” of educationin their respective countries.
II Lower secondary qualification: certificates awarded (usually) at the end of compulsoryeducation. This corresponds to ISCED level 2 and CASMIN categories 1b and 2b.Two subcategories can be differentiated here (although not in all countries), whichdo only partly correspond to the differentiations given by ISCED:
IIb Qualifications that would usually lead to vocational education or even directlyto the labour market. This is a level of educational attainment that does notgive access to IIIa, and thus marks the end of general education for many. Itcorresponds to ISCED 2B and 2C, but also 2A if this qualification gives accessto ISCED 3B rather than 3A. The corresponding category in CASMIN is 1b.This can be either the lowest possible formal qualification or “social minimum”(e. g. Hauptschulabschluss in Germany; GCSE grades D-G in the UK), whichis maybe already vocationally oriented (e. g. lager beroepsonderwijs in Belgiumand the Netherlands). It also contains very low levels of vocational educationafter compulsory education (programmes of 1 year duration or less, whichwould be classified 3C in the ISCED–97).
IIa A qualification that does at least theoretically give access to IIIa, i. e. gen-eral/academic upper secondary education. This is a transitional qualificationwithin secondary education in many countries (Realschulabschluss in Ger-many,28 GCSE grade A-C in the UK, Brevet in France) etc. It is 2A in theISCED–97 and 2b in CASMIN. Dropouts of general upper secondary educationthat are not expected to finish upper secondary education any more could beclassified here, too.
If a country has several qualifications that theoretically give access to ISCED level3A and no qualification at 2B or 2C, the one with the lower prospects should becoded IIb in order to reflect the national hierarchies as well as possible. The sameapplies if there are several qualifications at 2B or 2C, and none at IIa, so that theone with the higher prospects would then be coded IIa.
III Upper secondary education completed. This largely corresponds to ISCED level 3 andCASMIN categories 1c, 2a and 2c.
IIIb Qualifications that do not grant direct access to university education (butmaybe to higher vocational education). These usually cover basic vocationaleducation (e. g. Apprenticeships in dual system countries, NVQ levels 1 and
28For actual continuation to general upper secondary education (“gymnasiale Oberstufe”), pupils addi-tionally need a certain minimum profile of marks, which is summarised in an additional specificationon their school report, “with qualification”
32

2 in the UK, BEP and CAP in France), but in some countries there are alsogeneral programmes without maturity examination at the end (e.g. the CzechRepublic and Israel). In the ISCED–97, such qualifications are classified ISCED3C of at least two years duration or 3B. Pre-vocational one-year programmesat ISCED level 3C should be excluded (they belong to IIb). The correspondingCASMIN-categories are (roughly) 1c and 2a.
IIIa University access qualifications, covering the classical university entrance certifi-cates (maturity, A-Levels, Abitur, BaccalaurÈat, VWO-diploma etc.), whichare without exception 3A general in the ISCED–97; “alternative route” qualifi-cations that although formally giving access to universities, this is in practiceeither restricted to certain institutions or improbable (e.g. Fachhochschulreifein Germany, HAVO in the Netherlands, bac pro in France, GNVQ advancedlevel in the UK, vocational Matura in the Czech Republic and some othercountries), which are either 3A vocational in the ISCED–97 or 3A general,but in the latter case one year shorter than the full academic path to 3A. Ifsomeone completes upper secondary vocational education after IIIa, which isonly common in a few countries, this is still coded as IIIa. The correspondingCASMIN category is 2c.
In a number of countries, more fine-graded categories at level III could be devised,splitting up IIIb and IIIa into two sub-categories each. IIIb could be differentiatedinto lower and higher levels of vocational education (e. g. CAP and BEP in France,Apprenticeships after Hauptschul- or Realschulabschluss in Germany, NVQ 1 andNVQ 2 in the UK, different levels of MBO in the Netherlands). IIIa could bedifferentiated into general and vocational/otherwise restricted university entrancequalifications (e.g. Abitur and Fachhochschulreife in Germany, VWO and HAVO inthe Netherlands, Bac géneral/technologique and Bac professionel in France).
IV Post-secondary, non-university education: These are advanced vocational programmes(higher technicians, master craftsmen, short HBO in the Netherlands, HOKT inBelgium, HNC and HND in the UK). In the ISCED–97, such programmes areclassified as 4B or 5B (depending on having the status of higher education in therespective country). As the distinction between what is considered tertiary or notin different countries is rather arbitrary, and as most countries have either 4Bor 5B programmes, but usually not both, it was decided in this case to collapseprogrammes across ISCED levels. In CASMIN, these qualifications are largelyincluded in category 3a.
V University education (ISCED 5A and 6; CASMIN 3b) is divided into two main levels:
V1 Lower level university education, comprising firstly short or first universitydegrees of 3 years duration in most countries, usually at the Bachelor’s orequivalent level (Licence in France, three-year Laurea in Italy etc.). In countrieswhere the Bachelor is a very recent qualification, non-finished university studiescan be classified here (e.g. Vordiplom, Zwischenprüfung, that is so-called
33
intermediate examinations in Germany). Secondly, there are qualificationsfrom institutions which are not full universities, i.e. do not award PhDs, butare nevertheless assigned to ISCED 5A in ISCED-97 (Fachhochschulabschlussin Germany, Austria and Switzerland, long HBO degrees in the Netherlands,HOLT in Belgium etc., colleges of higher education, advanced technical colleges).Such institutions do not exist in all countries, but all countries have eitheracademic BAs or lower tier universities. Long technical degrees should beclassified as V2, if they are not too different from other qualifications at levelV2, and if there are sufficiently different other qualifications at level V1 (e.g.short technical degrees).29
V2 This category contains higher (postgraduate) qualifications at universities,covering long university studies, i.e. Master’s level and equivalents (at least4 years of study at a university altogether) as well as other post-graduatequalifications and the PhD/doctorate. In ISCED, this is levels 5A (long) and6.
The optimal number of categories of the ES–ISCED is thus 8, which is just one morethan the simplified ISCED–97 levels, with an increased richness of information. Thesub-categories (IIIb(V), IIIb(G), IIIa(V), IIIa(G), V1(A), V1(P), V2(A), V2(P) andV2(PhD)) do not need to be reflected in the data to be analysed, although for evaluationpurposes, ease of data collection and more specific research questions, it is always usefulto distinguish them in the NEVs. It is however vital that the distinction between a andb-qualifications is made at level III and between 1 and 2 at level V. It might be possible tocollapse categories IIa and IIb and thus save one category, as the distinction did not showto be important in the majority of countries where this could be tested (the Netherlandswere actually the only exception to this).
Table 3 shows this less reduced version of the ISCED–97 which would have considerablymore discriminatory power than the sISCED–97, but at the same time not be overlydemanding for the national teams to be implemented.
Using current ESS data, ES-ISCED can only be computed for 13 countries. For these13 countries, the same construct validation analyses were performed as for the sISCED–97above (see section 2.3.2). The results are shown in tables 4 and 5. The NEVs of the othercountries lack some differentiation necessary for the construction of the ES–ISCED, usuallywithin ISCED level 3 or 5, as this differentiation was not required for the construction ofthe sISCED–97. The missing countries are mainly those where vocational education isless institutionalised and thus not “traditionally” covered in the NEV. Comparability cantherefore not be taken for granted.
ES-ISCED is much more evenly distributed than the sISCED–97 (see table 4). CategoryIIb is empty in many countries and not ideally coded in others, as the NEVs often did notdistinguish between different tracks at the lower secondary level. Looking at categories IIIband IIIa, it seems that in some countries it is much more usual than in others to complete29Polytechnic colleges were incorporated in the regular university sector in the UK in 1992. However
most students get BAs at such institutions; therefore misclassification is probably insignificant. Maybeit would be possible to distinguish “old” and “new” universities in the phase of data collection.
34

Tab
le3:
The
ES–
ISC
ED
codi
ngsc
hem
e
ES–
ISC
ED
ISC
ED
–97
G/V
/A/P
dur.
(yrs
)de
scri
ptio
nI
0,1
Gno
form
alqu
alifi
cati
onor
only
prim
ary
educ
atio
nII
b2B
,2C
,3C
<2y
rs,
incI
IIb
G/V
8-10
low
erse
cond
ary/
com
puls
ory
scho
olin
gco
mpl
eted
,low
ertr
ack/
voca
tion
alqu
alifi
cati
onno
tle
adin
gto
gene
ralu
pper
seco
ndar
yed
ucat
ion,
som
etim
esal
read
yin
clud
ing
som
evo
cati
onal
educ
atio
n
IIa
2A,i
ncII
IaG
8-10
low
erse
cond
ary/
com
puls
ory
scho
olin
gco
mpl
eted
,upp
ertr
ack/
gene
ralq
ual-
ifica
tion
lead
ing
toge
nera
lupp
erse
cond
ary
IIIb
3B,3
C≥
2yrs
V2-
3up
per
seco
ndar
yed
ucat
ion
wit
h(i
niti
al)
voca
tion
alqu
alifi
cati
onw
itho
utun
iver
sity
acce
ssce
rtifi
cate
(app
rent
ices
hips
,voc
atio
nals
choo
ls...
)3B
,3C≥
2yrs
G2-
3ge
nera
lupp
erse
cond
ary
educ
atio
nw
itho
utun
iver
sity
acce
ss(r
are)
IIIa
3AV
/G2-
3up
per
seco
ndar
y“a
lter
nati
ve”
rout
eed
ucat
ion
wit
h(m
aybe
rest
rict
ed)
univ
ersi
tyac
cess
orle
sspr
obab
leac
tual
enro
lmen
t;vo
cati
onal
/tec
hnic
al3A
G2-
3tr
adit
iona
laca
dem
icup
per
seco
ndar
yed
ucat
ion
wit
hfu
llun
iver
sity
acce
ssce
rtifi
cate
4AV
+G
4-5
...p
lus
init
ialv
ocat
iona
lpro
gram
me
(or
the
othe
rw
ayro
und)
IV5B
,4B
,4C
V1-
2po
st-s
econ
dary
/adv
ance
dvo
cati
onal
non-
univ
ersi
tyed
ucat
ion
(mas
terc
raft
s-m
en,h
ighe
rte
chni
cian
s,fo
rem
en,a
bsol
utor
ium
...)
V1
5As
A3
shor
tun
iver
sity
/col
lege
educ
atio
n(a
cade
mic
BA
)5A
s/m
P3-
4lo
wer
tier
univ
ersi
ty/c
olle
geed
ucat
ion
(pro
fess
iona
lBA
,Fac
hhoc
hsch
ule)
V2
5Al
A4-
6lo
ngac
adem
ichi
gher
educ
atio
n(a
cade
mic
MA
)an
dm
ore,
but
<P
hD5A
lP
4-6
long
prof
essi
onal
/tec
hnic
alhi
gher
educ
atio
n(p
rofe
ssio
nalM
A)
and
mor
e6
A+
3-6
PhD
,doc
tora
te
35

upper secondary education with a university entrance qualification but not continueto university any more. In some countries, IIa and IIIa are much more “transitional”qualifications than in others (e.g. in Germany). However, there are still some countrieswhere large proportions of respondents accumulate in few categories. IIIb is for examplevery common in Germany and Switzerland. Substantial changes over the two rounds ofthe ESS also remain for Denmark and Spain.
Table 4: Distribution of educational attainment measured by the ES–ISCED, %
country ESS ES-ISCED categoriesround I IIb IIa IIIb IIIa IV V1 V2
Belgium 1 7.3 8.9 7.1 11.6 27.3 19.2 5.8 12.82 5.7 8.1 5.8 12.5 29.7 20.4 5.8 12.1
Czech Republic 1 0.1 5.1 41.2 37.6 3 1.6 11.42 0.1 6.3 40 39.7 2.7 2.3 8.9
Denmark* 1 0.3 15 44.4 4.2 13.8 12.8 9.52 0.4 10.6 33 4 16 22.6 13.5
Estonia 2 0.4 0.5 6.9 16.8 37.3 13.5 22.5 2.1Germany 1 0.8 4.4 0.8 47.4 6.8 16.3 8.8 14.7
2 0.7 5.4 0.9 43.1 7.1 16.6 11.8 14.5Hungary* 2 5.6 29.4 31.5 3.8 15.8 13.8Israel 1 0.4 8.6 4.1 13.8 14.2 21 22.6 15.2Luxembourg 1 20 2.2 5 24.6 17.9 7.8 6.8 15.5
2 23 7.5 2.7 22.9 15.1 10.6 6.3 12Poland* 1 0.5 13.1 32 28.5 6.2 4.7 15
2 0.3 10.8 35.6 30.2 6.2 3.4 13.6Slovakia 2 0.6 7 33.1 43.8 2.4 13.1Slovenia 1 1.8 16.6 25.7 33 7.6 14.3 1
2 1.8 11.6 28.8 34.9 6.8 14.5 1.6Spain* 1 12 28.2 8.3 25.8 0.8 10.5 14.8
2 7.8 37.8 3.9 19.8 1.2 11.4 18.1Switzerland 1 0.4 2.1 8.7 43.3 9 15 8.1 13.5
2 1.2 2 6.9 47.4 5.9 15.5 10.7 10.5
average 4.1 5.0 9.8 29.0 22.9 10.7 10.3 11.7
How does ES-ISCED compare with years of education and the sISCED–97 with respectto predictive power in occupational attainment models? For all countries included inthis analysis, ES-ISCED is superior to years of education as well as the sISCED–97(see table 5). The differences are quite remarkable, particularly having in mind thatthe ES–ISCED only uses one category more than ISCED (7) (and if IIa and IIb arecollapsed, the explanatory power stays basically the same in the countries includedhere). The explanatory power of the ES–ISCED is indeed very close or even identicalwith the explanatory power of the NEVs. As the the ES–ISCED categories are more
36
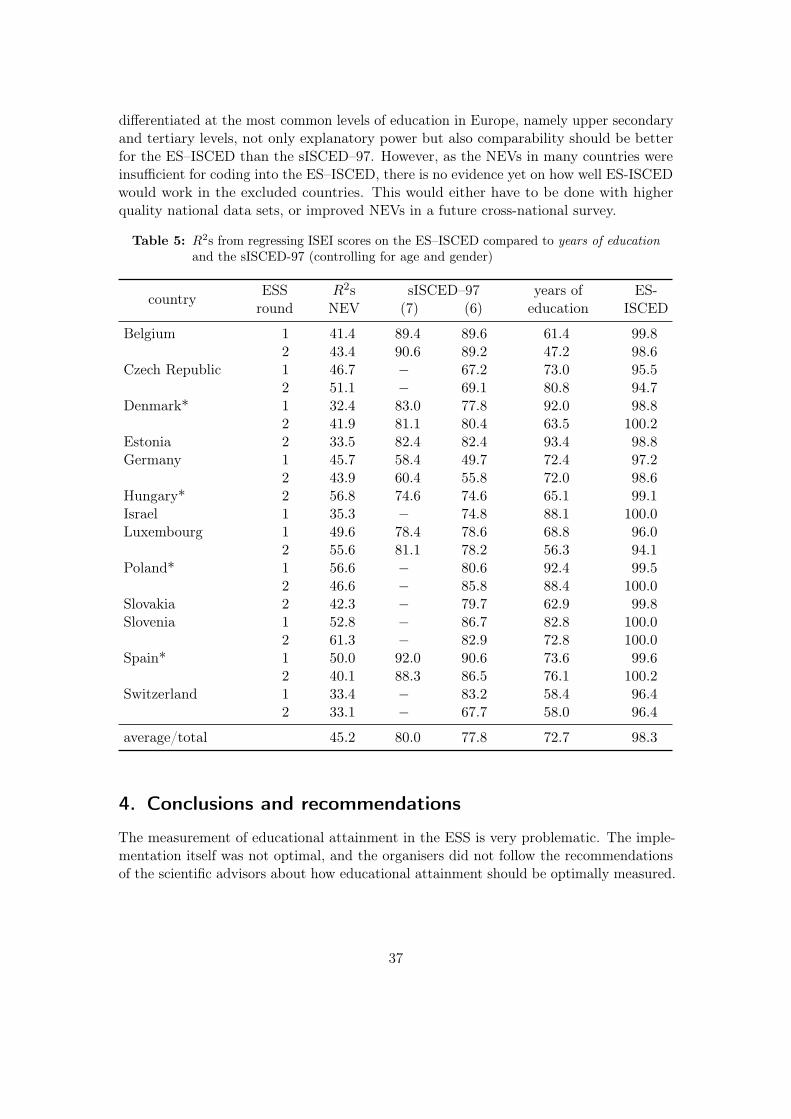
differentiated at the most common levels of education in Europe, namely upper secondaryand tertiary levels, not only explanatory power but also comparability should be betterfor the ES–ISCED than the sISCED–97. However, as the NEVs in many countries wereinsufficient for coding into the ES–ISCED, there is no evidence yet on how well ES-ISCEDwould work in the excluded countries. This would either have to be done with higherquality national data sets, or improved NEVs in a future cross-national survey.
Table 5: R2s from regressing ISEI scores on the ES–ISCED compared to years of educationand the sISCED-97 (controlling for age and gender)
country ESS R2s sISCED–97 years of ES-round NEV (7) (6) education ISCED
Belgium 1 41.4 89.4 89.6 61.4 99.82 43.4 90.6 89.2 47.2 98.6
Czech Republic 1 46.7 − 67.2 73.0 95.52 51.1 − 69.1 80.8 94.7
Denmark* 1 32.4 83.0 77.8 92.0 98.82 41.9 81.1 80.4 63.5 100.2
Estonia 2 33.5 82.4 82.4 93.4 98.8Germany 1 45.7 58.4 49.7 72.4 97.2
2 43.9 60.4 55.8 72.0 98.6Hungary* 2 56.8 74.6 74.6 65.1 99.1Israel 1 35.3 − 74.8 88.1 100.0Luxembourg 1 49.6 78.4 78.6 68.8 96.0
2 55.6 81.1 78.2 56.3 94.1Poland* 1 56.6 − 80.6 92.4 99.5
2 46.6 − 85.8 88.4 100.0Slovakia 2 42.3 − 79.7 62.9 99.8Slovenia 1 52.8 − 86.7 82.8 100.0
2 61.3 − 82.9 72.8 100.0Spain* 1 50.0 92.0 90.6 73.6 99.6
2 40.1 88.3 86.5 76.1 100.2Switzerland 1 33.4 − 83.2 58.4 96.4
2 33.1 − 67.7 58.0 96.4
average/total 45.2 80.0 77.8 72.7 98.3
4. Conclusions and recommendations
The measurement of educational attainment in the ESS is very problematic. The imple-mentation itself was not optimal, and the organisers did not follow the recommendationsof the scientific advisors about how educational attainment should be optimally measured.
37

As a consequence, the comparable framework chosen ex-ante, namely a very simplifiedversion of the ISCED–97, was already flawed.
In the first two rounds of the ESS, the reclassification of NEVs into the ISCED–97was not yet performed in an optimal way. Due to the availability of the NEVs in theESS data sets as well as the collection of information on years of education completed,it was in most cases possible to spot and correct misclassifications in order to improvecross-national comparability.
Sometimes the misclassifications that were made look like the result of a lack ofknowledge about the ISCED–97. Maybe a very concise summary of how the ISCED–97works could be provided to the national teams: It cannot really be expected that thosedeciding on the NEVs and responsible for the reclassification read the lengthy manualsfrom the UNESCO and the OECD.
However, often it also looks as if the national teams tried to distinguish between quali-fications that were not meant to be differentiated in the ESS-version of the ISCED–97.This means that the sISCED–97 as implemented in the ESS goes against the coun-tries’ ideas which levels of education have to be differentiated. In order to allevi-ate this problem, some important distinctions should be made, most importantly be-tween vocational and general upper secondary education (basically 3B/C and 3A), be-tween vocational and academic/professional tertiary education (ISCED 5B and 5A),as well as first/short/undergraduate degrees and second/long/postgraduate degrees(5A(short/medium) and 5A(long)).
Looking at the distribution of the simplified ISCED–97 variables already revealed thatthe coding scheme chosen by the ESS co-ordinators is not detailed enough at certain levelsof education. The results of the analyses performed here in order to find out about theconsequences of collapsing categories of the national education variables into the commonframework support the findings of Kerckhoff and Dylan (1999) and Kerckhoff et al. (2002):the sISCED–97 generates different results from the NEVs, and the deviations produceddiffer over countries. The results presented here are based on a larger number of countries,evaluate the more recent version of ISCED from 1997 instead of the old 1976 version, anduse a more detailed measure of occupational attainment.
To sum up, there are basically three problems with the measurement of educationusing the ISCED–97 in the ESS: insufficient national education variables, misclassificationand lack of detail. With respect to the first problem, improvement is only possible forfuture rounds of the ESS. If already at the stage of data collection a simplified nationalvariable is used, as was done in a number of countries in the first two rounds, there is nogoing back, and later adjustments are impossible. But to err is human, the assignmentof national education programmes may change over time, or be controversial in thefirst place. Therefore, it is important that detailed “best practice” NEVs are used incross-national surveys, e.g. those used in national labour force surveys or censuses. Itmight even be necessary to use an even more differentiated NEV, as qualifications thatcan be aggregated in some countries may need to be differentiated in others, making itnecessary to differentiate them in all countries in cross-national surveys.
The second problem can be solved for most countries by checking and correcting therecoding from the national to the cross-nationally comparable variable, which is tedious,
38

but possible.The third problem is more tricky, though. ISCED–97 is quite a good and flexible
international classification of education. It has however not been implemented in the ESSin a way that reflects important distinctions in people’s educational attainment in Europe,mostly vocational and general. In order to make such distinctions possible (or evenstandard), it would be necessary to ask some national teams for a higher level of detail ofthe NEV (particularly asking for a distinction between vocational and general/academicprogrammes at levels 3 and 5, and also distinguishing short/lower level and long/higherlevel university degrees). It could also make sense to distinguish within lower secondaryeducation between individuals who were in general education and qualify to continueto general upper secondary education and those who do not qualify or completed lowersecondary vocational education (e.g. in order to differentiate between those with GCSEsA to C and D to G grades in the UK, or between “Hauptschulabschluss” and “MittlereReife” in Germany). Incorporating these ideas or even using the European Survey versionof the ISCED–97 proposed above would presumably improve cross-national comparabilityand discriminatory power of the educational attainment measure in the ESS a lot.
A further step for evaluating the ISCED–97 and ES-ISCED would be to do similaranalyses as those conducted above with other dependent variables, e. g. social class, valuessuch as authoritarianism/liberalism and social attitudes like anti-immigrant prejudice, allof which are known to be related to educational attainment.
39
References
Braun, M. and Müller, W. (1997). Measurement of Education in Comparative Research.Comparative Social Research, 16, 163–201.
Brauns, H. and Steinmann, S. (1999). Educational Reform in France, West-Germany,the United Kingdom and Hungary. Updating the CASMIN Educational Classification.ZUMA Nachrichten, 44 (23), 7–44, URL http://www.gesis.org/Publikationen/Zeitschriften/ZUMA_Nachrichten/documents/pdfs/44/zn44_5brauns.pdf. Ac-cessed 10/09/2007.
Erikson, R. and Jonsson, J. O. (n.d.). How to ascertain the socio-structuralposition of the individual in society. Chapter 2 in the European Social SurveyQuestionnaire Development Report (p. 12-81), with comments by Kirstine Kolsrud,Knut Kalgraf-Skjåk, Ron Lesthaeghe and Ineke Stoop, URL http://naticent02.uuhost.uk.uu.net/questionnaire/questionnaire_development/chapter_02.doc.Accessed 24/04/2007.
Eurostat (2006). UOE - UNESCO-OECD-Eurostat data collection on Education: Map-ping of national education programmes to ISCED97 for school/academic year 2002/2003.URL http://circa.europa.eu/Public/irc/dsis/edtcs/library?l=/public/unesco_collection/programmes_isced97/uoe2004_iscmapxls/_EN_1.0_&a=d.Accessed 12/11/2007.
Gambetta, D. (1987). Were they pushed or did they jump? Individual decision mecha-nisms in education. Studies in rationality and social change, Cambridge: CambridgeUniversity Press.
Ganzeboom, H. B. G., de Graaf, P. M., and Treiman, D. J. (1992). A StandardInternational Socio-Economic Index of Occupational Status. Social Science Research,21 (1), 1–56.
Jowell, R. and the Central Co-ordinating Team (2003). European Social Survey2002/2003. Tech. rep., Centre for Comparative Social Surveys, City University, London,URL http://www.europeansocialsurvey.org. Accessed 13/04/2007.
Jowell, R. and the Central Co-ordinating Team (2005). European Social Survey2004/2005. Technical report, Centre for Comparative Social Surveys, City University,London, URL http://www.europeansocialsurvey.org. Accessed 13/04/2007.
Kerckhoff, A. C. and Dylan, M. (1999). Problems with International Measures ofEducation. Journal of Socio-Economics, 28 (6), 759–75.
Kerckhoff, A. C., Ezell, E. D., and Brown, J. S. (2002). Toward an ImprovedMeasure of Educational Attainment in Social Stratification Research. Social ScienceResearch, 31 (1), 99–123.
40
http://www.gesis.org/Publikationen/Zeitschriften/ZUMA_Nachrichten/documents/pdfs/44/zn44_5brauns.pdf
Kolsrud, K. and Skjåk, K. K. (2005). Harmonising Background Variables in theEuropean Social Survey. In J. H. P. Hoffmeyer-Zlotnik and J. A. Harkness(Eds.) Methodological aspects in cross-national research, ZUMA Nachrichten Spezial,vol. 11, (163–182), Mannheim: ZUMA.
König, W., Lüttinger, P., and Müller, W. (1988). Eine vergleichende Analyse derEntwicklung und Struktur von Bildungssystemen. Methodologische Grundlagen undKonstruktion einer vergleichenden Bildungsskala. CASMIN Working Paper, 12.
Müller, W. (1996). Class Inequalities in Educational Outcomes: Sweden in ComparativePerspective. In R. Erikson and J. O. Jonsson (Eds.) Can Education Be Equalized?The Swedish Case in Comparative Perspective, (145–182), Boulder (CO), Oxford:Westview.
Müller, W., Lüttinger, P., König, W., and Karle, W. (1990). Class and Educationin Industrial Nations. In M. Haller (Ed.) Class structure in Europe. New Findingsfrom East-West Comparisons of Social Structure and Mobility, Armonk (NY), London:M.E. Sharpe.
Norwegian Social Science Data Services (2004). Education – ESS coding frame,modified ISCED-1997. Personal Communication.
OECD (1999). Classifying educational programmes. Manual for ISCED-97 implementa-tion in OECD countries. Organisation for Economic Co-Operation and Development,Paris, first edn., URL http://www.oecd.org/dataoecd/41/42/1841854.pdf. Accessed25/05/2006.
OECD (2001). Education at a Glance: OECD Indicators 2001. Paris: OECD.
OECD (2004). Education at a Glance: OECD Indicators 2004. Paris: OECD.
OECD and Statistics Canada (1995). Literacy, Economy and Society: Results of theFirst International Adult Literacy Survey. Paris: OECD and Statistics Canada.
Rosenfeld, R. A., Van Buren, M. E., and Kalleberg, A. L. (1998). Gender differ-ences in supervisory authority: Variation among advanced industrialized democracies.Social Science Research, 27 (1), 23–49.
Saar, E. (1997). Transitions to Tertiary Education in Belarus and the Baltic Coun-tries. Eur Sociol Rev, 13 (2), 139–158, URL http://esr.oxfordjournals.org/cgi/content/abstract/13/2/139.
Shavit, Y. and Blossfeld, H.-P. (Eds.) (1993). Persistent inequality: changing educa-tional attainment in thirteen countries. Social inequality series, Boulder (CO), Oxford:Westview.
Shavit, Y. and Müller, W. (Eds.) (1998). From school to work: a comparative studyof educational qualifications and occupational destinations. Oxford: Clarendon Press.
41
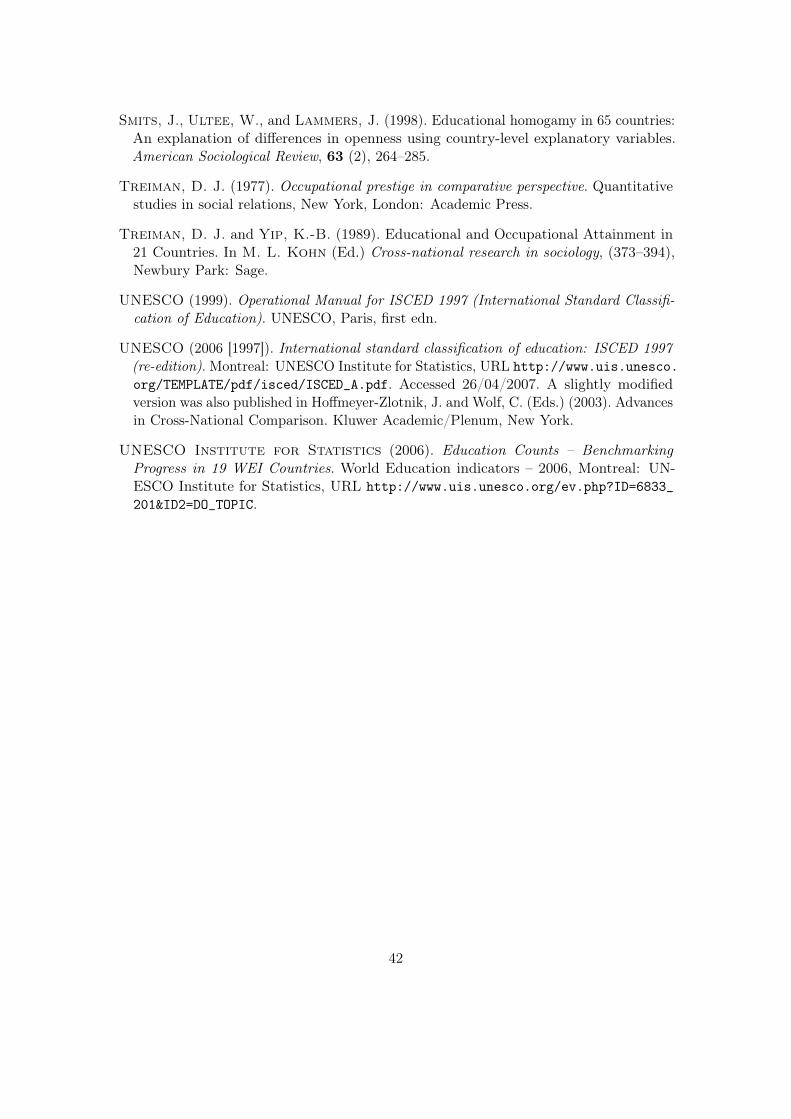
Smits, J., Ultee, W., and Lammers, J. (1998). Educational homogamy in 65 countries:An explanation of differences in openness using country-level explanatory variables.American Sociological Review, 63 (2), 264–285.
Treiman, D. J. (1977). Occupational prestige in comparative perspective. Quantitativestudies in social relations, New York, London: Academic Press.
Treiman, D. J. and Yip, K.-B. (1989). Educational and Occupational Attainment in21 Countries. In M. L. Kohn (Ed.) Cross-national research in sociology, (373–394),Newbury Park: Sage.
UNESCO (1999). Operational Manual for ISCED 1997 (International Standard Classifi-cation of Education). UNESCO, Paris, first edn.
UNESCO (2006 [1997]). International standard classification of education: ISCED 1997(re-edition). Montreal: UNESCO Institute for Statistics, URL http://www.uis.unesco.org/TEMPLATE/pdf/isced/ISCED_A.pdf. Accessed 26/04/2007. A slightly modifiedversion was also published in Hoffmeyer-Zlotnik, J. and Wolf, C. (Eds.) (2003). Advancesin Cross-National Comparison. Kluwer Academic/Plenum, New York.
UNESCO Institute for Statistics (2006). Education Counts – BenchmarkingProgress in 19 WEI Countries. World Education indicators – 2006, Montreal: UN-ESCO Institute for Statistics, URL http://www.uis.unesco.org/ev.php?ID=6833_201&ID2=DO_TOPIC.
42

A. Appendix
Table 6: Reclassification of NEVs to the ISCED–97 and the ES–ISCED
See extra Excel file “NationalVarsIntoISCED.xls” (available on request).
43