The Effects of Minimum Safety Standards, Publicized Crash Tests

73MEASURING COMPETITION IN THE U.S. AIRLINE INDUSTRY
MEASURING COMPETITION IN THE U.S. AIRLINEINDUSTRY USING THE ROSSE-PANZAR TEST AND
CROSS-SECTIONAL REGRESSION ANALYSES
THORSTEN FISCHER*
Economy.com, Inc.
and
DAVID R. KAMERSCHEN*
The University of Georgia
Submitted August 2002; accepted February 2003
We employ the Rosse-Panzar test to assess market performance in selected airport-pairsoriginating from Atlanta. The Rosse-Panzar test stands in the tradition of the New EmpiricalIndustrial Organization. It is based on the comparative statics of a reduced form revenueequation. Therefore, it is less powerful than structural models, but it offers the advantageof less stringent data requirements and reduces the risk of model misspecifications. Thetest statistic allows us in most airport-pairs to reject both conducts consistent with theBertrand outcome, which is equivalent to perfect competition, and the collusive outcome,which is equivalent to joint profit-maximization. Rather, the test statistic suggests thatbehavior is consistent with a range of intermediate outcomes between the two extremes,including, but not limited to the Cournot oligopoly. In the second part of the paper, across-section pricing regression complements the Rosse-Panzar test. It shows that thepresence of low-cost competition in an airport-pair reduces the average fare significantly.
JEL classification codes: L00, L40, L93
Key words: airlines, oligopoly, conduct, price-cost margins, Lerner index,
Rosse-Panzar test
* The authors are Economist, Economy.com, Inc., and Distinguished Professor of Economicsand Jasper N. Dorsey Chairholder, Terry College of Business, The University of Georgia,respectively. We are heavily indebted to Drs. Scott E. Atkinson, Charles D. DeLorme, Jr.,Claudia E. Halabi, Donald C. Keenan, Peter G. Klein, David B. Robinson, and ananonymous referee for their ideas and suggestions.
Journal of Applied Economics, Vol. VI, No. 1 (May 2003), 73-93

74 JOURNAL OF APPLIED ECONOMICS
I. Introduction
The U.S. airline industry has experienced revolutionary change in the last
two decades moving from strict regulation to modest regulation, now allowing
airlines to decide such things as their pricing strategies, frequency of schedule,
and entry into and exit from markets. However, access to some key inputs,
such as airport boarding sites, is still determined by non-market or regulatory
conditions. Proponents of deregulation expected better performance through
enhanced competition, resulting in higher productivity, lower costs, lower
fares, and better service. This optimism has been largely fulfilled as the U.S.
airline industry in recent years has had steady growth, falling prices, more
convenient schedules, and moderate concentration, although profits have been
rather volatile (see, e.g., Bailey, 2002, Gowrisankaran, 2002). It can be argued
that since the late 1980s and early 1990s, the industry has settled into a new
equilibrium. The vital and challenging question is whether this (less than
ideal) deregulated market performed better than before, or whether there still
exists market power and market conduct that are less optimal than previously.
This paper examines the economics underlying the U.S. airline industry,
and its development and evolution since deregulation. More specifically, this
paper studies the pricing strategy, market conduct, and market performance
in the U.S. airline industry in recent years. Two empirical models are employed,
each with a different focus and methodology. The level of analysis is on the
micro-level, concentrating on the firm and airport-pair level. This enables a
more detailed and precise approach to the study of market conduct than would
be feasible with more aggregated data.
The statistical analysis is restricted to airport-pairs originating in Atlanta.
Atlanta is an appropriate choice for conducting such a study for several reasons.
First, Atlanta serves as a major hub for Delta Air Lines, one of the nation’s
largest carriers. Delta accounts for more than eighty percent of all departures
and arrivals at Atlanta’s Hartsfield International airport. Therefore, any effects
that a dominant firm may have on the market’s competitiveness are captured.
Second, Atlanta is an important market for all other major U.S. carriers that
compete with Delta by offering one-stop service to most cities connecting
through their respective hubs. Third, Atlanta has experienced entry by a
remarkably successful lowcost carrier, ValuJet Airlines, which started in 1993

75MEASURING COMPETITION IN THE U.S. AIRLINE INDUSTRY
and grew rapidly. At its peak, it served almost 30 markets and used more than
50 aircraft. After the loss of one of its planes in May 1996, ValuJet was
grounded for approximately three months and is still struggling to rebuild its
former position. ValuJet faced severe restrictions imposed by regulators on
its growth opportunities. Furthermore, consumer confidence in its safety and
reliability suffered immensely. In July 1997, Valujet Inc., the parent of ValuJet
Airlines, announced plans to merge with Florida-based Airways Corp., parent
of AirTran Airways. The merger took effect with the larger carrier, ValuJet,
adopting the smaller carrier’s name, AirTran, to eliminate any association
with the crash. The Orlando-based AirTran Airways with its hub in Atlanta
has experienced steady growth and consolidated its position as a successful
provider of lowcost air travel. Early in 2000, it took delivery of the first of 50
new-generation Boeing 717 aircraft, in pursuit of its strategy of growth and
modernization of its fleet. In 2002, AirTran was named Airline of the Year
for the fourth consecutive year by the American Society of Travel Agents.
The trade group said it honored the discount airline for creating an Internet
booking engine aimed at travel agents, and for continuing to provide
competition in the industry. Most big carriers, including Delta, eliminated
base travel agent commissions in 2002. Of course, what long-run impact the
terrorist attacks on the U.S. on September 11, 2001, will have on AirTran and
indeed the entire U.S. airline industry is hard to predict at this time.
Our format provides an interesting opportunity to study market conduct
in different competitive environments: markets where Delta is the only carrier,
markets where Delta competes with other majors, and finally markets where
Delta competes against a lowcost, start-up carrier. Anecdotal evidence suggests
that after the grounding of ValuJet, airfares in certain markets rose sharply.
One well-publicized example is the route linking Atlanta and Mobile, AL,
where the coach fare rose from $79 to more than $400. Some communities in
the Southeast provided financial incentives to ValuJet to induce the carrier to
serve their airports.
New Empirical Industrial Organization (NEIO) research identifies and
estimates the degree of market power, specifies and estimates the behavioral
equations that drive price and quantity, and often infers marginal cost or
measures market power without it. NEIO studies emphasize individual
industries, because institutional details make broad cross-section studies of

76 JOURNAL OF APPLIED ECONOMICS
industries of limited value. NEIO provides techniques to execute studies on
market conduct and market power of individual industries by estimating
empirically parameters of conduct that identify well-defined models of
oligopoly. The estimated values in conduct studies such as this one cover the
range of distinct behavior from the Bertrand case on one end, through the
Cournot oligopoly, to the collusive cartel outcome on the other end. Thus, the
estimates thus provide a numerical equivalent to oligopoly conduct ranging
from perfect competition to joint profit-maximizing monopoly.
Structural models, based on oligopoly theory, can be tailored to the
idiosyncrasies of the particular market under investigation, obviating restrictive
assumptions about symmetry across industries. Moreover, the degree of market
power is directly estimated from the data. This permits explicit hypothesis
testing of the degree of market power and industry conduct. Where structural
models are not feasible because the relevant data are not available, or the
validity of the specified structural model is in question, reduced-form
approaches are useful to distinguish firm conduct and market power. These
reduced-form approaches are generally less powerful than structural models,
but they impose less demanding data requirements, and reduce the risk of
employing an ill-specified model. Reduced-form approaches are often non-
parametric, and rely on the comparative statics of some economically relevant
function.
This paper investigates market conduct and performance by employing a
non-structural model in the tradition of the NEIO. The so-called Rosse-Panzar
test is based on the reduced revenue function of the firm and determines
market structure by analyzing comparative statics of the total revenue function
with respect to cost. The study uses firm-level data aggregated from raw
balance-sheet data, employing index number theory, thereby obtaining very
accurate measures of input prices. An improved approach is used to compute
the price of capital. The Capital Asset Pricing Model (CAPM) is employed to
obtain a reasonably accurate measure of the opportunity cost of capital. This
measure is superior to conventional measures that rely on accounting rather
than economic concepts of capital pricing. The paper also employs airport-
pair-level data on airfares, thus allowing a degree of detail that renders the
study very valuable for investigators interested in specific competitive set-
ups rather than a broader and more general framework. The sample extends

77MEASURING COMPETITION IN THE U.S. AIRLINE INDUSTRY
over the 24 quarters from January 1991 to December 1996. Finally, a cross-
section regression model is employed to supplement the studies on market
structure, to provide additional insight into pricing strategies, and to explore
the factors that influence the price of air travel.
Section II presents an approach to testing for monopoly behavior, the Rosse-
Panzar test, which allows for a first impression regarding market conduct.
Section III implements the Rosse-Panzar test empirically and presents the
results. Section IV presents a cross-section regression for the Atlanta market
to assess the impact of a lowcost carrier on fares. Section V briefly concludes
with the major findings.
II. Theoretical Background
Rosse and Panzar (1977) and Panzar and Rosse (1987) introduce a series
of tests based on properties of reduced-form revenue equations at the firm
level on which the hypothesis of monopoly or oligopoly profit maximization
places testable restrictions.1 The data requirements, consisting of revenues
and factor prices, are relatively modest. The following model is taken from
Panzar and Rosse (1987) and follows their development of the test closely.
Let q be a vector of decision variables that affect a firm’s revenue. In the
most natural case q would describe a vector of output quantities. Let z denote
a vector of variables that are exogenous to the firm and shift the firm’s revenue
function. The firm’s cost function also depends on q, so that C = C (q, w, t),
where w is a vector of factor prices also taken as given by the firm and t is a
vector of exogenous variables that shift the firm’s cost curve.2 It follows that
the firm’s profit function is given by
Let q0 be the argument that maximizes this profit function. Also, let q1 be
1 For an extension of the Rosse and Panzar test when variables besides the firms’ revenuesare observable, see Sullivan (1985) and Ashenfelter and Sullivan (1987).
2 While this cost function ignores efficiencies generated by hubs, these cost complementariesdo not make the Rosse-Panzar result inapplicable.
),,,( twzqCR ππ =−= (1)

78 JOURNAL OF APPLIED ECONOMICS
the output quantity that maximizes π (q, z, (1 + h) w, t) where the scalar h is
greater or equal to zero. Define Ro as R (qo, z) ≡ R* (z, w, t) and R1 = R (q1, z)
≡ R* (z, (1 + h) w, t), where R* is the firm’s reduced form revenue function. It
follows by definition that
Using the fact that the cost function is linearly homogeneous in w, this can be
written as
and that
1 0 * *( ) / [ ( , (1 ) , ) ( , , ) / ] 0R R h R z h w t R z w t h− = + − ≤
This is the non-parametric result that indicates that a proportional cost increase
will result in a decrease of the firm’s revenues. Assuming that the reduced-
form revenue equation is differentiable, taking the limit of (4) for h → 0 and
dividing by R* yields
where the wi are the components of the vector w, so that w
i denotes the price
of the ith input factor.
This describes a restriction imposed on a profit-maximizing monopoly.
The sum of the factor price elasticities of the reduced-form revenue equation
cannot be positive. Intuitively, the question that the test statistic ψ* tries to
answer is what is the percentage change in the firm’s equilibrium revenue
resulting from a one-percent increase in all factor prices. An increase in factor
prices shifts all cost curves, including the marginal cost curve, up.
Consequently, the price charged by the monopolist goes up and the quantity
decreases. Since the monopolist operates on the elastic portion of the demand
curve, total revenue decreases. Hence, ψ* is non-positive. The generality of
the result causes one drawback for the test. Even for “monopolies” facing a
1 1 0 0( ,(1 ) , ) ( ,(1 ) , )R C q h w t R C q h w t− + ≥ − + (2)
1 1 0 0(1 ) ( , , ) (1 ) ( , , )R h C q w t R h C q w t− + ≥ − + (3)
(4)
0/)/( *** ≤Σ≡Ψ RwRw ii δδ (5)
79MEASURING COMPETITION IN THE U.S. AIRLINE INDUSTRY
perfectly elastic demand curve, the value for ψ* is less than zero. All firms
which operate in isolation, that is, all firms whose structural revenue functions
do not depend on any other agent’s decisions, will show a test statistic that is
non-positive. Therefore, a rejection of the hypothesis that ψ* is less than zero
must indicate that the firm is affected by other agents’ actions.
The next question, then, is whether there exist any models consistent with
an estimate for ψ greater than zero. Fortunately, this is the case. Rosse and
Panzar cite three models of equilibrium consistent with a positive value for ψ.
In all three models, the revenue function facing the firm depends on the action
of potential or actual rivals. In other words, the firm no longer acts in isolation.
The results for the models depend crucially on the assumption that the observed
firms be in long-run equilibrium. We will restrict our attention to two additional
models that are interesting with respect to airlines. First, the benchmark case
of the long-run competitive equilibrium is examined, and subsequently the
conjectural variation oligopoly is explored. Unless some kind of interaction
between firms is introduced into the model dealing with perfect competition,
price-taking behavior will lead to a ψ* less than zero. The output price that a
firm faces, therefore, is endogenized by allowing for competitive entry and exit.
This model has been discussed most prominently by Silberberg (1974). The
reasoning is as follows. Changes in factor prices will, at least in the longrun,
lead to exit or entry and consequently to changes in output prices. These changes
in turn will affect input demand and output supply decisions of the firm.
For firms observed in long-run equilibrium, the sum of the elasticities of
reduced form revenues with respect to factor prices equals unity (Rosse and
Panzar, 1987). The intuition behind this result is that a one-percent increase
in all factor prices will result in an equal-proportional that is one-percent,
increase in total revenue. Because average cost is homogeneous of degree
one in w, a one-percent increase in all factor prices will shift the average cost
curve up by one percent for all output levels. Consequently, the minimum
point is unchanged. Since in long-run competitive equilibrium the firm operates
at minimum average cost, the competitive output qc remains unchanged.
However, in equilibrium, the competitive price pc must be equal to minimum
average cost, which has increased by one percent. Therefore, pc must have
increased by one per cent also, driving up total revenues by the same
percentage. Therefore the condition that ψc be equal to one is established.

80 JOURNAL OF APPLIED ECONOMICS
Contrast this with the result if firms are not in long-run equilibrium. More
specifically, assume we observe a firm after the one-percent increase in all
factor prices, but before any firms have exited from the market. The firm will
respond by reducing output while the price remains initially unchanged, thus
resulting in a decrease in total revenues. Hence, in the shortrun, ψ is less or
equal to zero. Only after some firms exit does the price go up to the new long-
run equilibrium level and is output restored to its original level. This should
underline the importance of the long-run equilibrium assumption.
The final point to be made is that a conjectural variations oligopoly model
that exhibits strategic interactions among a fixed number of rivals may also be
consistent with positive values of ψ. Only if the oligopoly behaves close to a
joint monopoly, that is, if firms collude, is the marginal industry revenue
positive.
In summary, we have provided a non-structural test for the existence of
monopoly power, and we have derived three important results.3 First, the
sum of elasticities of revenue with respect to each input price is negative in
monopoly or collusive (joint monopoly) equilibrium. It is also negative in
short-run competitive equilibrium. Moreover, it is equal to unity in long-run
competitive equilibrium and indeterminate in a general conjectural variation
oligopoly equilibrium. These implications can be tested empirically. For
instance, a finding of a test statistic Ψ that is positive, would rule out monopoly
or a collusive cartel equilibrium.
A profit-maximizing monopolist operating on the elastic portion (η < -1)
will exhibit a negative value for Ψ. It also demonstrates that a negative sign
cannot rule out competition since a competitive firm tends to face an even
more elastic demand curve. Using the result obtained previously, Shaffer
(1982a), Shaffer (1983a) derives the Lerner index (Lj) in terms of the Rosse-
Panzar test statistic where sj is firm j’s market share.
3 While the focus of empirical IO has shifted away from identifying conjectures parametersin simply quantity-setting models to identifying demand and costs in differentiated price-setting models, we think the conjectures equilibrium framework with quantity competitionand the cross-sectional regressions are still a useful methodology. To see the newer focus,see, e.g., Berry’s 1992 paper on airline competition where he estimates a model of customerheterogeneity (business vs. leisure) which is important in this industry because of pricediscrimination.

81MEASURING COMPETITION IN THE U.S. AIRLINE INDUSTRY
We obtain the Lerner index for an individual firm and for the industry as a
whole, respectively.
and
Equations (6) and (7) express the firm and industry Lerner indices, respectively,
as a function of market share, the conjectural variation parameter λ and theRosse-Panzar test statistic H. The firm’s Lerner index depends only on the
test statistic, which is independent of market share or the conduct parameter.The result is valid only as long as the short-run equilibrium is considered,
that is, changes in total revenue due to changes in factor prices before entryand exit occur. In a further paper, Shaffer (1983b) extends his result found in
1982 to a more general connection between the Rosse-Panzar statistic andthe price elasticity of demand.
The reduced-form revenue equation has been used as a test of marketpower among others by Shaffer (1982b), Nathan and Neave (1989), and Shaffer
and DiSalvo (1994). In all cases, the test has been applied to the bankingindustry. Furthermore, Shaffer and DiSalvo apply both tests, i.e. the conjectural
variations oligopoly and the Rosse-Panzar test, to a duopoly banking marketin Pennsylvania. This is a procedure we follow.
III. Empirical Strategy
A. Implementation of the Rosse-Panzar Test
To apply the Rosse-Panzar test, we need to derive a reduced-form revenue
equation. However, we must also consider the underlying structural model indeveloping the reduced form. Following Shaffer and DiSalvo, we propose
the estimation of the following equation, taking into account that outputquantity is endogenous. The demand equation is given by (8), and a total
revenue equation is added in loglinear form. Alternatively, the translogspecification could be used. The loglinear revenue equation is given as
)1/(1 jjL Ψ−= (6)
2( ) / (1 ) (1j j j j jL H s sλ λ = + Σ + − Ψ (7)
82 JOURNAL OF APPLIED ECONOMICS
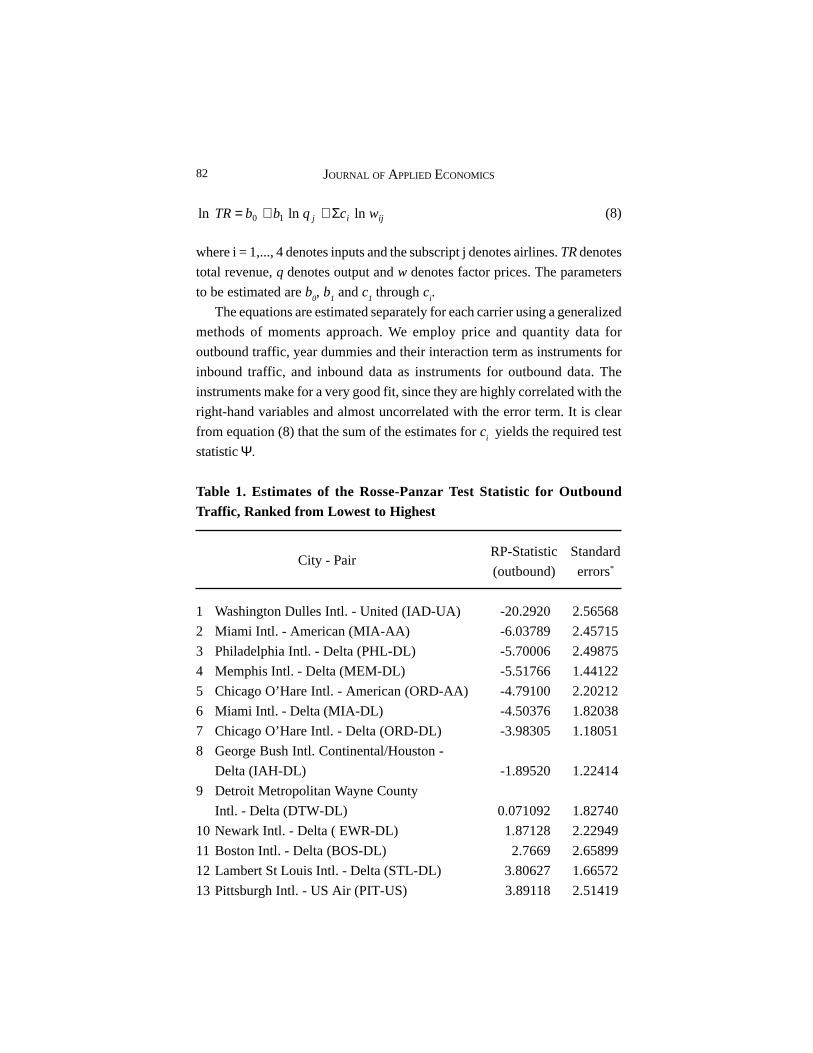
where i = 1,..., 4 denotes inputs and the subscript j denotes airlines. TR denotes
total revenue, q denotes output and w denotes factor prices. The parameters
to be estimated are b0, b
1 and c
1 through c
i.
The equations are estimated separately for each carrier using a generalized
methods of moments approach. We employ price and quantity data for
outbound traffic, year dummies and their interaction term as instruments for
inbound traffic, and inbound data as instruments for outbound data. The
instruments make for a very good fit, since they are highly correlated with the
right-hand variables and almost uncorrelated with the error term. It is clear
from equation (8) that the sum of the estimates for ci yields the required test
statistic Ψ.
ijij wcqbbTR lnlnln 10 Σ++= (8)
Table 1. Estimates of the Rosse-Panzar Test Statistic for OutboundTraffic, Ranked from Lowest to Highest
RP-Statistic Standard
(outbound) errors*
1 Washington Dulles Intl. - United (IAD-UA) -20.2920 2.56568
2 Miami Intl. - American (MIA-AA) -6.03789 2.45715
3 Philadelphia Intl. - Delta (PHL-DL) -5.70006 2.49875
4 Memphis Intl. - Delta (MEM-DL) -5.51766 1.44122
5 Chicago O’Hare Intl. - American (ORD-AA) -4.79100 2.20212
6 Miami Intl. - Delta (MIA-DL) -4.50376 1.82038
7 Chicago O’Hare Intl. - Delta (ORD-DL) -3.98305 1.18051
8 George Bush Intl. Continental/Houston -
Delta (IAH-DL) -1.89520 1.22414
9 Detroit Metropolitan Wayne County
Intl. - Delta (DTW-DL) 0.071092 1.82740
10 Newark Intl. - Delta ( EWR-DL) 1.87128 2.22949
11 Boston Intl. - Delta (BOS-DL) 2.7669 2.65899
12 Lambert St Louis Intl. - Delta (STL-DL) 3.80627 1.66572
13 Pittsburgh Intl. - US Air (PIT-US) 3.89118 2.51419
City - Pair

83MEASURING COMPETITION IN THE U.S. AIRLINE INDUSTRY
Table 1. (Continued) Estimates of the Rosse-Panzar Test Statistic forOutbound Traffic, Ranked from Lowest to Highest
RP-Statistic Standard
(outbound) errors*
14 Minneapolis St Paul Intl/Wold-Chamb.
- Delta (MSP-DL) 4.07826 1.18344
15 Washington Dulles Intl. - Delta (IAD-DL) 4.59163 2.10702
16 Pittsburgh Intl. - Delta (PIT-DL) 4.67703 1.22940
17 Memphis Intl. - Northwest (MEM-NW) 4.81010 1.28097
18 La Guardia - Delta (LGA-DL) 7.55154 1.70849
19 Ronald Reagan Washington Natl. -
Delta (DCA-DL) 7.69299 1.07561
20 Philadelphia Intl. - US Air (PHL-US) 9.73294 2.72694
21 Detroit Metrop.Wayne County
Intl-Northwest (DTW-NW) 10.6878 1.55307
22 Newark Int. - Continental (EWR-CO) 10.7625 4.21756
23 Charlotte Intl. - Delta (CLT-DL) 12.2199 2.64956
24 G. Bush Intl. Continental/Houston -
Continental (IAH-CO) 13.0914 2.09673
25 Dallas Ft. Worth - American (DFW-AA) 13.3728 1.73529
26 Minneapolis St Paul/Wold-Chamb.-
Northwest (MSP-NW) 13.6637 2.73482
27 Charlotte Intl. - US Air (CLT-US) 15.1083 3.85622
28 Chicago O’Hare Intl. - United (ORD-UA) 16.8336 4.38717
29 Dallas Ft. Worth - Delta (DFW-DL) 17.1838 2.86400
Note: *All coefficients have a significantly positive test statistic, which is also significantly
different from one.
City - Pair

84 JOURNAL OF APPLIED ECONOMICS
Table 2. Estimates of the Rosse-Panzar Test Statistic for Inbound Traffic,Ranked from Lowest to Highest
RP-Statistic Standard
(inbound) errors*
1 Washington Dulles Intl. - United (IAD-UA) -23.999 4.62528
2 Philadelphia Intl. - Delta (PHL-DL) -7.12364 2.68764
3 Miami Intl. - American (MIA-AA) -4.73940 2.63880
4 Memphis Intl. - Delta (MEM-DL) -4.15026 1.91954
5 Chicago O’Hare Intl. - Delta (ORD-DL) -4.14051 1.04254
6 George Bush Intl. Continental/Houston -
Delta (IAH-DL) -3.94652 1.27333
7 Chicago O’Hare Intl. - American (ORD-AA) -3.73036 1.67664
8 Miami Intl. - Delta (MIA-DL) -3.48789 2.16008
9 Detroit Metropolitan Wayne County Intl. -
Delta (DTW-DL) -0.465805 1.75467
10 Pittsburgh Intl - US Air (PIT-US) -0.262022 2.47935
11 Charlotte Intl.- Delta (CLT-DL) 0.000039 0.000013
12 Charlotte Intl. - US Air (CLT-US) 0.00032 0.000013
13 Pittsburgh Intl. - Delta (PIT-DL) 1.47711 1.68889
14 Newark Intl. - Delta ( EWR-DL) 2.21861 2.16485
15 Boston Intl. - Delta (BOS-DL) 2.51153 2.15238
16 Lambert St Louis Intl. - Delta (STL-DL) 3.78565 1.67995
17 Minneapolis St Paul Intl/Wold-Chamb. -
Delta (MSP-DL) 3.80256 1.27049
18 Memphis Intl. - Northwest (MEM-NW) 4.81165 1.48858
19 Washington Dulles Intl. - Delta (IAD-DL) 5.80216 2.18200
20 La Guardia - Delta (LGA-DL) 6.25637 1.30126
21 Ronald Reagan Washington Natl. -
Delta (DCA-DL) 6.64213 1.10359
22 Detroit Metrop. Wayne County Intl-Northwest
(DTW-NW) 8.63238 1.34562
23 Philadelphia Intl. - US Air (PHL-US) 9.13158 2.85095
City - Pair

85MEASURING COMPETITION IN THE U.S. AIRLINE INDUSTRY
Table 2. (Continued) Estimates of the Rosse-Panzar Test Statistic forInbound Traffic, Ranked from Lowest to Highest
RP-Statistic Standard
(inbound) errors*
24 Minneapolis St Paul/Wold-Chamb.- Northwest
(MSP-NW) 9.17014 1.70015
25 Newark Int. - Continental (EWR-CO) 10.2999 3.93423
26 Dallas Ft. Worth - American (DFW-AA) 13.2785 1.85012
27 G. Bush Intl. Continental/Houston -
Continental (IAH-CO) 14.8425 2.17619
28 Chicago O’Hare Intl. - United (ORD-UA) 16.6315 4.24272
29 Dallas Ft. Worth - Delta (DFW-DL) 18.6381 3.86058
Note: *All coefficients have a significantly positive test statistic, which is also significantlydifferent from one.
Tables 1 and 2 present the Rosse-Panzar test statistic and its standard
error for the 29 airport-pairs by outbound traffic and inbound traffic,
respectively. In our empirical testing for Rosse-Panzar and for cross-sectional
regressions in the next section, we employ quarterly price indices constructed
from raw data provided by the DOT’s Form 41 as Air Carrier Financial
Statistics, and Air Carrier Traffic Statistics. The price indices for labor, fuel,
and materials are constructed using index number theory. The price of capital
in contrast is constructed by employing the Capital Asset Pricing Model
(CAPM). The CAPM computes the correct risk-adjusted return for a risky
asset within the framework of mean-variance portfolio theory. Since it
provides an economic measure of the price of capital and reflects the true
risk-adjusted opportunity cost, it is vastly superior to conventional accounting
measures for the price of capital.4 Price data were derived from Database
1A of the DOT’s origin and destination survey (O&D). The sample period
4 For a more detailed discussion of how the price of capital is calculated, see Fischer andKamerschen (2002).
City - Pair
86 JOURNAL OF APPLIED ECONOMICS
covers the 24 quarters between the first quarter of 1991 and the fourth quarter
of 1996.
Church and Ware (1999) point out that the Rosse-Panzar test shows what
the market structure or degree of monopoly is not and does not suggest what
is. Following this approach, we can rule out monopoly and perfect competition
for all airport-pairs that have a significantly positive test statistic, which is also
significantly different from 1. This is clearly the case for the majority of the
airport-pairs. Thus, the finding for these airport-pairs is consistent with the
structural model, which indicates conduct somewhere in between the collusive
solution, i.e. monopoly, and perfect competition. A closer look at the airport-
pairs with significantly negative estimates for the test statistic is warranted.
Recall that a negative test statistic can imply both competition or monopoly.
The airport-pairs that require closer scrutiny are Delta in the Detroit market
(inbound only), Memphis, Miami, Chicago O’Hare, and Philadelphia; United
in the Washington-Dulles market, US Air in Pittsburgh (inbound only) and
American for Miami and Chicago O’ Hare. Any further investigation into
market structure with the Rosse-Panzar test statistic remains inconclusive.
Finally, the magnitude of the estimates seems too large if one wants to follow
Shaffer’s suggestion regarding the estimation of the Lerner index. The estimates
obtained seem to preclude this estimation. However, the estimates are very
robust to changes in the specification of the model. Any potential explanation
of the magnitude of the estimates will have to explore in greater detail two
assumptions that could lead to implausibly high values for the test statistic. The
first is the assumption that the air carrier is a price taker on the input side. There
is some evidence that this is not the case, particularly for the input labor. Heavy
unionization and widespread collective bargaining suggest that airlines face a
less than competitive market for their labor inputs. The second is the assumption
that the industry is in long-run equilibrium. Recall that such an assumption is
crucial for the Rosse-Panzar test to work. Shaffer (1982a, b) explicitly points
to the almost contradictory nature of the assumptions that all observations are
identified, and controlled for as being in long-run equilibrium. In particular,
when working with a time-series sample like the airport-pair markets, any
change in factor prices involves some adjustment, which is unlikely to be
completed exactly by the end of the observed period. However, it is precisely
this variation in prices that is needed to identify the test statistic.

87MEASURING COMPETITION IN THE U.S. AIRLINE INDUSTRY
B. A Cross-Section Regression
This section presents a different approach to the investigation of pricing
strategies employed by airlines. The section develops a cross-section regression
model employing price data and route characteristics for a cross-section sample
of airline routes originating in Atlanta. The objective is to assess how particular
route characteristics affect the price on a given route. In developing the model,
we closely follow Peteraf and Reed (1994) and Borenstein (1989), adjusting
the model according to the requirements of the investigation and availability
of data. Observations are for the four quarters of 1996. Each observation
consists of one carrier serving one airport-pair. Both nonstop and one-stop
service are included. The equation to be estimated is specified as follows
ln YIELD = a0 + b
1 ln PASSENGER + b
2 ln DISTANCE
+ b3 ln AVERANGE COST + b
4 ln INCOME
+ b5 MARKETSHARE + b
6 HHI + b
7 VALUJET
+ b8 VACATION
where YIELD is defined as price divided by distance. That is, YIELD measures
the average fare charged by the observed carrier on the given route, divided
by stage length so as to obtain the price per mile and normalize across different
stage lengths. PASSENGERS is equal to the number of passengers transported
on the route during a quarter. It measures the total number of all local origin-
to-destination passenger. DISTANCE measures the stage length between the
departure and arrival cities. AVERAGECOST is a proxy for the cost-
competitiveness of the airline offering the service and is measured in average
cost per seat mile. Adjustments are made to account for different average
stage lengths across carriers. INCOME is a measure of disposable personal
income for the metropolitan statistical area of the destination. It is included to
capture aggregate income at the destination. MARKETSHARE captures the
market share that the airline commands on a given route. It measures the
share of all local origin-to-destination passengers for the observed carrier on
(9)

88 JOURNAL OF APPLIED ECONOMICS
a given route. Thus, it is constructed by dividing PASSENGERS by the total
number of local origin-to-destination passengers. HHI is the Herfindahl-
Hirschman index for the route under consideration; it ranges from 0 to 1.
Finally VALUJET is an indicator variable taking the value of one if a particular
airport-pair is served by ValuJet airlines and zero otherwise. It is designed to
measure whether the presence of a discount carrier has a depressing effect on
prices. Finally, VACATION is a dummy variable indicating whether a
destination is primarily a vacation spot. Price data are obtained from the DOT’s
origin and destination (O&D) survey for the four quarters of 1996, along
with information on passengers. The O&D survey also indicates whether
ValuJet is serving a particular airport-pair market. Using the quantity data,
the measures for market share and concentration are constructed. Distance is
taken from Delta Air Line’s worldwide timetable, effective June 1, 1997.
Data on population and income for the Metropolitan Statistical Areas have
been compiled by the Bureau of Labor statistics.
The expected sign for PASSENGERS is negative since with a larger
number of passengers the load factor increases, and therefore unit costs per
passenger should decrease. DISTANCE is one of the most important
determinants of airline cost. As distance increases, cost per mile decreases as
discussed previously. Since aircraft burn most fuel during take-off and landing,
and fixed cost can be spread over more miles, we expect unit cost per mile to
decrease as stage length increases. Therefore, the overall effect of DISTANCE
on YIELD is hypothesized to be negative. AVERAGECOST serves as a proxy
for a carrier’s cost efficiency. AVERAGECOST is calculated for the entire
domestic system, but adjusted with respect to distance. For example a carrier
with relatively high system-wide average cost, but a short average stage length
may still be more cost efficient than a carrier with slightly lower average cost,
but longer average stage length. The adjustment renders the AVERAGECOST
proxies comparable for any given route. The expected sign for
AVERAGECOST is positive, since less efficient firms are hypothesized to
demand higher fares. Since air travel is a normal good, an increase in disposable
income should increase the price of air travel. Hence, the sign for INCOME
is expected to be positive. Controlling for concentration, a firm with a higher
market share is expected to realize a higher yield. Therefore, the expected
sign for MARKETSHARE is positive. The sign for HHI is theoretically

89MEASURING COMPETITION IN THE U.S. AIRLINE INDUSTRY
ambiguous. A dominant firm could find it more convenient and easier to
maintain high prices if it competes against a fringe of small firms rather than
a fairly large and well-established rival. In the first scenario the HHI would
be smaller than in the second. The predicted sign would be negative. However,
holding market share constant, a higher HHI may make it more feasible for
firms to collude, hence raising prices. On the other hand if dominance stems
from technological advantages of the dominant firm such as cost efficiency
or effective marketing, rather than anti-competitive conduct, yields for other
firms should decrease. In the former case the sign is positive, whereas the
latter scenario suggests a negative sign. Overall, the sign depends on the
sources of concentration. The presence of a lowcost competitor such as ValuJet
in any given market should provide for increased and more vigorous
competition, and therefore should bring yields down. Therefore, the expected
sign for VALUJET is negative. Finally, leisure travelers are more price
sensitive; their demand for air travel is consequently more elastic. A market
to a destination that comprises a large share of leisure travelers therefore
should, ceteris paribus, afford lower yields. The portion of leisure travelers is
assumed to be higher on routes to vacation spots. Therefore, the hypothesized
sign for VACATION is negative.
Before we carried out the regression, some econometric issues were
addressed. First there is a potential problem regarding the possible endogeneity
of PASSENGERS, MARKETSHARE, and HHI. Indeed, a Haussmann
specification test rejects exogeneity for PASSENGERS and
MARKETSHARE. Therefore, we proceed with estimation using instruments
and 2-stage least squares. As the preferred set of instrument, we include all
the exogenous variables and their interactions with the dummies, as well as
the carrier’s share of all origin and destination passengers in Atlanta. We
also include the overall population of the destination’s metropolitan area, its
square, and distance squared.
Table 3 presents the coefficient estimates, along with their standard errors.
All coefficients have the expected sign where there existed unambiguous
predictions regarding the sign. Moreover, all coefficient estimates are highly
significant at better than the one-percent level. The coefficient estimates imply
that a 10 percent increase in local origin-and destination passengers decreases
fares by 1 percent. An increase in distance by 10 percent decreases fares by 7

90 JOURNAL OF APPLIED ECONOMICS
Table 3. Cross-Section Regression Parameter Estimates for the DependentVariable Yield
Coefficient Standard
error*
CONSTANT 3.63783 0.111927
PASSENGERS -0.099404 0.00711
DISTANCE -0.702309 0.015092
MARKETSHARE 1.00035 0.058172
HERFINDAHL-HIRSCHMAN INDEX (HHI) -0.347235 0.042411
AVERAGE COST 0.332542 0.055287
INCOME 0.15879 0.034166
VACATION -0.121219 0.017988
VALUJET -0.160558 0.015952
R2 0.774
Note: * Examining the p-values corresponding to the appropriate t-value shows that all
coefficients are significant at the 1% or better level.
percent on average. Furthermore, a one-point increase in the observed carrier’s
market share increases fares by 1 percent. Moreover, the estimates suggest that
a 10 percent increase in average cost translates into a 3.3 percent increase in
fare. The income elasticity of demand is approximately 16 percent. An increase
in concentration as measured by the HHI index reduces the yield. Therefore,
the model suggests that the dominant carrier Delta enjoys technological
advantages over its rivals or that there is some degree of competition provided
by another carrier. Most important for advocates of vigorous competition is the
coefficient for VALUJET, indicating that fares in airport-pair markets served
by ValuJet were on average 16 percent lower than on routes where such
competition was absent. This is a ringing endorsement for low-cost carriers. It
strongly suggests that in the interest of the traveling public, competition in the
airline industry should be encouraged, promoted, and facilitated wherever
possible.
Variable

91MEASURING COMPETITION IN THE U.S. AIRLINE INDUSTRY
IV. Conclusions
We employ a reduced form model called the Rosse-Panzar test to calculate
price-cost margins in selected airport-pair markets originating from Atlanta.
The statistics are generally positive and quite large, indicating that carriers
are neither in perfect competition nor perfectly colluding. Unlike structural
models, the Rosse-Panzar test is only sufficiently powerful to reject certain
outcomes of market conduct. We find that in all airport-pairs, the existence of
the Bertrand outcome, which is equivalent to perfect competition, is
resoundingly and consistently rejected, as is the outcome describing perfect
collusion, which is equivalent to the joint monopoly outcome.
In contrast, the Cournot solution cannot be rejected. In most markets,
conduct is consistent with the Cournot solution. However, the Rosse-Panzar
test is not powerful enough to identify a specific model of conduct. Our findings
show that conduct in most airport-pairs is also consistent with a range of conduct
deviating from the Cournot oligopoly both to the more and less competitive
behavior. That is, conduct is consistent with a wide range of intermediate
solutions between the monopoly outcome and perfect competition. A cross-
section pricing regression model to study pricing behavior supplements the
Rosse-Panzar approach. We find that all variables affect the dependent variable
as hypothesized and that all parameter estimates are highly significant. We find
that yield or price per mile traveled is positively correlated with the airline’s
average costs, its market share in a given airport-pair market and the income
in the metropolitan area where the airport is located. Yield is negatively
correlated with enplaned passengers, since, as the load factor rises, the cost per
passenger is declining. It is negatively correlated with the Herfindah-
Hirschmann-Index for a given market and with the distance between airports.
It is also significantly lower in markets that are considered primarily destinations
for vacationers. Most importantly, we find that the presence of lowcost
competition has a significant and substantial impact on average yields. For
1996, the period under investigation, other things being the same, average fares
were about 16 percent lower in markets where ValuJet was present than in those
in which it did not operate. In summary, we find sufficient evidence that the
industry, at least as it relates to airport-pair markets originating from Atlanta,
has some way to go to reach the benchmark of perfect competition.

92 JOURNAL OF APPLIED ECONOMICS
References
Air Carrier Financial Statistics, reported on Form 41, provided by Database
Products, Dallas, TX., 1991:1-1996:4.
Ashenfelter, O., and D. Sullivan (1987), “Nonparametric Tests of Market
Structure: An Application to the Cigarette Industry,” Journal of Industrial
Economics 35: 483-498.
Bailey, E.E. (2002), “Aviation Policy: Past and Present,” Southern Economic
Journal 69: 12-20.
Berry, S. (1992), “Estimation of a Model of Entry in the Airline Industry,”
Econometrica 60: 889-917.
Borenstein, S. (1989), “Hub Dominance and High Fares: Airport Dominance
and Market Power in the U.S. Airline Industry,” Rand Journal of
Economics 20: 344-365.
Church, J., and R. Ware (1999), Industrial Organization: A Strategic
Approach, Boston, Massachusetts, Irwin McGraw-Hill.
Fischer, T., and D.R. Kamerschen (2002), “Price-Cost Margins in the Airline
Industry Using a Conjectural Variation Approach,” Journal of Transport
Economics and Policy, forthcoming.
Gowrisankaran, G. (2002), “Competition and Regulation in the Airline
Industry,” Federal Reserve Bank of San Francisco Economic Letter 2002-
01: 1-3.
Nathan, A., and E.H. Neave (1989), “Competition and Contestability in
Canada’s Financial System: Empirical Results,” Canadian Journal of
Economics 22 (3): 576-594.
Panzar, J.C., and J.N. Rosse J.N. (1987), “Testing for ‘Monopoly’
Equilibrium,” Journal of Industrial Economics 35: 443-457.
Peteraf, M., and R. Reed (1994), “Pricing and Performance in Monopoly
Airline Markets,” Journal of Law and Economics 37: 193-213.
Rosse, J.N., and J.C. Panzar (1977), “Chamberlin vs. Robinson: An Empirical
Test for Monopoly Rents,” Bell Laboratory Economics Discussion Paper
90, and Stanford University Studies in Industry Economics 77.
Seade, J.E. (1980), “On the Effects of Entry,” Econometrica 48: 479-489.
Shaffer, S. (1982a), “Competition, Conduct and Demand Elasticity,”
Economics Letters 10:167-171.

93MEASURING COMPETITION IN THE U.S. AIRLINE INDUSTRY
Shaffer, S. (1982b), “A Nonstructural Test for Competition in Financial
Markets,” Proceedings of a Conference on Bank Structure and
Competition, Federal Reserve Bank of Chicago, April 12-14: 225-243.
Shaffer, S. (1983a), “The Rosse-Panzar Statistic and the Lerner Index in the
Short Run,” Economic Letters 11: 175-178.
Shaffer, S. (1983b), “Non-Structural Measures of Competition Toward a
Synthesis of Alternatives,” Economics Letters 12: 349-353.
Shaffer, S., and J. Di Salvo (1994), “Conduct in a Banking Duopoly,” Journal
of Banking & Finance 18: 1063-1082.
Sharpe, W. F. (1964), “Capital Asset Prices: A Theory of Market Equilibrium
under Conditions of Risk,” Journal of Finance 19: 425-442.
Silberberg, E. (1974), “The Theory of the Firm in ‘Long-Run’ Equilibrium,”
American Economic Review 84: 734-741.
Sullivan, D. (1985), “Testing Hypotheses About Firm Behavior in the Cigarette
Industry,” Journal of Political Economy 93: 586-598.
United States Department of Transportation (DOT), “Origin and Destination
Survey,” Database 1A. Hub-Study ATL, provided by Database Products,
Inc., Dallas, TX., 1991:1-1996:4.