MEASURING CHANGE BLINDNESS IN SPECIFIC PHOBIA: A REPLICATION
69
MEASURING CHANGE BLINDNESS IN SPECIFIC PHOBIA: A REPLICATION Except where reference is made to the work of others, the work described in this thesis is my own or was done in collaboration with my advisory committee. This thesis does not include proprietary of classified information. ____________________________ Zofia A. Wilamowska Certificate of Approval: ____________________________ ____________________________ Jeffrey S. Katz F. Dudley McGlynn, Chair Associate Professor Professor Psychology Psychology ____________________________ ____________________________ Alejandro Lazarte Joe F. Pittman Assistant Professor Interim Dean Psychology Graduate School
Transcript of MEASURING CHANGE BLINDNESS IN SPECIFIC PHOBIA: A REPLICATION

MEASURING CHANGE BLINDNESS IN SPECIFIC PHOBIA: A REPLICATION
Except where reference is made to the work of others, the work described in this thesis is my own or was done in collaboration with my advisory committee. This thesis does not
include proprietary of classified information.
____________________________ Zofia A. Wilamowska
Certificate of Approval:
____________________________ ____________________________ Jeffrey S. Katz F. Dudley McGlynn, Chair Associate Professor Professor Psychology Psychology ____________________________ ____________________________ Alejandro Lazarte Joe F. Pittman Assistant Professor Interim Dean Psychology Graduate School

MEASURING CHANGE BLINDNESS IN SPECIFIC PHOBIA: A REPLICATION
Zofia A. Wilamowska
A Thesis
Submitted to
the Graduate Faculty of
Auburn University
in Partial Fulfillment of the
Requirements for the Degree of
Master of Science
Auburn, Alabama December 15, 2006

MEASURING CHANGE BLINDNESS IN SPECIFIC PHOBIA: A REPLICATION
Zofia A. Wilamowska
Permission is granted to Auburn University to make copies of this thesis at its discretion, upon request of individuals or institutions and at their expense. The author reserves all
publication rights.
_________________________________ Signature of Author
_________________________________ Date
iii

VITA
Zofia A. Wilamowska is the daughter of Bogdan M. Wilamowski and Barbara T.
Wilamowska. Born on February 19, 1981 in Warsaw, Poland, Zofia completed her B.A.
at the University of Wyoming in May 2003 majoring in Psychology and graduating with
honors. She is currently pursuing her doctoral degree in Adult Clinical Psychology at
Auburn University.
iv

THESIS ABSTRACT
MEASURING CHANGE BLINDNESS IN SPECIFIC PHOBIA: A REPLICATION
Zofia A. Wilamowska
Master of Science, December 15, 2006 (B.A. University of Wyoming, 2003)
69 Typed Pages
Directed by F. Dudley McGlynn, Ph.D.
People often fail to notice changes in visual scenes, a phenomenon know as
“change blindness.” At least some change blindness results because relevant changes in
scenes occur during eye movements. The flicker paradigm was developed by Rensink,
O’Regan, and Clark (1997) as a way to study blindness to change during eye movements.
In the flicker paradigm brief blank-space intervals are interposed between repeated
presentations of scene pairs in order to mimic the eye movements. The second scene of
each pair is changed at some point and the time or trials needed to detect that the scene
has changed is recorded.
Wheeler (2003) used the flicker task to study a possible relation between change
blindness and fear. Half of his participants were snake phobic, half were not. Half of the
image pairs he used included a snake, half did not. Half of the scene changes were made
to central-interest aspects of the scene, half were made to marginal-interest areas.
Wheeler found that snake-fearful participants took longer than did controls to detect
v

changes within the marginal areas of scene pairs that did not include a snake. Wheeler’s
result was clearly significant but not predicted. Therefore a procedural replication was
undertaken that used twice the number of participants used by Wheeler.
Controls and snake-phobic participants completed Wheeler’s (2003) flicker task.
A 2 (Stimuli: neutral vs. feared) x 2 (Locations of change: central interest vs. marginal
interest) x 2 (Groups: snake phobic vs. non snake-phobic) repeated measures ANOVA
was performed on the number of repetitions required to detect changes between stimulus
pairs. The snake phobic participants required fewer repetitions to detect changes than did
the non-fearful participants; fewer cycles were required for detecting changes in the
feared versus the neutral stimuli; and fewer repetitions were required to detect changes in
central locations of interest than in marginal locations of interest. A three-way interaction
between Stimuli x Locations of change x Groups was significant, F(1, 22) = 7.148, p =
.014. Snake phobics required more repetitions than did control participants to detect
changes in the marginal interest areas of neutral stimulus pairs.
A plausible explanation of the three-way interaction is that phobics were
relatively unable to disengage from a visual search for feared stimuli (Fox, 1993, 1994,
2001, and 2002). According to Fox’s disengagement theory, once a feared stimulus is
attended to, a phobic individual is not able to quickly stop attending to it. In the present
study, phobics may have still been processing the feared stimulus pairs during the
presentation of the neutral stimulus pairs, and were delayed in detection of changes in the
marginal interest areas of the neutral stimulus pairs.
vi

Style manual or journal used APA Publication Manual (5th edition)
Computer software used Microsoft Word 2002
vii

TABLE OF CONTENTS
LIST OF TABLES............................................................................................................. ix
LIST OF FIGURES .............................................................................................................x
I. INTRODUCTION............................................................................................................1
II. METHOD......................................................................................................................25
III. RESULTS ....................................................................................................................30
IV. DISCUSSION..............................................................................................................36
REFERENCES ..................................................................................................................41
APPENDIX A....................................................................................................................48
APPENDIX B ....................................................................................................................50
APPENDIX C ....................................................................................................................52
APPENDIX D....................................................................................................................54
APPENDIX E ....................................................................................................................55
viii

LIST OF TABLES
Table 1. Mean Scores and Ranges for the FSS-II, SNAQ, and ADIS-IV ........................30
Table 2. Mean Numbers of Repetitions to Change Detection for Different Pairs of
Stimuli................................................................................................................................31
Table 3. Mean Numbers of Repetitions to Change Detection at Different Distances from
the Change from the Snake’s Head....................................................................................34
ix

LIST OF FIGURES
Figure 1. Flicker Paradigm with Interstimulus Interval (ISI) ............................................14
Figure 2. Graph of Interaction between Groups and Stimuli.............................................32
Figure 3. Bar Graph of Mean Number of Repetitions to Change Detection for Groups and
Stimuli across Locations of Change ..................................................................................33
x

I. INTRODUCTION
Change has a considerable psychological impact on the human mind. To the
fearful it is threatening because it means that things may get worse. To the hopeful it is
encouraging because things may get better. To the confident it is inspiring because the
challenge exists to make things better. - King Whitney Jr. (Simpson, 1988, p.100)
Overview
The phenomenon of change detection has been prominently researched for the
past 20 years. As the quote above illustrates, the presence of change in our daily lives is
relentless and unavoidable. One’s ability to detect change has serious implications for
one’s well-being, whether the changes in our environments are the arrival of imminent
threats, or opportunities to better ourselves or seek new challenges. However, it is
surprising to find out, after reviewing a few prominent articles in the change detection
literature, that detecting change is not as easy as one would expect. This inability to
detect change, referred to as “change blindness,” is a common occurrence in our daily
lives whether we are: a shopper driving in the mall parking lot looking for an empty
parking while not noticing that a driver just ahead of us is pulling out of their parking
space; or graduate student rummaging through a fridge searching for a half-eaten piece of
pizza, and not realizing that the tasty morsel is being continuously overlooked.
Research on change detection and change blindness has demonstrated that the key
factor in being able to notice a change in one’s environment is one’s allocation of
1

attention in the direction of the change (Rensink, 2002; Rensink, O’Regan, Clark, &
1997; Mack, 2003; Simons, 2000). According to some the study of attention selectivity in
reference to anxiety disorders has demonstrated that anxious individuals have an
attentional bias operating for pertinent feared or threatening stimuli (Mathews &
MacLeod, 1985; MacLeod & Mathews, 1988; Williams, Watts, MacLeod, & Mathews,
1988; Mogg, Mathews, & Wienman, 1989; McNally, Rieman, & Kim, 1990; Kindt &
Brosschot, 1997). As such, the attentional resources of anxious individuals are directed
toward the feared objects, presumably in order to facilitate identification of possible
routes for escape (Ohman & Mineka, 2001). To use an example of snake phobics
participating in a modified Stroop task, where half of the target stimuli are neutral and the
other half are feared, the individuals would spend considerably more time color-naming
the displays which contain the feared stimuli (Williams, Watts, MacLeod, & Mathews,
1988). However, Fox (1993, 1994, 2001, and 2002) argued that anxious individuals
respond differently to feared stimuli than to neutral stimuli because they are unable to
disengage from processing the information contained in the threatening stimuli (currently
coined “disengagement theory”).
Interestingly, only one study (Wheeler, 2003) has integrated the research on
change detection with the phenomenon of attention bias in phobias. Specifically, Wheeler
examined phobic and non-phobic participants’ detection of changes in neutral and feared
stimulus pairs presented in a flicker paradigm (described below). Wheeler’s results
supported Fox’s (1993, 1994, 2001, 2002) disengagement theory; phobic participants
took longer than did non-phobic participants to detect changes in some neutral stimuli,
presumably because they were still searching for prior feared stimuli. However, as a
2

consequence of his small sample of participants, the results lacked statistical power. The
current study was a procedural replication of the Wheeler experiment that used twice the
number of participants used by Wheeler.
Snake Phobia
A specific phobia is defined as clinically significant anxiety provoked by
exposure to a specific feared object or situation, often leading to the avoidance of the
feared object or situation. (DSM IV-R, American Psychiatric Association, 2000).
Specific phobias are typically grouped into three categories, namely: situational phobias
(e.g., thunderstorms or darkness), mutilation phobias (e.g., injections or injuries), and
animal phobias (e.g., spiders or snakes). The prevalence of specific phobias was
determined by Fredrickson, Annas, Fischer, Wik (1996) to be 19.9% (26.5 % for females
and 12.4 % for males) in a random sample of 1000 adults. More importantly, animal
phobia had a prevalence of 12.1% in women and 3.3% in men.
Information Processing Theories in Specific Phobias
Traditionally, the attributes of cognitive processing associated with anxiety
disorders have been subsumed under generalized hypervigilance for threat-related
stimuli, where one’s attention is narrowed and tightly focused on possible sources of
threat. A phenomenon observed in numerous experiments with different purposes and
methodologies over the past 40 years involves what has been called “narrowing of
attention” during emotional arousal (Easterbrook, 1959; Baddeley, 1972). Easterbrook
was one of the first to describe this phenomenon. He suggested that narrowing of
attention is a preoccupation with mood congruent material during emotional reactivity
3

that varies with the intensity of the emotion (i.e., the more intense the emotion, the
narrower the attention). Specifically, the number of cues utilized by a person in attention
to the environment decreases as one’s emotional intensity increases. One becomes
focused on the target mood-congruent stimuli as intensity of mood increases, at the
expense of concurrent attention to other stimuli. Stimuli relevant to the emotion become
more salient, whereas mood-incongruent or irrelevant stimuli are given less attention.
It is well established that changes occur in a number of various psychological
processes during fear. It has been suggested, for example, in Bower’s (1981) theory, that
emotions are represented in mental networks of associations between memories, ideas,
and concepts. Activation of one node in the associative network results in spreading
activation through which the associated nodes are triggered. Bower’s theory predicts
mood-congruent biases in every stage of information processing. People would thus show
a mood congruent perceptual, attentional, interpretational, and retrieval bias. For
example, when a spider phobic is confronted with a fear-evoking stimulus (e.g., cobweb),
the sight of the cobweb will activate his spider-phobic schema. This activation would
result in the phobic becoming anxious, causing him to scan his environment for spiders,
pay attention to other cues that would indicate the presence of spiders, and to perceive his
immediate environment as dangerous.
The action of attentional bias in anxious patients may also be conceptualized in
terms of the “information structure” theory described by Foa and Kozak (1986).
According to this theory, emotions are represented as a network in many structures,
which is similar to Bower’s (1981) theory of emotions. These structures are not limited to
actual information about stimuli and responses but also include interpretations about their
4
meaning for the individual. In the case of fear, these structures serve as motor programs
for escape and avoidance behavior (Foa & Kozak). Hyper-attention to fear-associated
stimuli may lead to a facilitated triggering of the fear network by these stimuli. When
fear-associated stimuli are detected (e.g., cobweb), processing resources are
automatically diverted from less salient cues to these feared stimuli in order to escape the
danger as quickly as possible. According to this theory, hyper-attention (or selective
attention) to feared stimuli facilitates early escape.
Information Processing and Attention Bias in Phobics: A Representative Subset of
Theories
Almost all studies examining attentional biases in specific phobias have been
based on individuals with spider phobias, and in most cases researchers have relied on a
modified version of the Stroop (1935) procedure. The standard Stroop requires the
participant to suppress or inhibit a well-learned response (word reading) and instead
implement a more novel response as quickly as possible (text color naming). Stimulus
words used in the standard version of the Stroop are color names either concordant or
discordant with text color (e.g., the word “red” written in red vs. blue ink).
Mathews and MacLeod (1985) modified Stroop’s (1935) paradigm. Instead of
using words that described colors, they used threatening words with anxious patients in
order to examine anxious patients’ attentional bias towards anxiety-provoking words. In
their experiment, patients were grouped on the basis of whether their worries were
predominantly social (e.g., patients who found it embarrassing to talk to new people) or
physical (e.g., patients who thought it was likely that they would have a heart attack). The
patients were tested on four Stroop cards, each containing 96 stimuli (12 words repeated
5

eight times). The words on the first card represented physical threat (e.g., “disease” and
“cancer”), those on the second card represented social threat (e.g., “failure” and
“pathetic”), and those on the two other cards contained non-threatening (mostly positive)
words (e.g., “secure” and “holiday”).
Mathews and MacLeod’s (1985) data indicated that control participants showed
no difference in color-naming latencies between threat and non-threat cards. By contrast,
not only did patients with anxiety show slower color naming for threat words than for the
non-threat words, but also there was a relation between the types of threat word that most
disrupted color naming and the type of worries that predominated in the participant.
Whereas all anxious participants were disrupted on social threat words, only physical
worriers were disrupted on the physical threat words. Mathews and MacLeod’s study
demonstrated some sort of attention-related bias for threatening words in anxious
individuals for whom these words had a personal fear-evoking value.
Mogg, Mathews, and Wienman (1989) replicated Mathews and Macleod (1985)
study. In their experiment anxious patients were administrated the modified Stroop task
in which the words were largely drawn from Mathews and MacLeod’s study. Mogg et al.
confirmed that threat words selectively interfere with color-naming performance of
generally anxious patients, compared to normal controls. The mean color-naming
latencies for the physical threat words were longer for the phobics compared to the
control group. The mean interference to name social threat words was greater for phobics
compared to the non-phobics. Mogg et al.’s study confirmed Mathews and MacLeod’s
finding of some kind of attentional bias in relation to anxiety-laden words in anxious
patients.
6
In relation to studying phobias, a modified version of the Stroop includes
emotionally laden words that are variously colored and that have special significance to
the participant (e.g., “cobweb,” or “tarantula” for spider phobic participants) and
variously colored neutral words. During the task, the participant is instructed to name the
color of each word as it is presented, and the time taken to name each color is measured.
Differences in the time taken to name the colors of threat-related and neutral words are
generally assumed to reflect differences in the expenditure of attentional resources that
the participant is devoting to the meaning of the word itself. Fearful participants show
interference effects (i.e., longer text color naming times) when stimuli are fear- relevant,
which is believed to be due to their difficulty in ignoring the content of fear-relevant
words. Most published studies based on the modified Stroop paradigm have found
evidence of longer color-naming latencies for spider-related words in people with spider
phobias (Kindt & Brosschot, 1997; Lavy & Van den Hout, 1993; Watts, McKenna,
Sharock, & Trezise, 1986) and for snake-related words among people with snake phobias
(Constantine, McNally, & Horning, 2001).
In order to examine attentional bias in spider phobics Watts, McKenna, Sharrock,
and Trezise (1986) used both a general emotional Stroop task, containing threat words
such as “fear,” “death,” and “grief”, and a specific Stroop task containing spider-related
words such as, “hairy” and “crawl.” In their study, Watts et al. compared spider phobics’
performance on the emotional Stroop task to their performance on the spider Stroop task.
The purpose of this comparison was to see if spider phobics’ attention was biased only
towards fear related objects (like spiders) or whether their attention was biased towards a
general array of threatening stimuli. Watts et al. found that spider phobic participants
7

showed little disruption of color naming on general threat-related words compared with
control participants, but they showed a very large interference in color-naming spider-
related words. This finding indicated that spider phobics had an attentional bias only
towards spider-related words.
Fox (1993, 1994, 2001, 2002) offered another perspective in relation to the
attention bias literature. According to Fox, the Stroop paradigm is a poor test of selective
attention because during the Stroop task participants selectively attend to different
features of an object at one location rather than to the individual characteristics of
separate objects. As such, attention is restricted to perceiving and selecting which set of
sensory data to analyze (Treisman, 1969). According to Fox (1993), in order to remedy
this problem of attention selectivity, a simple change in the stimulus display in the Stroop
task would be to present the target stimulus (color) and the distractor stimulus (word) in
separate spatial locations. Fox (1993) used a modified Stroop task in which color patches
and the target stimuli were spatially separated In this study, high-trait anxious and low-
trait anxious participants were required to color-name centrally located color patches
which had neutral, color, and threat-related words printed above and below that color
patch. The results afforded support for the idea that anxiety is associated with attentional
bias in that highly anxious participants required more time than did low anxious
participants to color-name threatening stimuli. However, another interesting finding that
resulted from this study was that highly anxious individuals required more time to color-
name non-threatening stimuli. This would indicate that once highly anxious individuals
were exposed to threatening stimuli, they were presumably unable to disengage from
processing the threatening stimuli and turn their attentional focus to non-threatening
8

stimuli. Fox’s research suggests that highly anxious individuals have difficulty
disengaging their attention from threatening stimuli.
To further explore these findings, Fox (1994) employed Tipper’s (1990) negative
priming paradigm to test that high anxious participants differ from low anxious
participants in showing reduced negative priming. Negative priming was described as a
delay in response to a target location, if, on the preceding stimulus presentation, that
location was one that had to be ignored. Explicitly, the participants were presented with a
stimulus at a specific location in the display, and were then told to ignore that location in
subsequent displays. In the displays that followed, the participants would show a lag in
the naming of the stimulus because it would be located in the area, which they were
previously told to ignore.
In the Fox (1994) study, it was predicted that if highly anxious participants had a
problem with ignoring distracting information, then they should demonstrate little or no
negative priming. The participants were asked to press one of four keys; the correct key
spatially corresponded to the location of a target stimulus in the display. The target
stimuli were displayed alone or in the presence of a distractor stimulus (color words,
neutral words, or threat related words). There were two objectives in this experiment. The
first goal was to determine if significant delays in participants’ reaction times
(interference) would occur in the presence of a distractor. The second aim of the
experiment was to find out if interference, marked by delays in participants’ reaction
times, would occur when the target location of a stimulus matched the location of the
distractor stimulus from the preceding display. In Fox’s experiment, however, following
the presentation of the distractor stimulus at one location, highly anxious participants did
9

not show the expected delay in identifying the target stimulus in the following display. In
other words, highly anxious participants did not experience negative priming effects.
Further experiments (Fox et al., 2001; Fox, Russo, & Dutton, 2002), using threat-
related stimuli as target stimuli and either threat-related or neutral stimuli as distractors,
also suggested that highly anxious individuals failed to show negative priming following
threat. Fox concluded that high anxiety is associated with a general deficit in
inhibiting/ignoring distracting information. In other words, these results suggest that high
trait anxiety may be associated with a general inability to maintain attentional focus,
rather than by an automatic attentional bias towards threatening information.
Ruiter & Brosschot (1994) also suggest that emotional Stroop interference is due
to the greater cognitive effort which is required to shut out the perception of threatening
stimuli. Many investigators have found that more emotionally disturbed individuals
(high trait anxious or diagnosed with an anxiety disorder) have generally been slower to
color name all stimuli, even neutral words (Fox 1993, 1994; Fox et al., 2001; Fox, Russo,
& Dutton, 2002; Mathews, May, Mogg, & Eysenck, 1990; Wheeler, 2003). Again this
raises the possibility that such individuals have a general difficulty maintaining
attentional focus.
Change Blindness
The mechanism behind the Stroop task is not well understood and as a result, a
different approach to measuring attention bias is needed. An example of such an
approach may be the flicker paradigm that is used to study change detection. Most of us
know what it is like to look at something but fail to see the obvious, such as a traffic light
10
turning green. Such an inability to detect change has been termed as change blindness.
Specifically, according to Rensink (2002) change blindness refers to the inability to
detect large changes to objects and scenes. A familiar term which was introduced by
Mack and Rock (1998) is called inattentional blindness and it refers to “the failure to see
highly visible objects we may be looking at directly when our attention is elsewhere”
Mack (2003, p. 180). Visual attention seems to be the critical factor in one’s ability to
eliminate change blindness. For the purpose of this discussion, visual attention is defined
as “an internal mechanism for selecting certain visual codes for further processing at the
expense of other visual codes” (Hollingsworth, Schrock, & Henderson, 2001, p. 296). It
follows that attention enables change detection because it functions as a safeguard of
representations of attended objects in visual short-term memory during the interstimulus
interval, allowing for a comparison between the original and modified displays. In
contrast, information which is not attended to will decay rapidly upon scene offset and
will be overwritten by subsequent visual encoding. As a result, if there is no overlap
between the changing and attended regions, the change between the displays will not be
detected.
According to Rensink (2002), traditionally there have been several types of
contingent change detection paradigms via which change blindness has been studied. The
paradigms include: gap-contingencies, saccade-contingencies, blink-contingencies, splat-
contingencies, occlusion contingencies, and cut-contingencies. In gap-contingent
techniques a change between the presentation of the original stimulus and the altered
stimulus is made during an interstimulus interval (Phillips, 1974; Pashler, 1988; Rensink,
11

O’Regan, & Clark, 1997; Rensink, 2004). Using the saccade-contingent approaches,
changes to the display are made during the participant’s eye-movement (McKonkie &
Zola, 1979; Grimes, 1996). In shift-contingent techniques the changes are made when the
entire display is suddenly altered, because of a simulated saccade, such as a shift in the
display (Sperling & Speelman, 1965). In blink-contingencies a change is made to the
stimulus when the participants blink their eyes (O’Regan et al., 2000). In splat-
contingencies the change is made at the same time as a brief distractor appears on the
stimulus although not necessarily over the area that is changed (Rensink, O’Regan, &
Clark, 2000) In occlusion-contingencies the change is made when the changing item is
briefly “occluded” from the participants view (Simons & Levin, 1998). Finally, in cut-
contingencies the change is made when a cut from one camera angle to another camera
angle occurs (Levin & Simons 1997, 2000). Of interest here is gap-contingent change.
Phillips (1974) was one of the first researchers to study change blindness. He
required participants to detect changes in displayed matrices consisting of partially filled
grids of dots. In his gap-contingency paradigm, an initial display was succeeded by an
interstimulus interval (ISI), and then followed by either an identical display or a display
that differed by a single dot. Results of the study indicated that, even with large matrix
displays, participants’ performance was excellent when the ISI between the original and
modified displays was less than about 100ms.
Pashler (1988) performed a series of experiments in which he attempted to
determine the durations of stimulus and ISI displays that would create the greatest
change blindness by means of the gap-contingency paradigm. Using an array of 10
12

alphanumeric characters as the original display, Pashler changed the display by masking
the stimuli. Masking of the stimuli refers to a procedure whereby a stimulus (the target) is
made difficult to detect because of a presentation of a second stimulus (the mask) in close
temporal or spatial proximity to the original stimulus. Pashler tested a range of display
durations ranging from 150ms to 500ms and three different ISI durations (34ms, 67ms,
and 217ms). Pashler discovered that increasing the duration of the original and modified
displays from 150 ms to 500ms produced only modest improvement in change detection.
He found that change detection required fewest repetitions with 34 ms ISIs but only when
no second stimulus (mask) was presented. When a mask was presented at the 34 ms ISIs
by temporal proximity to the original stimulus, change detection increased to the level of
the longer ISI conditions. Performance did not deteriorate much from 67 ms to 217 ms,
and there was a clear, but much more modest, effect of masking in these conditions.
Masking effects were reduced with the longer ISI, but never seemed to have disappeared.
Rensink, O’Regan, and Clark (1997) developed what has now commonly become
known in the change detection literature as the flicker paradigm. The flicker paradigm is
based on the gap contingency of change where an original image (A) and a modified
image (A’) are displayed on a computer screen, while the image pairs alternate repeatedly
and a time interval or an ISI occurs between the paired images.
13

Figure 1. Flicker Paradigm with Interstimulus Interval (ISI)
Interstimulus Interval (ISI)(80 ms)
Modified Image (A')(240 ms)
Original Image (A)(240 ms)
Rensink, O’Regan, and Clark (1997) much like Pashler (1988), performed several
time trials to determine effects on time trials to change detection of differing durations
that the image pairs and ISI were displayed. Rensink et al. discovered that when the ISI
was removed from the flicker paradigm, participants could immediately identify the
change between the image pairs, presumably because the ISI was no longer present.
Following Pashler’s findings, Rensink et al. determined that the best display durations,
for creating change blindness was 240 ms for the stimuli and 80 ms for the ISIs. These
time durations for the image pairs and ISI have also been employed by Rensink,
O’Regan, and Clark (2000), Rensink (2004), and Wheeler (2003). Research using the
flicker paradigm has produced two primary findings. The first is that participants rarely
detect changes during the first cycle of alternation (Rensink, O’Regan, & Clark, 1997).
Second, changes to areas of a scene rated to be of “central interest” are detected faster
14

than are changes to “marginal interest” areas. Central interest areas are rated as important
and salient features of an image whereas marginal interest areas are rated as unimportant.
In this respect Rensink et al. argued that this difference in detection performance was due
to the fact that central interest areas were preferentially selected by visual attention. In
studies of change detection, people are better able to report changes to attended than
unattended objects. Central objects are more likely to attract attentional resources, and if
we have a limited capacity for holding information across views, changes to objects that
receive more effortful processing are more likely to be detected (Rensink, 2000).
The empirical approaches to studying change detection discussed thus far have
employed still images as stimuli. Another area of research has chosen to focus on change
detection in moving stimuli such as film. One of the first studies to perform an
experiment using film was Neisser and Becklen (1975). In a study of selective looking,
the researchers asked participants to view a film of two superimposed ball-passing games
in which one group of players wore white uniforms and another group wore black
uniforms. Participants were instructed to count the number of passes between members of
one of the groups and to ignore the actions of the other team. During the game, a woman
carrying an open umbrella walked from one side of the screen to the other. After viewing
the video, the participants were subsequently asked to report whether they noticed
anything unusual in the video. Only a fifth of the participants indicated the presence of
the umbrella-carrying woman.
Simons and Chabris (1999) replicated Neisser and Becklen’s (1975) study but
instead of one unexpected event occurring during the video, they used two. Two
conditions were developed for the study. In the first condition, replicating the stimuli
15

used by Neisser and Becklen, a woman carrying an open umbrella walked across the
screen. In the second condition, a person in a gorilla suit walked across the screen. Also,
Simons and Chabris employed two video styles: (1) in the transparent condition, the
white team, black team, and unexpected event were all filmed separately, and the three
video streams were made partially transparent and then superimposed on each other by
using digital-video editing software, and (2) in the opaque condition, all actors were
filmed simultaneously and occluded one another and the basketballs. The participants’
task for this study was again to count the number of passes between teams. Results
indicate that across all conditions, more than half of the observers noticed the unexpected
event. However, the umbrella-carrying woman was noticed more often than the gorilla
overall. Interestingly, when participants were required to attend to the ball passes of the
black team, they noticed the gorilla much more often than when they attended to the
actions of the white team, seemingly indicating that people are more likely to notice an
unexpected event that shares basic visual features (e.g., color) with the events they are
attending to.
So far, this review of change detection research has discussed single changes to
image-pairs. In the following series of experiments, reported by Angelone, Levin, and
Simons (2003), the experimenters determined if there would be a difference in change
detection based on having one change or two changes to the stimuli. The participants
were required to watch a video of an actress asking a pedestrian for directions. The
change in stimulus in the video, which occurred during a cut in the camera angle, was a
change in an article of clothing that the actress was wearing or the object she was
16

carrying. After viewing the video, the participants were presented with a lineup of four
photographs of the actress wearing different types of clothing and carrying different
objects. The participants’ task was to identify a picture of the actress before the change
had occurred in the video. Interestingly, results indicate that only 6.7% of the participants
noticed a change in the video, however among the participants who missed the change,
the accuracy in their performance on the lineup task was above chance. During the
second experiment, another modification was added to the stimulus, which was a change
in the actresses’ identity (during a cut in the camera angle the original actress was
removed from the scene and another actress took her place). The results of this study
showed that 12.3% of the participants noticed a change in clothing or object in the video
and 48% of the participants who missed the change were able to accurately identify the
pre-change actress in the lineup task. Additionally, in the identity-change condition, more
than half of the participants noticed a change in actresses, however, accuracy on the
lineup task was comparable for the participants who noticed a change and those who
missed it.
The findings of change blindness reported thus far have been based on artificial
events, where participants were studied in controlled laboratory settings. An experiment
reported by Simons, Chabris, Schnur, and Levin (2002) was carried out in a natural
environmental setting. An experimenter who was holding a basketball approached a
pedestrian and asked for directions to a gymnasium. While the pedestrian provided
directions, a group of people passed between the pedestrian and the experimenter, and
one member of the group surreptitiously removed the basketball. When the pedestrian
17

finished giving directions, the pedestrian was asked if he or she noticed anything
unexpected happen or if he or she had noticed a change. Most pedestrians did not
spontaneously report the change, however, when asked further leading questions, many
reported the presence of the basketball and were even able to describe its features.
Intriguingly, even though the participants did not notice the change, they were still able to
recall specific features of the change object suggesting that they held represented details
of the changed object in their memories.
A different approach to studying change blindness was developed by McConkie
and Zola (1979), Grimes (1996), and Hollingworth, Schrock, and Hernderson (2001). All
three studies employed the use of an eye-tracking machine that records the positions and
movements of the eyes; hence recording naturally occurring saccades. The premise
behind the eye-tracker approach to studying change blindness is that as the participant’s
eyes begin to move, their targeted destination is calculated, and the stimulus in that
location is altered before the eyes arrive. McConkie and Zola examined the synthesis of
letter details by presenting sentences in which words were written with letters of
alternating case presentation in the first image (as illustrated in line 1 below) and
switching the case presentation of the letters in the successive image (as demonstrated in
line 2 below).
1. ThE sPaCe ShUtTlE tHuNdErEd InTo ThE sKy On A cOlUmN oF sMoKe.
2. tHe SpAcE sHuTtLe ThUnDeReD iNtO tHe SkY oN a CoLuMn Of SmOkE.
The change that occurred in their study was based upon an overlap of the visual details of
the two images. It was hypothesized that if the details of the letters were altered during an
18

eye-movement, while the grammatical structure and the content structures of the text
were sustained, any interference in the reading process could be credited to an inability to
combine the visual details obtained from the two images. Results of this experiment
demonstrated that not only did the experimental manipulation fail to produce any
disruption to the reading process or the eye-movement patterns, but it also failed to
produce the awareness that a change was occurring in the text. A plausible explanation
for this finding is that the participants’ attention was allocated to the semantic output
produced by the text and, having most of their attentional resources focused on the
meaning of sentence, the participants were unable to distribute attentional assets to the
change, which was occurring right before their eyes.
Hollingsworth, Schrock, and Herderson (2001) also monitored participants’ eye
movements while they performed a gap-contingent change detection task. The purpose
of their study was to determine whether fixation position (central vs. marginal)
influenced the detection of scene changes in the flicker paradigm. Fixation position was
differentiated from the orienting of visual attention by either requiring participants to
maintain their eyes in a central fixation (no-movement condition) or allowing them to
move their eyes freely (movement condition). The study also examined ease of change
detection depending on the type of change occurring. Three change conditions were
employed: deletions (an object was deleted from the scene), rotations (the object was
rotated 90° about the horizontal axis of the object), and no change. Moreover, the
experimenters examined the relation between participants’ eye positions and change
detection. The results indicated that the percentage correct in the eye-movement
19

condition was higher than that in the no-movement condition, suggesting that there is a
causal role for fixation position in the maintenance of information across discrete views
of a scene, leading to the detection of change. There was also an effect of change
condition; change detection was more successful for those image pairs where a deletion
took place than in image pairs where an object rotation occurred. Finally, additional
results demonstrate that the participants’ eyes remained in the central region on only7.7%
of the trials indicating that the participants detected changes by fixating on various
potential changes; not by monitoring extrafoveal regions of the scene.
Another study focusing on the types of change occurring in change detection
paradigms was performed by Agostinelli, Sherman, Fazio, and Hearst (1986). The
authors suggested that the recognition of change involved two stages: detection of change
and identification of the change. Agostinelli et al. speculated that if participants were
informed about the detection and identification tasks prior to having to perform them,
then the participants would be more likely to focus extra attention to the specific features
of the initial stimulus, which would later function as an entity for comparison. The
researchers expected that deletions should be easier for the participants to detect than
additions because the deleted feature is present in the comparison entity (original image).
This prediction was confirmed in an experiment employing the flicker paradigm that used
images of simple drawings of everyday objects as stimuli.
Mondy and Coltheart (2000) also investigated detection and identification rates
involving different types of changes in natural scenes across successive views. The
changes to the displays were: addition of objects, deletion of objects, object color
20

changes, and object location changes. Comparisons showed that correct change
identification was significantly more likely for deletions than for additions. Identification
of an added object and of a color change to an object did not differ significantly. Location
changes were significantly less likely to be identified than were additions and color
changes. In a second experiment that used the same materials, Mondy and Coltheart
investigated the effects of additions and deletions of unique and duplicate objects on
change detection. They found that changes to whole objects were more frequently
identified than were changes to objects that were part of a larger object. Furthermore,
deletions were again more likely to be identified than were additions. These results
confirmed the findings of Agostinelli et al.’s (1986), in that the deletion of an object from
a scene is much easier to detect than is the addition of an object. Mondy and Coltheart
argued that their results extend Agostinelli et al.’s findings in two important ways. First,
the deletion/addition condition in Mondy and Coltheart’s experiment was relevant to real
world settings having greater complexity than Agostinelli et al.’s drawn objects.
Secondly, Mondy and Coltheart demonstrated that the results of the deletion/addition
conditions occur both when the objects are elements or characters of whole objects and
when they are whole objects.
In a study by Archambault, O’Donnell, and Schyns (1999) two change-detection
experiments were conducted, which tested the prediction that people would perceive the
features of an object differently if they learned to categorize them differently – that is, at
different levels of specificity. Accordingly, Archambault et al. claim that the “perceptual
features that people extract from objects depend on how they typically categorize them”(
21

Archambault et al., p .249) In their first experiment, two groups of participants were
trained to categorize an identical set of 10 objects: half of the objects were computers,
half of them were mugs. One group (computer-MUG) learned to categorize computers at
a specific level where each object was individuated from the rest (e.g., “This is Peter’s
computer”) and mugs at a general level (e.g, “This is a mug”). The other group
(COMPUTER-mug) learned the opposite assignment of category level to objects -
computers were categorized as general (e.g., “This is a computer”) and mugs as specific
(This is Mary’s mug”). After categorization training was completed, the participants
participated in a flicker paradigm using photographs of office scenes containing various
office equipment including mugs and computers. The changes that occurred during the
ISI were either the replacement of one type of mug with another mug, removal of a mug
from the office scene, replacement of one type of computer with another computer, or
removal of a computer from the office scene. Findings of the Archambault et al. study
demonstrate that when participants knew an object at a specific or individuated level of
categorization, they perceived the change of that object almost immediately. When the
same object was known at a more general level, the same change took much longer to
notice.
Ro, Russell, and Lavie (2001) compared detection of changes in human faces
(which were categorized as having a more semantic value) versus other common objects
(e.g., clothes) in a flicker paradigm. The researchers found that changes were detected far
more rapidly and accurately in faces than in other objects. This advantage for faces,
however, was found only for upright faces in multiple-object arrays, and was completely
22

eliminated when displays showed one face only or when the pictures were inverted.
These findings imply a special status for faces in competition for selective attention, and
are consistent with recent findings that facial expressions have a unique capacity to draw
attention (Gauthier & Tarr, 1997; Kanwisher, McDermott, & Chun, 1997; Tanaka &
Farah, 1993; Fox, et al. 2000). In Angelone, Levin, and Simons’ (2003), study,
participants were also better at detecting changes in a person’s identity, which was
primarily determined by the person’s face, than changes to the articles of clothing that an
actress was wearing and objects that she was carrying. However, it is important to note
that the alteration of facial presentation does not necessarily lead to change blindness. An
important finding by Hochberg (1968) demonstrates that when displays of faces undergo
a luminance reversal (as in a photographic negative) the ability to detect changes in faces
is not affected.
Wheeler (2003) conducted a study that explored phobic and non-phobic
participant’s ability to detect changes in neutral and fearsome stimuli presented in a
flicker paradigm. Wheeler used the gap-contingency technique with cycling presentations
of the stimulus, where the change was made during the ISI (e.g. gray screen) between the
presentation of the original stimulus and the modified stimulus. The stimuli used for the
study were photographs of office scenes (neutral) and photographs of snakes (feared).
The changes, which occurred between the stimulus pairs in Wheeler’s study, were:
deletion (an object was removed from the modified scene), change in object’s location,
and change in object’s color. The stimulus-pairs were displayed for 240 ms, while the ISI
was displayed for 80 ms. Wheeler’s first hypothesis was that changes would be detected
23

faster in central-interest locations than in the marginal-interest locations for both phobics
and controls. Secondly, Wheeler predicted that phobic individuals would require fewer
cycles in change detection than controls in response to fearsome stimuli. Findings from
Wheeler’s study confirmed the prediction that central interest changes would be detected
faster than marginal interest changes. However, the results demonstrated that phobic
individuals experienced significantly greater change blindness on stimuli that were
neutral than on stimuli that were feared. A plausible explanation of this finding is Fox’s
(1993, 1994, 2001, and 2002) disengagement theory. According to that explanation,
phobic participants experience an inability to disengage from a visual search for feared
stimuli while viewing neutral stimuli, which results in longer change detection times on
neutral stimuli for phobic participants.
Wheeler’s (2003) findings were significant but not predicted. A noteworthy
limitation of Wheeler’s experiment was the small sample of participants employed. The
purpose of the present work was to perform an exact procedural replication of Wheeler’s
study that used twice the number of participants as were used by Wheeler.
24

II. METHOD Participants
357 participants were recruited from undergraduate psychology courses at Auburn
University and were instructed to complete a screening packet for which they received
extra credit. Twenty-eight participants (females = 25) were recruited from the screening
pool to participate in the experimental portion of the study. However, only 24 participants
(females = 22) were used in the data analysis for the following reasons: one participant
was discontinued from the study because she was too uncomfortable with the stimuli and
asked to be excused from the experiment; two participants were dropped from the study
because they did not identify the correct places of change on the image pairs; and one
participant was dropped because he pushed the space bar to continue with the
experimental task without finding or verbally identifying the change that occurred
between the image pairs. All participants received extra credit in exchange for their
participation in the experimental portion of the study. Equal numbers of participants were
assigned to the snake-phobic group (n = 12; females = 12) and control group (n = 12;
females = 10).
Snake Phobia Measures
Fear Survey Schedule-II (FSS-II). The purpose of the FSS-II was to identify
specific objects and situations that were anxiety provoking to the participants (see
Appendix A). The FSS-II was originally developed by Wolpe and Lang (1964). The
FSS-II is a self-report measure containing a list of 51 objects and situations that might be
25

fear-evoking. The participants were instructed to rate their level of fear on each item.
The items were rated on a seven-point Likert scale ranging from 0 (no fear) to 6 (terror).
Mean scores on the FSS-II for non-clinical samples of men and women are 75.78 (SD =
33.84) and 100.16 (SD = 36.11), respectively (Geer, 1965).
Snake Phobia Questionnaire (SNAQ). The purpose of the SNAQ was to quantify
the participant’s subjective fear of snakes (see Appendix B). The SNAQ was originally
developed by Klorman, Hastings, Weerts, Melamed, and Lang (1974). The SNAQ is
composed of 30 snake fear-relevant items that are answered in the true or false format.
Fredrikson (1983) reported that mean scores on the SNAQ among male and female
college students were 5.80 (SD=3.82) and 9.06 (SD=6.09), respectively. In the same
study, among individuals with snake phobias the mean score was 24.44 (SD=2.95).
Anxiety Disorders Interview Schedule for DSM-IV (ADIS-IV). The ADIS – IV is a
comprehensive semi-structured interview for diagnosing all DSM-IV anxiety disorders
and is highly regarded in this area (Brown, DiNardo, & Barlow, 1994). It contains
specific components that target various anxiety disorders including specific phobia. For
the purpose of this study, the ADIS-IV Specific Phobia module was used to obtain data
on the frequency and intensity of participants’ fears. The ADIS-IV Specific Phobia
module is composed of a list of 17 types of specific phobias. The participants are asked
to rank their level of fear and degree of avoidance. The rankings are based on a Likert
scale ranging from 0 (no fear/never avoids) to 8 (very severe fear/always avoids). After
rating their specific phobias, the participants were interviewed to rule out other possible
diagnoses (such as Panic Disorder) and to determine the history of the participants’
phobia and frequency and intensity of it.
26

Apparatus
Experimental events were controlled by a custom computer program written in
Visual Basic on a Pentium 4 computer (Wheeler 2003). Stimuli were presented on a 17-
inch Dell color monitor. The space bar on a computer keyboard or the left button on the
mouse were used as the response devices to record the participants’ responses.
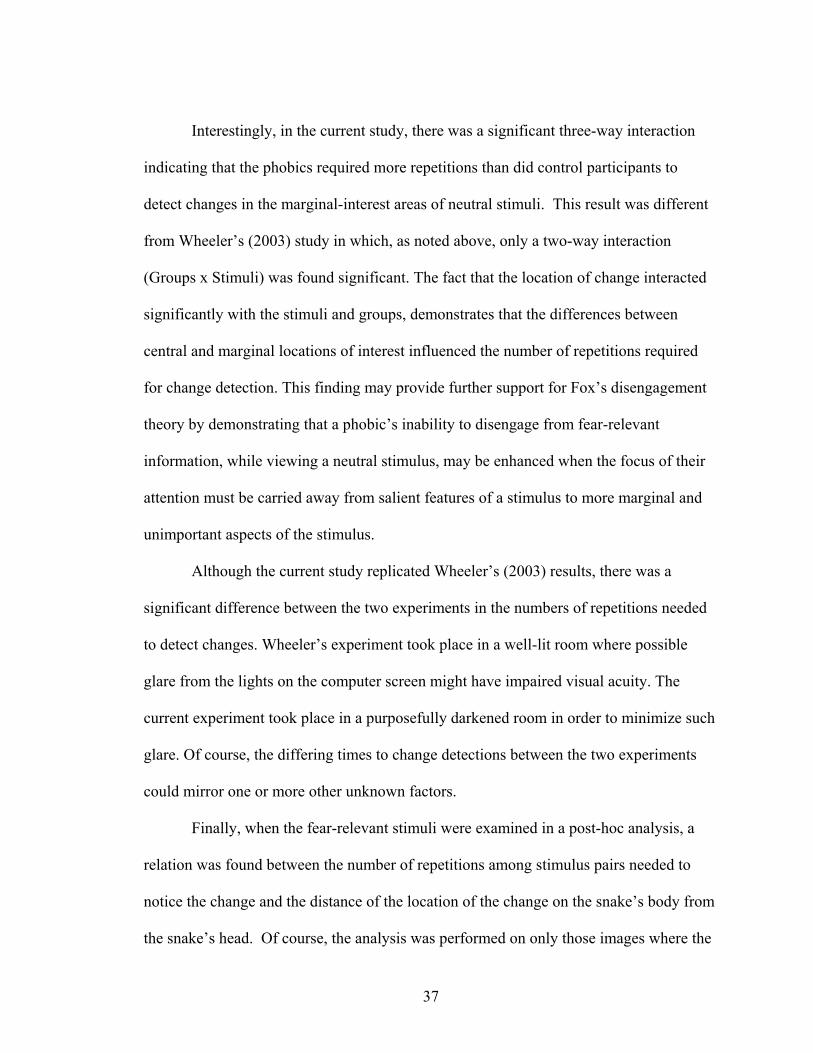
The Stimuli
The study employed the same visual stimuli as the ones that were generated for
the Wheeler (2003) study (See Appendix E). There were four types of stimuli: (1)
pictures of snakes where the change occurred in the central-interest region of the snake,
(2) pictures of snakes where the change occurred in the marginal-interest region of the
snake, (3) pictures of an office where the change occurred in the central-interest region,
and (4) pictures of an office where the change occurred in the marginal-interest region.
Central-interest stimulus changes were defined as changes that were rated focal, more
salient and more easily detected. Marginal-interest changes were those that were outside
the stimulus’ rated focal point and were more difficult to recognize (see Wheeler, 2003).
For each original stimulus used, a modified image was created which was an exact
replica of the original stimulus with the exception of either an object color change, object
location change, or object deletion. The stimuli were presented with the original image
(A) and the modified image (A’) in the sequence A, A’, A, A’…, with an ISI between
successive stimuli. Each stimulus was presented for 240 ms, and each ISI for 80ms.
Stimulus pairs were presented in random order. A total of 16 image pairs, four pairs of
each type, were presented to each participant.
27
Procedure
The study consisted of two sessions, occurring approximately two weeks apart.
Before the first session, participants were recruited via flyers and classroom
announcements in undergraduate psychology courses at Auburn University. During the
first session, participants were asked to review and complete an informed consent form
(see Appendix C), then were asked to complete the FSS-II and the SNAQ. Those
participants who had an elevated FSS-II snake-item score and a SNAQ score that did not
suggest an unusual fear of snakes were thanked for their participation, given an extra-
credit slip, and dismissed. Only those participants who reported a significant fear of
snakes on the screeners (FSS-II = 5 or 6, and SNAQ ≥ 19) or those who reported none or
minimal fear of snakes on the screeners (FSS-II = 0 or 1 and SNAQ ≤ 5) were asked to
participate in the second session of the study.
For the second session, the participants were interviewed using the ADIS-IV by
the experimenter. The interviewer was “blind” to the participants’ scores on the
screeners. After the completion of the interview, the participants were seated at the
computer. The participants then received oral instructions on how to perform the flicker
task (see Appendix D). After the instructions, the participants engaged in four practice
trials of the flicker task. Finally, the participants performed the experimental flicker task.
After completing the flicker task (or after having been excused from the session) the
participants were thanked, debriefed about the experiment, and given extra-credit slips.
Flicker Procedure
The participants were instructed to observe the series of stimulus pairs and to
press the response button, when they detected a change between the two stimuli. As
28

noted already, the original stimulus (A) and the modified stimulus (A’) were presented
for 240ms with an ISI, of 80ms, between A and A’. The computer, on which the flicker
task was administered, recorded the number of repetitions for each stimulus pair and the
amount time elapsed for each stimulus pair for each participant. Also as noted already,
one of the following changes was made to an object in each stimulus pair: deletion of
object, change in location of object, or change of object’s color.
In order to avoid identification errors or guessing, after pressing the response
button, the computer paused for 5000 ms during which participants orally indicated
where the change took place or in which object the change took place. During the
administration of the flicker task, a researcher sitting behind the participants recorded
identification errors.
29

III. RESULTS
The group means and ranges of scores on the FSS-II, SNAQ, and ADIS-IV are
presented in Table 1. This experiment was designed to evaluate between-group
Table 1. Mean Scores and Ranges for the FSS-II, SNAQ, and ADIS-IV
Measure Phobics Controls M Min Max M Min Max FSS Scores on Snake Question 5.50 5.00 6.00 0.33 0.00 1.00 FSS overall scores 108.16 55.00 179.00 74.92 32.00 158.00 SNAQ 23.75 19.00 29.00 2.17 0.00 5.00 ADIS-IV 7.25 6.00 8.00 0.58 0.00 2.00
differences for snake phobic participants versus controls and to compare within-group
differences based on the location of the change (central-interest vs. marginal-interest) and
type of stimulus (feared vs. neutral). The numbers of repetitions to change detection were
analyzed. Each of the 24 participants provided one value for the number of repetitions to
change detection for each of the 16 stimuli. The 384 values were analyzed with a 2 x 2 x
2 (Stimuli x Locations of Change x Groups) repeated measures analysis of variance.
The mean number of repetitions required for each group to detect the changes
among the different stimuli and different locations are presented in Table 2. There was a
significant main effect found for Groups, F(1, 22) = 4.411, p=.047; members of the
30

Table 2. Mean Numbers of Repetitions to Change Detection for Different Pairs of
Stimuli.
Variable Phobics Controls M SE M SENeutral/Central repetitions to change detection 8.58 0.88 5.67 0.72 Neutral/Marginal repetitions to change detection 92.65 17.73 45.87 7.47 Feared/Central repetitions to change detection 6.02 0.51 2.69 0.36 Feared/Marginal repetitions to change detection 37.75 4.62 47.08 6.57
control group (M = 25.32) detected changes among the stimulus pairs with fewer
repetitions than did members of the phobic group (M = 36.25). There was also a
significant main effect for Stimuli, F(1, 22) = 7.490, p=.012; changes made in fear-
relevant stimuli were detected with significantly fewer repetitions (M = 23.39) than were
changes made to the neutral stimuli (M = 38.19). Finally, there was a significant main
effect for Locations of Change, F(1, 22) = 101.225, p<.001; changes made to central-
interest areas were discovered with fewer repetitions (M = 5.74) than were changes made
to marginal-interest areas (M = 55.83)
The difference in the numbers of repetitions to change detection for neutral vs.
fearsome stimuli was greater for phobic participants than for the control group, F(1, 22) =
8.280, p=.009 (See figure 2). This result replicates the most important finding from
Wheeler’s (2003) experiment. The difference in the number of repetitions to change
detection for central vs. marginal changes was greater for neutral stimuli than for fear-
31

relevant stimuli, F(1, 22) = 5.178, p=.033 (See figure 3). Most importantly, there was a
significant three-way interaction involving Stimuli x Locations of Change x Groups, F(1,
22) = 7.148, p=.014 indicating that the phobics required more repetitions than did control
participants to detect changes in the marginal-interest areas of neutral stimuli.
Figure 2. Graph of Interaction between Groups and Stimuli
PhobicsControlsGroup
120.00
100.00
80.00
60.00
40.00
20.00
0.00
-20.00
Mea
n N
umbe
r of
Rep
etiti
ons t
o C
hang
e D
etec
tion
SnakeNeutral
Error bars: +/- 2.00 SD
Stimuli
32

Figure 3. Bar Graph of Mean Number of Repetitions to Change Detection for Groups and
Stimuli across Locations of Change.
MarginalCentral
Location of Change
100.00
80.00
60.00
40.00
20.00
0.00
Mea
n N
umbe
r of
Rep
etiti
ons t
o C
hang
e D
etec
tion
46
6
47
3
93
9
38
6
Control participantslooking at neutralstimuli
Control participantslooking at snakestimuli
Snake fearfulparticipants lookingat neutral stimuli
Snake fearfulparticipants lookingat snake stimuli
When comparing the results of the current study with the results of Wheeler (2003),
another interesting finding emerged. Change detection occurred with fewer repetitions for
the participants in the current study than in Wheeler’s (2003) experiment, F(1, 34) =
304.148, p<.001.
A post-hoc analysis was performed in order to determine whether the “central vs.
marginal” dichotomy might be refined and studied. The analysis was conducted on only
those pictures where the whole body of the snake was present in both members of the
33

stimulus pairs. Consequently, the analysis was performed on three fear-relevant pictures
where the changes occurred in the central-interest location and on two fear-relevant
images where the changes occurred marginally. The means produced by the data for this
analysis are presented in Table 3.
Table 3. Mean Numbers of Repetitions to Change Detection at Different Distances of the
Change from the Snake’s Head.
Distance from snake’s head to the location of change on the snake’s body
Mean number of repetitions to change
detection Phobics Controls M M1. Central interest change occurring at snake’s head area 1.30 1.25 2. Central interest change occurring behind the head area of the snake 1.70 1.92 3. Central interest change occurring on the lower neck of the snake 4.40 3.83 4. Marginal interest change occurring on the mid-body of the snake 57.00 51.75 5. Marginal interest change occurring on the tail of the snake 124.75 105.70
Interestingly, for both phobic and control participants the further away from the
head the change on the snake’s body took place, the more repetitions it took the
participants to detect the change. As illustrated in Table 3, there was a significant
difference in the number of repetitions to change detection between each stimulus and its
successor in this group for which the change was further down the snake’s body:
Stimulus 1 vs. Stimulus 2, t(23)=-2.806, p =.011; Stimulus 2 vs. Stimulus 3, t(23)=4.782,
34

p=.000; Stimulus 3 vs. Stimulus 4, t(23)=4.733, p=.000; and Stimulus 4 vs. Stimulus 5,
t(23)=-2.549, p= 0.019.
35

IV. DISCUSSION
The present study replicated Wheeler’s (2003) preliminary findings. It
demonstrated that, for both snake-phobic participants and controls, change detection
occurred faster for objects that were of central interest in the stimulus-pairs than for
objects that were of marginal interest. This result is also consistent with the result of
Rensink, O’Regan, and Clark (1997). The findings from the current study were also
congruent with Wheeler’s finding that change detection occurs faster for fear-relevant
stimuli (snakes) than for neutral stimuli (office equipment) for both snake-phobics and
controls. Furthermore, the current study also supported Wheeler’s finding that the
number of stimulus repetitions required for change detection in neutral stimuli was larger
for snake-phobic participants than for controls, however, only among the marginal
stimuli. A plausible explanation for this finding is that snake-phobics were relatively
unable to disengage from a visual search for snake-related stimuli (Fox, 1993, 1994,
2001, and 2002). According to Fox’s disengagement theory, once a phobic stimulus is
attended to, a phobic individual is not able to quickly stop attending to it. In the present
study, phobic participants may have in some way been processing the fear-relevant
stimuli during the subsequent presentation of the neutral stimuli, and were thus less able
than control participants to focus on the neutral stimuli and detect changes among them.
This replication of Wheeler’s study, provides more inferential support for the idea that
phobics have a difficulty disengaging from fear-relevant stimuli when attempting to
process neutral stimuli.
36
Interestingly, in the current study, there was a significant three-way interaction
indicating that the phobics required more repetitions than did control participants to
detect changes in the marginal-interest areas of neutral stimuli. This result was different
from Wheeler’s (2003) study in which, as noted above, only a two-way interaction
(Groups x Stimuli) was found significant. The fact that the location of change interacted
significantly with the stimuli and groups, demonstrates that the differences between
central and marginal locations of interest influenced the number of repetitions required
for change detection. This finding may provide further support for Fox’s disengagement
theory by demonstrating that a phobic’s inability to disengage from fear-relevant
information, while viewing a neutral stimulus, may be enhanced when the focus of their
attention must be carried away from salient features of a stimulus to more marginal and
unimportant aspects of the stimulus.
Although the current study replicated Wheeler’s (2003) results, there was a
significant difference between the two experiments in the numbers of repetitions needed
to detect changes. Wheeler’s experiment took place in a well-lit room where possible
glare from the lights on the computer screen might have impaired visual acuity. The
current experiment took place in a purposefully darkened room in order to minimize such
glare. Of course, the differing times to change detections between the two experiments
could mirror one or more other unknown factors.
Finally, when the fear-relevant stimuli were examined in a post-hoc analysis, a
relation was found between the number of repetitions among stimulus pairs needed to
notice the change and the distance of the location of the change on the snake’s body from
the snake’s head. Of course, the analysis was performed on only those images where the
37

whole snake was visible in both displays in the stimulus pairs. As result, only five snake
pictures (three where the change occurred in the central interest location and two where
the changed occurred marginally) were analyzed. Although the present study had a
limited number of stimuli on which this analysis could be performed, the pattern noticed
is still important to consider. Even though these results were found in both snake-
phobics and controls, the finding should not be surprising. According to Ohman, Flykt,
and Esteves (2001) mammals have evolved in environments where the reproductive
potential of individuals was predicted on the ability to efficiently locate critically
important events in their surroundings. For example, finding of food and mating partners
were needed for survival of the gene pool. Detecting predators, which constituted a direct
threat to the continued existence of the individual, was also in the interest of survival. In
this respect, evolutionarily relevant threats, such as snakes, may be detected faster to get
priority for processing in order to effectively and efficiently execute an escape from
danger. Participants in both the phobic and control groups have the same evolutionary
history. More importantly, when examining the features of the feared stimulus (the
snake), it is the head which would cause the greatest fear response because this is the part
of the snake that is dangerous. The further away the participant is from the head of the
snake, the less danger there is of being bitten.
Limitations and Future Directions
Although the present study doubled the sample size of Wheeler’s (2003) study, an
even larger sample of participants would greatly increase the statistical power of the
results. Moreover, the sample of stimuli used in the study was too small. Future attempts
to study phobics using the flicker paradigm would benefit from the use of a larger set of
38

fear-relevant and neutral stimulus pairs. Another limitation of the present study was
observed during the post hoc analysis of the data where it was noticed that on the fear-
relevant stimuli, all of the changes occurred on the snake. Future efforts should employ
fear-relevant stimuli where the changes occur both on the snake’s body and outside of the
snake’s body. In general, the hypothesis is that snakes will be of “central interest” to the
phobics only. Change in stimulus pairs should be planned to take that notion into account.
Another limitation noted in the study, was the possibility that there was too much
variability in task difficulty within the marginal interest change stimulus-pairs. It
appeared that on certain pairs of stimuli, participants were able to detect the change
quickly while change detection took significantly longer on other pairs. Equating the
level of difficulty in the marginal interest stimulus-pairs, would reduce within group
variance and make the distinction between group performances more apparent. Finally,
the administration of the ADIS-IV semi-structured interview before the administration of
the flicker task, may have primed the participants to the nature of the experiment (Holle,
Neely, & Heimberg, 1997; Amir, Beard, & Przeworski, 2005; Ellwart, Becker, & Rinck,
2005). Future attempts to study phobics with this experimental approach, should attempt
to counterbalance the order of assessment (i.e. half of the participants could be assessed
for snake phobia before the experimental task, and half after).
This research is new in that it is one of the first three studies (other than Wheeler,
2003 and Mulfinger, 2005) to use the flicker paradigm to study visual attention in a
phobic population. Thus far, the concepts of change blindness and change detection have
been used mostly in the field of cognition in attempting to gain a better understanding of
human perceptual processes, and selective attention (Rensink, 2002). Future studies on
39

change detection using the flicker paradigm might include other anxiety disordered
groups. Attentional bias for exteroceptive stimuli is presumably more salient for specific
phobics than for patients with panic disorder or generalized anxiety disorder. In addition,
future research should examine the physiological status of participants during the flicker
task. Attentional bias is driven, theoretically, by arousal and should not occur in the
absence of arousal. Hence, comparisons could be made between participants who were
and were not aroused during the experiment.
Finally, in order to better test Fox’s (1993) disengagement theory using the flicker
paradigm, a possible future direction in research should focus on manipulating the order
of the neutral versus feared stimulus presentation. If phobics do in fact have an inability
to disengage from fear-relevant stimuli while viewing neutral stimuli, perhaps an
experimental manipulation should involve a comparison between the number of
repetitions required for participants to detect changes in stimuli when the stimuli are
presented in the following orders: neutral stimuli succeeding other neutral stimuli, neutral
stimuli succeeding feared stimuli, feared stimuli succeeding neutral stimuli, and feared
stimuli succeeding other feared stimuli. In contrast to the current study, where the
presentation of the neutral versus feared stimuli was randomized for each participant, the
manipulation where the stimulus presentation would be carefully ordered, would test
whether there is a difference in the level of disengagement for phobic participants among
the different orders of the stimulus presentation and would afford a test of Fox’s
disengagement theory.
40

V. REFERENCES
Agonstinelli, G., Sherman, S. J., Fazio, R. H., & Hearst, E. S. (1986). Detecting and
identifying change: Addition versus deletions. Journal of Experimental
Psychology, 12, 445–454.
American Psychiatric Association (2000) Diagnostic and Statistical Manual of Mental
Disorders, 4th ed., revised. Washington, DC: American Psychiatric Association.
Amir, N., Beard, C., & Przeworski, A. (2005). Resolving ambiguity: The effect of
experience on interpretation of ambiguous events in generalized social phobia.
Journal of Abnormal Psychology, 114, 402-408.
Angelone, B. L., Levin, D. T., & Simons, D. J. (2003). The relationship between change
detection and recognition of centrally attended objects in motion pictures.
Perception, 32, 947-962.
Archambault, A., O'Donnell, C., & Schyns, P. G. (1999). Blind to object changes: When
learning the same object at different levels of categorization modifies its
perception. Psychological Science, 10, 249–255.
Baddeley, A. D. (1972). Selective attention and performance in dangerous environments.
British Journal of Psychology, 63, 537 – 546.
Brown, T. A., DiNardo, P. A., & Barlow, D. H. (1994). Anxiety disorders interview
schedule for DSM-IV (ADIS-IV). Albany, NY: Graywind Publications.
Bower, G. H. (1981). Mood and memory. American Psychologist, 36, 129-148.
41

Constantine, R., McNally, R. J., & Hornig, C. D. (2001). Snake fear and the pictorial
emotional Stroop paradigm. Cognitive Therapy and Research, 25, 757–764.
Easterbrook, J. A. (1959). The effect of emotion on cue utilization and the organization of
behavior. Psychological Reviews, 66, 183-201.
Ellwart, T., Becker, E. S., & Rinck, M. (2005). Activation and measurement of threat
associations in fear of spiders: An application of the extrinsic affective Simon
task. Journal of Behavior Therapy and Experimental Psychiatry, 36, 281-299.
Foa, E. B. & Kozak, M. J. (1986). Emotional processing of fear: Exposure to corrective
information. Psychological Bulletin, 99, 20-35.
Fox, E. (1993). Attentional bias in anxiety: Selective or not? Behaviour Research and
Therapy, 31, 487–493.
Fox, E. (1994). Attentional bias in anxiety: A defective inhibition hypothesis. Cognition
and Emotion, 8, 165–195.
Fox, E., Russo, R., & Dutton, K. (2001). Do threatening stimuli draw or hold visual
attention in subclinical anxiety? Journal of Experimental Psychology, 130, 681–
700.
Fox, E., Russo, R., & Dutton, K. (2002). Attentional bias for threat: Evidence for
delayed disengagement from emotional faces. Cognition and Emotion, 16, 355–
379.
Fredrickson, M. (1983). Reliability and validity of some specific fear questionnaires.
Scandinavian Journal of Psychology, 24, 331-334.
42

Fredrickson, M., Annas, P., Fischer, H., Wik, G. (1996). Gender and age differences in
the prevalence of specific fears and phobias. Behaviour Research and Therapy,
34, 33-39.
Gauthier, I., & Tarr, M. J. (1997). Becoming a “greeble” expert: Exploring mechanisms
for face recognition. Vision Research, 37, 1673-1682.
Geer, J. H. (1965). The development of a scale to measure fear. Behaviour Research and
Therapy, 3, 45-53.
Grimes, J. (1996). On the failure to detect changes in scenes across saccades. In K.
Adkins (Ed.), Perception (pp. 89-110). New York: Oxford University Press.
Hochberg, J. (1968). In the mind's eye. In Haber, R. N. (Ed.) Contemporary Theory and
Research in Visual Perception, 309-331. New York: Holt, Rinehart, & Winston.
Holle, C., Neely, J. H., & Heimberg, R. G. (1997). The effects of blocked versus
random presentation and semantic relatedness of stimulus words on response to a
modified Stroop Task among social phobics. Cognitive Therapy and Research,
21, 681-697.
Hollingworth, A., Schrock, G., & Henderson, J. M. (2001). Change detection in the
flicker paradigm: The role of fixation position within the scene. Memory and
Cognition, 29, 296–304.
Kanwisher, N., McDermott, J., & Chun, M. M. (1997). The fusiform face area: A module
in human extrastriate cortex specialized for face perception. Journal of
Neuroscience, 17, 4302-4311.
Kindt, M., & Brosschot, J. F. (1997). Phobia-related cognitive bias for pictorial and
linguistic stimuli. Journal of Abnormal Psychology, 106, 644-648.
43

Klorman, R., Weerts, T. C., Hastings, J. E., Melamed, B. G., & Lang, P.J. (1974).
Psychometric description of some specific-fear questionnaires. Behaviour
Therapy, 5, 401-409.
Lavy, E. & Van den Hout, M. (1993). Selective attention evidence by pictorial and
linguistic Stroop tasks. Behavior Therapy, 24, 645-657.
Levin, D. T., & Simon, D. J. (1997). Failure to detect changes to attended objects in
motion pictures. Psychonomic, Bulletin and Review, 4, 501-506.
Levin, D. T., & Simon, D. J. (2000). Perceiving stability in a changing world: Combining
shots and integrating views in motion pictures and the real world. Media
Psychology, 2, 357-380.
Mack, A. (2003). Inattentional blindness: Looking without seeing. Current Directions
in Psychological Science, 12, 180-184.
Mack, A., & Rock, I. (1998). Inattentional blindness: Perception without attention. In R.
D. Wright (Ed.), Visual Attention (pp. 55-76). New York: Oxford University
Press.
MacLeod, C. & Mathews, A. (1988). Anxiety and the allocation to threat. The
Quarterly Journal of Experimental Psychology, 40A, 653-670.
Mathews, A. & MacLeod, C. (1985). Selective processing of threat cues in anxiety
states. Behaviour Research and Therapy, 23, 563-569.
Matthews, A., May, J., Mogg, K., & Eysenck, M. (1990). Attentional bias in anxiety:
Selective search or defective filtering? Journal of Abnormal Psychology, 99, 166-
173.
McKonkie, G. W., & Zola, D. (1979). Is visual information integrated across successive
44

fixations in reading? Perception and Psychophysics, 25, 221-224.
McNally, R. J., Rieman, B. C., & Kim, E. (1990). Selective processing of threat cues in
panic disorder. Behaviour Research and Therapy, 28, 407-412.
Mogg, K., Mathews, A., & Weinman, J. (1989). Selective processing of threat cues in
anxiety states: A replication. Behaviour Research and Therapy, 27, 317-323.
Mondy, S., & Coltheart, V. (2000). Detection and Identification of change in naturalistic
scenes. Visual Cognition, 7, 281-296.
Mulfinger, A. (2005). Differences in flicker paradigm response times: Change blindness
in snake phobics. Master's thesis, Auburn University.
Neisser, U. & Becklen, R. (1975). Selective looking: Attending to visually to specified
events. Cognitive Psychology, 7, 480-494.
Ohman, A., & Mineka, S. (2001). Fears, phobias, and preparedness: Toward an evolved
module of fear and fear learning. Psychological Review, 108, 483-522.
Ohman, A., Flykt, A., & Esteves, F. (2001). Emotion drives attention: Detecting the
snake in the grass. Journal of Experimental Psychology: General, 130, 466-478.
O'Regan, J. K., Deubel, H., Clark, J. J., & Rensink, R. A. (2000). Pictures changes
during blinks: Looking without seeing and seeing without looking. Visual
Cognition, 7, 191-211.
Pashler, H. (1988). Familiarity and visual change detection. Perception and
Psychophysics, 44, 369-378.
Phillips, W. A. (1974). On the distinction between sensory storage and short-term visual
memory. Perception and Psychophysics, 16, 283-290.
Rensink, R. A. (2004). Visual sensing without seeing. Psychological Science, 15, 27-
45

32.
Rensink, R. A. (2000). Seeing, sensing, and scrutinizing. Vision Research, 40, 1469-
1487.
Rensink, R. A. (2002). Change detection. Annual Review in Psychology, 53, 245-277.
Rensink, R. A., O'Regan, J. K., & Clark, J. J. (1997). To see or not to see: The need for
attention to perceive changes in scenes. Psychological Science, 8, 368-373.
Rensink, R. A., O'Regan, J. K., & Clark, J. J. (2000). On the failure to detect changes in
scenes across brief interruptions. Visual Cognition, 7, 127-145.
Ro, T., Russell, C., & Lavie, N. (2001). Changing faces: A detection advantage in the
flicker paradigm. Psychological Science, 12, 94-99.
Ruiter, C., & Brosschot, J. F. (1994). The emotional Stroop interference effect in
anxiety: Attentional bias or cognitive avoidance? Behaviour Research and
Therapy, 32, 315–319.
Simons, D. J. (1996). In sight, out of mind: When object representations fail.
Psychological Science, 7, 301-305.
Simons, D. J. (2000). Current approaches to change blindness. Visual Cognition, 7, 1-
15.
Simons, D. J., & Chabris, C. F. (1999). Gorillas in our midst: Sustained inattentional
blindness for dynamic events. Perception, 28, 1059-1074.
Simons, D. J., Chabris, C. F., Schnur, T., & Levin, D. T. (2002). Evidence for preserved
representations in change blindness. Consciousness and Cognition, 11, 78-97.
Simons, D. J., & Levin, D. T. (1998). Failure to detect changes to people during a real-
world interaction. Psychonomic, Bulletin and Review, 5, 644-49.
46

Simpson, J. B. (1988). Simpson's Contemporary Quotations. Boston: Houghton Mifflin
Company.
Sperling, G., & Speelman, R. G. (1965). Visual spatial localization during object motion,
apparent object motion, and image motion produced by eye movements. Journal
of the Optical Society of America,, 55, 1576-1577.
Stroop, J. R. (1935). Studies of interference in serial verbal reactions. Journal of
Experimental Psychology, 18, 643-662.
Tanaka, J. W., & Farah, M. J. (1993). Parts and wholes in face recognition. Quarterly
Journal of Experimental Psychology: Human Experimental Psychology, 46, 225-
245.
Tipper, S. P. (1990). Selection of moving and static objects for the control of spatially
directed action. Journal of Experimental Psychology: Human Perception and
Performance, 16, 492-504.
Treisman, A. M. (1969). Strategies and Models of Selective Attention. Psychological
Review, 76, 282-299.
Watts, F. N., McKenna, F. P., Sharrock, R., & Trezise, L. (1986). Colour naming of
phobia-related words. British Journal of Psychology, 77, 97-108.
Wheeler, S. A. (2003). Measuring change blindness in specific phobia. Master's thesis,
Auburn University.
Williams, J. M. G., Watts, F. N., MacLeod, C., & Matthews, A. (1988). Cognitive
Psychology and Emotional Disorders. New York: Wiley.
Wolpe, J. & Lang, P. J. (1964). A fear survey schedule for use in behaviour therapy.
Behaviour Research and Therapy, 2, 27–30.
47

VI. APPENDIX A
Fear Survey Schedule II (FSS-II) Instructions: Below are 51 different stimuli that can cause fear in people. Please rate how much fear you feel using the following rating scale and record your answer in the space provided.
0 = None 1 = Very little fear 2 = A little fear 3 = Some fear
4 = Much fear 5 = Very much fear 6 = Terror
______1. Sharp objects ______27. Being with drunks ______2. Being a passenger in a car ______28. Illness or injury to loved ones ______3. Dead bodies ______29. Being self-conscious ______4. Suffocating ______30. Driving a car ______5. Failing a test ______31. Meeting authority ______6. Looking foolish ______32. Mental illness ______7. Being a passenger in an airplane ______33. Closed places ______8. Worms ______34. Boating ______9. Arguing with parents ______35. Spiders ______10. Rats and mice ______36. Thunderstorms ______11. Life after death ______37. Not being a success ______12. Hypodermic needles ______38. God ______13. Being criticized ______39. Snakes ______14. Meeting someone for the first
time ______40. Being with a member of the
opposite sex ______15. Roller coasters ______41. Cemeteries ______16. Being alone ______42. Speaking before a group ______17. Making mistakes ______43. Seeing a fight ______18. Being misunderstood ______44. Death of a loved one ______19. Death ______45. Dark places ______20. Being in a fight ______46. Strange dogs ______21. Crowded places ______47. Deep water ______22. Blood ______48. Stinging insects
48

______23. Heights ______49. Untimely or early death ______24. Being a leader ______50. Losing a job ______25. Swimming alone ______51. Automobile accident ______26. Illness
49

VII. APPENDIX B
Snake Questionnaire (SNAQ)
Instructions: Answer each of the following statements either True or False as you feel they generally apply to you. If the statement is true most of the time or mostly true for you, you would answer true. If it is mostly false or false most of the time, mark it false. Indicate your answer by placing a mark (X) in the appropriate column. TRUE FALSE ______ ______ 1. I avoid going to parks or on camping trips because there may
be snakes about. ______ ______ 2. I would feel some anxiety holding a toy snake in my hand. ______ ______ 3. If a picture of a snake appears on the screen during a motion
picture, I turn me head away. ______ ______ 4. I dislike looking at pictures of snakes in a magazine. ______ ______ 5. Although it may not be so, I think of snakes as slimy. ______ ______ 6. I enjoy watching snakes at the zoo. ______ ______ 7. I am terrified by the thought of touching a harmless snake. ______ ______ 8. If someone says that there are snakes anywhere about, I
become alert and on edge. ______ ______ 9. I would not go swimming at the beach if snakes had ever been
reported in the area. ______ ______ 10. I would feel uncomfortable wearing a snakeskin belt. ______ ______ 11. When I see a snake, I feel tense and restless. ______ ______ 12. I enjoy reading articles about snakes and other reptiles. ______ ______ 13. I feel sick when I see a snake. ______ ______ 14. Snakes are sometimes useful. ______ ______ 15. I shudder when I think of snakes. ______ ______ 16. I don’t mind being near a non-poisonous snake is there is
someone there in whom I have confidence. ______ ______ 17. Some snakes are very attractive to look at. ______ ______ 18. I don’t believe anyone could hold a snake without some fear. ______ ______ 19. The way snakes move is repulsive. ______ ______ 20. It wouldn’t bother me to touch a dead snake with a long stick. ______ ______ 21. If I came upon a snake in the woods I would probably run.
50

______ ______ 22. I’m more afraid of snakes than any other animal. ______ ______ 23. I would not want to travel “down south’ or in tropical
countries because of the greater prevalence of snakes. ______ ______ 24. I wouldn’t take a course in biology if I thought I might have to
dissect a snake. ______ ______ 25. I have no fear of non-poisonous snakes. ______ ______ 26. Not only am I afraid of snakes, but worms and most reptiles
make me feel anxious. ______ ______ 27. Snakes are very graceful animals. ______ ______ 28. I think that I’m no more afraid of snakes that the average
person. ______ ______ 29. I would prefer not to finish a story if something about snakes
was introduced into the plot. ______ ______ 30. Even if I was late for a very important appointment, the
thought of snakes would stop me from taking a shortcut through an open field.
51

VIII. APPENDIX C
INFORMED CONSENT
FOR
- Measuring Change Blindness in Specific Phobias- You are invited to participate in a research study of the role of attention in those who experience significant fear of snakes or spiders. This study is being conducted by Zofia Wilamowska, graduate student, under the supervision of F. Dudley McGlynn, Ph.D. We hope to learn if one’s attention is different when one is experiencing anxiety. You must be at least 19 years of age to participate. If you decided to participate, we will ask you to complete a questionnaire that takes about 10 minutes of your time. You will earn one (1) hour of extra credit for attempting to complete this form. Some who complete this form will then be asked to look at pictures on a computer screen that will display images that contain snakes or spiders. This will take about 45 minutes and an additional hour of extra credit will be provided after attempting to view the images displayed on the computer. Other participants, immediately after completing the first questionnaire, will be asked to complete a second questionnaire that takes approximately 5 more minutes. One hour of extra credit will be awarded for these questionnaires. Some of those who complete the second questionnaire will be invited to make an appointment to respond to s set of interview questions, which will take approximately 35 minutes. Another hour of extra credit will be provided for this group of participants. Some who decide to respond to interview questions will then be invited to view the computer images described above. An hour (1) of extra credit will be offered; this would be a total of three (3) hours at this stage, for those who are invited and decided to view the images. Again, viewing the images should take approximately 45 minutes. Some who are fearful of snakes or spiders might feel some discomfort when viewing the images displayed on the computer. There will not be presentation of any live snakes or spiders during the study. You may withdraw from participation at any time, without penalty, and you may withdraw any data that has been collected about yourself, as long as the data is identifiable. Your decision whether or not to participate will not jeopardize you future relations with Auburn University or the Psychology department. A benefit available to all those who participate is extra credit. One might be able to earn up to three (3) hours of extra credit; however, all who participate are guaranteed to receive one (1) hour of extra credit. This is a RESEARCH project and not a treatment for fear of snakes or spiders. Referral information will be available for those who wish to seek treatment for such a fear. The results of this study may lead to a new line of research in the area of phobias by offering a new method for laboratory assessment.
52

Any information obtained in connection with this study and that can be identified with you will remain confidential. Only the principal investigator (Zofia Wilamowska) and faculty supervisor (F.D. McGlynn) will have direct access to identifiable information. All questionnaires will be coed and not contain any identifying demographic information of the participants completing them. Data from the interview computer task will be secured in the same manner. All code lists will be destroyed once data collection has ended and is no longer needed. Information collected through your participation will be used to fulfill an educational requirement for a masters thesis, may be published in a professional journal, and/or presented at a professional meeting. If so, none of your identifiable information will be included. If you have any questions we invited you to ask them now. If you have any questions later, Zofia Wilamowska ([email protected], 334-844-4932) will be happy to answer them. You may also contact Dr. McGlynn, Ph.D. ([email protected], 334-844-6472) if needed. You will be provided with a copy of this form to keep. For more information regarding you rights as a research participant you may contact the Office of Human Subjects Research by phone or e-mail. The people to contact there are Executive Director E.N. “Chip” Burson ([email protected], 334-844-5966) or IRB chair Dr. Peter Grandjean ([email protected], 334-844-1462) HAVING READ THE INFORMATION PROVIDED, YOU MUST DECIDE WHETHER OR NOT YOU WISH TO PARTICIPATE IN THIS RESEARCH STUDY. YOUR SIGNATURE INDICATES YOUR WILLINGNESS TO PARTICIPATE. __________________________ ____________________________ Participant’s signature Date Investigator’s signature Date
53

IX. APPENDIX D
Flicker Task Instructions
You have been selected to participate in a portion of this study that will require the use of a computer. At this computer, I am going to show you several pairs of pictures. Each pair of pictures is going to be identical with the exception of one small detail. I want you to find what is different between each pair of pictures as quickly as you can. Once you have found the difference, click the left button on the mouse or press the space bar. After pressing either the space bar or the left mouse button, verbally indicate the change that you noticed. Do you have any questions thus far? We are going to do a practice trial. Remember to hit the left mouse button or the space bar as soon as you can see what small detail is changing between images. Don’t forget to verbally indicate the change that you noticed. Do you have any questions? The program will stop automatically when you have finished all of picture pairs. This part of the experiment will take approximately 45 minutes. I need to inform you that some of these pictures are going to show snakes or spiders in them. Remember your informed consent that you signed, which states that you are free to leave at any time, as you are a volunteering participant of this study. Please be assured that you are not in any danger of coming into contact with a real snake or spider, only pictures of them. Any questions?
54

X. APPENDIX E
Stimuli
1) Pictures of snakes where the change occurred in the central-interest region of the snake.
55
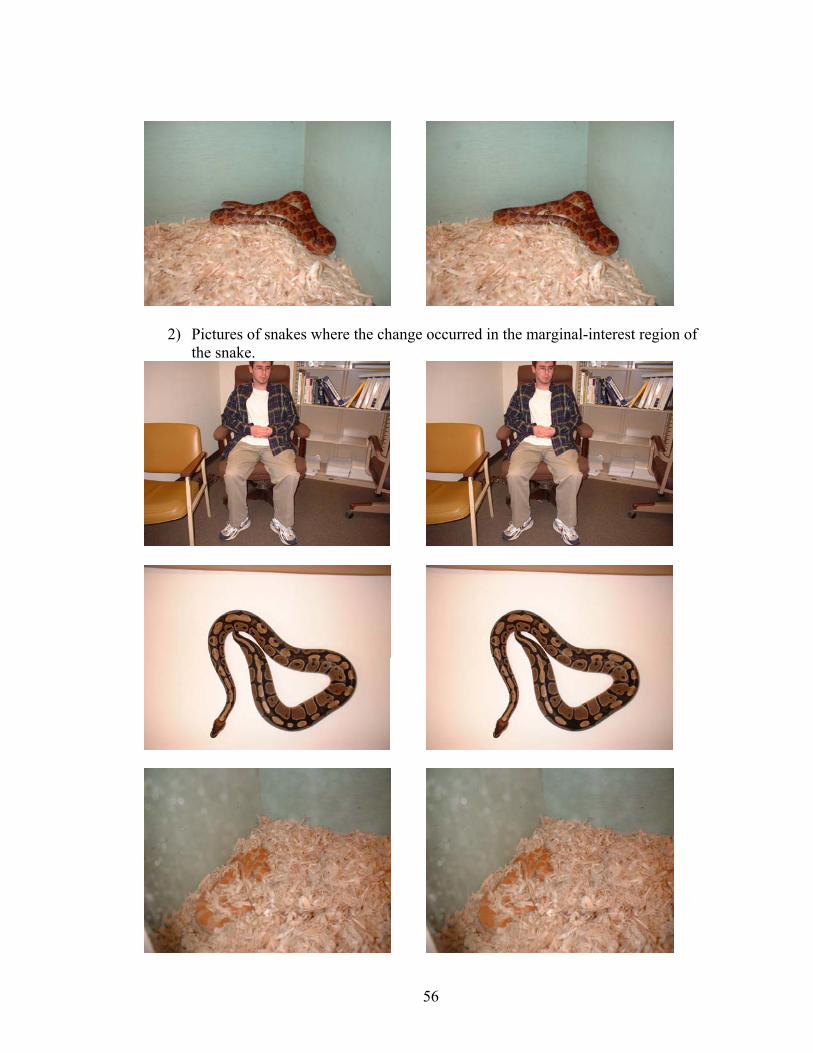
2) Pictures of snakes where the change occurred in the marginal-interest region of the snake.
56

3) Pictures of an office where the changes occurred in the central-interest region.
57

4) Pictures of an office where the changes occurred in the marginal-interest region.
58

59