Measuring Burden of Disease - an essential foundation to improve health Prof Debbie Bradshaw Dr Pam...
34
Measuring Burden of Disease - an essential foundation to improve health Prof Debbie Bradshaw Dr Pam Groenewald MRC Burden of Disease Research Unit David Bourne UCT Department of Public Health and Family Medicine
-
Upload
olivia-chandler -
Category
Documents
-
view
217 -
download
0
Transcript of Measuring Burden of Disease - an essential foundation to improve health Prof Debbie Bradshaw Dr Pam...

Measuring Burden of Disease - an essential foundation to improve health
Prof Debbie BradshawDr Pam GroenewaldMRC Burden of Disease
Research Unit
David BourneUCT Department of Public
Health and Family Medicine

Burden of Disease Methodology Global and national
What do we know about the burden of disease in the Western Cape? Estimates from the National Burden of Disease
Study for 2000 Trends in mortality using data from Statistics
South Africa and Home Affairs
Getting the basics right Local level mortality surveillance in Cape Town
and Boland/Overberg
Outline of presentation

Developed for the 1990 Global Burden of Disease Study by WHO and Harvard to confront data deficiencies in measuring population health to guide investment in health
Estimates levels of mortality and underlying causes of death – from multiple sources of information and derived consistent and coherent estimates using demographic techniques and statistical analysis
• Measures the fatal and non-fatal outcomes using Disability Adjusted Life Years (DALYS)
Burden of Disease Methodology

YLL – years of life lostYLD – years lived with disability
DALY = YLL + YLD
Explicit values: - age weights,- discounting, - severity weights,- expected life span

DALYs per 1000 population by region and cause, 2001
Source: Lopez et al, 2006

World Health Report 2002
Developing countries - low mortality
0% 2% 4% 6% 8%
Unsafe w ater, sanitation and hygiene
Iron deficiency
Indoor smoke from solid fuel
Low fruit and vegetable intake
Cholesterol
Overw eight
Underw eight
Tobacco
Blood pressure
Alcohol
Attributable DALYs (% of total 833 million)Source: WHO World Health Report 2002

Burden of disease estimates for South Africa?
• SA National Burden of Disease Study, 2000– Made use of the ASSA2000 model to estimate the
total number of deaths and the number due to AIDS, 1996 cause of death data for the non-AIDS causes, NIMSS injury data
– Mainly focused on mortality and premature mortality– Derived provincial and national estimates
• SA Comparative Risk Assessment, 2000– Revised the burden of disease estimates using
ASSA2002 and estimated DALYs for single causes– Made use of the WHO CRA methods and estimates
applied to South African data on prevalence of 17 selected risk factors

Age-standardised mortality rates by province, 2000
Source: Bradshaw et al, 2005
0
200
400
600
800
1000
1200
1400
1600
1800
2000
Eas
tern
Cap
e
Fre
e S
tate
Gau
teng
Kw
aZul
u-N
atal
Lim
popo
Mpu
mal
anga
Nor
th W
est
Nor
ther
n C
ape
Wes
tern
Cap
e
Sou
th A
fric
a
Dea
ths
per
100
000
HIV/AIDS Other Communicable/mat/peri/nutrition Non-communicable Injuries

Western Cape 2000 (YLLs)
14.1
12.97.9
6.95.9
4.62.7
2.42.3
2.32.12.1
1.8
1.71.5
1.21.1
1.11.01.0
HIV/AIDS Homicide/violence
TuberculosisRoad traffic accidents
Ischaemic heart diseaseStroke
Trachea/bronchi/lung caLower respiratory infections
SuicideDiarrhoeal diseases
Diabetes mellitusCOPD
FiresLow birth weight
SepticaemiaHypertensive heart disease
Breast caNephritis/nephrosis
AsthmaEpilepsy
Source: Bradshaw et al, 2005

South Africa, 2000
Attributable DALYs (% of 16.2 million)
31.5%
8.5%
7.0%
4.0%
2.9%
2.7%
2.6%
2.4%
1.6%
1.4%
1.1%
1.1%
1.1%
0.7%
0.4%
0.4%
0.3%
Unsafe sex/STIs
Interpersonal violence
Alcohol harm
Tobacco
High BMI
Childhood and Maternal underweight
Unsafe water sanitation and hygiene
High blood pressure
Diabetes
High cholesterol
Low fruit and vegetable intake
Physical inactivity
Iron deficiency anaemia
Vitamin A deficiency
Indoor smoke
Lead exposure
Urban air pollution
South Africa, 2000
Source: Norman et al, 2007

Part 2
• Changing pattern of Mortality 2000 -2006

Female deaths 1998 - 2006Females
0
5,000
10,000
15,000
20,000
25,000
30,000
35,000
0
1-4
5-9
10-1
4
15-1
9
20-2
4
25-2
9
30-3
4
35-3
9
40-4
4
45-4
9
50-5
4
55-5
9
60-6
4
65-6
9
70-7
4
75-7
9
80-8
4
85-8
9
90-9
4
95+
1998
1999
2000
2001
2002
2003
2004
2005
2006
Source: Laubscher , Bradshaw, Bourne and Dorrington, 2007

Natural causes female deaths 2000-06
Western Cape
Western Cape
0
200
400
600
800
1000
1200
1400
1600
1800
200015-1
9
20-2
4
25-2
9
30-3
4
35-3
9
40-4
4
45-4
9
50-5
4
55-5
9
60-6
4
65-6
9
70-7
4
75-7
9
80-8
4
85-8
9
90-9
4
95+
Age group
Death
s
2000
2001
2002
2003
2004
2005
2006
KwaZulu-Natal
KwaZulu-Natal
0
1000
2000
3000
4000
5000
6000
7000
8000
9000
15-1
9
20-2
4
25-2
9
30-3
4
35-3
9
40-4
4
45-4
9
50-5
4
55-5
9
60-6
4
65-6
9
70-7
4
75-7
9
80-8
4
85-8
9
90-9
4
95+
Age group
Death
s
2000
2001
2002
2003
2004
2005
2006
Source: Laubscher et al, 2007

Population standardised rates (25-49) relative to 2000 National
Males
Females
Males
0.0
0.5
1.0
1.5
2.0
2.5
3.0
2000 2001 2002 2003 2004 2005 2006
Western Cape
Eastern Cape
Northern Cape
Free State
KwaZulu-Natal
North West
Gauteng
Mpumalanga
Limpopo
Females
0.0
0.5
1.0
1.5
2.0
2.5
3.0
2000 2001 2002 2003 2004 2005 2006
Western Cape
Eastern Cape
Northern Cape
Free State
KwaZulu-Natal
North West
Gauteng
Mpumalanga
Limpopo
Source: Laubscher et al, 2007

Mortality under age 5, 1997 to 2002 [unpublished StatsSA special tabulation]
StataSA unpublished data
0
2000
4000
6000
8000
10000
12000
14000
00 04 08 12 16 20 24 28 32 36 40 44 48 52 56 60
age in months
nu
mb
er
of
dea
ths
by
mo
nth
2002
2001
2000
1999
1998
1997

20
04
00
60
08
00
10
00
12
00
2-3
mo
nth
pe
ak
15 20 25AIDS associated (Excluding perinatal) ASSA Antenatal HIV prevalence 1997-2002
AIDS_p Fitted values
Correlation with Antenatal HIV prevalence
AIDS associated/NonAIDS associated diseases
AIDS associated
NonAIDS associated
StataSA unpublished data
-40
-20
020
4060
2-3
mon
th p
eak
15 20 25NonAIDS associated (natural) ASSA Antenatal HIV prevalence 1997-2002
NonAIDSn Fitted values
at age 2 -3 months
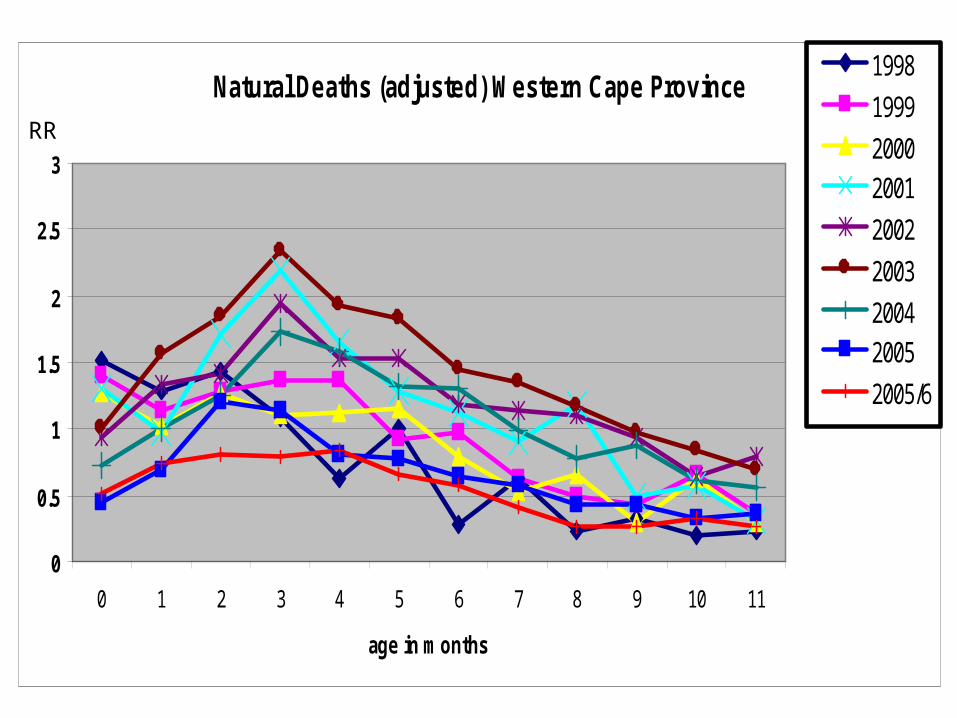
Natural Deaths (adjusted) Western Cape Province
0
0.5
1
1.5
2
2.5
3
0 1 2 3 4 5 6 7 8 9 10 11
age in months
1998
1999
20002001
2002
2003
20042005
2005/6
RR

Natural Deaths (adjusted) Mpumalanga
0
5
10
15
20
0 1 2 3 4 5 6 7 8 9 10 11
age in months
1998
1999
2000
2001
2002
2003
2004
2005
2005/6
RR

Doctor
Health Facility
Headman
Mortuary
MagistrateInquest for unnatural
causes
Abridged death
certificateBurial order
Full death certificate
Forms to be checked and
archived
National Home Affairs
Office(Population
Register)
Regional Home Affairs
Office
Electronic records transferred
Forms transferred
Statistics South Africa
Medical Research Council Rapid Mortality surveillance
Cape Town City Boland/Overberg
Copies of forms
UNISA/MRC Non-natural Injury Surveillance System
(NIMSS)
NIMSS collection at sentinel sites
Cause of death
statistics

Part 3
• Local area mortality – getting the basics right

Local level mortality surveillance in Cape Town
• Cape Town has a well established system for compiling death statistics which utilises the national vital registration system administered by Dept of Home Affairs
• Health section of local municipalities obtain copies of death certificates from regional Home Affairs offices
• Information on the manner of death for unnatural deaths is obtained directly from the mortuaries
• Since 2000, trained clerks code the underlying cause of death using a shortlist based upon ICD 10, developed with the MRC, and capture this information

Local level mortality surveillance in
Boland Overberg
• Since 2004, the Boland Overberg region has implemented a similar system
• Initially started at the Worcester and Caledon Home Affairs offices with the assistance of the BCG project
• Since 2006 the Paarl office has also been included

What information does this system provide?
For the first time we have a cause of death profile for the Cape Town metro, BO region and for each health sub-district
– Ranking of leading causes of premature death
– Highlighting inequities in health between sub-districts
– Showing changes in death rates for certain conditions over time

Mortality profile, 2004Boland Overberg, 2004
N = 4230
Inf/para16%
Other Group12%
HIV/AIDS6%
Malignant neoplasms13%
Diabetes mellitus4%
Cardiovascular disease18%
Respiratory disease5%
Cot death0%
Other Group 26%
Unintentional injuries9%
Intentional injuries8%
Injuries undetermined whether intent or unintent
0%
Ill defined natural13%
Cape Town, 2003N = 24068
Inf/para11%
Other Group12%
HIV/AIDS10%
Malignant neoplasms15%
Diabetes mellitus5%
Cardiovascular disease22%
Respiratory disease5%
Other Group 27%
Unintentional injuries6%
Intentional injuries9%
Injuries undetermined whether intent or unintent
1%
Ill defined natural7%
Boland Overberg, 2004N = 4230
Inf/para16%
Other Group12%
HIV/AIDS6%
Malignant neoplasms13%
Diabetes mellitus4%
Cardiovascular disease18%
Respiratory disease5%
Cot death0%
Other Group 26%
Unintentional injuries9%
Intentional injuries8%
Injuries undetermined whether intent or unintent
0%
Ill defined natural13%
Cape Town, 2003N = 24068
Inf/para11%
Other Group12%
HIV/AIDS10%
Malignant neoplasms15%
Diabetes mellitus5%
Cardiovascular disease22%
Respiratory disease5%
Other Group 27%
Unintentional injuries6%
Intentional injuries9%
Injuries undetermined whether intent or unintent
1%
Ill defined natural7%

Leading causes of premature mortality,
Cape Town 2004

Premature mortality rates by cause group and HIV for sub-districts, Cape
Town 2004
2004
0
5000
10000
15000
20000
25000
YL
Ls
per
100
000
III. Injuries 2266 2168 2187 3899 4954 2251 5663 3110 1743 2685 2020
II. Non-communicable diseases 7651 4061 4274 5293 7636 7417 6897 5720 4875 5918 5983
HIV/AIDS 664 1036 1540 2018 5064 973 5571 1913 824 1968 496
Comm excl HIV, mat, peri, nut 1559 1466 1738 3330 5451 1812 4427 2515 1454 2726 1843
Athlone Blaauw Central Helder Khay M Plain Nyanga Oos SPD Tyg Eas Tyg Wes
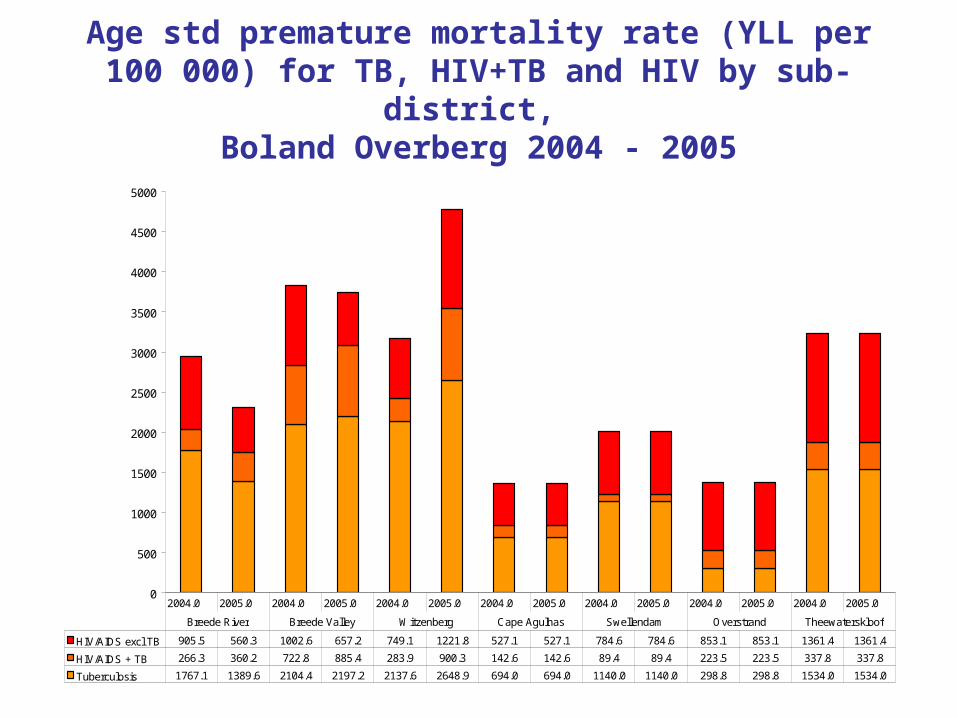
Age std premature mortality rate (YLL per 100 000) for TB, HIV+TB and HIV by sub-district,
Boland Overberg 2004 - 2005
0
500
1000
1500
2000
2500
3000
3500
4000
4500
5000
HIV/AIDS excl TB 905.5 560.3 1002.6 657.2 749.1 1221.8 527.1 527.1 784.6 784.6 853.1 853.1 1361.4 1361.4
HIV/AIDS + TB 266.3 360.2 722.8 885.4 283.9 900.3 142.6 142.6 89.4 89.4 223.5 223.5 337.8 337.8
Tuberculosis 1767.1 1389.6 2104.4 2197.2 2137.6 2648.9 694.0 694.0 1140.0 1140.0 298.8 298.8 1534.0 1534.0
2004.0 2005.0 2004.0 2005.0 2004.0 2005.0 2004.0 2005.0 2004.0 2005.0 2004.0 2005.0 2004.0 2005.0
Breede River Breede Valley Witzenberg Cape Agulhas Swellendam Overstrand Theewaterskloof

Trends in age-specific HIV/AIDS rates, Cape Town
2001 - 2004
Age specific HIV death rates in males, Cape Town
0
50
100
150
200
0-4 5-14 15-24 25-34 35-44 45-54 55-64 65-74 75+
2001 2002 2003 2004
Age specific HIV death rates in females, Cape Town
0.0
50.0
100.0
150.0
200.0
250.0
0-4 5-14 15-24 25-34 35-44 45-54 55-64 65-74 75+
2001 2002 2003 2004

Trends in age-specific homicide rates, Cape Town
2001 - 2004
Males
0
50
100
150
200
250
300
350
Dea
ths
per
100
000
2001 8 10 264 279 186 103 54 19 56
2002 7 7 311 270 173 95 75 41 91
2003 4 7 256 206 132 95 49 41 29
2004 3 5 196 176 115 79 38 16 46
0-4 5 to 14 15 to 24 25 to 34 35 to 44 45 to 54 55 to 64 65 to 74 75+

Age standardised homicide death rates (ave) by sub-district, Cape Town 2001 – 2004
Homicide
31
1520
14
59
32
71
20 17 16 21
21
20
22
55
69
24
62
51
1729 23
0
20
40
60
80
100
120
140
Athlone Blaauw Central Helder Khay M Plain Nyanga Oos SPD Tyg East Tyg Wes
Dea
ths
per
100
000
Homicide with firearm Homicide without firearm

Causes of mortality in infants 1 – 11 months, Boland Overberg 2004
Boland Overberg: 1 - 11 monthsN = 368
19.6
16.0
14.7
11.1
9.0
5.4
4.9
3.0
3.0
2.4
1.9
1.1
1.1
0.8
0.5
0.5
0 5 10 15 20 25
Diarrhoeal Diseases
Ill defined natural
Lower Respiratory infections
HIV/AIDS
Other unintentional injuries specified
Cot death/Sudden infant death syndrome
Short gestation and Low birth weight
Protein-energy malnutrition
Congenital abnormalities
Septicaemia
Bacterial Meningitis and meningococcaemia
RDS
Other respiratory
Road traffic
Other Infectious and parasitic diseases
Neonatal infections
Percent

Conclusions• Cape Town and the BOR are facing a quadruple burden of
disease: – pre-transitional diseases and poverty related conditions– emerging chronic diseases– an extremely high burden of injuries – HIV/AIDS epidemic.
• Efforts are being made to combat some of the top causes of death but these need to be expanded and strengthened– PMTCT and ARV rollout appears to have slowed down
mortality due to HIV/AIDS. – Multisectoral strategies are required to address the burden of
injuries. It is not clear what role the SAPS POSS strategy played in decrease in homicide in Cape Town; needs further investigation.
– Multisectoral approaches are needed to address the burden of other conditions: TB – housing, food security; diarrhoea – water and sanitation; NCDs – transport, safety, education etc.
• Inequities in health remain a challenge not just for poverty related conditions and injuries but also for non communicable diseases.

Institutionalising local level mortality surveillance
Developing the system – Extending to automated ICD-10 coding– Electronic mortuary surveillance– Tools for quality control– Tools for analysis– Training for death certification
Roll out surveillance to other regions in the province

Acknowledgements
• City of Cape Town • Boland Overberg• Dept Home Affairs• BCG project• Mortuaries• CARe, UCT• MRC BOD and Biostatistics Units