NEPALI IN SIKKIM Nepali is one of the 22 Scheduled languages of ...
International Journal of Economics and Financial Issues Vol. 3, No. 1, 2013, pp.54-65 ISSN: 2146-4138 www.econjournals.com
54
Measuring Bank Performance of Nepali Banks:
A Data Envelopment Analysis (DEA) Perspective
Karan S. Thagunna Kathmandu University, School of Management (KUSOM), Nepal.
Email: [email protected]
Shashank Poudel Kathmandu University, School of Management (KUSOM), Nepal.
Email: [email protected] ABSTRACT: The aim of this study is to develop a performance model for measuring relative efficiency and potential improvement capabilities of Nepali banks by scrutinizing intermediation aspects. For measuring the efficiency and performance, this paper uses a relatively new frontier approach known as Data Envelopment Analysis (DEA). The paper uses two basic DEA models to fulfill its objectives. This paper seeks to measure and analyze the efficiency levels of banks in Nepal during 2007-08 to 2010-11. The study reveals that efficiency level is relatively stable and has increased on overall. Additionally, it also breaks down the overall efficiency of banks into technical and scale efficiency. This study found no significant relationship with efficiency level and ownership structure of banks and there were no notable differences in the efficiency levels of banks according to their asset size. Keywords: Nepal, Data Envelopment Analysis, Bank Performance, Efficiency, Technical Efficiency, Scale Efficiency JEL Classifications: C51; C61; G21 1. Introduction
History of modern commercial banking industry in Nepal begins from 1937, when Nepal Bank Limited was incorporated. However, it wasn't until 1984 when the then HMG/Nepal started to liberalize the banking sector in the country. Private sectors rushed into the finance industries especially after the restoration of democracy in 1990 (Baral, 2005).
NRB's major changes in policy measures including interest rate deregulation, indirect methods of monetary control and use of open market operations as the main policy tool, abolishment of the statutory provision of liquidity ratio, market based foreign exchange system, flexible licensing policy, and prudential legal framework has led to significant changes in the Nepali Banking Industry in the past three decades; these changes resulted into entry of foreign joint-venture banks and domestic private banks into the market and widened the scale and scope of activities undertaken by the banks (Gajurel & Pradhan, 2010).
The effects of such changes into the bank’s efficient operation are becoming an important issue in this sphere. But assessment and analysis of previous literature shows the lack of appropriate analysis for these issues. The analyses lacked the use of non-parametric frontier approaches in the banking system. Therefore, the need of more sophisticated performance evaluation to understand the functioning of banks and their performance in the whole system is ever increasing.
Currently, financial ratios are often used to measure the overall financial soundness of a bank and the quality of its management. Bank regulators, NRB, for example, use financial ratios to help evaluate a bank’s performance as part of the CAMEL system. Evaluating the economic performance of banks, however, is a complicated process. A number of variables such as profits, liquidity, asset quality, attitude toward risk, and management strategies must be accounted for. The changing nature of the banking industry has made such evaluations even more difficult, increasing the need for more flexible alternative forms of financial analysis (Yue, 1992).
This paper uses a non-parametric frontier approach, Data Envelopment Analysis (DEA) in fulfilling the following objective of this research paper.

Measuring Bank Performance of Nepali Banks: A Data Envelopment Analysis (DEA) Perspective
55
The prime objective of this paper is to understand the extent of divergence of efficiency of the banks in Nepal and to determine the factor of their efficiency and inefficiency. To fulfill this prime objective, this research aims to capture the following sub-objectives:
i. Assess the structure and overall performance of the Nepali banking sector ii. Determine the efficiency levels according the predetermined DEA method iii. Investigate whether the ownership structure and size of a bank affect its
efficiency
2. Literature Review The technique for measuring performance changes can classify into two broad categories
(Laeven, 1999): the earliest technique of using aggregate ratios related to revenue, cost, assets and liabilities and the relatively young frontier technique of efficiency analysis.
Recent researches on the subject show the use of both the parametric and non-parametric approaches on the study of performance analysis. The non-parametric approach of the Data Envelopment Analysis (DEA) is becoming an increasingly popular tool. DEA is based on the concept efficiency that is used in engineering and natural sciences (Yue, 1992). In recent times, "efficiency" is also being used popularly in financial institutions.
Frontier based efficiency was first introduced in the work of Farrell (1957) who proposed a model that can be applied from a sector to an entire economy. It was Charnes, Cooper, & Rhodes (1978) applied the technique of Farrell as DEA. The CCR model (from Charnes, Cooper and Rhodes) assumes the frontier to have a Constant Returns to Scale (CRS). This model was edified to include Variable Returns to Scale (VRS) by Banker, Charnes, & Cooper (1984) and it is known as the BCC model.
Since then, the BCC model has been extensively used in regulated sector, including hospitals (Banker, Conrad, & Strauss, 1986) and non-profit sector (Lewin, Morey, & Cook, 1982). Berger & Humphrey (1997) surveyed 130 research studies that had used frontiers analysis in 21 nations. They compared the results for four types of financial institutions: banks, credit unions, insurance firms and savings & loans. The use of DEA in the field of banks and financial institutions can be attributed to the work of Sherman & Gold (1985) where they used DEA to explore the efficiency in operation of bank branches.
The DEA frontier has been rapidly used in banking sector for efficiency analysis. Ferrier & Lovell (1990) concluded that commercials banks in the U.S.A increased their efficiency in the 1980's. Similarly, Yue (1992) used window analysis of 60 Missouri Commecial Banks for the period of 1984 to 1990 to analyse the efficiency of each bank and window individually.
The use of DEA for developing economies are a lot lesser than for advanced economies (Nigmonov, 2010). The DEA model for the developing countries has been applied at first by (Bhattacharyya, Lovell, & Sahay, 1997). They analyzed the efficiency of Indian banks using DEA. Mertensa & Urga (2001) analyzed 79 Ukrainian banks and explored the causes of their inefficiency. But, one of the ground-breaking papers among the developing countries is probably the IMF Working Paper by Grigorian & Manole (2002) which explored the efficiencies of 17 countries in transition. In addition, they used a regression model to investigate the affect of different independent variables such as market share, bank capitalization, foreign ownership, government regulation, etc on the efficiency of a bank.
Eken & Kale (2011) analyzed Turkish bank branches and analyzed them under their production and profitability aspects. They concluded that too small and too large branches needed special attention. Muhammad (2008) measured the efficiency of Nigerian Banks over the period of five years using DEA and Malmquist Productivity Index (MPI). Nigmonov (2010) thoroughly scrutunized the banking sector of Uzbekistan for the period 2000-2006; the results showed that the overall efficiency of the banks had decreased during the period. The paper also compared the relative performance between the private, joint-stock and foreign banks for which no significance divergence was found.
The use of DEA for efficiency analysis and performance evaluation in Nepali banking sector couldn’t be found while preparing this paper. Thus, this is the first paper seeking to analyze the inefficiency and their causes for Nepali banks.

International Journal of Economics and Financial Issues, Vol. 3, No. 1, 2013, pp.54-65
56
3. Methodology 3.1 Research Approach
This research is an applied research. There are supported and verified papers along with an accepted framework regarding the subject matter of DEA. This paper, thus, uses the deductive approach to fulfill its objectives. Furthermore, this research also aims towards in explaing the causal relationship between different variables such as equity size and ownership status on banking efficiency using regression analysis. The objective itself, as stated in the introduction section of this paper, forms the basis for the hypothesis and the model for DEA. The collected data is then analyzed in accordance with the hypothesis and the model. Our analysis is also complicated by differing theories with regards to the subject matter itself and its model. The quality of our results will, therefore, largely depend on the efficiency of DEA model which is applicable for the research objective. 3.2 The Choice of the DEA Model
Extensive literature review has helped in determining the DEA model as an appropriate tool for efficiency evaluation and performance analysis. The DEA model was chosen by evaluating its advantages; some of which can be analyed as follows: It doesn’t need a certain parameter of inputs and outputs, so it can handle multiple inputs and multiple inputs at a time; it is non-parametric. It can break down efficiency into scale efficiency and technical efficiency. A functional form is unnecessary relating to inputs and outputs and the inputs and outputs can vary their units. It performs a relativity check against an actual benchmark, which makes it practical and therby achievable. Despite of these advantages, it does have certain limitations. It cannot account for a random noise or error. Hypothesis tests are difficult because it is a non-parametric method. 3.3 Explanation of the Model
DEA is basically concerned with the efficiency of an individual unit, defined as a Decision Making Unit (DMU) by Charnes, Cooper, & Rhodes (1978). Each DMU (in our case Nepali banks) deals with issues related with converting inputs into outputs that can occur through operational and strategic decisions.
DEA is based on the concept of engineering efficiency (Yue, 1992), where efficiency is considered to be as:
Efficiency(θ) =
A DMU can be said to be relatively efficient to another if it can produce same level of output with fewer inputs or can produce more output with same or lesser inputs.The efficiency score lies between 0 to 1 and the DMU with the maximum efficiency score of 1 is known as an efficient DMU.
In order to explain this model, we follow the model used by Nigmonov (2010). When we consider s number of DMUs using measurable positive inputs for transforming them into a particular types of measurable positive outputs, then the input data and output data can be represented in form of matrices X and Y with dimensions of M × S and N × S respectively. The matrix representation of X and Y is as follows:
X =
MSMMM
S
S
xxxx
xxxxxxxx
......
.
.
.
.
.
.
.
.
.......
321
2232221
1131211
(1)

Measuring Bank Performance of Nepali Banks: A Data Envelopment Analysis (DEA) Perspective
57
Y =
NSNNN
S
S
yyyy
yyyyyyyy
......
.
.
.
.
.
.
.
.
.......
321
2232221
1131211
(2)
Here, xij refers to the ith input of DMU j and yij refers to the ith output of DMU j. The mathematical representation of the model used by Charnes, Cooper and Rhodes (1978), also named as the CCR model can be represented as follows:
Max imize θ = mom2o21o1
non2o21o1
y+...+x+xy+...+y+y
(3)
Subject to
1......
2211
2211
MsMss
NsNss
xxxyyy
, (s = 1,…,S)
σ1, σ2, …, σM ≥ 0 µ1, µ2, …, µN ≥ 0 (4) Given the data X and Y in (1) and (2), the CCR model measures the maximum efficiency of
each DMU by solving the fractional programming problem in (3) where input weights σ1, σ2, …, σM and output weights µ1, µ2, …, µN are the variables to be constrained. o in (3) varies from 1 to S which means S optimizations for all S DMUs. Constraints (4) reveals that the ratio of ‘virtual output’ ( NoN2o21o1 y+...+y+y ) to ‘virtual input’ ( MoM2o21o1 y+...+x+x ) cannot exceed 1 for each DMU, which confirms to the economic assumption that the output cannot be more than the input in production (Nigmonov, 2010).
This model can also be explained with the help of Linear Programming model. Linear Programming Model doesn’t deal with fractional problems; therefore, we’ll maximize the total output and assume total input as one. So, the Linear Program for DMU s, s = 1… S
Maximize Es =
N
jjjsO
1
Subject to:
11
M
iiisI
N
jjjmO
1 -
M
iiimI
1 ≤ 0 for m = 1,…,S
µj ≥ 0 for j = 1,…,N σi ≥ 0 for I = 1,…,M Ojs and Iis ≥ 0
This model can also be analyzed figuratively. For simplicity we’ll use a one input, two output case with three DMUs.
The line segment connecting banks A and C in Figure-1 and table 1shows the possibilities of virtual outputs that can be formed from these two banks. Since the segment AC lies beyond the segments AB and BC, this means that a convex combination of A and C will create the most outputs for a given set of inputs. This is also called the efficiency frontier. This is the frontier defining the maximum combination of outputs that can be produced for a given set of inputs. Therefore, the DMUs A and C are efficient because they lie on the efficiency frontier whereas DMU B is inefficient because it lies below the frontier.
A and C are the efficient DMUs with which the inefficient DMU B is compared. Therefore, A and C are also the benchmarks of this DMU. The efficiency of DMU B can be measured by using

International Journal of Economics and Financial Issues, Vol. 3, No. 1, 2013, pp.54-65
58
lever law. In this case, the efficiency of DMU B can be obtained by dividing length of OB by the length of OV, i.e. OB/OV.
3.4 Choice of Input-Output variables for the Model
Several literatures such as of Eken & Kale (2011) conclude that there are mainly three types of bank performance approach namely “production approach”, “intermediation approach” and “profitability approach”. The first approach treats banks as institutions using capital and labor for production for various kinds of banking services. This production approach is mainly applicable for a local branch or for branch performance evaluation (Frexias & Rochet, 1997). This belief of Frexias and Rochet is also reflected in the work of Eken & Kale (2011) who analyzed 39 articles, published after 2000, containing 49 studies/approaches, related to DEA for branch performance. They found that 33 out of 49 studies used production approach.
The second type of approach, the intermediation approach, takes a main branch or the entire bank as an intermediatory for “transferring” money borrowed from depositors into the money lent to borrowers (Frexias & Rochet, 1997). A third kind of approach, the profitability approach, which is a relatively newer approach, is also being started to use. The inputs of production and profitability approach are kind of similar but the outputs of profitability approach are, as the name suggests, more profit oriented; such as interest income and non-interest income.
Generally speaking, inputs are those which are desirable to be minimal and outputs are those which are desired to be maxmized. In DEA model, we can use both input orientation and output orientation to solve the problem. In input oriented model, the inputs are minimized whereas in the output oriented model, the outputs are maximized.
Nepali banking sector is often criticized for having too many banks for a small economy, with a visible gap among the banks in terms of assets size. And, therefore the option of merger has been introduced by the NRB to reduce the number of banks and make the merged banks stronger than they were individually. The huge gap in the size of the banks calls for the necessity of merger immediately. The size of the banks can give some indications on which banks should be merged and how can a strong bank be formed. The merger could be successful, if many banks of equal size be merged and
Table-1
Figure-1

Measuring Bank Performance of Nepali Banks: A Data Envelopment Analysis (DEA) Perspective
59
made a competitive one (Chalise, Private banks increase asset size, 2011). As a result, the intermediation approach is used keeping in mind the banking industry of Nepal and the supporting literatures encouraging us to use this approach. Therefore, we have selected the following inputs and outputs shown in the Table 2.
Inputs Outputs Input 1(σ1): Total Deposits Output 1(µ1) : Total Loans, i.e. Loans, Advances
and Bills Purchase Input 2 (σ2): Interest Expense Output 2 (µ2): Interest Income Input 3 (σ3): Operating non-interest expense Output 3 (µ3): Operating non-interest income
It is often debated whether “deposits” is an input or an output. Some researchers argue that
treating deposits as inputs makes banks that depend on purchased money look artificially efficient (Berg, Forsund, & Jansen, 1990).
The inputs and outputs have been taken from Income Statement and Balance Sheet of the companies. The 1st and 2nd input and output are directly taken from the financial statements, whereas the 3rd input has been derived by subtracting “Operating Profit before provision for possible losses” from “Total Operating Income”. Similarly, the 3rd output is obtained by subtracting “Net Interest Income” from “Total Operating Income”.
However, informal interviews with banks’ representatives made us conclude that despite the fact that a bank would like to have higher number of deposits, it is more desirable to have greater good loans lent from lesser deposit. The DEA model is solved with the help of the sofware MaxDEA Pro 5.0. 3.5 Sampling and Data
Many literatures suggest the use of homegenity conditions for DMUs in a model (Yeh, 1996) and encourage the use of DEA for firms with similar resources and operations providing similar products and services (Oral & Yololan, 1992). Therefore, we decided to exclude Rastriya Banijya Bank (RBB), the largest bank in Nepal interms of assets size and also Agriculture Development Bank (ADB) which has the largest shareholders’ equity and is able to finance loans greater than its deposits. Their inclusion would distort our findings and make it difficult to compare results with other DMUs. We also excluded Nepal Bank Limited (NBL) from our analysis because having only one government bank would be unreasonable to compare the efficiency based on ownership. Similarly, banks that started its operations after 2007-08 are also not included because of the lack of comprehensive data. 3.6 Limitations
This research mainly uses secondary data. All the data are extracted from the respective official websites of the bank. Banks with missing annual report in their website for year are not included for analysis for that year. The lack of primary data, which would have enriched our analysis, is missing. Thus, our analysis isn’t as complete as we would have hoped it to be. The data has been obtained from the annual reports of respective banks. These annual reports were extracted from the official website of concerned banks. Banks whose annual reports were lacking from the official website for a certain year are not included for analysis in that year. The researchers would also like to comment that the research was complicated by the lack of relevant literature on Nepali banking sector and was also complicated by the lack of data for certain banks. 4. Results
We firstly employed the output oriented CCR model, which doesn’t account for scale effeciencies. The results of this model can be observed in Table 3.
The banks with efficiency score of less than 1 are not producing the same level of output as the banks with efficiecny score of 1 with the same level of of input. It means that banks with score lower than 1 have the potential to increase their output. In the table above, we can see that, for the year 2010-11, SBI Bank has an efficiency score of 0.78; it implies that SBI can increase its outputs by 22% (1-0.78), with the same level of inputs it currently has. The table also illustrates that the average effeciency score is relatively stable in the past four years, decreasing slightly in 2009-10 and again increasing in 2010-11.
Table 2. Inputs and Outputs

International Journal of Economics and Financial Issues, Vol. 3, No. 1, 2013, pp.54-65
60
Also, in 2010-11, 9 out of 21 banks are fully efficient and 7 banks out of 24 have an average
efficiency of 1, meaning they are consistently producing relatively more outputs with relatively less outputs. It appears that SBI Bank has been the least efficient in the year 2010-11 and also on average of the past four years.
DEA analysis is more useful when analyzing in depth about an individual bank because the bank can get a better idea about what can be done to make the bank more efficient.
The efficiency of SBI bank is declining (Figure 2); it should look for its causes to mitigate it.
Details of SBI for 2010-11 Efficiency 0.783
DMU Number DMU Name
Efficiency Scores Mean Score 2007-08 2008-09 2009-10 2010-11
1 Bank Of Asia, Nepal 0.864 0.984 0.992 0.941 0.945
2 Laxmi Bank Limited 1 1 0.940 0.943 0.971
3 Lumbini Bank Limited 0.970292 1 1 1 0.993
4 Machhapuchhre Bank Limited 0.905 0.961 0.872 - 0.913
5 Nabil Bank Limited 1 1 1 1 1
6 Nepal Bangladesh Bank Limited 1 1 1 - 1
7 Nepal Credit and Commerce Bank Limited 0.919 0.918 0.893
- 0.910
8 Nepal Investment Bank 0.983 1 1 1 0.996
9 NIC Bank Limited 1 1 1 1 1
10 NMB Bank Limited 1 0.914 0.961 0.99 0.968
11 Prime Commercial Bank Limited 1 0.911 1 1 0.978
12 Bank of Kathmandu 1 1 1 1 1
13 Sanima Bank Limited 0.885 0.950 0.974 1 0.952
14 SBI Bank Limited 0.979 0.840 0.793 0.783 0.849
15 Siddhartha Bank Limited 0.992 0.987 0.9320 0.925 0.959
16 Standard Chartered Bank 1 1 1 1 1
17 Citizens Bank Limited 0.851 0.886 0.915 0.980 0.908
18 Everest Bank Limited 0.988 1 1 0.990 0.995
19 Global Bank Limited 0.779 0.935 0.905 0.917 0.884
20 Grand Bank Limited 1 1 1 0.979 0.995
21 Himalayan Bank Limited 0.580 1 0.955 0.957 0.865
22 Kumari Bank Limited 0.906 0.988 0.967 0.902 0.941
23 Kist Bank Limited 0.934 0.935 0.869 1 0.934
24 Sunrise Bank Limited - 0.794 0.907 0.962 0.888
Mean Score 0.936 0.959 0.953 0.964
Table 3
Measuring Bank Performance of Nepali Banks: A Data Envelopment Analysis (DEA) Perspective
61
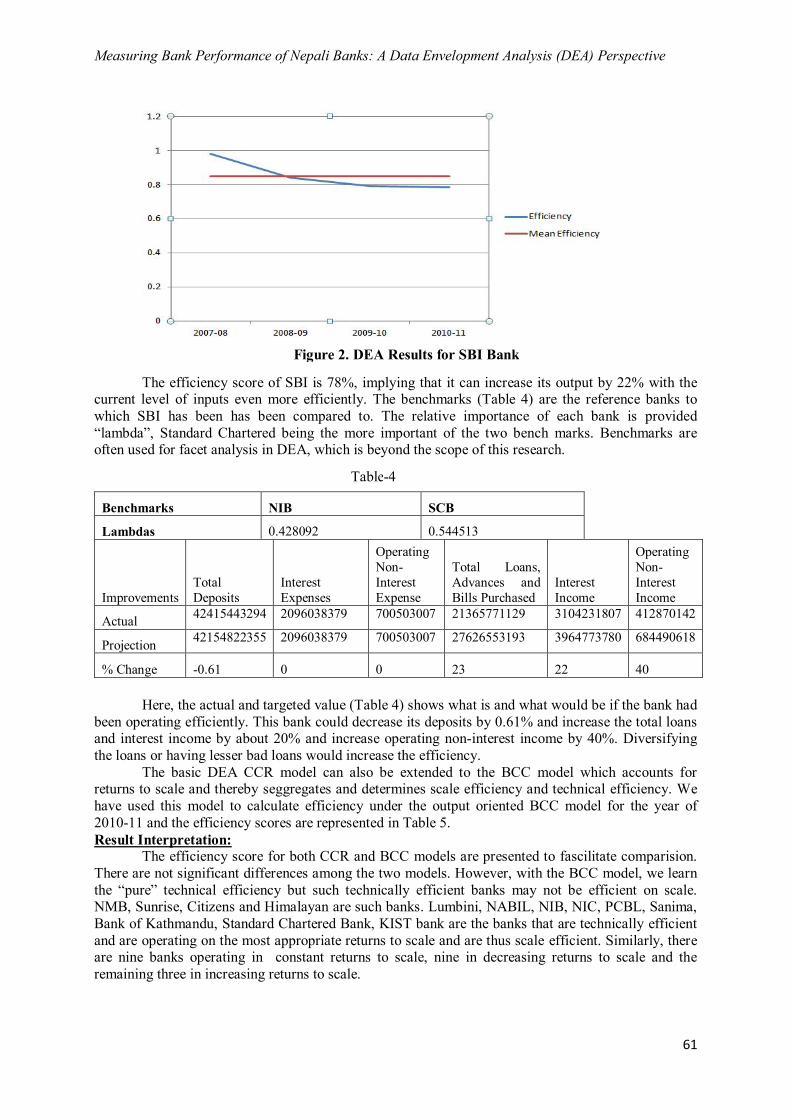
The efficiency score of SBI is 78%, implying that it can increase its output by 22% with the current level of inputs even more efficiently. The benchmarks (Table 4) are the reference banks to which SBI has been has been compared to. The relative importance of each bank is provided “lambda”, Standard Chartered being the more important of the two bench marks. Benchmarks are often used for facet analysis in DEA, which is beyond the scope of this research.
Benchmarks NIB SCB
Lambdas 0.428092 0.544513
Improvements Total Deposits
Interest Expenses
Operating Non-Interest Expense
Total Loans, Advances and Bills Purchased
Interest Income
Operating Non- Interest Income
Actual 42415443294 2096038379 700503007 21365771129 3104231807 412870142
Projection 42154822355 2096038379 700503007 27626553193 3964773780 684490618
% Change -0.61 0 0 23 22 40
Here, the actual and targeted value (Table 4) shows what is and what would be if the bank had been operating efficiently. This bank could decrease its deposits by 0.61% and increase the total loans and interest income by about 20% and increase operating non-interest income by 40%. Diversifying the loans or having lesser bad loans would increase the efficiency.
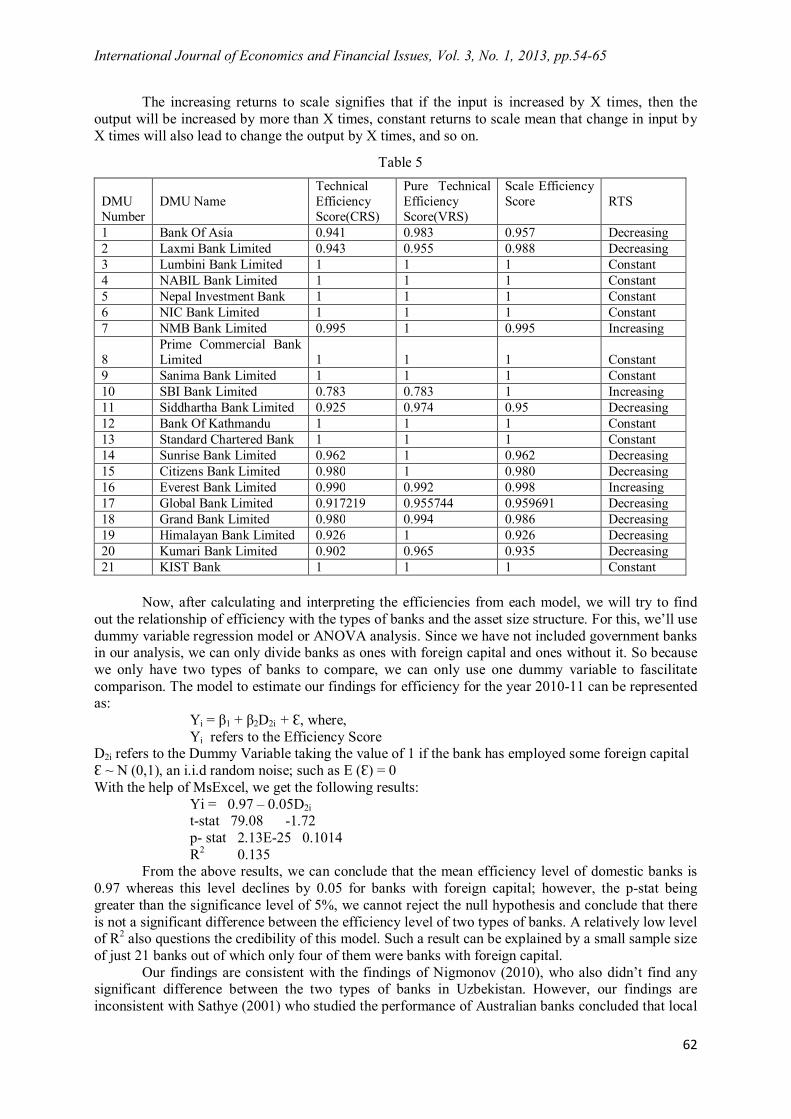
The basic DEA CCR model can also be extended to the BCC model which accounts for returns to scale and thereby seggregates and determines scale efficiency and technical efficiency. We have used this model to calculate efficiency under the output oriented BCC model for the year of 2010-11 and the efficiency scores are represented in Table 5. Result Interpretation:
The efficiency score for both CCR and BCC models are presented to fascilitate comparision. There are not significant differences among the two models. However, with the BCC model, we learn the “pure” technical efficiency but such technically efficient banks may not be efficient on scale. NMB, Sunrise, Citizens and Himalayan are such banks. Lumbini, NABIL, NIB, NIC, PCBL, Sanima, Bank of Kathmandu, Standard Chartered Bank, KIST bank are the banks that are technically efficient and are operating on the most appropriate returns to scale and are thus scale efficient. Similarly, there are nine banks operating in constant returns to scale, nine in decreasing returns to scale and the remaining three in increasing returns to scale.
Table-4
Figure 2. DEA Results for SBI Bank
International Journal of Economics and Financial Issues, Vol. 3, No. 1, 2013, pp.54-65
62
The increasing returns to scale signifies that if the input is increased by X times, then the output will be increased by more than X times, constant returns to scale mean that change in input by X times will also lead to change the output by X times, and so on.
DMU Number
DMU Name
Technical Efficiency Score(CRS)
Pure Technical Efficiency Score(VRS)
Scale Efficiency Score
RTS
1 Bank Of Asia 0.941 0.983 0.957 Decreasing 2 Laxmi Bank Limited 0.943 0.955 0.988 Decreasing 3 Lumbini Bank Limited 1 1 1 Constant 4 NABIL Bank Limited 1 1 1 Constant 5 Nepal Investment Bank 1 1 1 Constant 6 NIC Bank Limited 1 1 1 Constant 7 NMB Bank Limited 0.995 1 0.995 Increasing
8 Prime Commercial Bank Limited 1 1 1 Constant
9 Sanima Bank Limited 1 1 1 Constant 10 SBI Bank Limited 0.783 0.783 1 Increasing 11 Siddhartha Bank Limited 0.925 0.974 0.95 Decreasing 12 Bank Of Kathmandu 1 1 1 Constant 13 Standard Chartered Bank 1 1 1 Constant 14 Sunrise Bank Limited 0.962 1 0.962 Decreasing 15 Citizens Bank Limited 0.980 1 0.980 Decreasing 16 Everest Bank Limited 0.990 0.992 0.998 Increasing 17 Global Bank Limited 0.917219 0.955744 0.959691 Decreasing 18 Grand Bank Limited 0.980 0.994 0.986 Decreasing 19 Himalayan Bank Limited 0.926 1 0.926 Decreasing 20 Kumari Bank Limited 0.902 0.965 0.935 Decreasing 21 KIST Bank 1 1 1 Constant
Now, after calculating and interpreting the efficiencies from each model, we will try to find
out the relationship of efficiency with the types of banks and the asset size structure. For this, we’ll use dummy variable regression model or ANOVA analysis. Since we have not included government banks in our analysis, we can only divide banks as ones with foreign capital and ones without it. So because we only have two types of banks to compare, we can only use one dummy variable to fascilitate comparison. The model to estimate our findings for efficiency for the year 2010-11 can be represented as: Yi = β1 + β2D2i + Ɛ, where, Yi refers to the Efficiency Score D2i refers to the Dummy Variable taking the value of 1 if the bank has employed some foreign capital Ɛ ~ N (0,1), an i.i.d random noise; such as E (Ɛ) = 0 With the help of MsExcel, we get the following results: Yi = 0.97 – 0.05D2i
t-stat 79.08 -1.72 p- stat 2.13E-25 0.1014
R2 0.135 From the above results, we can conclude that the mean efficiency level of domestic banks is
0.97 whereas this level declines by 0.05 for banks with foreign capital; however, the p-stat being greater than the significance level of 5%, we cannot reject the null hypothesis and conclude that there is not a significant difference between the efficiency level of two types of banks. A relatively low level of R2 also questions the credibility of this model. Such a result can be explained by a small sample size of just 21 banks out of which only four of them were banks with foreign capital.
Our findings are consistent with the findings of Nigmonov (2010), who also didn’t find any significant difference between the two types of banks in Uzbekistan. However, our findings are inconsistent with Sathye (2001) who studied the performance of Australian banks concluded that local
Table 5

Measuring Bank Performance of Nepali Banks: A Data Envelopment Analysis (DEA) Perspective
63
banks are more efficient than foreign banks. Similarly there are papers such as of Yildrim & Philippatos (2002) which infer that state owned banks are most efficient of all. Research papers as that of Grigorian & Manole (2002) conclude that foreign banks are the most efficient which enrich the efficiency of banks. However, most economies of such countries offer 100% ownership for foreign banks which is not the case in Nepal. It, therefore, appears that the types of efficiency of banks vary across several economies and no concrete conclusion can be drawn from the existing literatures.
In order to compare the efficiency levels of banks according to their asset size, we have categorized banks with asset size of more than 40 million as large banks; banks with asset size lying in the range of 20 million to 40 million as medium sized banks and banks with less than 20 million as small banks. We were unable to find any concrete literature regarding classification of banks in Nepal according to the asset size; however our classification is also supported by Chalise in an article in the Himalayan Times of the title “Private banks increase asset size” (2011), where banks were classified into four groups - largest (with above Rs 60 billion worth assets), large (Rs 40 billion-Rs 60 billion), middle (Rs 20 billion-Rs 40 billion), and small (with below Rs 20 billion worth assets). Using dummy variables, we have, Yi = β1 + β2D2i + β3D3i + Ɛ, where, Yi refers to the Efficiency Score D2i refers to the Dummy Variable taking the value of 1 if the bank is a large bank D3i refers to the Dummy Varaible taking the value of 1 if the bank is a medium sized bank Ɛ ~ N (0,1), an i.i.d random noise; such as E (Ɛ) = 0 The output of the regression analysis for the year 2010-11 can be displayed as follows: Yi = 0.975049 - 0.025D2i - 0.013D3i t-stat 53.29 -0.87 -0.46 p-stat 2.90E-21 0.39 0.65
The results again show that there are no significant differences in the efficiency levels among the large sized, medium sized and small sized banks. The high levels of p show that the null hypotheses of β2 = 0 and β3 = 0 cannot be rejected and thereby implying that the efficiency levels of all types of banks are similar. Our results are partially consistent with literature of Nigmonov (2010) who couldn’t find any difference between large and small sized banks but concluded that medium sized banks are more efficient than small sized banks. However, literatures of Grigorya and Manole (2002) and Fadzlan (2004) suggest that the efficiency levels are increasing with the increase in asset size. 4. Findings and Conclusions The findings of the study after the efficiency analysis of Nepali banks and their divergence across various ownership structure and asset size can be stated as follows: Nine out of 21 banks, about 43% of analyzed banks were found relatively efficient for the year 2010-11. Generally, lower number of DMUs often yields a large proportion of DMUs to be relatively efficient. (Alirazaee, Howland, & Panne, 1998) There are nine banks with decreasing returns to scale, nine with constant returns to scale and three with increasing returns to scale, meaning that banks with decreasing returns have the possibility of decreasing their output levels or being taken over by increased competition of newer efficient banks. The mean efficiency score has been fairly consistent and has increased in the last year despite decreasing slightly the year before that. The cause for this consistency could be the similarity of asset structure and interest income and operating components over the time period. Deeper analysis and study of the DEA analysis will be helpful in pinpointing the causes of scale and technical inefficiency which may assist in better performance of the banks. It was also found that both the ownership type and the asset size of a bank don’t affect its efficiency. This shows that foreign banks don’t necessarily mean better efficiency; however, further inspection is required to know if the change in policy of foreign investments in banking would yield different results. Similarly, no relationship of asset size with efficiency suggests that there is room for both larger and smaller investments in banking meaning more competition which can be achieved by freeing up the banking sector.
International Journal of Economics and Financial Issues, Vol. 3, No. 1, 2013, pp.54-65
64
5. Future Implications Based on the experiences and the outcomes of the research, the researchers would like to propose some suggestions for future research. Primarily, having larger time periods would procure better results and a possibility of a good window analysis is also possible which will be helpful to determine how efficiency has increased or decreased over the time period. Also, with a longer time-period, a time series panel data can be used for regression analysis whose results would incorporate the relationship for a longer period of time. In addition, with the encouragement of merger and acquisition by the government, this research can serve as a comparison for how effective those encouragements after a few years of time. It is apparent that the current policy in banking is aimed to have fewer but larger banks, so, this research can also be helpful to measure how effective these policies are and with additional research, it can serve as a helping hand for the policymakers of this nation. The use of facet analysis in DEA is also encouraged by the authors as it helps to understand the benchmarks and their importance. The study of benchmarks and their importance will help inefficient banks move on to higher level of inefficiency. Finally, this research is the first paper to use a non-parametric frontier approach to analyze the banking sector in Nepal and the researchers hope that this paper will just be the beginning point for the use and development of such frontier approaches in Nepal. References Banker, R., Charnes, A., Cooper, W. (1984). Some Models for Estimating Technical and Scale
Inefficiency in Data Envelopment Analysis. Management Science, 30, 1078-1092. Banker, R., Conrad, R., Strauss, R. (1986). A comparative application of data envelopment analysis
and translog methods: An illustrative study of hospital production, Management Science, 32, 30-44.
Baral, K. J. (2005). Health Check-up of Commercial Banks in the Framework of CAMEL: A Case Study of Joint Venture Banks in Nepal. The Journal of Nepali Business Studies, 2, 41-55.
Berg, S., Forsund, F., & Jansen, E. (1990). Derelugation and Productivity Growth in Norwegian Banking 1980-1988: A Non-parametric Frontier Approach. Jurnal of productivity Analysis, 2, 127-142 .
Berger, A., Humphrey, D. (1997). Efficiency of Financial Institutions: International Survey and Directions for Future Research. European Journal of Operational Research, 98, 175-212.
Bhattacharyya, A., Lovell, C., & Sahay, P. (1997). The Impact of Liberalization on the Productive Efficiency of Indian Commercial Banks. European Journal of Operational Research, 98, 332-345.
Chalise, K. (2011, 11 09). Private banks increase asset size . The Himalayan Times . Charnes, A., Cooper, W., Rhodes, E. (1978). Measuring the efficiency of decision making units.
European Journal of Operational Research, 2, 429-444 . Eken, M.H., Kale, S. (2011). Measuring bank branch performance using Data Envelopment Analysis:
The case of Turkish bank branches. African Journal of Business Management, 5, 889-901 . Fadzlan, S. (2004). The Efficiency Effects of Bank Mergers and Acquisitions in a Developing
Economy: Evidence from Malaysia. International Journal of Applied Econometrics and Quantitative Studies, 4, 53-74.
Farrell, M.J. (1957). The Measurement of Productive Efficiency. Journal of the Royal Statistical Society, 5, 147-171 .
Ferrier, G., Lovell, C. (1990). Measuring Cost Efficiency in Banking: Econometric and Linear Programming Evidence. Journal of Econometrics, 46, 229-245 .
Frexias, X., Rochet, J. (1997). Microeconomics of Banking. Cambridge: MIT Press. Gajurel, D.P., Pradhan, R. (2010). Structure-Performance Relation in Nepali Banking Industry. Grigorian, D., & Manole, V. (2002). Determinants of Commercial Bank Performance in. IMF Working
Paper No 02/146. Laeven, L. (1999). Risk and Efficiency of East Asian Banks. World Bank Policy Research Working
Paper No. 2255 . Lewin, A., Morey, R., Cook, T. (1982). Evaluating the administrative efficiency of courts.
International Journal of Management Science, 4, 401-411 .

Measuring Bank Performance of Nepali Banks: A Data Envelopment Analysis (DEA) Perspective
65
Mertensa, A., Urga, G. (2001). Efficiency, scale and scope economies in the Ukrainian banking sector in 1998. Emerging Markets Review, 2 , 56-73.
Muhammad, T. (2008). A DEA Analysis of Bank Performance in Nigeria. Munich Personal RePEc Archieve .
Nigmonov, A. (2010). Bank Performance and Efficiency in Uzbekistan. Eurasian Journal of Business and Economics, 3, 1-35 .
Oral, K., Yololan, O. (1992). An Empirical Study on Analyzing the Productivity of Bank Branches, 46, 282-294.
Sathye, M. (2001). X-Efficiency in Australian Banking: An Empirical Investigation. Journal of Banking and Finance, 25, 613-630.
Sherman, H., Gold, F. (1985). Bank branch operating efficiency-evaluation with data envelopment analysis. Journal of Banking and Finance, 9, 297-315 .
Yeh, Q.J. (1996). The Application of Data Envelopment Analysis in Conjunction with Financial Ratios for Bank Performance Evaluation. The Journal of Operational Research Society, 47, 980-988.
Yildrim, S., Philippatos, G. (2002). Efficiency of Banks: Recent Evidence from the Transiton of Economies of Europe, 1993-2000. Knoxville: University of Tenesse, www.yorku.ca/yildirim/CEEefficiency.pdf.
Yue, P. (1992). Data Envelopment Analysis and Commercial Bank Performance: A Primer with Missouri Banks, Federal Reserve Bank of St. Louis Review, 74, 31-45..