MEASURING AND IMPROVING THE PERFORMANCE … · MEASURING AND IMPROVING THE PERFORMANCE OF...
76
91 MEASURING AND IMPROVING THE PERFORMANCE OF ENVIRONMENTAL ENFORCEMENT IN GEORGIA by Lavrentii Morciladze 17 and Angela Bularga 18 1. Introduction In Georgia, there is recognition that the system of environmental enforcement has many obsolete characteristics and it does not function properly. The instruments used for the assessment of its performance are also underdeveloped. This article analyses performance indicators, which are currently used, and the ways in which the reform process should follow. 2. Design of environmental enforcement system and performance management 2.1 The environment protection authority and its enforcement unit The environment protection authority was established in Georgia in 1974. Since then, it went through many institutional reforms. Currently, the Ministry of Natural Resources and Environment Protection is the main competent authority as regards environmental regulation and oversight over activities that might influence the rational use of natural resources and the state of the environment. The Ministry of Environmental Protection and Natural Resources has the following tasks: • Cross-sector co-ordination of environmental protection and natural resource use; • Environmental policy development and international relations; • Development of laws and regulations; • State environmental review, licensing and permitting; and • Environmental monitoring, inspection and enforcement. The Ministry's activities cover ambient air, in-land waters and marine ecosystems, land, underground resources, flora (including forests) and fauna, and waste management. In 2002, the 17 Deputy Head of the DOSEPA, Ministry of Natural Resources and Environmental Protection of Georgia. 18 OECD/EAP Task Force Secretariat.
Transcript of MEASURING AND IMPROVING THE PERFORMANCE … · MEASURING AND IMPROVING THE PERFORMANCE OF...

91
MEASURING AND IMPROVING THE PERFORMANCE OF ENVIRONMENTAL ENFORCEMENT IN GEORGIA
by Lavrentii Morciladze17 and Angela Bularga18
1. Introduction
In Georgia, there is recognition that the system of environmental enforcement has many obsolete characteristics and it does not function properly. The instruments used for the assessment of its performance are also underdeveloped. This article analyses performance indicators, which are currently used, and the ways in which the reform process should follow.
2. Design of environmental enforcement system and performance management
2.1 The environment protection authority and its enforcement unit
The environment protection authority was established in Georgia in 1974. Since then, it went through many institutional reforms. Currently, the Ministry of Natural Resources and Environment Protection is the main competent authority as regards environmental regulation and oversight over activities that might influence the rational use of natural resources and the state of the environment.
The Ministry of Environmental Protection and Natural Resources has the following tasks:
• Cross-sector co-ordination of environmental protection and natural resource use;
• Environmental policy development and international relations;
• Development of laws and regulations;
• State environmental review, licensing and permitting; and
• Environmental monitoring, inspection and enforcement.
The Ministry's activities cover ambient air, in-land waters and marine ecosystems, land, underground resources, flora (including forests) and fauna, and waste management. In 2002, the
17 Deputy Head of the DOSEPA, Ministry of Natural Resources and Environmental Protection of
Georgia. 18 OECD/EAP Task Force Secretariat.

92
regulation and control of nuclear safety was assigned to the Ministry. Figure 1 presents the organisational structure of the Ministry.
Figure 1. Organisational structure of the Ministry of Environmental Protection and Natural Resources of Georgia
Advisory Council Secretariat3 Vice-Ministers
Department of State Environ.Review and Permitting
15 people
Territorial Departments
Inspection for theBlack Sea Convention
24 people
Department of Organisationand Supervision of Environment
Protection Activities16 people
Permitting and EnforcementDepartments
Environmental PolicyDivision12 people
Environmental EconomicsDivision4 people
Central Accounting Unit7 people
Law Development Division4 people
Finance and PlanningDepartment
4 people
Human ResourcesManagement
5 people
Divisions
Water Resources ProtectionDivision11 people
Ambient Air ProtectionDivision11 people
Land Protection, Wasteand Chemicals Regulation
Division10 people
Biodiversity ProtectionDepartment20 people
Mineral ResourcesProtection and Mining
Department22 people
Nuclear SafetyService
10 people
General Divisions andFunctional Departments
Central Bodyof the Ministry
196 people
Environment ProtectionInstitute
49 people
Marine Ecology andFisheries Institute
34 people
Centre of Reproductionof Rare and Endangered
Fish Species6 people
Environmental MonitoringCentre
18 people
State Coordinating Servicefor Environmental Safety
of Population10 people
Climate Change Agency10 people
Autonomous Sub-Divisionsand Departmental Services
Ministry of Natural Resourcesand Environmental Protection
MINISTER
The main unit responsible for compliance assurance is the Department for Organisation and Supervision of Environmental Protection Activities (DOSEPA). In addition the department is responsible for planning and supervision of the Ministry's activity as well as public relations. The department subordinates territorial and municipal departments/committees of environmental protection and natural resources management who carry environmental inspections. However, significant emphasis in the Department is put on administrative functions (e.g. reporting on the activity of the Ministry), while the compliance assurance per se receives marginal attention. The wide range of responsibilities prevents DOSEPA from effectively monitor my compliance with environmental requirements.
93
Inspections are carried out by territorial environmental departments which inspect all facilities – large or small. A specialised inspectorate monitors compliance with the Black Sea Protection Convention. The DOSEPA only supervises the inspection activity done by these sub-national units. The supervision is limited to receiving weekly reports (often only over the phone) and organising monthly meetings with heads of these territorial units. High level of discretion is left to the territorial units even though their institutional capacity is low. The Department neither participates in inspection activities, nor provides detailed guidance in procedures or priority setting at the local level. It also does not organise training for inspectors. Although DOSEPA staff is willing to perform all these tasks, the available resources do not allow doing so.
2.2 Key indicators
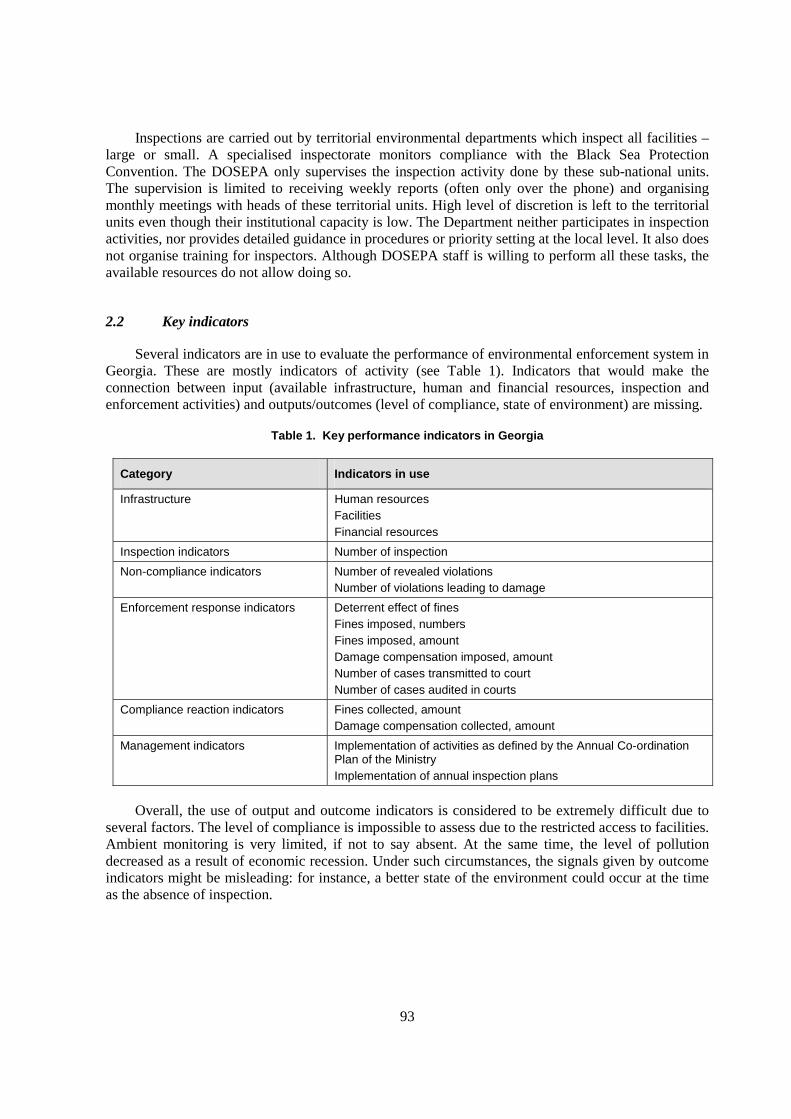
Several indicators are in use to evaluate the performance of environmental enforcement system in Georgia. These are mostly indicators of activity (see Table 1). Indicators that would make the connection between input (available infrastructure, human and financial resources, inspection and enforcement activities) and outputs/outcomes (level of compliance, state of environment) are missing.
Table 1. Key performance indicators in Georgia
Category Indicators in use
Infrastructure Human resources Facilities Financial resources
Inspection indicators Number of inspection
Non-compliance indicators Number of revealed violations Number of violations leading to damage
Enforcement response indicators Deterrent effect of fines Fines imposed, numbers Fines imposed, amount Damage compensation imposed, amount Number of cases transmitted to court Number of cases audited in courts
Compliance reaction indicators Fines collected, amount Damage compensation collected, amount
Management indicators Implementation of activities as defined by the Annual Co-ordination Plan of the Ministry Implementation of annual inspection plans
Overall, the use of output and outcome indicators is considered to be extremely difficult due to several factors. The level of compliance is impossible to assess due to the restricted access to facilities. Ambient monitoring is very limited, if not to say absent. At the same time, the level of pollution decreased as a result of economic recession. Under such circumstances, the signals given by outcome indicators might be misleading: for instance, a better state of the environment could occur at the time as the absence of inspection.

94
2.3 Reporting lines
The existing hierarchy of reporting of environmental results includes individual inspector’s reports, reports from territorial departments to DOSEPA, and DOSEPA's semi-annual and annual reports to the Ministry. Reports are also presented to the Department of Statistics according to the standard reporting form "Environment Protection". Such a form contains data on number of revealed violations, the number of cases where damage occurred and the total amount of damage compensation, number of cases transmitted to courts and amount of fines imposed, etc.
At the regional level, staff members prepare weekly plans and report on their implementation to the head of the regional department. However, these reports have a limited influence on management decisions. For instance, they do not allow management to assess time loads for inspecting a particular facility or sector.
In 2001, the DOSEPA tested a new type of report that required every inspector to provide the following information: number of inspections performed, number of violations discovered, and number of cases transmitted to courts. Unfortunately, these reports brought no added value, since data were not accurate enough, for example a team inspection could be reported by each member of the team thus considerably increasing the number of inspections.
Results of DOSEPA activity are reported to the Minister who may request further information or action (for instance, a more severe response to certain violations). Following this feedback, the DOSEPA usually communicates it to territorial departments. The general public is not informed regularly about the performance of the enforcement system, although press releases can occasionally present important cases and the annual reports of the Ministry contain data on enforcement and compliance.
2.4 Self-reporting by industry
Every six months, industries are obliged to provide the MNREP with statistical reports on air and water protection. Inter alia, these reports contain data on emissions and discharges. Emission levels are estimated based on technological and production parameters.
Many facilities fail to report on their emissions. To address this kind of non-compliance, an innovative tool was introduced requiring industries to endorse their tax declarations with territorial environmental departments. Before sending its declaration to tax offices, industries are asked to obtain a certificate that they possess all environmental licences. A standard form for this certificate was developed. Unfortunately, the tax authorities are not very insistent and accept the declarations without any environmental information.
Industry is not required to disclose violations and accidents pro-actively. The incentive to do so is very low, since sanctions exist only for providing false information. Due to a very poor capacity of authorities to monitor the state of environment and emissions, the DOSEPA and its territorial units have very limited opportunities of discovering, and timely responding to, violations or even accidents.
95
3. Analysis of performance indicators
3.1 Input indicators: human and financial resources
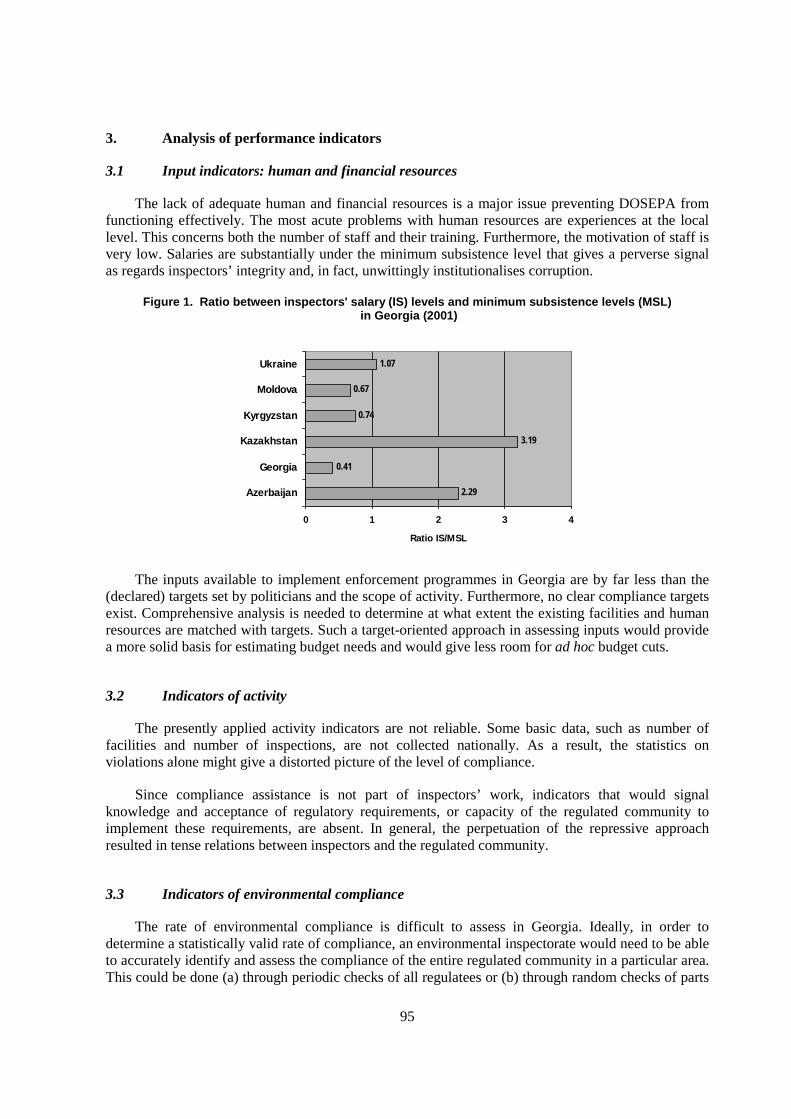
The lack of adequate human and financial resources is a major issue preventing DOSEPA from functioning effectively. The most acute problems with human resources are experiences at the local level. This concerns both the number of staff and their training. Furthermore, the motivation of staff is very low. Salaries are substantially under the minimum subsistence level that gives a perverse signal as regards inspectors’ integrity and, in fact, unwittingly institutionalises corruption.
Figure 1. Ratio between inspectors' salary (IS) levels and minimum subsistence levels (MSL) in Georgia (2001)
2.29
0.41
3.19
0.74
0.67
1.07
0 1 2 3 4
Azerbaijan
Georgia
Kazakhstan
Kyrgyzstan
Moldova
Ukraine
Ratio IS/MSL
The inputs available to implement enforcement programmes in Georgia are by far less than the (declared) targets set by politicians and the scope of activity. Furthermore, no clear compliance targets exist. Comprehensive analysis is needed to determine at what extent the existing facilities and human resources are matched with targets. Such a target-oriented approach in assessing inputs would provide a more solid basis for estimating budget needs and would give less room for ad hoc budget cuts.
3.2 Indicators of activity
The presently applied activity indicators are not reliable. Some basic data, such as number of facilities and number of inspections, are not collected nationally. As a result, the statistics on violations alone might give a distorted picture of the level of compliance.
Since compliance assistance is not part of inspectors’ work, indicators that would signal knowledge and acceptance of regulatory requirements, or capacity of the regulated community to implement these requirements, are absent. In general, the perpetuation of the repressive approach resulted in tense relations between inspectors and the regulated community.
3.3 Indicators of environmental compliance
The rate of environmental compliance is difficult to assess in Georgia. Ideally, in order to determine a statistically valid rate of compliance, an environmental inspectorate would need to be able to accurately identify and assess the compliance of the entire regulated community in a particular area. This could be done (a) through periodic checks of all regulatees or (b) through random checks of parts
96
of the regulated community to decrease costs. In practice, even the lower cost option is not feasible in Georgia because random inspections would not be authorised.
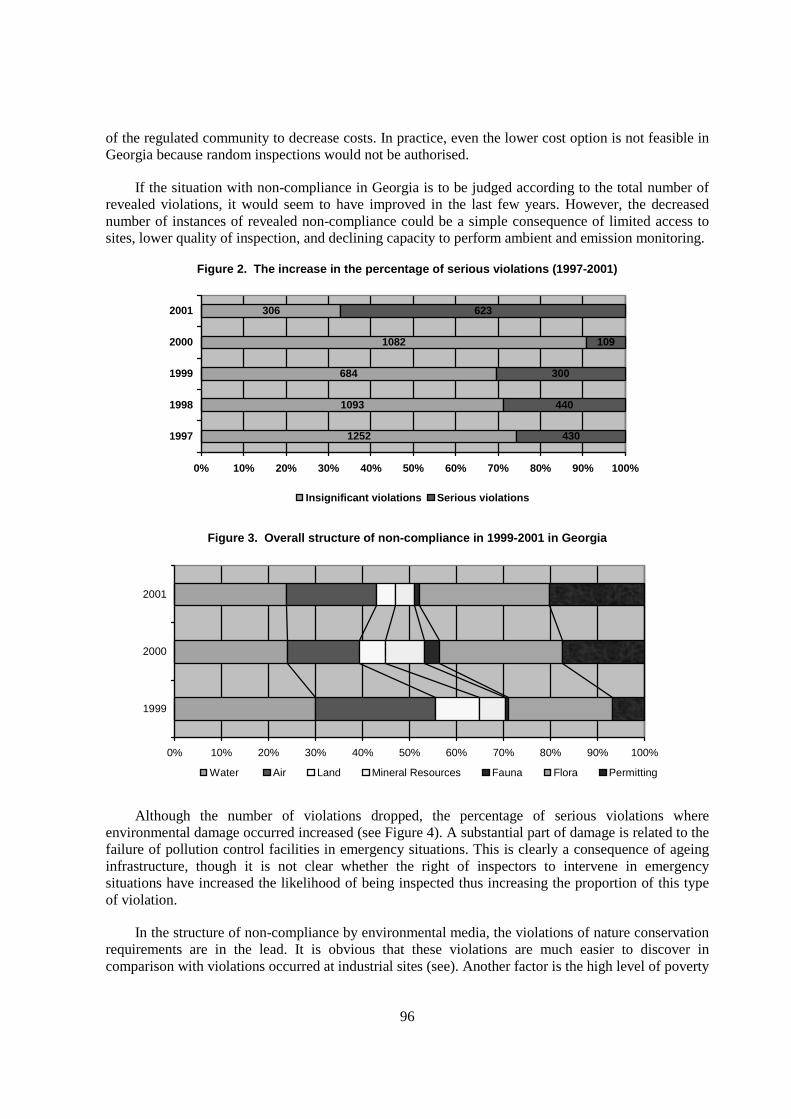
If the situation with non-compliance in Georgia is to be judged according to the total number of revealed violations, it would seem to have improved in the last few years. However, the decreased number of instances of revealed non-compliance could be a simple consequence of limited access to sites, lower quality of inspection, and declining capacity to perform ambient and emission monitoring.
Figure 2. The increase in the percentage of serious violations (1997-2001)
1252
1093
684
1082
306
430
440
300
109
623
0% 10% 20% 30% 40% 50% 60% 70% 80% 90% 100%
1997
1998
1999
2000
2001
Insignificant violations Serious violations
Figure 3. Overall structure of non-compliance in 1999-2001 in Georgia
0% 10% 20% 30% 40% 50% 60% 70% 80% 90% 100%
1999
2000
2001
Water Air Land Mineral Resources Fauna Flora Permitting
Although the number of violations dropped, the percentage of serious violations where environmental damage occurred increased (see Figure 4). A substantial part of damage is related to the failure of pollution control facilities in emergency situations. This is clearly a consequence of ageing infrastructure, though it is not clear whether the right of inspectors to intervene in emergency situations have increased the likelihood of being inspected thus increasing the proportion of this type of violation.
In the structure of non-compliance by environmental media, the violations of nature conservation requirements are in the lead. It is obvious that these violations are much easier to discover in comparison with violations occurred at industrial sites (see). Another factor is the high level of poverty

97
and the energy crisis that forced the poorest to seek access to resources through illegal logging, fishing and hunting.
Figure 4. Trends in number of cases examined by courts as compared to number filed (1997-2000)
0
100
200
300
400
500
600
700
1997 1998 1999 2000 2001
Transmited to the court Examined by the court
Percentage of cases examined
0
5
1015
2025
30
35
40
45
1997 1998 1999 2000 2001
3.3 Indicators of enforcement responses
The level of sanctions is low in Georgia. Therefore they do not have any deterrent effect. For example, the legislation on marine environment protection foresees fines that are up to 5 US dollars for violations of requirements to register any activity involving handling of hazardous substances, including international marine transport.
The relationships between environmental inspectors and courts are an example of how performance and effectiveness of regulation is influenced by institutional problems, including poor communication. In many instances, courts are reluctant to authorise environmental inspectors to enter a facility. This fact can have several explanations. Judges are not well acquainted with environmental problems and particularities of environmental cases. Inspectors, in their turn, are not well trained to prepare the files so that courts accept environmental cases. The evidence of non-compliance is difficult to obtain because the ambient monitoring system collapsed. It is not clear whether the decision to authorise the entry of a facility is influenced by lobbying from industry.
Many environmental cases, transmitted to courts, are not examined (see Figure 6), or the enforcement response is not adequate. There is dissonance among different territorial environmental departments, some of them getting full support from courts, other ones being constantly refused. This shows that there is no consistent decision-making policy within the court system regarding environmental enforcement. The new system seems to be as discretionary as previously, with discretion being "transferred" from environmental inspectors to courts.
Although inspectors kept the right to propose the enforcement response, the courts usually prefer sanctions milder than proposed by inspectors. For instance, the amount of damage compensation is systematically lowered. Moreover, the courts are very slow in examining the environmental cases.
There also are difficulties at the stage of executing the court decisions. According to the current legislation, any complainant has to conclude a contract with the court executor and to pay in advance 7% of the claimed money. The Ministry’s budget does not provide for such money. The damage compensation claims are very significant and so are the necessary sums for being advanced while the DOSEPA has no guarantee at all that the compensations will be collected since most of the defendants are quasi bankrupt. As a result, the rate of collected fines dropped to 6 per cent in 2001 and even 4 per cent in 2002.
98
4, Key lessons learned from the analysis of indicators
The general conclusion from this case study is that indicators cannot exist separately from enforcement strategies and the overall conditions of their implementation. To this end, a standard set of indicators could be complemented with indicators that would relate to specific programs and their elements. The “standard” indicators, among other things, should allow measuring the institutional capacity of enforcement authorities, the potential deterrent effect of tools used, but also the integrity of inspectors.
An important goal of performance management is to obtain a picture of the enforcement system’s effectiveness as a whole. The knowledge of the roots of non-compliance can help in this regard. For example, a rating system could be introduced to evaluate factors that are detrimental to environmental compliance.
Also the case study leads to several conclusions on priority actions to improve environmental enforcement in Georgia. First, the environmental inspectors will have to be endowed with powers, knowledge and infrastructure necessary to effectively enforce environmental requirements. `To limit the discretion in inspectors’ actions, decision-making policies on inspection frequency and procedures should be developed, and an appeal mechanism should be established. If motivation and integrity is expected from inspectors, the Government needs to set the salaries at a level that at least covers the minimum subsistence. To strengthen the regulatory chain as a whole, the environmental awareness of courts should be improved.
An early measure in improving the effectiveness of the enforcement system is a better identification of the regulated community. The Ministry should define the information that is necessary, with delineation of minimal, intermediate and full data sets. The Ministry should be in constant liaison with other governmental agencies (e.g. tax authorities) that might possess data on new companies. The regulatees should be required to track their own compliance regularly and report the results for government review. Preventative activities would need to be started to complement the current repressive character of the enforcement system.

99
STATE OF GHANA’S ENVIRONMENT — CHALLENGES OF COMPLIANCE AND ENFORCEMENT
by Wilson Tamakloe19
Abstract
The country of Ghana is in Western Africa, bordering the Gulf of Guinea, between Cote d'Ivoire, Burkina Faso, and Togo. Ghana has rich and diverse natural resources. These resources are exploited to meet the growing demands of the populace. The uncontrolled manner of utilisation of these natural resources has resulted in reversible and irreversible changes within the environment.
Ghana has a long history of attempting to safeguard the environment from being abused by enacting and including environmental protection in appropriate legislation. The best result from all of these attempts is the establishment of an organisation solely responsible for the environment – the Environmental Protection Agency (EPA).
The Ghana Environmental Protection Agency, since its establishment in 1994 as an Agency with powers to regulate the activities within the environment, has been using the Environmental Assessment Administration procedures as its major tool for achieving compliance with its legislation. The number of applications received for environmental permits within a certain time frame is used as a measure of environmental compliance.
To be able to enforce the environmental legislation, the Agency promotes compliance by working in partnership with other stakeholders, especially those state organisations with an equal mandate to enforce certain legislation. Compliance monitoring is done by the Environmental Quality Department of the Agency in collaboration with other departmental staff within and outside the Agency. Non-compliance response involves mainly using statutory notices, site visits, and, as the last resort, legal action.
The main challenges of compliance and enforcement are the political will to see the environment as a priority area, the lack of adequate resources for environmental management and the carrying out of compliance and enforcement activities. The other challenge is review of existing legislation to reflect the current trend of events and enactment of new legislation.
19 Ghana Environmental Protection Agency.

100
1. Introduction
Ghana lies between longitudes 3° 15’ W and 1° 12’ E, and latitude 4° 44’and 11° 15’ N. The country is bordered on the East by the Republic of Togo, the West by Cote d’Ivoire, the North by Burkina Faso and the South by the Gulf of Guinea.
The total land area of Ghana is 238,533 km2 with an Exclusive Economic Zone (EEZ) of 110,000 km2 of the sea, forming the territorial area of Ghana. Ghana has a coastline of 550km2. The country is under the influence of the tropical humid climatic conditions and experiences two major seasons, namely the rainy season and dry season, brought about by the harmattan, a dry dusty wind that blows along the northwest coast of Africa.
The mean minimum rainfall is 900mm/annum occurring around the Southeastern part of Ghana (Accra-Aflao) while the mean maximum rainfall is about 2000mm/annum, occurring in the southwestern portions (Axim). Mean minimum temperature ranges from 21°C - 23°C and mean maximum temperature is from 30°C - 35°C. The mean annual evapotranspiration rate is low in southern Ghana (80mm) and higher in the north (190mm).
There are six vegetation zones in Ghana. These are the Savannah (Sudan, Guinea and Coastal), Forest-Savannah Transitional Zone, The Semi-Deciduous Forest Zone, and the Rain Forest Zone. Human activities and natural pressures have considerably changed the natural vegetation.
Ghana had a population of about 12.4 million in 1984. This figure increased to 18.8 million in 2000 with an intercensai growth rate of 2.6 per cent. Life expectancy at birth has improved from 45 years in 1984 to 55 years in 2000. About 37.4 per cent of the population live in urban areas as against 32 per cent in 1984. The economy of the country is based on the export of cocoa, minerals (gold, diamond), timber and few non-traditional products/produce.
Ghana is rich in biodiversity. The country boasts a wide variety of birds, including migratory birds, reptiles and animals with unique habitats; a wide range of plants and flowers abound in the country. A large number of plant and animal species are believed to be rare; the leopard and golden cat are rare carnivores; the rufus fishing owl and white-breasted guinea fowl are endangered birds while the giant butterfly Papilio maesseni are found only in the Likpe area of Volta Region.
There are also major tourist attractions in the country. These include the Kakum, Bia, and Mole national parks; the Paga Crocodile Pond; beautiful beaches, forts, and castles; and many other important national heritage sites.
2. State of the environment
2.1 Atmosphere
Ghana generally enjoys ‘clean’ atmospheric conditions. However, emissions from point sources such as vehicles, industries, and dusts from untarred roads, etc. tend to create atmospheric pollutants within their immediate environments. The most abundant greenhouse gas produced and emitted in Ghana is CO2. There are CO2 sinks in the forested and the reforested land. The trend of the total CO2 equivalent removals, however, shows a significant decline of about 49 per cent from 1990 to 1996. There is fear that the rate of deforestation will offset net CO2 removal as forests, which serve as sink for excess CO2, are being depleted. Ghana’s programme under the Montreal Protocol (control of
101
chlorofluorocarbons) is progressing smoothly. In 1997, UNEP rewarded Ghana’s efforts with an award for her exemplary efforts to implement the Montreal Protocol.
2.2 Biodiversity
Ghana’s rich biodiversity is gradually being depleted due to a variety of factors. Prominent among them are poaching, habitat loss, deforestation, etc. It is indisputable that there is a pressing need to domesticate the Biodiversity Convention. This is in view of the precarious biodiversity conditions prevalent in Ghana.
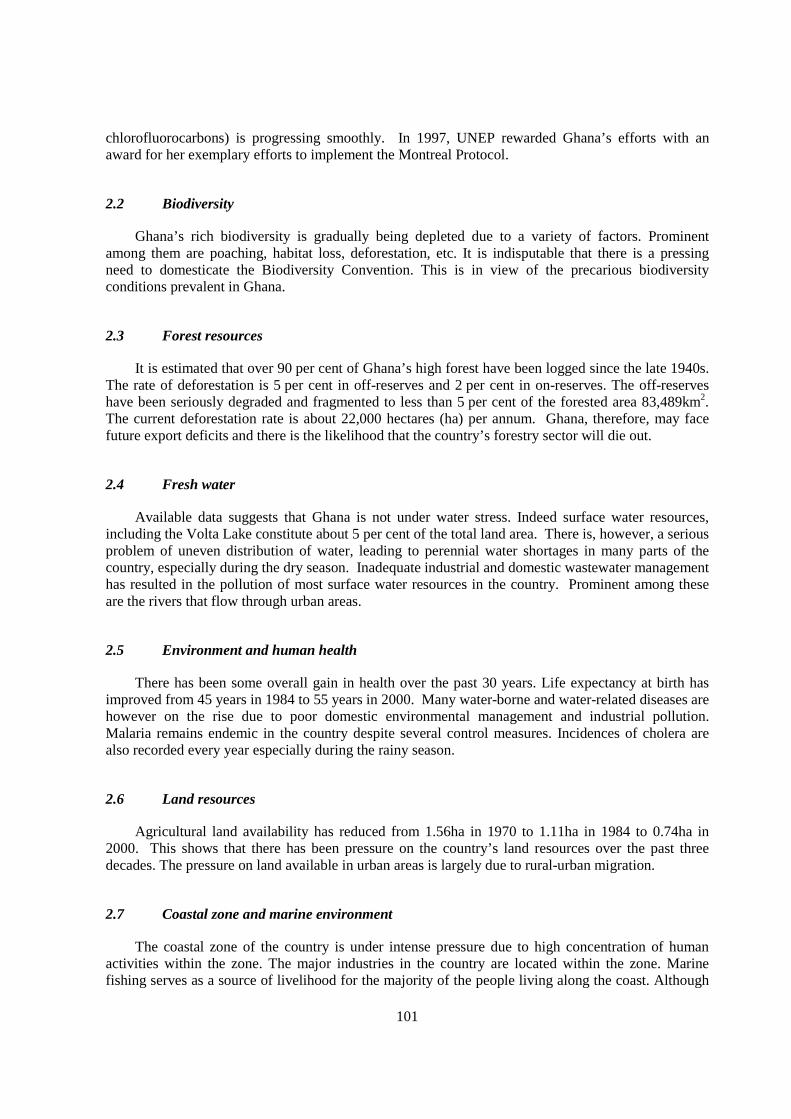
2.3 Forest resources
It is estimated that over 90 per cent of Ghana’s high forest have been logged since the late 1940s. The rate of deforestation is 5 per cent in off-reserves and 2 per cent in on-reserves. The off-reserves have been seriously degraded and fragmented to less than 5 per cent of the forested area 83,489km2. The current deforestation rate is about 22,000 hectares (ha) per annum. Ghana, therefore, may face future export deficits and there is the likelihood that the country’s forestry sector will die out.
2.4 Fresh water
Available data suggests that Ghana is not under water stress. Indeed surface water resources, including the Volta Lake constitute about 5 per cent of the total land area. There is, however, a serious problem of uneven distribution of water, leading to perennial water shortages in many parts of the country, especially during the dry season. Inadequate industrial and domestic wastewater management has resulted in the pollution of most surface water resources in the country. Prominent among these are the rivers that flow through urban areas.
2.5 Environment and human health
There has been some overall gain in health over the past 30 years. Life expectancy at birth has improved from 45 years in 1984 to 55 years in 2000. Many water-borne and water-related diseases are however on the rise due to poor domestic environmental management and industrial pollution. Malaria remains endemic in the country despite several control measures. Incidences of cholera are also recorded every year especially during the rainy season.
2.6 Land resources
Agricultural land availability has reduced from 1.56ha in 1970 to 1.11ha in 1984 to 0.74ha in 2000. This shows that there has been pressure on the country’s land resources over the past three decades. The pressure on land available in urban areas is largely due to rural-urban migration.
2.7 Coastal zone and marine environment
The coastal zone of the country is under intense pressure due to high concentration of human activities within the zone. The major industries in the country are located within the zone. Marine fishing serves as a source of livelihood for the majority of the people living along the coast. Although

102
coastal erosion points have not increased in number in the past decade, the magnitude of the problem has increased considerably in certain areas. This is the case for the Volta Delta at Ada and Keta. Extensive restoration is ongoing in Keta and is expected to be completed in the next two years.
2.8 Major pressures
Politically, Ghana experienced instability some years after independence to the early 1980s. Since 1992, multi-party democracy has been practiced, with a change in government in 2000. The unstable political climate in the past made it impossible for past governments to carry through their programmes. In addition there has been an increasing rise in poverty, which has impacted negatively on the environment and vice versa. Illiteracy coupled with lack of awareness of environmental issues and legislation has also contributed immensely to environmental problems in the country.
2.9 Responses
These pressures notwithstanding, significant legislative and institutional reforms have taken place within the past decade. Many institutions for regulating the environment were established after 1990 including, Environmental Protection Agency, Water Resources Commission, Forestry Commission, Energy Commission, etc. Within the same period, nongovernmental organisation activity has also increased, with the implementation of many programmes aimed at the provision of sanitation and potable water; control and prevention of loss of biodiversity, etc.
3, Compliance and enforcement indicators
3.1 Compliance Indicators
Ghana has a long history of attempting to safeguard the environment from being abused by enacting and including environmental protection in appropriate legislation. The best result from all of these attempts is the establishment of an organisation solely responsible for the environment – the Environmental Protection Agency (EPA). As outlined in a policy statement, Environmental Protection in Ghana is to be guided by the preventive approach so as to avoid the creation of environmental problems. This in, practice is, being done through the Environmental Assessment Administration Procedures. These procedures were derived from the main Environmental Legislation, Environmental Protection Agency Act, Act 490, and Environmental Assessment Regulation, LI 1652.
The procedures are as follows:
1. New developments are to register with the EPA, conduct an environmental assessment of their proposals and submit an environmental assessment report to the EPA for review. There are levels of assessment depending upon the type, scale and location of the activity. Environment Permit is granted for the development to start when EPA is satisfied with the assessment conducted and the mitigation measures proposed for any environmental impact likely to be associated with the project.
2. Industries in existence before the legislation are to conduct an environmental assessment of their facility and propose ways and means of improving the level of performance of their set-ups. These Environmental Management Plans are then submitted to the EPA for review. The commitments made by the management of the set-ups are to be implemented and the goals achieved within three years, after which another plan must be submitted. The new

103
industrial set-ups are also required to comply with this procedure after 18 month in operation.
3. Industries are also requested to submit monthly returns of their environmental parameters monitored to the EPA. Comments are also expected in cases where values exceed certain limits and what measures are in place to check the discrepancy.
4. Industries are also requested to submit Annual Environmental Report to the Agency, indicating how they have performed environmentally, what have been achieved, what went wrong and what needs to be done.
Using these instruments, the Agency is able to measure the level of compliance. For example, the number of Environmental Impact Assessment Reports received for a particular sector within a certain time frame is used as an indicator of the level of compliance, especially when the figures are compared with another sister organisation responsible for regulating that sector.
3.2 Enforcement indicators
3.2.1 Compliance promotion
The Agency is working in this area largely through partnership with state organisations that have a similar task of ensuring compliance and enforcement of other legislation. In working in partnership, the Agency hopes to tap into their resources in order to achieve its compliance and enforcement goals. With this partnership approach, the Agency has begun forming strong ties with other state regulatory organisations that ensure that environmental legislation is complied with.
An example, the Agency has established this type of a strong link with the Energy Commission. The Energy Commission is the state institution responsible for ensuring that investment in the energy sector is properly controlled. The Commission is therefore responsible for licensing all investors in the energy sector and for regulation of their activities thereafter. EPA now has a good working relationship with the Commission. The Energy Commission now ensures that all investors in the energy sector of the country who are to be licensed by the Commission first obtain an environmental permit before it processes their application for license. The Commission has even gone a step further toward making an environmental permit mandatory for all applicants by including it in a new regulation (Petroleum Regulations) the Commission is about to send to parliament for enactment as a law. In this new regulation, the environmental permit is one of the items that must be submitted together with the application form for license. Failure to submit an environmental permit with your application means that your application cannot go further. Thus investment in the energy sector means compliance with LI 1652 and its parent Act.
In furtherance of this partnership approach, the Agency has stated a programme in which officers of the Agency, the Ghana Police officers, state Attorneys and Magistrates/Judges are brought together in a workshop. The main aim of the programme is to help the non-environmental experts in the group to understand and appreciate environmental issues, environmental management principles and environmental offences. The environmental officers in the group are also trained to understand evidence-gathering procedures, presentation of evidence in court and court etiquette. The other aim of the programme is for the environmental officers to establish rapport with these law enforcement experts so that whenever they need assistance in their work as compliance and enforcement officers they can call on these experts. Mock trials (Moot Court) are also included as part of the programme.
104
3.2.2 Compliance monitoring
This is achieved through the Environmental Quality department of the Agency. This department, in collaboration with officers from other departments within and outside the Agency, carries routine monitoring of certain environmental parameters, especially within the aquatic environment and industrial effluent. The results obtained, for example for the industrial set-ups, are used to crosscheck the monthly return values submitted by the industry.
3.2.3 Non-Compliance Response
The Environmental Inspectorate and Legal departments of the Agency (the two departments merged to form Legal, Compliance and Enforcement Department in January 2002) are primarily responsible for responding to incidents of non-compliance. By totalling the number of public complaints received, various legal actions carried out and number of site visits undertaken within a particular time frame, an indication is given as to the level of non-compliance issues.
4. Conclusion/challenge
The future of Ghana’s environment is thus not gloomy. The real challenge will be how to:
• Get the politicians to regard the environment as one of the national priority areas;
• Review existing and enact new legislation to reflect current trend of events; and
• Get financial and technical support from the international communities for regulating the environment.
This will ensure adequate allocation of resources for capacity building and utilisation in environment management.

105
STATUS OF ENVIRONMENTAL COMPLIANCE AND ENFORCEMENT OF POLLUTION CONTROL LAWS IN INDIA
by Babu Sengupta20
In India, in recent years, a number of activities in the field of Environmental Compliance and Enforcement of Pollution Control laws have been initiated. Some of the important activities are as follows:
• Enforcement of standards (emission and effluent) in 17 categories of high polluting industries.
• Enforcement of effluent standards in industries that are directly discharging their effluent into rivers and lakes.
• Enforcement of Pollution Control Standards in industries discharging effluent directly or indirectly into the rivers Ganges, Yamuna, etc.
• Enforcement of an action plan for control of air and water pollution in 24 critically polluted areas identified by Central Pollution Control Board/Ministry of Environment and Forests.
• Enforcement of an action plan to improve air quality in 13 major cities and towns in India.
• Enforcement of fuel quality specifications for liquid fuel (gasoline, diesel, etc.) pursuant to the road map prepared by an interministerial group.
• Enforcement of clean coal technologies for air quality improvement.
• Enforcement of fly ash management program.
20 Member Secretary, Central Pollution Control Board, Ministry of Environment and Forests,
Government of India, New Delhi, India. Mr. Sengupta may be contacted at [email protected].

106
To measure the results of the above enforcement programs, suitable environmental indicators are being developed in India. Also, to measure the improvements nationwide, programs on air and water quality monitoring have been launched. The details of above programs and result achieved so far may be accessed by contacting Mr. Sengupta.

107
ENVIRONMENTAL ENFORCEMENT AND COMPLIANCE INDICATORS IN THE REPUBLIC OF KAZAKHSTAN
by Nurlan Yeskendirov21
1. Overview of current performance assessment system
Kazakhstan uses “enforcement and inspection indicators” to analyse its enforcement and compliance promotion practices. Key performance indicators include the number of inspections, violations, injunctions, fines/claims, and lawsuits. These indicators are designed to reflect the performance of enforcement authorities of the Ministry of Environmental Protection (MEP) and to provide information on environmental regulatory compliance in the Republic of Kazakhstan (RK).
The results of enforcement and compliance promotion activities are shown in the background reports prepared by the Department for State Environmental Control of the MEP biannually. In addition to the information for the current period, the reports show the dynamics of indicators for the past years, which serve as an additional tool of analysis.
Despite a large number of potential users of the system, the existing set of indicators is meant mostly for internal use by the MEP, in particular for managerial purposes. If the set of indicators were more adequate, comparative analysis of time series and accurate interpretation of data could reveal changes in the compliance behaviour (intermediate outcomes) and the state of environment (outcomes), resulting from enforcement. This would make it possible to modify enforcement strategies or the regulatory requirements. The MEP leadership is interested to pursue such an improvement of the indicator system.
1.1 System users
Key users of the performance assessment system for enforcement activities are:
• Ministry of Environmental Protection (MEP) and its units, including the Department for State Environmental Control (DSEC) and regional departments of environmental protection: The information is used to assess the performance of regional departments with a view to formulating the environmental policy and planning the compliance assurance activities.
• Statistics Agency of the Republic of Kazakhstan (RK): Based on the received data, the Agency prepares background papers for the Government.
21 Regional Environmental Centre for Central Asia.

108
• Parliament: The information can be used to take legislative and political decisions.
• President’s Office: The information can be used to take organisational, political, and legislative decisions.
• Government: The information can be used to take political and organisational decisions in the field of environment and budget planning.
1.2 Two sets of indicators
In Kazakhstan, two sets of indicators are distinguished as used by:
• The Department for State Environmental Control of the MEP,
• Statistics Agency of the RK.
Public availability of information is an important feature. While the background reports of the DSEC focus on intra-departmental objectives, those of the Statistics Agency of the RK focus to a greater extent on the needs of the Government, Parliament of the RK, and the general public (although in the latter case the reports are made available for a fee).
1.3 Indicators used by the Department for State Environmental Control of the MEP
The DSEC prepares a biannual “Report on Enforcement and Compliance Promotion Activities of Area Environmental Authorities” which aims at assessing the performance of enforcement activities in RK, at the national and local levels. The report is prepared based on the departmental statistical form 1-6GKS.
These biannual reports comprise seven sections:
• Air protection;
• Water protection;
• Land protection;
• Waste disposal and recovery;
• Storage, transportation, use, and recovery of mineral fertilisers and pesticides; and
• Radiation safety.
1.4 Control over Flora and Fauna Protection.
Initial information comes from the regional departments and includes:
• Number of inspections;

109
• Number of inspections held jointly with other inspectorates;
• Number of detected violations;
• Number of issued injunctions;
• Number of suspended facilities;
• Fines (imposed/levied); and
• Claims (filed/levied).
1.5 Number of lawsuits referred to the public prosecutor (including criminal ones and through court)
In addition, the DSEC develops derivative indicators, including:
• Average number of inspections per inspector;
• Percentage ratio of land, air, water, and fauna protection inspections.
The following information is also analysed:
• Violations of environmental legislation (detected violations, issued injunctions, executed injunctions). Time trends of violations and the number of issued and executed injunctions are presented;
• Measures taken to restrict or suspend facilities due to violation of environmental legislation;
• Main enforcement tools applied. Such analysis is carried out based on the indicators for imposed and collected fines by medium (air, water, land, and waste). Trends in fines that were imposed and collected are shown by the number of fines and collected amount (in tenge);
• Inspection quality and efficiency; and
• Reasons for which the performance of regional departments has declined or improved.
1.6 Indicators used by the Statistics Agency of the RK
The Statistics Agency of the RK publishes the Natural Resources and Environmental Protection Series with the following sections:
• Air protection;
• Main indicators of toxic waste management in the RK;
• Current environmental expenditures in the RK; and
110
• Environmental accidents, suspended facilities, and violations of environmental legislation.
The section on environmental accidents, suspended facilities, and violations of environmental legislation directly relates to the enforcement and compliance promotion system in the RK. This statistical report focuses on the following indicators:
• Accidental release of pollutants (number of cases and amount of damage claims);
• Number of suspended production processes due to violation of environmental legislation;
• Reduction in the release of pollutants due to suspension of a production process;
• Number of lawsuits referred to the public prosecutor and number of officials and natural persons held liable; and
• Amount of levied fines and claims related to environmental violations;
• The indicators in this statistical report are presented by regions (totals for the RK and by region) and by environmental medium (water, air, and land).
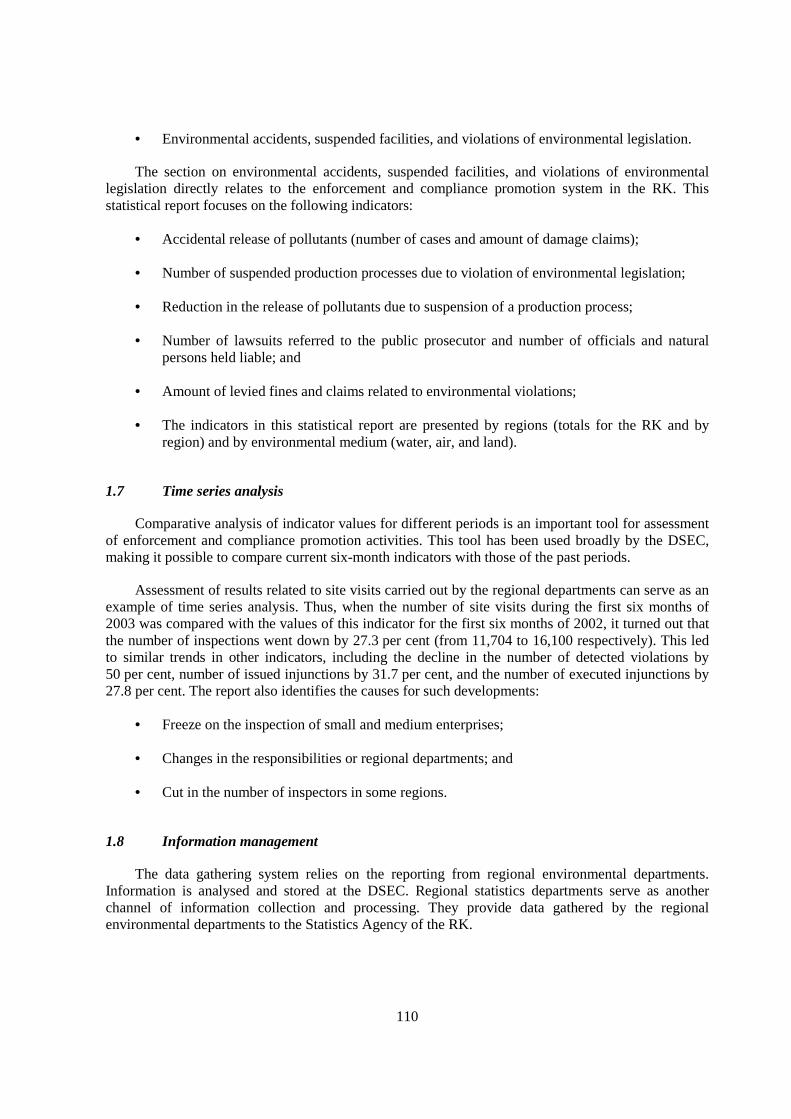
1.7 Time series analysis
Comparative analysis of indicator values for different periods is an important tool for assessment of enforcement and compliance promotion activities. This tool has been used broadly by the DSEC, making it possible to compare current six-month indicators with those of the past periods.
Assessment of results related to site visits carried out by the regional departments can serve as an example of time series analysis. Thus, when the number of site visits during the first six months of 2003 was compared with the values of this indicator for the first six months of 2002, it turned out that the number of inspections went down by 27.3 per cent (from 11,704 to 16,100 respectively). This led to similar trends in other indicators, including the decline in the number of detected violations by 50 per cent, number of issued injunctions by 31.7 per cent, and the number of executed injunctions by 27.8 per cent. The report also identifies the causes for such developments:
• Freeze on the inspection of small and medium enterprises;
• Changes in the responsibilities or regional departments; and
• Cut in the number of inspectors in some regions.
1.8 Information management
The data gathering system relies on the reporting from regional environmental departments. Information is analysed and stored at the DSEC. Regional statistics departments serve as another channel of information collection and processing. They provide data gathered by the regional environmental departments to the Statistics Agency of the RK.
111
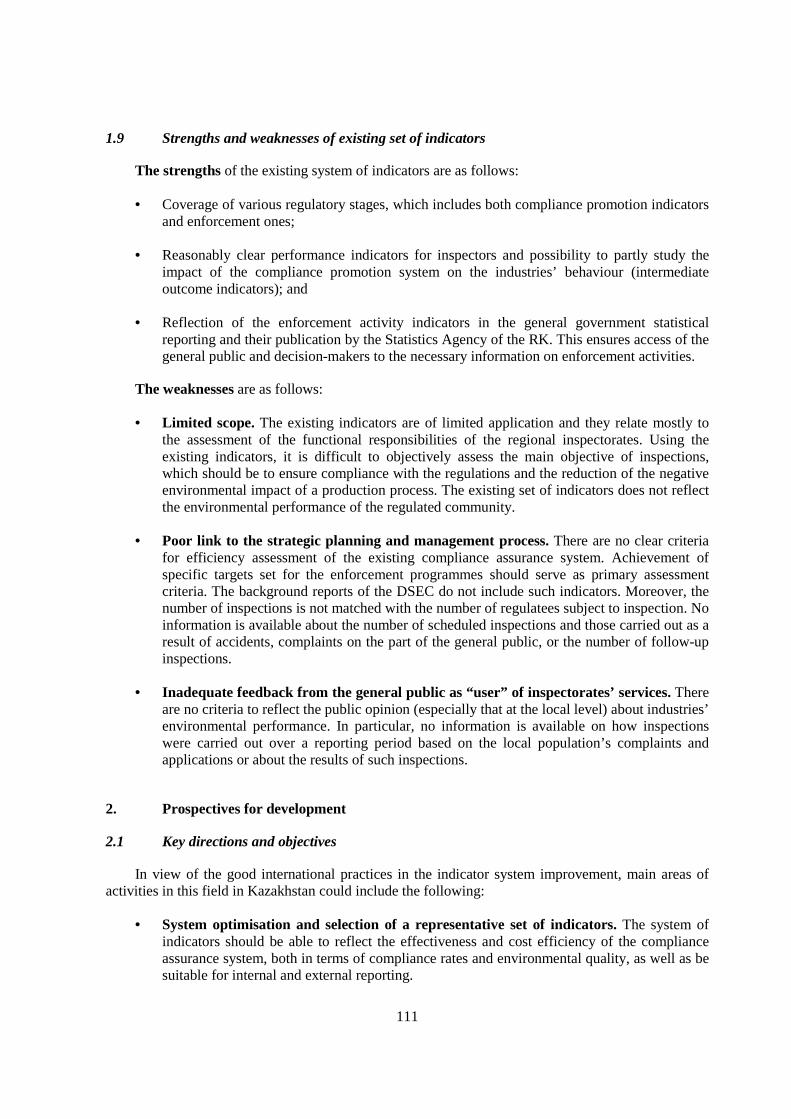
1.9 Strengths and weaknesses of existing set of indicators
The strengths of the existing system of indicators are as follows:
• Coverage of various regulatory stages, which includes both compliance promotion indicators and enforcement ones;
• Reasonably clear performance indicators for inspectors and possibility to partly study the impact of the compliance promotion system on the industries’ behaviour (intermediate outcome indicators); and
• Reflection of the enforcement activity indicators in the general government statistical reporting and their publication by the Statistics Agency of the RK. This ensures access of the general public and decision-makers to the necessary information on enforcement activities.
The weaknesses are as follows:
• Limited scope. The existing indicators are of limited application and they relate mostly to the assessment of the functional responsibilities of the regional inspectorates. Using the existing indicators, it is difficult to objectively assess the main objective of inspections, which should be to ensure compliance with the regulations and the reduction of the negative environmental impact of a production process. The existing set of indicators does not reflect the environmental performance of the regulated community.
• Poor link to the strategic planning and management process. There are no clear criteria for efficiency assessment of the existing compliance assurance system. Achievement of specific targets set for the enforcement programmes should serve as primary assessment criteria. The background reports of the DSEC do not include such indicators. Moreover, the number of inspections is not matched with the number of regulatees subject to inspection. No information is available about the number of scheduled inspections and those carried out as a result of accidents, complaints on the part of the general public, or the number of follow-up inspections.
• Inadequate feedback from the general public as “user” of inspectorates’ services. There are no criteria to reflect the public opinion (especially that at the local level) about industries’ environmental performance. In particular, no information is available on how inspections were carried out over a reporting period based on the local population’s complaints and applications or about the results of such inspections.
2. Prospectives for development
2.1 Key directions and objectives
In view of the good international practices in the indicator system improvement, main areas of activities in this field in Kazakhstan could include the following:
• System optimisation and selection of a representative set of indicators. The system of indicators should be able to reflect the effectiveness and cost efficiency of the compliance assurance system, both in terms of compliance rates and environmental quality, as well as be suitable for internal and external reporting.

112
• Strengthening the link with the planning process. Setting objectives and measurable targets of enforcement activities should serve as a reference for the assessment of performance and funds used in the implementation of the enforcement programmes.
• Orientation of environmental information on the final users and ensuring the access to information. Public availability of information should be a crucial factor influencing the compliance behaviour of industries. Use of modern information technologies should be expanded, which will help reduce the time necessary to collect, process, and disseminate information.
• Expansion of uses. The indicators, or at least some of them, should be used by the inspected industries, for example, in the self-monitoring, internal audit of the environmental management systems, ISO14001, etc.
• Development of independent assessment institutions for government enforcement and compliance promotion programmes.
2.2 Incentives to improve the existing system
There are a number of incentives to improve the existing system, including:
• Need to better manage the compliance assurance programmes. The system of indicators should serve as a strategic and operational management tool, and ensure uniform quality of inspection and enforcement activities across regions, especially as major functions are delegated from the central to the local level. Performance indicators should help objectively assess and secure budget funding of the inspectorates at the national and local levels.
• Need to enhance confidence in the system and its authority. There is a need for understandable and credible information about the environmental efficiency of enforcement activities in the RK in order to enhance public confidence and gain recognition from other public authorities. Awareness raising and public involvement in compliance assurance, in particular, involvement of most active non-governmental organisations, could be leveraged to influence the decision-making at the public authorities’ and industry level, and promote the improvement of the system of indicators and reporting. Experience of other countries, for example, the US, has shown that enhanced interest in the inspectorates’ activities on the part of the legislative branch could be one of the most effective incentives to improve the system of indicators.
• Need to encourage responsible industry behaviour. Indicators should be beneficial for those industries who seek to show environmentally-responsible behaviour. Conversely, bad performers will demonstrate their irresponsible behaviour to the general public. An improved set of publicly available indicators will help considerably raise the impact of public opinion, including NGOs, on the industries’ behaviour.
2.3 Reform approaches and phases
Development of a comprehensive programme to reform the whole systems of enforcement and compliance promotion, with a special focus on the performance indicators, would be a realistic and efficient scenario for the indicator system improvement. In order to develop the reform elements,
113
coordination and consultation with various stakeholders is necessary. In addition to public authorities, these should also include industries, concerned general public and NGOs.
Several issues should be taken into account when improving indicators in Kazakhstan, e.g.:
• Opinion of stakeholders, particularly that of the general public. The implementation of the Aarhus Convention on Access to Information, Public Participation in Decision-making and Access to Justice in Environmental Matters depends largely on the availability of objective and reliable information about economic activities’ impact on the environment and human health. At the same time, enforcement authorities should pay adequate attention to the impact of public opinion on industries’ behaviour.
• Possibility to get reliable and clear information about industry, behaviour patterns of companies, their environmental performance, and efficiency of environmental policy tools.
• Possibility to assess the efficiency and effectiveness using both qualitative and quantitative indicators. In particular, it would be desirable to assess the influence of the citizen’s compliance monitoring and enforcement on compliance rates, environmental investment, development of efficient industrial environmental self-monitoring systems, design and construction work in industrial ecology, and development of environmental management and audit systems at industry level.
• Reasonable level of costs of getting necessary information about the indicators, i.e. finan-cial feasibility. To this end, the number of indicators should be limited, and data gathering, handling and analysis methods should be optimised.
The reform process can consist of the following phases:
• Analysis of limitations of the existing set of indicators;
• Development of an improved set of indicators, taking into consideration the opinion of all the stakeholders;
• Formulation of the strategy to improve the system of indicators, if possible – as part of a comprehensive reform of the compliance assurance system in the RK;
• Implementation of projects in pilot regions, then nation-wide reform; and
• Ex-post assessment of results and adjustment of the system, if necessary.
The optimised set of indicators could be tested as part of a pilot project. This will allow avoiding and/or correcting possible flaws of the planning stage. It is crucial to ensure the training and involvement in the reform process of regional environmental inspectorates, and the development and dissemination of a guide on the application of indicators.

114
Possible impediments
The blueprint for reform will depend to a great extent on the restrictions imposed by the organisational and legal framework, and technical capacity of the inspectorates. The following factors should be taken into account:
• Low reliability of ambient monitoring data and of self-monitoring results provided by the regulated community;
• Limited financial capacity of the inspectorates and their poor logistic support (laboratory facilities, guidelines, etc.);
• Declining competence of the inspectorates’ staff and shortage of staff members in some regions of Kazakhstan;
• Shortage of legal documents, research, and background papers on environmental protection issues; and
• Inadequate operational procedures, for example: (a) integrated inspections may only be held annually; (b) ban of unannounced on-site visits; (c) need to coordinate on-site visits with the regulatees and, in some events, restricted access to facilities.

115
STRATEGIC INFORMATION SYSTEM OF MEXICO’S ENVIRONMENTAL AGENCY
by Alejandra Goyenechea22
1. Background
Three years ago, when Vicente Fox, the President of Mexico, published the “National Development Plan 2000 – 2006,” he instructed all the federal agencies to start working in what shall become “the National Indicators System.”
At Procuraduría Federal de Protección al Ambiente (Mexico's Environmental Agency, referred to as PROFEPA), we went to work on the design of a system that will allow us not only to better exploit the data generated from our operation throughout the country, but most of all, to offer a tool that will help and support our executives in their planning, monitoring and decision making process.
With PROFEPA’s Strategic Information System (PSIS), the entire government, from the Procurator to the General Directors, can constantly check on the progress of the main strategies to achieve our objectives and goals committed by the President.
The challenge was not only to integrate and to use the latest business intelligence technology, but also to build and offer a true and useful resource to those users that have little or no technical skills, but are experts in the field of protecting the environment and enforcing the law.
2. Brief description of the system
The collection of indicators that can be analysed on the PSIS have been defined by each and every one of the main areas of PROFEPA. This was perhaps the most important and biggest key for success. Of course, in the beginning, it took a lot of learning and analysis to reach the deep understanding necessary to come up with true useful indicators. In the first three months of this process, the total number of indicators grew to well above 300, a number impossible to deal with in real life. We found, however, that we were mistaking simple data or numbers for indicators. After eight months, the number of indicators was reduced to 40. Today, we have 50 hard indicators measuring everything from our execution in the field, to the productivity of our personnel in the field and offices, all the way to the presidential commitments that define our mission as a public institution.
As I said, involving all the functional areas of the PROFEPA was the key for success. In the end, it is not only a matter of technology, but a matter of controlling the business, that is putting the right information in the right hands and the right time.
22 Director for International Affairs, PROFEPA, Mexico.

116
Nevertheless, the cultural resistance we faced was significant; many people had to leave the organisation because they were not willing to accept this transparency and open culture. This is exactly what President Fox is pushing for in his government.
The PSIS has been recognised as the best product of its nature by private companies such as Microsoft, and was recently recognised with the “Innova Award 2003” as the best information technology project in the Federal Government.
3. Benefits
• With the PSIS we have been able to compare the efficiency and performance of our offices and representations in each one of the 32 states, allowing us to reassign human and material resources to those zones and territories that need them the most.
• We have been able to detect deviations and threats before they occur or before they become an emergency, allowing us to implement contingency plans on time.
• By drilling through the information and reports on the PSIS, we can easily isolate conflict points within a state or detect bottlenecks in some procedures.
• The fact that the whole chain of command has access to exactly the same information and reports allows us to establish a level of communication and coordination never before seen in the PROFEPA.
• By using the “productivity indicators,” we can identify which inspectors and lawyers are the best, allowing us to motivate them and use their experience to teach others.
• We have been able to promote the cultural change that was much needed in order to become more transparent and efficient in our work.
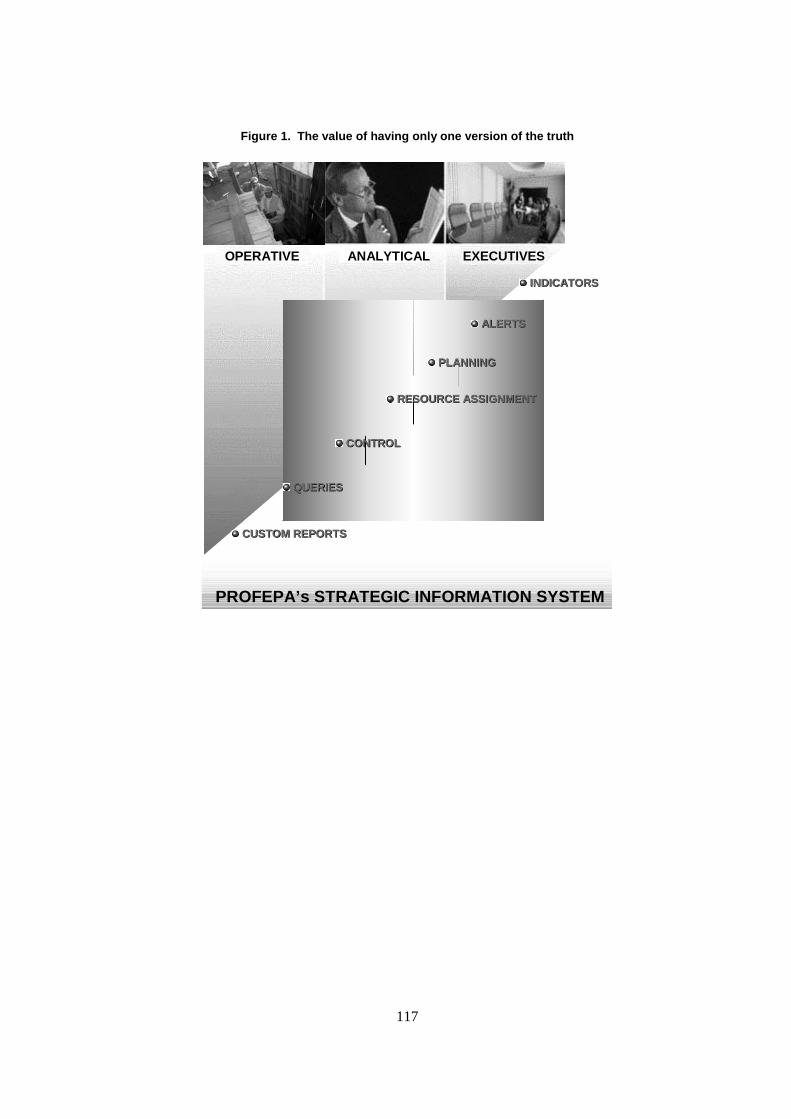
117
Figure 1. The value of having only one version of the truth
EXECUTIVESEXECUTIVESANALYTICALANALYTICALOPERATIVEOPERATIVE EXECUTIVESEXECUTIVESANALYTICALANALYTICALOPERATIVEOPERATIVE EXECUTIVESEXECUTIVESANALYTICALANALYTICALOPERATIVEOPERATIVE
PLANNINGPLANNING
INDICATORSINDICATORS
RESOURCE ASSIGNMENTRESOURCE ASSIGNMENT
ALERTSALERTS
QUERIESQUERIES
CUSTOM REPORTSCUSTOM REPORTS
CONTROLCONTROL
PROFEPA’s STRATEGIC INFORMATION SYSTEM

118
ANNEX 1. SOME OF PSIS MAIN INDICATORS
Area Indicators
Industrial Inspection • Efficiency rating on the usefulness of resources.
• Industries with dictated measures and with a current administrative process.
Natural Resources • Level of accomplishment in the environment legislation.
• % of inspection visits in critical areas.
• % of operatives aimed to stop illegal deforestation with special funding.
• Number of citizen participation committees in critic zones.
Environmental Auditing • % of high risk industries enrolled.
• % of high risk vertical industries enrolled.
•
Denunciations and Complaints • Citizen participation increase factor.
• Efficiency rating in the attention to denunciations.
• % of denunciations with and installed procedures
Administration • Spent budget against programmed budget for Inspectors in critical zones.
• Cost of inspections per zone, per inspector, per state.
Productivity • Attended denunciations against attended denunciations on time.
• Number of inspections per state against number of inspectors and territorial extension.
• Number of resolutions per state against number of lawyers.

119
ANNEX 2. IMPACT ON THE ACTIONS
Achievement Year 2000 Years 2001 - 2003
Critical Forest Zones Rescued 0 11 out of 100
Forest zones with “lawless” problems 9 4
Number of rescued wildlife specimens 37,000 324,000
Permanent vigilance program in priority natural protected areas 0 29 out of 52
Permanent vigilance programs in routes and roads used for traffic of illegal species and precious woods
0 4 out of 6
% of “high risk industries” inspected 2% 57%
Number of “high risk industries” enrolled in the “National Environment Auditing Program”
930 1,179

120

121
ENVIRONMENTAL COMPLIANCE AND ENFORCEMENT INDICATORS IN THE NETHERLANDS
by Angelique A.A. Van der Schraaf and Jan Van Der Plas23
1. Introduction
The final purpose of an environmental policy is reducing the load on the environment and eliminating harmful effects on humans, animals and vegetation. Legislation is one of the tools to reduce the effects. In the Netherlands there are about 600 pieces of environmental legislation in which the Inspectorate for Housing, Spatial Planning, and the Environment has a task to enforce compliance.
In order to get a grip on which task should be performed with priority and which not, and how to enforce compliance in a smart way, the Inspectorate has developed a Compliance Strategy. This Compliance Strategy is based on risk and compliance indicators, as well as knowledge of reasons for non-compliance. The strategy can be seen as a way to make compliance transparent and to use the newly developed indicators for several purposes: doing the right things (priority setting), doing the things right (‘smart’ enforcement) and for accountability.
2. The compliance strategy
Compliance in the Dutch Compliance Strategy is seen as the behaviour that a regulatee shows in response to regulatory requirements. The keyword is behaviour. Compliance enforcement is focused on changing the behaviour of the regulatee so he or she will comply according to the requirements in the legislation.
A regulatee has certain reasons to respond positively or negatively to regulation. The negative responses are summarised in the so-called Table of eleven, a broadly accepted and used list of reasons for non-compliance in the Netherlands. When compliance behaviour and the reasons for non-compliance are known, it is possible for inspectors to enforce compliance in a smart way (to be effective and efficient).
One of the first activities for the Compliance strategy was the identification of all the pieces of environmental legislation. Next, the regulatees were identified for each piece of environmental legislation. On this regulatee-level the present state of risks and compliance behaviour were identified and classified in risk and compliance indicators. The level of the compliance indicators was estimated
23 Ministry of Housing, Spatial Planning and the Environment, Post box 16191, 2500 BD The Hague,
The Netherlands, tel. #31-703393939, fax: #31-703391299, email: [email protected], [email protected]

122
and is based on expert knowledge. The compliance indicator is a measure for non-compliance. There are 4 classes of compliance gap-indicators: good (90-100%, class 1), sufficient (90-80%, class 2), mediate (80-60%, class 3) and bad (< 60%, class 4). The compliance indicator is a measure of the necessary compliance efforts the Inspectorate has to make.
Risk indicators were developed in the same way: risks were estimated in several expert workshops per piece of environmental legislation per regulatee. The estimates were based on the aspects of public health, safety, sustainability and social factors in event the Inspectorate should not enforce compliance. There are also 4 classes of risk indicators distinguished: very high, ++ (= class 4); high, + (= class 3); mediate +/- (= class 2); and low, – (= class 1).
When the risk indicators and the compliance indicators per legislation form are put in a 2 x 2 matrix, a forceful tool is available to indicate priorities and non-priorities. Classes 3 and 4 are indicated as high risks/high non-compliance; classes 1 and 2 as low risks and low non-compliance. See Figure 1.
Figure 1. Risk and Compliance Matrix
3. Expert meeting
Indicators are estimated following the Delphi Method: several expert meetings were held to ensure the estimates of the experts were objective. The expert panels were supplied with several pieces of monitoring indicator data:
Inputs:
− # of compliance promotion officers (policymakers).
− # of compliance enforcement officers.
− investments in training, IT, sampling etc. (in €).
− # of days planned for compliance: promotion and enforcement.
Outputs:
− # of compliance promotion campaigns.
− # of inspections.
− # of prosecutions.
− # and height of penalties.
risk high low low high non - compliance

123
− # of days realised for compliance: promotion and enforcement.
Intermediate outcomes:
− Compliance rates.
− Risk rates.
Final Outcome:
− Ambient load of pollutants in air and water by a Pollutant Release and Transfer Register system
− Environmental effects monitoring in the yearly State of the Environment and State of Nature reports of the State Institute for Public Health and The Environment. The final outcome indicators are of course input for the next expert meeting.
All indicators are tools the expert can use to give his or her impression on the state of compliance and enforcement of Dutch environmental legislation and thereby develop a base for decision making for compliance management.
In the Inspectorate Year programme 2004, objectives have been set for reducing compliance gaps for several priority tasks. The challenge will be to find effective ways to reach the established objectives. Within the Compliance Strategy programme there are secondary programmes to support this challenge. A special programme was set up to provide the inspectors with sophisticated tools to reach the objectives (Smart Enforcement). In this programme, toolboxes will be designed per reason for non-compliance to establish an ideal intervention mix to enforce compliance. Another supporting programme will indicate whether the results are within reach of the policy objectives (compliance evaluation: ex-ante and ex-post).

124

125
ANALYSIS OF SYSTEM OF ENVIRONMENTAL ENFORCEMENT AND COMPLIANCE INDICATORS IN THE RUSSIAN FEDERATION
by Vladimir Shwarz24
1. Introduction
In the Russian Federation, government’s regulatory functions include environmental enforcement, which is defined as a comprehensive system of activities carried out by competent authorities to assure compliance with environmental legislation (including statutory requirements, rules, and standards). Recently, competent authorities responsible for the enforcement of environment protection legislation have been merged with those dealing with the use of natural resources. Since 2001, the Ministry of Natural Resources of the Russian Federation (MNR of Russia), a federal executive authority, administers the environmental enforcement system. Prior to 2001, the environmentally-related enforcement functions were performed (at various points) by three or four agencies, which managed the use of individual natural resources (water, forests, mineral resources) and the protection of the environment against pollution and degradation of ecosystems.
In order to perform its enforcement functions, the MNR of Russia has a State Service for Control over Use of Natural Resources and Environmental Protection (Rosnaturecontrol of the MNR of Russia). Rosnaturecontrol of the MNR of Russia performs only inspection and, to some extent, information functions. No other regulatory functions, such as lawmaking, permitting, licensing, environmental management or accounting, falls under the responsibility of Rosnaturecontrol.
The organisational structure of environmental enforcement is determined by the current legislation and comprises:
• Control over use and protection of land (including soils);
• Environmental control at sea and offshore (including control over use and protection of wildlife and natural resources at sea and offshore);
• Control over air protection (including ozone layer);
• Control over use and protection of fauna;
• Control over the management of protected areas;
24 Deputy Head of the Department of Organization and Administration of Public Control over Use of
Natural Resources and Environmental Protection, Ministry of Natural Resources of the Russian Federation.

126
• Control over waste management; and
• Control over compliance with licensing requirements.
The enforcement of legislation related to the use of water resources, forests and underground (mineral) resources are traditionally seen as separated from environmental enforcement. This separation has been quite subjective and could be explained by the family tree of legislation and institutions over several decades. Nowadays, all prerequisites are in place to integrate the various branched of environment-related enforcement, and to concentrate them in a single federal executive agency. This is well demonstrated by the integrated approach towards inspection that was embraced by Rosnaturecontrol in recent years.
Officials of the MNR of Russia, known as “federal governmental inspectors,” assess compliance with regulatory requirements. There are approximately 2,400 inspectors at present, of which about 1,500 are environmental inspectors and others are geological, water, and forest inspectors.
The organisational structure of the Rosnaturecontrol comprises:
• Subdivisions of the Ministry’s federal office: Department of Organisation and Administration of Public Control over Use of Natural Resources and Environmental Protection, and Division for Control at Sea and Offshore (about 40 staff members).
• Inspection units in seven departments of public control and long-term development in the field of use of natural resources and environmental protection (DPCs) in the federal regions of the Russian Federation (50 to 70 inspectors in each department).
• Inspection units in eighty-nine Main divisions (Divisions) for Natural Resources and Environmental Protection (MDNRs/DNRs) in the constituent entities of the Russian Federation (15 to 25 inspectors in each Main Department, and 10 to 15 inspectors in each Department).
• Inspection units in sixteen Water Management Departments (three to four inspectors in each WMD).
• Nineteen specialised sea inspectorates (a total of 500 staff members).
In addition, under the Federal Environmental Protection Law, executive authorities of the subjects of the Russian Federation are authorised to conduct compliance monitoring. The scope of activity of federal and sub-national inspectorates depends upon the authority to check a certain type of regulated facility, rather than upon specific functions (the largest facilities, which have environmental impact in two or more constituent entities of the Russian Federation, as well as those administered at the federal level under the Constitution of the Russian Federation, are subject to the federal control). Facility distribution criteria are set forth by a government regulation. However, the absence of similar provisions in the laws on protection of specific media (air, water, land, etc.) hampers the implementation of this principle of division of responsibilities.
It is expected that the administrative reform underway will expand the principle of division of responsibilities between federal and regional executive authorities to all forms of enforcement. It is expected that laws and regulations governing this issue will be amended accordingly.

127
1.1 Types of Inspection
Inspections carried out by the staff of the MNR of Russia can be routine (i.e. conducted under an annual plan approved by the head of a relevant body of the MNR of Russia and coordinated with a higher body of the Ministry) or reactive. Routine inspections account for 60 to 75 per cent of the working time. Reactive inspections are usually carried out following orders by supervisory bodies (such as the Public Prosecutor), inquiry of a Member of Parliament, request/complaint of a legal entity or natural person, in connection with criticism in mass media, or if negative impact on the environment is detected and requires urgent intervention.
Inspections can be integrated or targeted. Integrated inspections cover all aspects related to the use of natural resources and environmental protection; targeted inspections focus on specific areas. Recently, most scheduled inspections have been integrated, except for the follow-up inspections. The share of integrated inspections in the number of unscheduled site visits is much lower.
Also inspections can be facility-specific or carried out as part of specific enforcement campaigns. During a facility-specific inspection, activities of a concrete user of natural resources are checked for compliance with certain general binding requirements and permit conditions. Enforcement campaigns aim to detect violations of specific legal requirements by the whole regulated community, or parts of it, which are not identified in advance (e.g. annual campaigns “Clean Air,” “Water Body Sanitary Zone,” “Unauthorised Dumps,” and others).
1.2 Inspection Reports and Inspection Follow-Up Documentation
The format in which inspections are to be documented is set forth by the legislation of the Russian Federation. An individual executive document (order, decree) is issued for conducting each inspection. After each site visit, the inspector prepares a report, and, should violations be detected, they are recorded in this report. An injunction to remove the violations detected during the inspection can be put issued, as a stand-alone document or as part of the inspection report.
If the violation has signs of an administrative offence, the inspector would prepare a record of administrative offence and issue an order to hold administratively liable individuals guilty of environmental violations. In some events, an injunction to suspend or limit facility operations is issued. In the event of a significant (or systematic) offence, an order for shutting down is drawn up. For the criminal offences, materials are prepared and submitted to the police authorities. In the event of failure to fulfil the prescriptions, the materials are referred to the court or the public prosecutor. All inspection and enforcement-related documentation is registered with the body of the MNR of Russia.
2. Description of performance assessment system
2.1 Frequency and content of reporting
Efficiency of inspections conducted by the regional bodies of the MNR of Russia is analysed based on the information provided in the semi-annual and annual reports. Reports of the MDNRs are first summarised in the relevant DPC and then submitted to the supervisory subdivision of the head office of the MNR of Russia. Reports of the water management departments are also submitted there directly. Reports of the specialised sea inspectorates are submitted to the Division for State Control at Sea and Offshore of the MNR of Russia.

128
Recently significant attention has been paid by the MNR of Russia to the creation of modern information systems to support inspection activities. For example, there are plans to make all data of the regional bodies available in the near future on-line at the federal level (head office of Rosnaturecontrol and DPCs). This will ensure rapid access to inspection results.
The content of the inspectorates’ reports is not standardised; however, they need to be consistent with the annual report on the state of the environment. Their compulsory elements are: the inspection indicator tables (the so-called 1-GK form) and data on current operations.
2.2 Inspection indicators
The main quantitative indicators are: number of inspections, number of detected violations, number of issued and executed injunctions, number and amount of imposed and levied fines and other administrative penalties. These indicators ensure the accountability of inspection and are published in the state environmental reports. Semi-annual and annual reports include several other indicators.
In addition to summary data, information is broken down by sectors. For example, as regards control over air quality, information is provided for seven groups of facilities: (1) power generation facilities; (2) industries; (3) agricultural facilities; (4) transport facilities; (5) housing and community amenities facilities; (6) military, defence, and secure facilities and institutions; and (7) other facilities.
As regards control over waste management, information is available for five groups of facilities:
• Landfills for solid household waste, authorised dumps;
• Landfills for industrial waste;
• Sites with sludge storage, tail-end storage, terricones, etc.;
• Facilities engaged in storage and processing of waste, including highly hazardous waste; and
• Other facilities.
The inspectorates’ performance is assessed by comparing absolute indicators. However, it is more common to use specific indicators. In order to conduct a comparative analysis of various supervisory authorities and study the dynamics of absolute indicators of inspectorates’ performance and results of managerial decisions, ratios of absolute inspection indicators are calculated. They may include ratios of detected violations to the number of conducted inspections or percentages of violations by type. In addition the ratios of the number of violations related to absence of authorising documents to the total number of controlled facilities or ratio of detected violations of certain permits to the total number of accounting units of oversight of a given type can be calculated. Percentages of detected violations in the areas of land protection, air protection, waste treatment, fauna, and compliance with the environmental review legislation are also analysed. Indicators for performance of individual inspector are practically not used.

129
Box 1. Annotated list of enforcement and compliance indicators in the Russian Federation
Number of legal entities accountable to a supervisory body, total and for each area of supervision. This indicator cannot be very precise for objective reasons, firstly, due to intensive process of creation, merger, and liquidation of legal entities, and, secondly, due to delayed registration or application for permits.
Number of control units by field of control. This reflects the potential workload during an inspection, proceeding from the need to check compliance with all required authorising documents in the field of use of natural resources (emission permit, license to use mineral resources or water, wood-cutting ticket, or land allocation deed). Different facilities would need different types of authorising documents therefore the value of this indicator will vary among the regulated community and inspectorates.
Specific sets of indicators are provided for the following areas of inspection: ambient air protection; protection of land and peat; use and protection of bio-resources (flora and fauna, hunting, and state of the national parks); waste management; construction, reconstruction, and upgrade of production processed (enforcement of legislation on state environmental review).
Number of conducted inspections, the value of this indicator is determined according to the number of legal entities, the inspection of which is documented by special orders.
Number of facilities inspected over the reporting period and control units checked for compliance, total and broken down by the aforementioned areas of inspection.
Number of detected violations, total and by specific article of the Administrative Code, and injunctions issued.
Number of prepared records on the violation of legislation.
Number of fines imposed for detected environmental violations and the number of levied fines and their amounts.
Number of filed claims for environmental damages and the number of levied claims and their amounts.
Number of lawsuits filed with investigating authorities to initiate a legal action and number of cases referred to the Public Prosecutor.
Number of rulings to suspend or limit an operation.
Total number of inspectors, their breakdown by age and background.
Source: MNR of Russia (2004).
2.3 Information flows
All reporting is submitted by e-mail and in hard copies. At the regional level, a report is developed, which is forwarded to the MNR of Russia and relevant DPC. The received reports are summarised (from six for the Urals Federal Region to nineteen for the Central Federal Region). In addition to the reports from the MDNRs/DNRs, water management departments, and specialised sea inspectorates, the MNR of Russia also receives summaries of seven federal regional reports. On this basis a summary report on Rosnaturecontrol’s activities is prepared.
2.4 Data Users
Management of Rosnaturecontrol and the MNR of Russia are the key recipients and users of information about inspection results. Information about inspection activities also plays an important role when performance of the MNR is assessed by the Government of the Russian Federation. The
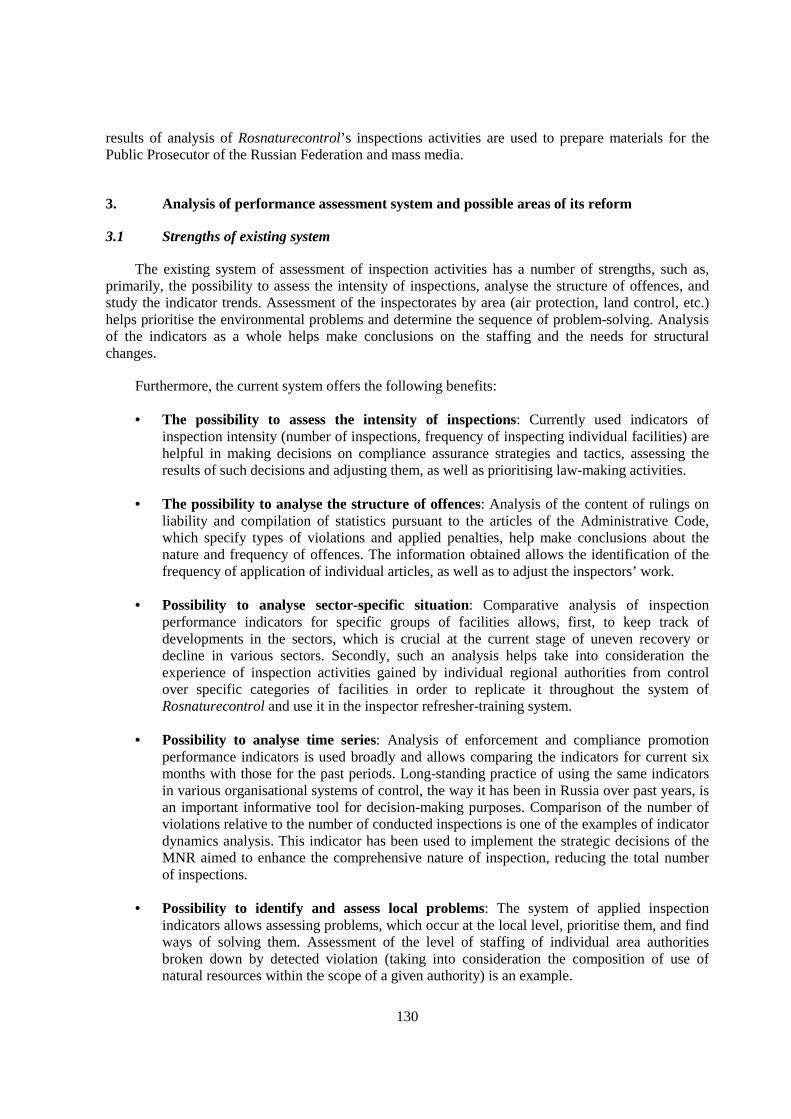
130
results of analysis of Rosnaturecontrol’s inspections activities are used to prepare materials for the Public Prosecutor of the Russian Federation and mass media.
3. Analysis of performance assessment system and possible areas of its reform
3.1 Strengths of existing system
The existing system of assessment of inspection activities has a number of strengths, such as, primarily, the possibility to assess the intensity of inspections, analyse the structure of offences, and study the indicator trends. Assessment of the inspectorates by area (air protection, land control, etc.) helps prioritise the environmental problems and determine the sequence of problem-solving. Analysis of the indicators as a whole helps make conclusions on the staffing and the needs for structural changes.
Furthermore, the current system offers the following benefits:
• The possibility to assess the intensity of inspections: Currently used indicators of inspection intensity (number of inspections, frequency of inspecting individual facilities) are helpful in making decisions on compliance assurance strategies and tactics, assessing the results of such decisions and adjusting them, as well as prioritising law-making activities.
• The possibility to analyse the structure of offences: Analysis of the content of rulings on liability and compilation of statistics pursuant to the articles of the Administrative Code, which specify types of violations and applied penalties, help make conclusions about the nature and frequency of offences. The information obtained allows the identification of the frequency of application of individual articles, as well as to adjust the inspectors’ work.
• Possibility to analyse sector-specific situation: Comparative analysis of inspection performance indicators for specific groups of facilities allows, first, to keep track of developments in the sectors, which is crucial at the current stage of uneven recovery or decline in various sectors. Secondly, such an analysis helps take into consideration the experience of inspection activities gained by individual regional authorities from control over specific categories of facilities in order to replicate it throughout the system of Rosnaturecontrol and use it in the inspector refresher-training system.
• Possibility to analyse time series: Analysis of enforcement and compliance promotion performance indicators is used broadly and allows comparing the indicators for current six months with those for the past periods. Long-standing practice of using the same indicators in various organisational systems of control, the way it has been in Russia over past years, is an important informative tool for decision-making purposes. Comparison of the number of violations relative to the number of conducted inspections is one of the examples of indicator dynamics analysis. This indicator has been used to implement the strategic decisions of the MNR aimed to enhance the comprehensive nature of inspection, reducing the total number of inspections.
• Possibility to identify and assess local problems: The system of applied inspection indicators allows assessing problems, which occur at the local level, prioritise them, and find ways of solving them. Assessment of the level of staffing of individual area authorities broken down by detected violation (taking into consideration the composition of use of natural resources within the scope of a given authority) is an example.

131
• Possibility to use for program objectives: Existing indicators generally allow to engage in short- and long-term planning within the framework of the public oversight system, assess the intensity of operation of individual supervisory authorities, determine the composition of offences, identify the most common and dangerous offences, identify facilities and sectors in need of priority attention on the part of supervisory authorities, and identify loopholes in the legal and regulatory framework for inspection activities, as well as the shortcomings in the setup of authorising activities.
3.2 Shortcomings of existing approaches and possible improvements
The set of indicators used in Rosnaturecontrol of the MNR of Russia focuses largely on assessing the intensity of operation of inspectors and supervisory authorities, including the intensity of application of punitive measures and penalties for violations. The preventive effect of inspection activities is practically not assessed. The area of violations related to ignoring a binding requirement to obtain a permit (latent violations) is taken into consideration inadequately.
Unfortunately, the traditional indicators reflect largely the inspectorates’ activities per se and do not allow identifying the degree of achievement of the main objective, i.e., they do not allow assessing performance as regards environmental improvement. The most important inadequacies of the existing system of assessment of inspection activities include the following:
• Lack of analysis of quantitative indicators of environmental impact and state of environment in the impact area of inspected facility: Positive development in the state of environment is the main target of inspection activities; therefore, dynamics of environmental impact indicators resulting from the execution of inspectors’ specific injunctions is a priority indicator, which should be introduced in the inspection assessment practices. In the existing system of inspection assessment, the indicators of the state of environment are not taken into account. It can only be introduced if the environmental monitoring system is in place, and it requires fundamental long-term and costly study of relationship among the inspection activities, environmental protection activities carried out by the regulated community and the dynamics of indicators of the state of environment. The Russian Federation could only take such an approach at the level of local pilot projects. However, given the system of rate-setting adopted in the Russian Federation, dynamics of the ratio of temporary emissions to total emissions could serve as an indicator of developments in the composition of negative environmental impact.
• No assessment of inspection-planning validity: Until recently, the number of facilities subject to environmental inspections has been several times higher than the actual capacity of the supervisory authorities. The share of facilities inspected annually was about 0.1 per cent of the total number of facilities. It did not seem possible to ensure a rational planning system in such conditions. Moreover, it was impossible to organise an accounting system for the inspected facilities. With the introduction of the principles of dividing inspected facilities between the federal and regional supervisory authorities which happened together with an introduction of an electronic system of accounting for the economic entities and accounting units of oversight, prerequisites are created to implement research-based principles of inspection planning and, therefore, to assess the degree of implementation of such principles.
• Impossibility of assessing the degree of implementation of inspection plans: Total “impersonal” numbers describing performance over a certain period allow for concealing the facts of failure to implement a plan by replacing the inspection of “complicated” facilities

132
with that of the facilities, which are simpler from an inspection viewpoint. At the same time, the total number of conducted inspections matches the scheduled number. Such replacements might be not only due to the shortcomings in the planning and management of an area authority, but also due to objective economic causes (inadequate or untimely funding or excessive load of unscheduled inspections by order of higher authorities). These factors can be taken into consideration by implementing an electronic system of accounting for inspection activities.
• Impossibility of assessing the inspection quality: “Inspection quality” should be understood as the extent to which the inspections detect committed violations, degree of validity and objectivity of imposed requirements and penalties, and extent to which the principles of consistency and coherence are implemented in the inspection activities. All of these indicators are qualitative by nature and they do not have numerical values. However, it is possible and necessary to develop a system of quantitative indicators, which would help indirectly assess the quality of inspections, with subsequent transition from a system of indicators to uniform scoring of the inspection quality.
• Impossibility of assessing the importance of detected offences: This problem could only be solved by the introduction of a system of “surveillance” inspections conducted by higher supervisory authorities with regard to the economic entities already inspected by a lower authority. The implementation of this assessment method could be hampered by a number of limitations set by the Russian legislation on the protection of rights of legal entities and entrepreneurs during the administration of public oversight/surveillance.
• Impossibility of assessing the adequacy of imposed penalties and observance of the principle of inevitable punishment: These indicators are also elements of “inspection quality” assessment; however, they can be assessed without “surveillance” inspections based on selective or continuous analysis of the documents prepared based on the inspection results. A share of decisions taken by the inspectors of an area authority which should be revised (modified, or tightened), in the opinion of the officials engaged in the surveillance, could serve as a quantitative indicator.
• Impossibility of assessing the response of the inspected community to inspections: A system of assessment of the inspected community’s response to the inspections is an extremely important integrated performance indicator of supervisory authorities. It describes the results of their activities through generalised indicators describing the behaviour of the inspected facilities. This system of indicators should cover: the number of claims filed with the court and challenging the decisions of the supervisory authorities, including those satisfied by the court; the number of complaints lodged with higher authorities the share of offences eliminated voluntarily and within a set deadline; and injunctions enforced through court. It should also cover the amount and composition (permitting, design and implementation of environmental activities, expert examinations, organisation and administration of process control, environmental insurance, environmental audit, remuneration and training, funding of research and advocacy in environmental protection, etc.) of costs incurred by users of natural resources in connection with the injunctions of a supervisory authority.
• Impossibility of assessing the socioeconomic implications of inspections: Socioeconomic implications should be understood as change in quite a broad range of qualitative and quantitative indicators describing the socioeconomic conditions in a region within the scope of a given supervisory authority: from the relative investment attractiveness of the region and
133
cost of housing in the impact area of the inspected facilities to the level of awareness of the general public about the activities of the authority and their support for such activities, including the willingness of the general public to participate in the environmental actions initiated by the supervisory bodies. This set of indicators should draw upon opinion polls and dynamics analysis of individual most environmentally-dependent indicators of the economic, sanitary, and epidemiological conditions in the region.
4. Priority measures to improve inspection assessment system
4.1 Sequence of actions
A program of improvement of the system of public environmental oversight performance indicators could comprise the following stages:
• Set specific objectives regarding the inspection management system improvement, which should be described by the quantitative indicators (comparative analysis of area authorities’ performance; optimisation of the number of staff inspectors; enhancement of inspections’ efficiency; and improved image of the inspectorates).
• Build a system of quantitative and qualitative indicators, describing the current condition of the inspection system from the viewpoint of a specific objective and allowing to assess the extent to which it has been achieved.
• List supervisory authorities and officials involved in the development and testing of a system of indicators.
• Establish a system of indirect quantitative indicators, taken into account when determining qualitative indicators on a scoring basis.
• Establish the terms interpreted unequivocally (starting from inspection, offence, injunction, eliminated offence, etc.), determine the meaning, content, and assessment technique for each used indicator.
• Develop the composition of reporting provided by each project participant.
• Assess the current condition of inspections for all the indicators expected to be tested during the project (including those used in the national public oversight system).
• Based on the reported information, carry out continuous analysis of, and identify problem areas in, the inspection activities, as well as develop programs, environmental plans and determine necessary level of funding.
4.2 Important issues to be considered
Reform of the performance assessment system should take into account:
• Number and composition of the inspected community;
• Number of staff inspectors;

134
• Specific features of the national/regional environmental and administrative legal framework;
• Results of monitoring of the inspected facility’s environmental impact and environment around the facility;
• Financial and economic (unrelated to penalties) aspects of inspections and their results;
• Public statistical reporting of the entities engaged in the use of natural resources and subject to inspections;
• Results of environmental and environmental impact monitoring; and
• Ensuring the uniformity of laboratory testing methods.
4.3 Eventual impediments and problems of implementation
The implementation of the improved system of indicators (and, to some extent, its testing) might be somewhat limited by the provisions of the legislation of the Russian Federation on the protection of legal entities’ rights during the administration of public oversight (in particular, ban on conducting the inspections more often than biannually), as well as by possible major changes in the public environmental oversight procedure and powers of public environmental inspectors due to the administrative reform.
The following might be major forecasted problems during the implementation of the public oversight indicators system project:
• Low reliability and representativity of available data;
• Major and poorly formalised influence of structural and organisational differences in the inspected community in various regions involved in testing the indicators;
• Low reliability of information reported by industries on the level of their environmental impact and efficiency of environmental activities and their costs; and
• Limited financial capacity of supervisory authorities and their poor logistic support (laboratories, computation techniques, etc.).

135
DEVELOPMENT AND USE OF COMPLIANCE AND ENFORCEMENT INDICATORS
by Nerina Holden25
1. Introduction to SEPA
The Scottish Environment Protection Agency (SEPA) is Scotland’s environmental regulator. SEPA employs 1,000 staff in 21 locations throughout Scotland. We have a £50 million (approximately USD 83 million) budget, approximately half of which comes from government and half from charges paid to us by those that we regulate. We regulate potential pollution to land, air, and water; the storage, transport and disposal of controlled waste; and the storage and disposal of radioactive waste. We do this by licensing discharges to the environment and then regulating and enforcing the licence conditions. SEPA monitors the quality of Scotland’s environment to ensure that the licence conditions protect and improve the environment.
Our aim is to “provide an efficient and integrated environmental protection system for Scotland which will both improve the environment and contribute to the Government’s goal of sustainable development.” Sustainable development is the overarching principle for all of SEPA’s work. SEPA does this by protecting Scotland’s environment and encouraging a reduction in resource use. We make all our regulatory decisions within the context of sustainable development, seeking synergies between social, economic, and environmental needs. We have been successful in changing our performance emphasis to what we achieve (the real world environmental affect of our activity – our “outcomes”), but we remain challenged because we do not have a full suite of measures for everything we achieve. The six outcomes that SEPA achieves are:
• Minimised, recovered and well-managed waste;
• Good water environments;
• Good air quality;
• Good land quality;
• A respected environment: protected, informed and engaged communities; and
• Economic well-being.
25 Corporate Planning Manager, Scottish Environment Protection Agency.

136
2. Compliance and enforcement indicators
For our six outcomes, we have several measures that help use establish our performance, for example, the weight of municipal solid waste produced per head of population; rivers classed as poor or seriously polluted; mass emissions to air from industry; and flood warning readiness. Our corporate plan has more detail on these, and other measures (http://www.sepa.org.uk). For some of our outcomes, our measures are good. For example, for both “minimised, recovered, and well-managed waste” and “good water environments,” we have good data. Waste produced, recycling and composting figures, and amount of waste going to landfill give a good picture of progress; for water, we have a classification scheme for assessing our rivers, estuaries, and coastal waters. For other outcomes, our measures are developing and are a challenge for us. How much will it cost us to collect the right information and can we afford it? Do others collect the information and can we use it for our purposes? Also, how many sets of information are required to give a clear picture of, for example “good land quality” or “good air quality”? If there are too many sets, a clear picture of progress may be hard to see.
Our success at regulating is measured by the percent of operators who comply with the licences conditions set. Overall, our aim is to maintain the levels of operator compliance and operator performance at authorised installations. Specifically, we aim to achieve 95 per cent compliance with the Control of Pollution Act; 92 per cent compliance in both Integrated Pollution Control and Air Pollution Control; and 90 per cent compliance in Waste Management Licences. The different levels of compliance targets reflect the different nature of the processes being regulated. Licences are reviewed periodically and conditions are tightened as appropriate to progressively reduce harmful pollutants, taking into account the best available techniques to minimise environmental impact. Annex A provides more detail on our regulatory regimes and these compliance targets. The high level of compliance demands a sensitive compliance measure, and we may have to reassess how we measure compliance at these high percentages. Another challenge we face is to measure compliance in-year for all our regimes, rather than at year-end.
SEPA issues and reviews licences and permits, undertakes environmental inspections around sites, and takes and analyses samples. Assumptions are made prior to each operating year regarding the volume of activity expected for each regulatory regime. SEPA used to use these activity figures as “targets” (for example, 1000 inspections were planned, how many were completed?) but because we have shifted our emphasis to what we achieve, we now use these planned volumes of activity to help assess our performance through the year. Examples of the anticipated volumes of activity for two regulatory regimes in 2004-2005 are given in the table below.
Regulatory Regime Activity Planning Assumption
Control of Licence Applications Anticipated 1368 Pollution Act Inspections 7076
Licence Reviews 359
Sampling 12368
Waste Licence Applications Anticipated 112 Management Inspections 7059
Licences Licence Reviews 59
Sampling 23

137
To determine the frequency of inspection or sampling, the risk to the environment is assessed. This allows all licences and permits to be kept under systematic review and varied as the need arises. Further detail on some of SEPA’s activities is provided in Annex B.
We have three main reports that assess performance, as well as numerous reporting mechanisms throughout the organisation:
• Monthly report – indicates if our volumes of activity are on track.
• Quarterly report – indicates if compliance and outcome targets are being met.
• Annual report – indicates if we are making progress with our six outcomes overall.
The quarterly and annual reports are available from SEPA’s website. Further details on all the above information can be found on our website at http://www.sepa.org.uk.

138
ANNEX A. THE MAIN REGULATORY REGIMES AND COMPLIANCE TARGETS
The main regulatory regimes are described below, with some example compliance targets.
The Control of Pollution Act 1974 controls discharges of potentially polluting substances to controlled waters through a licensing procedure. Consents may contain conditions imposing limits on both the quality and quantity of effluent discharged. The chart illustrates SEPA’s past performance and future compliance targets
Control Of Pollution Act : Licence Compliance
0102030405060708090
100
1998/99 1999/00 2000/01 2001/02 2002/03 2003/04 2004/05 2005/06 2006/07
Year
%
Target Actual
GO
AL
The Control of Major Accident Hazards Regulations 1999 applies to certain industrial establishments. These regulations strengthen controls in respect of the environmental impact of major accidents. Their main aim is to prevent and mitigate the effects of major accidents involving dangerous substances, such as chlorine or liquefied petroleum gas which can cause serious damage or harm to people or irreversible damage to the environment. In Scotland, the Regulations are enforced by a joint competent authority, consisting of the Health and Safety Executive and SEPA.
Environmental Protection Act 1990 Part I. SEPA regulates Scotland’s most potentially polluting and complex industrial processes under Part A (integrated pollution control) and Part B (air pollution control) of this Act. The Pollution Prevention and Control Act 1999 is replacing these two with a new pollution prevention and control (PPC) regime (see next). The Local Air Pollution Control regime is a system of local air pollution control for smaller industrial processes introduced under Part 1 of the Environmental Protection Act 1990. The charts illustrate SEPA’s past performance and future compliance targets
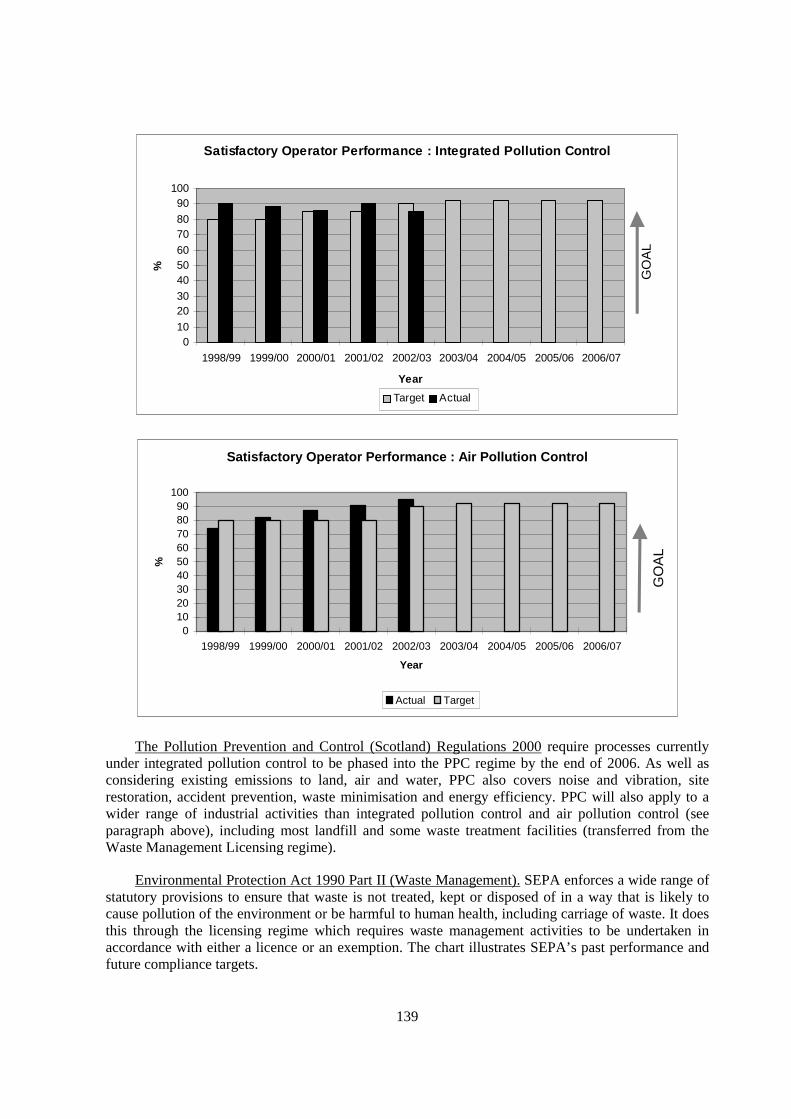
139
Satisfactory Operator Performance : Integrated Pollution Control
010
2030
405060
7080
90100
1998/99 1999/00 2000/01 2001/02 2002/03 2003/04 2004/05 2005/06 2006/07
Year
%
Target Actual
GO
AL
Satisfactory Operator Performance : Air Pollution Control
0102030405060708090
100
1998/99 1999/00 2000/01 2001/02 2002/03 2003/04 2004/05 2005/06 2006/07
Year
%
Actual Target
GO
AL
The Pollution Prevention and Control (Scotland) Regulations 2000 require processes currently under integrated pollution control to be phased into the PPC regime by the end of 2006. As well as considering existing emissions to land, air and water, PPC also covers noise and vibration, site restoration, accident prevention, waste minimisation and energy efficiency. PPC will also apply to a wider range of industrial activities than integrated pollution control and air pollution control (see paragraph above), including most landfill and some waste treatment facilities (transferred from the Waste Management Licensing regime).
Environmental Protection Act 1990 Part II (Waste Management). SEPA enforces a wide range of statutory provisions to ensure that waste is not treated, kept or disposed of in a way that is likely to cause pollution of the environment or be harmful to human health, including carriage of waste. It does this through the licensing regime which requires waste management activities to be undertaken in accordance with either a licence or an exemption. The chart illustrates SEPA’s past performance and future compliance targets.

140
Satisfactory Operator Performance : Waste Management Licence
0
20
40
60
80
100
1998/99 1999/00 2000/01 2001/02 2002/03 2003/04 2004/05 2005/06 2006/07
Year
%
Target Actual
GO
AL
Environmental Protection Act 1990 Part IIA (Contaminated Land). The Regulations and Guidance provide for a regime concerned with identifying and remediating contaminated land, mainly aimed at dealing with the legacy of land contaminated by, for example, past industrial, mining and waste disposal activities. Local authorities are responsible for identifying such land. SEPA is responsible for ensuring that certain types of contaminated land designated as special sites are remediated, including taking appropriate action against obligated parties.
Radioactive Substances Act 1993. SEPA is responsible for regulating disposal of radioactive waste from nuclear sites and other premises such as industrial, hospital and research premises under the Act. SEPA also regulates the keeping and use of radioactive material.
The Water Environment and Water Services Act 2003 Implementation of this Act will bring a single coherent approach to protecting the whole water environment that incorporates water quality (pollution), water quantity (abstractions and flow regulation) and habitat quality (river engineering and agricultural practice). This Act will replace several existing directives.
The Producer Responsibility Obligations (Packaging Waste) Regulations 1997. These Regulations aim to implement the EC Directive on Packaging and Packaging Waste (94/62/EC) and to reduce the amount of such waste going to landfill. SEPA enforces compliance with the obligations on producers or compliance schemes of which they are members, with a view to ensuring that all obligated parties are registered with SEPA, and that reasonable steps are taken to meet recovery and recycling targets.
Groundwater Regulations 1998 These Regulations bring about full implementation of the Groundwater Directive by dealing with activities not dealt with under other regimes, such as the activities not controlled by a waste management license. The Directive prohibits the direct or indirect discharge into groundwater of List I substances and limits discharges of List II substances so as to avoid pollution. Most commonly these are the disposal of sheep dip and waste agrochemicals to land. As well as detailing the chemicals to be disposed, suitable disposal sites must also be selected so that harm to the environment is minimised.

141
ANNEX B. FURTHER DETAIL ON SOME OF SEPA’S ACTIVITY
Environmental Licenses. Granting or imposing an environmental license is an integral part of SEPA’s job. It translates the intentions and provisions of statute into reasonable, achievable and enforceable conditions which permit an activity without significant and/or irreversible environmental damage occurring. All environmental licenses issued will, so far as is possible,
• limit damage to the environment;
• allow the holder to invest with reasonable security;
• be fair, reasonable and achievable;
• be clear and unequivocal;
• be enforceable;
• conform with statute.
Enforcement. Enforcement means any action taken to ensure compliance with the legislation SEPA must enforce and can include action taken to protect, conserve or enhance the environment. It can include:
• discussions;
• meetings;
• warning letters;
• formal enforcement or prohibition notices;
• granting, amendment, review, variation or revocation of environmental licenses;
• reporting a case to the Procurator Fiscal for prosecution.
We ensure that any enforcement action taken is proportional to the risks posed to the environment and the seriousness of the offence. As far as the law allows, SEPA will take into account the circumstances of the case and the attitude of the operator when considering action. Our efforts are concentrated on those activities which cause the greatest environmental damage, pose the greatest threats to the environment or undermine the regulatory regimes which parliament has created to protect and improve the environment and prevent harm to human health. Action is focused on those who break the law or those directly responsible for serious environmental damage or risk.
Prosecution. The objective of enforcement is to ensure that preventative or remedial steps are taken to protect the environment and to prevent or minimise, and make harmless, releases that can cause pollution. Prosecution of offences is one of the ways of achieving that objective. SEPA can recommend to the public prosecutor that a case be brought, and will do so where justified in order to punish offenders, to avoid a recurrence and to encourage general compliance. A case may be referred to the prosecutor without prior warning or recourse to alternative methods of enforcement. Those responsible for the offence will be reported with a recommendation for prosecution. If a company is involved SEPA will normally recommend action against the company. However, individuals in the

142
company, such as directors, managers or the company secretary may also be reported for prosecution where it can be shown that the offence was committed with their express or implied consent, or was due to their negligence.
Voluntary agreements and promotion of best practice. SEPA uses the promotion of voluntary agreements in areas such as agriculture, oil disposal campaigns, sustainable urban drainage, and in regulation of certain smaller organisations and premises. Specific approaches to communicate with small and medium businesses concerning regulation also promote the use of good practice in energy, water, waste. A series of initiatives such as waste minimisation, diffuse pollution and habitat enhancement are also dedicated to promoting best practice.

143
COUNTRY REPORT ON ENVIRONMENTAL INDICATORS IN THAILAND
by Thasanee Chantadisai26
1. Introduction
Environmental management and administration in Thailand constructively started in 1975 with the establishment of the National Environmental Quality Enhancement and Conservation Act B.E. 2518 (1975). The translation of the act into policy, programmes, plans, and compliances was then undertaken in a compartmentalised, segmented manner according to the functional responsibility of each of the relevant government agencies. In 1992, a new Environmental Act was issued in order to reform the management of natural resources and environmental conservation, based on effective, transparent and accountable monitoring. The new Act also enhances public participation, decentralising management authority to local authorities and uses the 'polluter pays' principle.
Since UNCED at Rio in 1992, most countries, including Thailand, pay specific attention to sustainable development so as to meet the recommendations in Agenda 21. At the same time, it was recognised that indicators should be developed to be an appropriate tool for evaluation of sustainable development and to measure the progress towards the goals of Agenda 21.
After the public sector reform in October 2002, the Ministry of Natural Resources and Environment was established under the Environmental Act 1992. Several resource-oriented departments were then established. The systematic monitoring and evaluation is conducted under the Office of Natural Resources and Environment Policy and Planning and is harmonised with the national monitoring and evaluation of government policy performance. Nationwide key performance indicators (KPI) have become the main issue in public administration and also in the field of environmental management.
2. Thailand development indicators
The Ninth National Economic and Social Development Plan (2002-2006) outlined the need to develop systematic monitoring and evaluation at all levels in order to ensure continuous plan implementation, greater transparency, and more opportunities for public participation in monitoring and evaluation
26 Director, Monitoring and Evaluation Division, Office of Natural Resources and Environmental Policy
and Planning.

144
One of the strategies included in the Plan is the formulation of concrete and flexible development indicators to assess development outcomes, the efficiency of sectoral development and the efficiency of development strategies.
In 2000, the Office of Environmental Policy and Planning, Thailand, launched a project to report the progress and achievements of Thailand in implementing Agenda 21. The CSD indicators developed by the Commission on Sustainable Development have been applied in the project to evaluate the national progress towards Agenda 21, as stated above. However, the data available from principal Thai sources, namely, the National Statistical Office (NSO) and the Office of National Economic and Social Development Board (NESDB) as well as other available sources, were insufficient and incomplete to meet the requirements of the CSD model.
The NESDB’s indicators published in Thailand Development Indicators 1990-1999 were found not sufficient as compare to the CSD indicators. The lack of data to support of the following sustainable development issues has been analysed and reported:
~Gender equity ~Healthcare delivery ~Nutritional status ~Mortality ~Sanitation ~Drinking water ~Climate change ~Oceans, seas, and coasts ~Quantity and quality of freshwater ~Biodiversity ~Institutional capacity
Similarly, NSO data and indicators were reported lacking to accomplish the CSD’s for the
following issues:
~Nutritional status ~Literacy ~Climate change and atmosphere ~Biodiversity ~Economic performance ~Institutional framework ~Healthcare delivery ~Oceans, seas, and coasts ~Science and technology ~Crime ~Disaster preparedness and response ~Quantity and quality of freshwater ~Consumption and production patterns
The Office of National Economic and Social Development Board, in cooperation with the Office of Natural Resources and Environmental Policy and Planning, therefore, decided to launch a project to formulate the national Sustainable Development Indicators (SDI) in 2003 and expects to complete the project in the end of 2004.
3. Performance indicators
Since 2001, during the public sector reform period in Thailand, the Thai government has paid much attention to the development of performance indicators, especially outcome indicators, to evaluate results of government policy, programmes, plans and activities in various development sectors as well as on natural resources and environmental management. The work was done in parallel with the development of the information system under the national operation centre. The information system will serve as an important tool for monitoring and evaluating the performances of government policy, programmes, plans, activities and compliances. Every consecutive ministry and department must set up a ministry operation centre and departmental operation centre and provide the information necessary for decision making to the national operation centre through GDX (Government Data Exchange). The data and information network will be very useful for developing performance indicators at the national level. Key performance indicators have also been applied in the budgeting and administrative process to follow-up on the effectiveness and outcomes of the government agency. Based upon this system, the performance indicators will be an effective tool to assist the monitoring

145
operation, enhance the accountability, and help to assess the performance of each and overall government policy, programmes, plans, activities, and compliances as and to assist other target audiences, such as, ministerial and departmental authorities, general public, etc.
4. Development of environmental indicators for evaluation and monitoring
Following the public sector reform in Thailand during 2001-2002, there is a need for an effective database and information system that will aid environmental monitoring and policy implementation. The Office of Natural Resources and Environmental Planning and Policy (ONEP) has launched a project to develop an environmental database system and environmental indicators to for monitoring the state of the environment in Thailand. This database system and environmental indicators will also be used for effective monitoring of government projects related to environmental improvement, as part of the national operational system and national performance indicator analysis mentioned above.
At the initial stage, the benchmark indicators are taken from the goals and targets of the Policy and Prospective Plan for Enhancement and Conservation of National Environmental Quality, 1997-2016, and the Ninth National Economic and Social Development Plan (2002-2006). The Pressure-State-Response Framework developed by OECD has been applied for developing the environmental indicators. A participatory approach is used for indicator development so that these indicators will be accepted by the relevant stakeholders. Moreover, this approach helps to create the possibility of the sharing of data and information among the relevant stakeholders.
Some specific criteria have been established during the study, such as:
• Indicators applied in the monitoring and evaluation process should be regularly revised according to the change of pressure-state-impact.
• Units, both quantitatively and comparatively, should be clear, responsive and present the result of the indicators.
• A chosen indicator should be technically and theoretically correct, e.g., the relevance between forestry and draught is not ecological fact and forest density could not be used as state-response to rain because rain is under the influence of monsoon.
• Careful use of flow or stock data in a suitable situation is necessary by experts in relevant field.
• Most policy issues have no specific benchmark and it is difficult to set indicators.
By the conclusion of the project, 65 state indicators; 60 pressure indicators; and 56 response indicators had been developed. These indicators will be used for evaluation of the Policy and Prospective Plan and for evaluation of the 5-year-Plan. Moreover, various set of SDA indicators have been developed to monitor the performance of implementing agencies for the overall and sectoral environment.
Not only has the information system been set, but the availability of data and information has also been considered by the stakeholders in the participatory pattern. It is expected that the indicator model will start to be test-run in early 2004 and will be revised by the end of 2004.
146
Ideally, the database and environmental indicators for environmental monitoring and policy implementing will be utilised by the Office of Natural Resources and Environmental Planning and Policy, as the core agency. Ultimately the benefit of this work will be in line with precautionary principle, i.e. to provide accountable and systematised information to the public and policy makers for adjusting the natural resources and environmental planning and policy of the country. At the same time, this project will be the seed activity for sectoral development of environmental compliance and enforcement indicators in the near future.

147
PERFORMANCE INDICATORS FOR ENVIRONMENTAL COMPLIANCE AND ENFORCEMENT PROGRAMS: THE U.S. EPA EXPERIENCE
by Michael M. Stahl27
Note to Readers: This paper expands and updates a previous paper presented at the 6th conference of the International Network for Environmental Compliance and Enforcement (INECE) in Costa Rica on April 15, 2002. This revised version includes new information about how EPA is using performance indicators to improve the effectiveness of its national enforcement and compliance program. It also addresses issues and needs identified at two recent indicator workshops: the INECE-OECD Workshop on Environmental Compliance and Enforcement Indicators on November 3
and 4, 2003 in Paris; and the Workshop de Indicadores Ambientais on December 8 and 9, 2003 in Brasilia.
1. Introduction
The purpose of this paper is to describe the efforts of the United States Environmental Protection Agency (EPA) to develop and use results-based indicators in its national enforcement and compliance assurance program. The paper provides background about EPA and its compliance and enforcement program and discusses the need for better indicators. It then describes a three-phase process – identification of better indicators, implementation of better indicators, and use of indicators as a management tool - which can help other environmental compliance and enforcement programs seeking to manage in a more results-based manner.
2. Background on EPA’S enforcement and compliance assurance program
In the face of growing public concern over environmental issues the Environmental Protection Agency (EPA) was formed in 1970 with the mission of protecting human health and the environment. The Agency brought together existing federal environmental programs and became the focal point for federal environmental activity, with broad authority to deal with environmental problems that affect the air, land, and water. For example, the Clean Air Act regulates the emission of pollutants to the air from stationary and mobile sources, the Clean Water Act regulates emissions to water, the Safe Drinking Water Act sets standards for drinking water, and the Resource Conservation and Recovery Act established a cradle-to-grave system for handling hazardous waste. There are numerous other environmental laws implemented by EPA dealing with particular pollutants or hazardous substances such as lead, asbestos, and oil; with environmental clean-ups; endangered species protection; and food safety.
27 Director, Office of Compliance, United States Environmental Protection Agency.

148
EPA develops regulations and sets national standards for environmental laws. Implementation and enforcement of these environmental programs is done in cooperation with states and Indian tribes. States have the primary authority for implementing most environmental programs through delegated authority from the EPA. The EPA’s federal role in ensuring compliance is to implement and enforce programs that cannot be delegated to states and Indian tribes, to handle more complex cases involving multiple states or corporations with multiple facilities, to deal with issues that require expertise or resources which only EPA can provide, and to enforce when states are unable or unwilling to.
EPA’s Office of Enforcement and Compliance Assurance (OECA) is responsible for ensuring compliance with the nation’s environmental laws. OECA employs an integrated approach to increase compliance, using compliance monitoring, compliance assistance, incentives to encourage self-audits by facilities, and enforcement. OECA identifies environmental problems by analysing risks and patterns of non-compliance and developing strategies to address those problems by using assistance, monitoring, inspections, and enforcement in combinations appropriate to the problem.
EPA’s fiscal year 2004 budget is approximately seven billion dollars. The Agency employs approximately 18,000 people at the Agency’s headquarters, ten regional offices, and several laboratories and research facilities. OECA has approximately 3,100 employees who provide assistance, conduct inspections and investigations, develop and execute enforcement cases, and manage national compliance data systems.
3. The need for better indicators
EPA was set up to achieve its mission of protecting human health and the environment through a command-and-control regulatory compliance system. The system has traditionally relied upon compliance monitoring (e.g. inspections and investigations) and enforcement actions (e.g. administrative, civil, or criminal cases) as the primary tools to ensure compliance with environmental regulations. Likewise, indicators of program performance have been organised around those same tools.
3.1 Limitations of output indicators
Traditional indicators of program performance consist of activity counts, “outputs,” such as the number of inspections conducted, enforcement cases initiated, and penalties assessed. Though these indicators give some sense of enforcement presence, they do not provide all the types of feedback needed to effectively manage program performance, and they have several limitations.
The first limitation is that these indicators fail to include many of the new assistance and incentive approaches being used by EPA and other environmental agencies. Compliance assistance programs provide information on regulatory requirements for specific sectors and regulated populations, pollution prevention ideas, and techniques that can help an organisation come into compliance. The goal of compliance assistance programs is to increase compliance by helping organisations better understand regulations, thus preventing non-compliance, and by helping those out of compliance come back into compliance. EPA’s incentive policies encourage organisations to identify, disclose, and correct violations through voluntary self-audits in exchange for reduced or waived penalties. The activity counts employed as traditional indicators do not capture the results of new assistance and incentive approaches (e.g., they do not measure the changes in behaviour as a result of compliance assistance).

149
Activity counts as indicators of program performance have several other limitations as well. They fail to measure the environmental results achieved by program activities. Where traditional indicators tell us the number of cases initiated, or penalty dollars collected, they do not tell us the pounds of pollutants reduced as a result of injunctive relief associated with a case, or the improvements in company or facility environmental management practices resulting from assistance, or the return to compliance achieved by a company using one of EPA’s self-audit incentive policies.
Activity counts reveal very little about the state of compliance; they don’t tell us what percentage of the regulated universe as a whole is in compliance with the applicable regulations nor what the level of compliance is in key segments or populations of that universe. And, finally, activity counts say little about progress towards achieving environmental goals or addressing particular environmental problems. Knowing the number of inspections or investigations does not indicate whether the Agency’s mission is being achieved, or whether a strategy to address a particular environmental problem has been successful.
3.2 Challenges, Needs, Opportunities
EPA and other agencies have relied on activity counts for so long because measuring results of enforcement and compliance activities - like many government activities - is very difficult. Unlike the private sector, government agencies have no clear indicator of performance such as revenue, profits, market share, or customer satisfaction. Enforcement programs do not deliver a product or service; instead they impose obligations on their “customers” on behalf of society. In most cases the person or entity that the regulator encounters is an involuntary recipient of these obligations, and so cannot be expected to be an objective source of feedback on the performance of the regulatory program.
The primary and most visible output of EPA’s regulatory compliance system – enforcement actions – are indicative of regulated entities failure to comply with regulations and laws. Is an increase in enforcement outputs good news (i.e., the Agency was able to identify and correct a higher percentage of non-compliance problems), or bad news (i.e., the level of non-compliance is increasing)? The ambiguity in interpretation means these activities are not a reliable indicator of whether the enforcement and compliance program is achieving its mission of increasing compliance, or whether the Agency is achieving its goal of protecting human health and the environment.
The limitations of solely using output measures as indicators of program performance, and the move to a more diverse mix of tools to carry out the Agency’s mission, argue for development of better enforcement and compliance indicators. Most importantly, better indicators are needed to create as clear a link as possible between enforcement and compliance activities and strategies, and the results achieved. Better indicators must also document the level of compliance in the regulated community.
The Government Performance and Results Act (GPRA) of 1993 also provided motivation and a conceptual framework for the development of performance indicators and measures. GPRA shifts the focus of government decision-making and accountability from activities conducted to the results of those activities. GPRA requires federal agencies to develop strategic plans, and annual performance plans with goals and performance measures associated with them. More recently, President Bush’s Management Agenda has emphasised performance reviews, performance-based budgets, and the development of high quality outcome measures to monitor program performance.
Better indicators will enable EPA to conduct performance analyses, evaluating the effectiveness of tools and strategies in terms of achieving desired goals. This type of performance analysis will

150
enable EPA to more effectively employ its resources, investing in activities that achieve results and modifying or disinvesting from those areas that are not producing results.
4. Phase 1 — Identifying better indicators
In 1997, EPA’s Office of Enforcement and Compliance Assurance (OECA) initiated the National Performance Measures Strategy (NPMS) to develop and implement an enhanced set of performance measures. OECA conducted over twenty public meetings with a wide array of stakeholders, consulted with experts and practitioners, and reviewed dozens of studies and articles. This outreach and research effort was extremely beneficial to EPA’s efforts to identify better performance indicators. (Appendix A. provides a set of questions used to guide the discussions with stakeholders). The discussions produced a set of principles to guide OECA’s effort to develop indicators, a set of criteria for evaluating potential indicators, and many suggestions about specific indicators that OECA should consider.
4.1 Guiding Principles
Based on the ideas and suggestions offered by the stakeholders, and the concepts identified through the research conducted, OECA developed the following set of principles to guide the effort to develop better indicators.
4.1.1 There are diverse and multiple audiences for enforcement and compliance assurance performance measures
Information about the performance of EPA’s enforcement and compliance assurance program is used by many parties in a wide variety of ways. The most important audience is the public. Other significant audiences include EPA managers and staff, Congressional members and staff, oversight agencies, state environmental agencies, state attorneys general, environmental organisations, communities, regulated entities, and the media. All of them want and would use results-oriented performance measures presented in clear and understandable ways.
4.1.2 A combination of measures - outputs and outcomes, quantitative and qualitative, statistical and narrative, aggregated and disaggregated, national and local – is necessary to measure performance, inform management, and serve the full range of audience and purposes.
No single number, fact, or category of measure (e.g., output or outcome) can convey all the information necessary to comprehensively measure performance. The mission of EPA’s enforcement and compliance assurance program is complex. Its responsibilities are multiple and the tools used to achieve them are multi-faceted. Therefore, a variety of performance measures is needed to ensure accountability, improve management, and increase program effectiveness.
4.1.3 Performance measures are most effective when they reflect management priorities and are linked to a limited number of program goals and objectives.
Successful performance measures demonstrate the degree to which organisations or programs are achieving their goals and desired results. The number of measures should be limited to key
151
performance elements essential for producing data that aids program evaluation and decision-making. Performance measures should reflect those operational aspects (e.g., quality, fairness, timeliness, cost, etc.) considered to be management priorities.
4.1.4 Increased use of outcome measures presents many challenges, because agencies or programs may influence – but not necessarily control – outcomes.
Outcomes cannot generally be attributed or causally linked solely to the activities of an agency or program since most outcomes are influenced by many factors external to the agency. For example, compliance rates might be influenced by economic conditions that are conducive to investment in environmental management by companies or facilities. Agencies need to be careful not to take too much credit for successful achievement of outcomes; nor should they probably take too much blame when outcomes are not achieved.
4.1.5 Problem-specific, tailor-made performance measures are effective for evaluating performance in solving specific environmental and non-compliance problems.
When agencies or programs identify and target high-risk, high-priority environmental or non-compliance problems, their performance in mitigating or solving such problems can best be evaluated using tailor-made measures, indicators, or metrics which specifically relate to each problem. Generally, a performance record that is specific to each problem needs to be developed, since problem-specific measures often cannot generally be aggregated in a useful way.
4.1.6 Performance measures should be used principally to effectiveness and manage more strategically, rather than simply to report accomplishments to the public in a more interesting way.
If developed and used correctly, performance measures should permit more sophisticated analysis of results and activities that produced them, allow comparisons of the relative effectiveness of specific tools and strategies, and lead to informed resource allocation that is more likely to achieve the desired results. A well-designated and wisely-utilised set of performance measures can put strategy and vision, goals and objectives at the centre of management attention.
4.2 Criteria for evaluating potential indicators
The discussions with stakeholders also provided a set of criteria that OECA used to examine the value of each potential indicator, and decide which to implement. Based on the discussion with stakeholders, indicators should be:
• relevant to goals, objectives, and priorities of the agency and to the needs of external stakeholders;
• transparent so they promote understanding and enlighten users about program performance;
• credible and based on data that is complete and accurate;
• functional in that they encourage programs and personnel to engage in effective and constructive behaviour and activities;
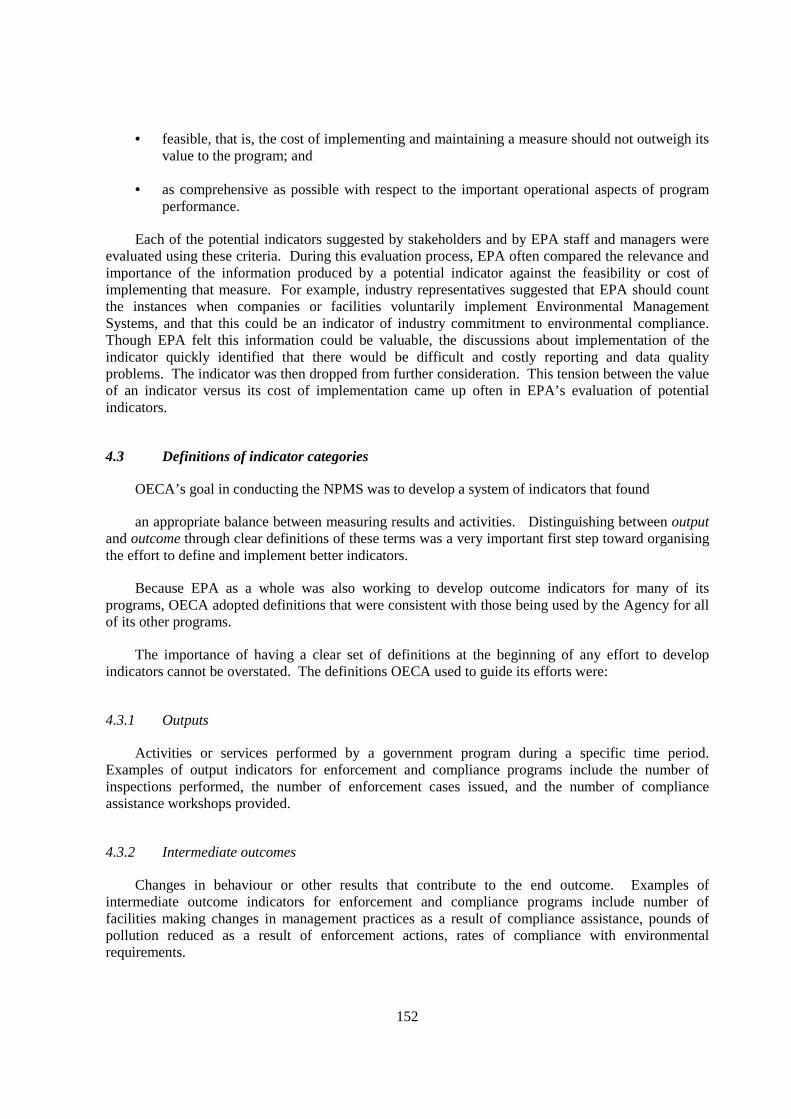
152
• feasible, that is, the cost of implementing and maintaining a measure should not outweigh its value to the program; and
• as comprehensive as possible with respect to the important operational aspects of program performance.
Each of the potential indicators suggested by stakeholders and by EPA staff and managers were evaluated using these criteria. During this evaluation process, EPA often compared the relevance and importance of the information produced by a potential indicator against the feasibility or cost of implementing that measure. For example, industry representatives suggested that EPA should count the instances when companies or facilities voluntarily implement Environmental Management Systems, and that this could be an indicator of industry commitment to environmental compliance. Though EPA felt this information could be valuable, the discussions about implementation of the indicator quickly identified that there would be difficult and costly reporting and data quality problems. The indicator was then dropped from further consideration. This tension between the value of an indicator versus its cost of implementation came up often in EPA’s evaluation of potential indicators.
4.3 Definitions of indicator categories
OECA’s goal in conducting the NPMS was to develop a system of indicators that found
an appropriate balance between measuring results and activities. Distinguishing between output and outcome through clear definitions of these terms was a very important first step toward organising the effort to define and implement better indicators.
Because EPA as a whole was also working to develop outcome indicators for many of its programs, OECA adopted definitions that were consistent with those being used by the Agency for all of its other programs.
The importance of having a clear set of definitions at the beginning of any effort to develop indicators cannot be overstated. The definitions OECA used to guide its efforts were:
4.3.1 Outputs
Activities or services performed by a government program during a specific time period. Examples of output indicators for enforcement and compliance programs include the number of inspections performed, the number of enforcement cases issued, and the number of compliance assistance workshops provided.
4.3.2 Intermediate outcomes
Changes in behaviour or other results that contribute to the end outcome. Examples of intermediate outcome indicators for enforcement and compliance programs include number of facilities making changes in management practices as a result of compliance assistance, pounds of pollution reduced as a result of enforcement actions, rates of compliance with environmental requirements.

153
4.3.3 End outcomes
Ultimate results or conditions to be achieved by the program or agency.
Examples of end outcome indicators include emissions levels of key air or water pollutants, number of people living in areas in which pollutant standards were exceeded.
As ideas for potential indicators were suggested by stakeholders, these definitions were used repeatedly to categorise individual indicators and determine whether the whole set of indicators suggested were focused appropriately on outcomes and results rather than solely outputs and activities.
4.4 Indicators selected
As a result of the discussions with stakeholders, consultations with experts, and meetings with internal staff, OECA selected a set of new indicators to develop and implement in stages over a period of three years. The new indicators are:
• Pounds of pollutants reduced through enforcement actions;
• Pounds of soil removed, gallons of groundwater treated through enforcement actions;
• Dollar value of pollution control projects required by enforcement actions;
• Number of audits and self-corrections by companies/facilities using EPA policies;
• Number of entities seeking compliance assistance form EPA assistance centers;
• Actions taken as a result of assistance from EPA centers;
• Rate of recidivism among significant violators and average time to return to compliance; and
• Statistically valid compliance rates for key regulated populations.
These indicators focus on the outcomes of program activities – i.e., improvements in environmental conditions or behaviour of the regulated universe – rather than on the number of activities. The indicators also do not measure ultimate outcomes of environmental protection such as improved quality of air or water, but most focus instead on intermediate outcomes such as behaviour changes and other actions that contribute to the ultimate outcomes.
Also as a result of the stakeholder discussions, OECA identified several key output indicators – some new and some used for many years – which would be used in combination with the new outcome measures. The key output indicators are:
• Number of inspections and investigations conducted;
• Number of civil and criminal enforcement actions;
• Number of facilities/entities reached through compliance assistance efforts; and
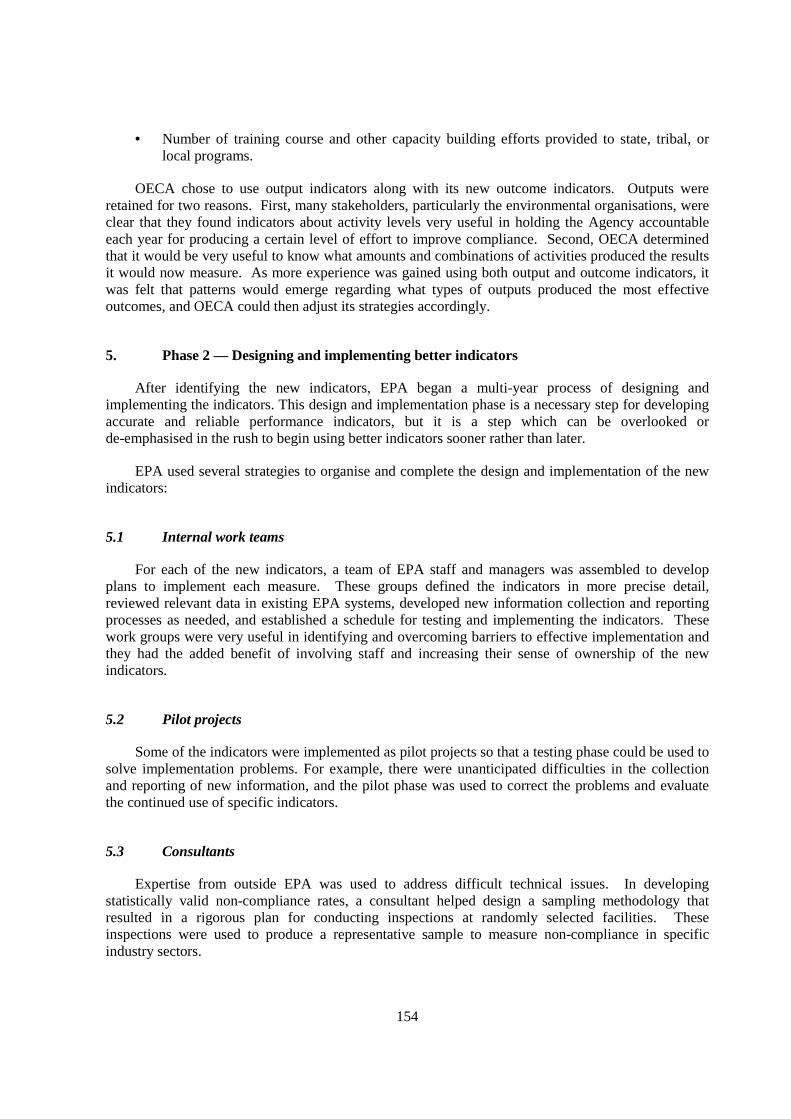
154
• Number of training course and other capacity building efforts provided to state, tribal, or local programs.
OECA chose to use output indicators along with its new outcome indicators. Outputs were retained for two reasons. First, many stakeholders, particularly the environmental organisations, were clear that they found indicators about activity levels very useful in holding the Agency accountable each year for producing a certain level of effort to improve compliance. Second, OECA determined that it would be very useful to know what amounts and combinations of activities produced the results it would now measure. As more experience was gained using both output and outcome indicators, it was felt that patterns would emerge regarding what types of outputs produced the most effective outcomes, and OECA could then adjust its strategies accordingly.
5. Phase 2 — Designing and implementing better indicators
After identifying the new indicators, EPA began a multi-year process of designing and implementing the indicators. This design and implementation phase is a necessary step for developing accurate and reliable performance indicators, but it is a step which can be overlooked or de-emphasised in the rush to begin using better indicators sooner rather than later.
EPA used several strategies to organise and complete the design and implementation of the new indicators:
5.1 Internal work teams
For each of the new indicators, a team of EPA staff and managers was assembled to develop plans to implement each measure. These groups defined the indicators in more precise detail, reviewed relevant data in existing EPA systems, developed new information collection and reporting processes as needed, and established a schedule for testing and implementing the indicators. These work groups were very useful in identifying and overcoming barriers to effective implementation and they had the added benefit of involving staff and increasing their sense of ownership of the new indicators.
5.2 Pilot projects
Some of the indicators were implemented as pilot projects so that a testing phase could be used to solve implementation problems. For example, there were unanticipated difficulties in the collection and reporting of new information, and the pilot phase was used to correct the problems and evaluate the continued use of specific indicators.
5.3 Consultants
Expertise from outside EPA was used to address difficult technical issues. In developing statistically valid non-compliance rates, a consultant helped design a sampling methodology that resulted in a rigorous plan for conducting inspections at randomly selected facilities. These inspections were used to produce a representative sample to measure non-compliance in specific industry sectors.

155
5.4 Phased implementation
The new indicators were implemented gradually over a three-year period. Some of the indicators were implemented and available for use in Fiscal Year (FY) 1998, while others were not completed until FY 2001. Although this meant that the full set of indicators was not available for use for three years, the time spent developing them produced more accurate information and spread the implementation burden over a more manageable period.
6. Phase 3 — Using better performance indicators
Now that EPA has implemented a better set of indicators for its enforcement and compliance assurance program, the indicators are being used for two purposes. First, the indicators are being used to report to the public, the U.S. Congress, and the U.S. Office of Management and Budget (OMB) about the results being achieved by the national enforcement and compliance assurance program. Second, the indicators will be used to analyse and improve the performance of the program.
6.1 Reporting to external audiences
Under GPRA, EPA and all Federal agencies are required to produce an Annual Performance Report (APR) that describes the results and outcomes achieved through the activities of major programs. This requirement has been in place since Fiscal Year 1999, and each year the APR for OECA has focused increasingly on results and outcomes while de-emphasising the more traditional counting of inspections and enforcement activities. In addition, budget requests presented to OMB officials and Congressional appropriations committees have been greatly aided by the new indicators. OECA can now describe its enforcement and compliance program accomplishments in terms that resonate with its multiple audiences – pounds of pollutants reduced through enforcement, improved management practices at facilities from compliance assistance, violations corrected and disclosed through EPA audit policies.
Appendix B. provides the most recent set of indicators reported to the public at the end of Fiscal Year 2003.
6.2 Monitoring, analysing, and improving performance
The real value of having better performance indicators - even more important than the ability to report meaningful results to external audiences – is to use the indicators to monitor, analyse, and improve program performance.
OECA is using its improved indicators to produce three reports that are used as management tools by managers and staff in EPA’s headquarters and regional offices. These tools are: a Monthly Management Report; Regional Data Profiles; the Watch List for Significant Non-compliance; and Program Element Studies.
6.2.1 Monthly management reports
At the beginning of each month, OECA distributes via email a set of reports to the senior managers of its headquarters and regional offices. These reports provide a current account of the

156
performance of each regional office and the national program as a whole in producing key outputs and outcomes. In addition to data about performance indicators for the current year, the report also provides data about performance in the previously completed fiscal year to provide a benchmark. For example, regional managers can compare the number of cases issued up to the present in the current fiscal year against the number issued in the previous fiscal year.
6.2.2 Regional data profiles
The Assistant Administrator for OECA visits each of EPA’s ten regional offices twice each year to conduct management reviews. Prior to each trip, a Regional Data Profile is developed to provide detailed information about the performance of the individual regional office. The Profiles contain data about performance in the current fiscal year, three-year trends on key outputs and outcomes, comparisons to performance of other regional offices, and they also identify specific program management and performance issues that need to be discussed with managers of the regional office. These profiles allow senior managers to analyse the activities performed and the results achieved, and adjust program strategies as necessary.
6.2.3 Watch list for significant non-compliance
Beginning in early 2004, OECA will distribute a report to regional offices that lists all facilities where significant non-compliance has been identified but has not been addressed after a prolonged period. Under EPA policies, more serious categories of violations are designated as significant non-compliance and those policies require timely and appropriate responses such as enforcement actions to resolve violations. The Watch List will allow regional offices to work cooperatively with those states having delegated authority to address facilities in significant non-compliance, and ensure that these facilities are returned to compliance as soon as possible.
6.2.4 Program element studies
OECA has also implemented a process for analysing the performance of the various elements of the national enforcement and compliance assurance program. This process is described in a guidebook developed by OECA entitled, Using Performance Data as a Management Tool. The process described in the guidebook is organised around five performance-based questions that provide a framework for the analysis. The five questions are:
• Are we contributing to the goal of protecting human health and the environment through our actions and strategies?
• Are we changing the behaviour of the regulated community in ways that lead to improved environmental performance?
• Are we achieving appropriate levels of compliance in key populations?
• Are we achieving the appropriate levels of enforcement activity in the regulated community?
• Are we providing appropriate assistance to our state and tribal partners to support them in contributing to improving environmental performance?

157
Under each question, the relevant performance indicators are arrayed to address the question as thoroughly as possible. The framework allows data about results and the activities that produced them to be analysed. These data can be examined for patterns and more can be learned about the combinations, types, and amounts of activities that produce the most desirable results.
The framework was first used in FY 2003 to analyse EPA’s compliance and enforcement program under the Clean Water Act. The results of that analysis were reviewed by OECA senior management and recommendations for program improvements are now being implemented. Two studies will be conducted each year beginning in FY 2004.
7. Summary and Conclusions
Government programs of all types are under growing pressure to produce results, measure outcomes, and continuously assess and improve program performance. Developing better indicators of performance is an indispensable step that enables programs to move into the era of results-based management. Environmental compliance and enforcement programs face special circumstance and obstacles that make development and use of better indicators a very formidable challenge.
The EPA indicators described in this article are not offered as a universal set that will suit all environmental compliance and enforcement programs. Rather, the three-phase process used by EPA is suggested as an approach that other programs can use to develop and use better indicators. Programs and agencies willing to invest the time and resources to: (1) identify potential indicators through broad stakeholder involvement; (2) design and implement indicators in a careful and deliberate manner; and (3) use indicators to analyse and improve programs, will enhance their accountability to the public, improve their effectiveness, and increase their contribution to protecting the environment.
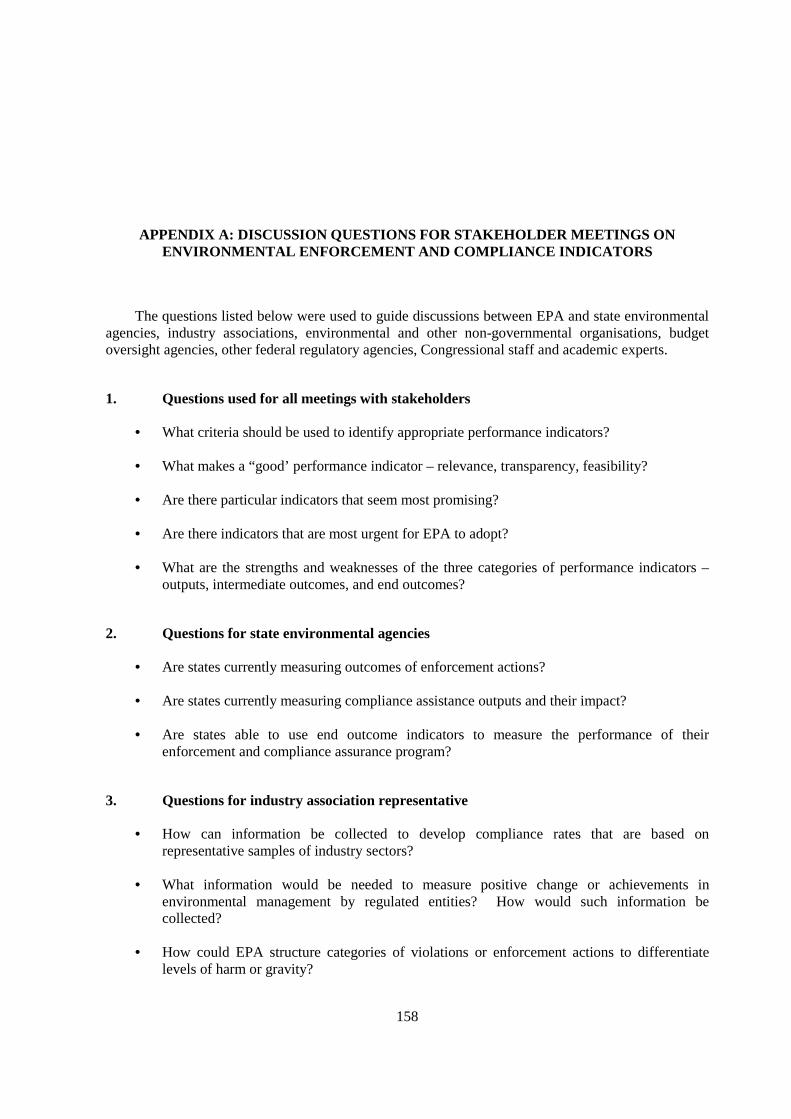
158
APPENDIX A: DISCUSSION QUESTIONS FOR STAKEHOLDER MEETINGS ON ENVIRONMENTAL ENFORCEMENT AND COMPLIANCE INDICATORS
The questions listed below were used to guide discussions between EPA and state environmental agencies, industry associations, environmental and other non-governmental organisations, budget oversight agencies, other federal regulatory agencies, Congressional staff and academic experts.
1. Questions used for all meetings with stakeholders
• What criteria should be used to identify appropriate performance indicators?
• What makes a “good’ performance indicator – relevance, transparency, feasibility?
• Are there particular indicators that seem most promising?
• Are there indicators that are most urgent for EPA to adopt?
• What are the strengths and weaknesses of the three categories of performance indicators – outputs, intermediate outcomes, and end outcomes?
2. Questions for state environmental agencies
• Are states currently measuring outcomes of enforcement actions?
• Are states currently measuring compliance assistance outputs and their impact?
• Are states able to use end outcome indicators to measure the performance of their enforcement and compliance assurance program?
3. Questions for industry association representative
• How can information be collected to develop compliance rates that are based on representative samples of industry sectors?
• What information would be needed to measure positive change or achievements in environmental management by regulated entities? How would such information be collected?
• How could EPA structure categories of violations or enforcement actions to differentiate levels of harm or gravity?
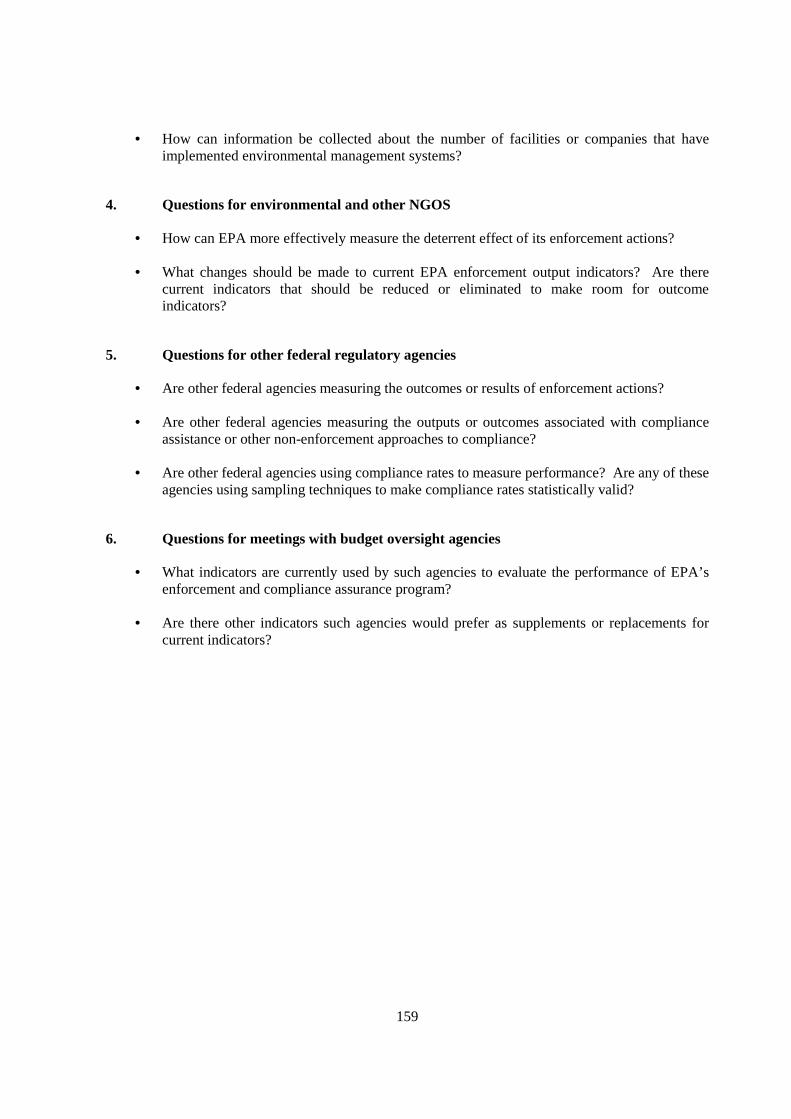
159
• How can information be collected about the number of facilities or companies that have implemented environmental management systems?
4. Questions for environmental and other NGOS
• How can EPA more effectively measure the deterrent effect of its enforcement actions?
• What changes should be made to current EPA enforcement output indicators? Are there current indicators that should be reduced or eliminated to make room for outcome indicators?
5. Questions for other federal regulatory agencies
• Are other federal agencies measuring the outcomes or results of enforcement actions?
• Are other federal agencies measuring the outputs or outcomes associated with compliance assistance or other non-enforcement approaches to compliance?
• Are other federal agencies using compliance rates to measure performance? Are any of these agencies using sampling techniques to make compliance rates statistically valid?
6. Questions for meetings with budget oversight agencies
• What indicators are currently used by such agencies to evaluate the performance of EPA’s enforcement and compliance assurance program?
• Are there other indicators such agencies would prefer as supplements or replacements for current indicators?

160
APPENDIX B: PERFORMANCE INDICATORS FOR EPA’S ENFORCEMENT AND COMPLIANCE ASSURANCE PROGRAM: EXAMPLES FROM FISCAL YEAR 2003
1. Intermediate and end outcomes
Estimated Pounds of Pollution Reduced ~ 600,000,000 Pounds of Contaminated Soil and Sediment 7,479,000,000 Gallons of Wastewater/Groundwater Treated 6,500,000,000 Acres of Wetlands Protected 1,050 People Served by Drinking Water Systems Brought into Compliance 2,000,000 Investments in Pollution Control $2,879,000,000 Investments in Other Environmentally Beneficial Projects $65,000,000 Facilities Voluntarily Disclosing Violations 614 Companies Voluntarily Disclosing Violations 379 Number of Regulated Entities Seeking Compliance Assistance from EPA Centers 800,000 As a result of assistance from EPA Centers ... Percent of Entities Reporting Improved Understanding of Regulations 87% Percent of Entities Taking Actions to Improve Environmental Mgmt. 75% Percent of Entities Reporting Pollutant Reductions 81%
2. Key outputs
Number of Administrative Compliance Orders 1,582 Number of Administrative Penalty Complaints 1,888 Number of Administrative Penalty Order Settlements 1,707 Dollar Amount of Administrative Penalties $24,000,000 Number of Judicial Cases Referred for Prosecution 268 Number of Judicial Cases Settled 195 Dollar Amount of Judicial Penalties $72,000,000 Number of Inspections Conducted 18,880 Number of Investigations Conducted 344 Regulated Entities Reached by EPA Compliance Assistance 721,000

161
Notes about the outcomes and Outputs:
• The pollutants reduced, soil and groundwater removed or treated, wetlands protected, people in complying drinking water systems, and investments in pollution control and beneficial projects all were the direct outcomes of civil and administrative enforcement actions that were completed in Fiscal Year 2003.
• Facilities and companies voluntarily disclosing violations resulted from the use of EPA’s incentive policy to encourage companies to detect, disclose and correct violations through self-audits.
• The 800,000 entities seeking assistance used one or more of EPA’s 13 Web-based compliance assistance centres. Each centre provides information about compliance that is tailored to specific industry sectors. The percentages reporting various results were based on surveys of users of the assistance centres.
• All of the above information on outcomes and outputs can be organised by statute, by regional office, by period of time, thus allowing analysis of trends that can greatly aid management of the national program.

162
APPENDIX C: OBSERVATIONS AND SUGGESTIONS FOR INDICATORS PROJECTS IN DEVELOPING/TRANSITIONING NATIONS
The circumstances under which the U.S. EPA has identified, implemented, and used performance indicators for its national enforcement and compliance assurance program are very different than the circumstances facing developing or transitioning nations. Based on presentations from a variety of nations at indicator workshops over the last two years, there are at least five challenges confronting developing and transitioning countries as they attempt to develop environmental and compliance indicators.
1. Compliance culture in formative stages
In many countries, the obligation to comply with environmental (and other) requirements is not yet ingrained deeply. In some countries, the rule of law is not yet embraced deeply by citizens, businesses, and institutions of government.
2. Environmental laws not implemented fully
Environmental laws may be relatively new, they may have undergone significant changes, there may not be much experience with the implementation of these laws or sections of the laws, and there may be impediments to implementation of specific sections of the laws.
3. Environmental agencies not mature
The operation of environmental agencies may not be very sophisticated, they may possess limited capabilities and they may have severe resource shortages, and may even be struggling for viability.
4. Jurisdictional issues
National, regional, state/provincial, or local/municipal levels of government may not have clear roles and responsibilities, or such responsibilities may be clear but one level of government is not implementing them or doing so in a dysfunctional way.
5. Systematic data collection lacking
Some countries lack data systems or may be only beginning to develop them. In the absence of organised efforts to report and collect data, even basic output indicators are difficult to establish.
163
These challenges are inter-related. For example, developing a compliance culture may be impeded in countries where environmental laws or agencies are not fully functional, and the lack of data reporting and collection systems may slow the effectiveness of environmental agencies. Finally, the fundamental tension between economic development and environmental protection is often exacerbated in developing and transitioning countries. The emphasis on economic improvement or expansion can often cause environmental protection to be a low priority for government attention.
In spite of these challenges, many developing and transitioning nations are implementing viable environmental compliance and enforcement programs and are moving to identify, develop and use performance indicators to measure the effectiveness of these programs. Here are some suggestions for beginning an effort to develop and implement indicators for environmental enforcement and compliance programs. These suggestions are the “lessons learned” drawn from reports and presentations from several nations at indicators workshops during the last two years, as well as the experience of the U.S. EPA’s enforcement and compliance indicators effort during the last five years. These suggestions can serve as a set of steps that should be especially helpful for developing and transitioning countries that want to make progress in developing enforcement and compliance indicators.
5.1 Determine the scope of the indicators
A fundamental issue that needs to be resolved at the beginning of any effort to develop indicators is the scope of the effort. Two questions need to be answered to determine the scope: Will the indicators be comprehensive (i.e., covering all laws and programs for which the agency is responsible) or focused (i.e., covering only a specific law or requirement, industry sector, geographic area, or non-compliance pattern)? Will the indicators be national (i.e., covering the national compliance and enforcement program) or sub-national (i.e., covering a program at the regional/district, state, or local/municipal level)?
5.1.1 Comprehensive National Indicators
When it becomes necessary to assess the overall effectiveness and improve management of the national environmental agency’s program to ensure compliance with environmental requirements in all federal statutes and regulations, indicators will need to be comprehensive and national.
This was the scope of EPA’s effort described in this paper. Appendix B. provides examples of the types of indicators EPA developed to measure the effectiveness of its national program. Developing a set of comprehensive national indicators is a very complex effort since it will involve many persons, multiple agencies, collection of data from many sources, and may require implementation of a national system.
5.1.2 Comprehensive Sub-National Indicators
When it becomes necessary to assess the overall effectiveness and improve the management of the compliance and enforcement program of a regional or district office of the national environmental agency, a state or provincial agency, or a local or municipal agency, indicators will need to be comprehensive and sub-national.

164
This type of indicators effort has the advantage of being a more manageable size than a comprehensive national effort. Developing a comprehensive set of indicators at a regional, state, or local level can often provide a means of testing a system of indicators which can later be applied to the national program.
5.1.3 Focused National Indicators
This type of effort is necessary when a national environmental agency wants to assess the effectiveness and improve management of a focused national initiative to address a specific non-compliance pattern or environmental risk.
Focused national indicators might be developed for an inspection and enforcement initiative to improve compliance among the petroleum refining industry, a targeted enforcement initiative to improve compliance with all air pollution requirements, or a strategy that integrates incentive and enforcement to reduce emissions of a specific pollutant into water bodies.
This type of effort is also a more manageable size than the comprehensive national effort because it focuses on a specific component or piece of the national program. For a focused national effort it is often advisable to develop indicators that are short-term and specifically tailored for the initiative being measured, rather than develop permanent long-term indicators that would be necessary for a comprehensive national set of indicators.
5.1.4 Focused Sub-National Indicators
This type of effort is necessary when a regional, provincial/state, or local/municipal agency wants to assess the effectiveness and improve management of a focused initiative to address a specific non-compliance pattern or environmental risk.
Focused sub-national indicators might be developed for a regional or state effort to use inspections and enforcement to control deforestation, or a municipal initiative to combine assistance followed by enforcement actions to limit illegal dumping of waste on the land. Focused sub-national indicators are generally short-term and specifically tailored for the initiative, and developing and using such indicators can provide a very useful learning experience for developing comprehensive national indicators at a later time.
5.2 Establish definitions of necessary terms
As mentioned in Section II on Identifying Indicators, it was extremely important in EPA’s indicators effort to have an agreed-upon set of definitions for key terms that were used by agency personnel and in the discussions with stakeholders. EPA provided definitions of outputs, intermediate outcomes, and end outcomes, and providing similar definitions would also aid indicator discussions the developing nations might have with their respective stakeholders. The definitions provide a framework for organising ideas, and allow agency program managers and external stakeholders to see how potential indicators might be used to improve management of the program. At some point, any effort to develop indicators will include a discussion about whether specific indicators under consideration are outputs, intermediate outcomes, or end outcomes.

165
5.3 Inventory existing data sources
A key step for developing nations interested in implementing environmental compliance and enforcement indicators is to assess the existing data available to support indicators. Is data currently being collected that can be the basis for useful indicators? For example, if data is being collected about enforcement actions issued by regional or district offices and by the national program, such data provide basic output indicators that can be valuable in monitoring operations. Data collection might also be expanded to begin gathering information about results from enforcement actions (e.g., pollution reductions), thereby providing intermediate outcome indicators.
5.4 Emphasise intermediate outcomes
As developing nations work to implement environmental compliance and enforcement indicators, it should be recognised that intermediate outcomes can be a source of very valuable indicators. In fact, intermediate outcomes should be emphasised when developing and implementing indicators. The advantage of intermediate outcomes is that they are often directly caused by the activities and outputs of the program – there is no ambiguity about the causal link between the enforcement actions and the resulting pollutant reduction, for example. Unfortunately, many efforts to develop indicators falter when they focus only on outputs and end outcomes. This is because there is often at best only a very weak link between the government activity and an improvement in an environmental condition. Also, measuring changes in end outcomes can be very expensive, the end outcomes may take years to appear, and improvements in end outcomes such as air or water quality can be influenced by many factors beyond the scope of government activity. For all these reasons, intermediate outcomes should receive appropriate consideration in any effort to develop indicators.
5.5 Conduct pilot projects
The use of pilot projects to develop and implement environmental compliance and enforcement indicators is highly recommended. Pilot projects provide a period of time for indicators to be developed and tested before being implemented fully. During this period, data can be analysed, indicators can be refined or adjusted, and mistakes can be corrected. Pilot projects can be designed to test indicators on a small scale (e.g., a focused sub-national project as described in #1 above), and can then be expanded and applied on a larger scale (e.g., a comprehensive national project). Pilot projects are most helpful when there is a concerted effort to identify the lessons learned from the project at its conclusion. These lessons are vital for moving from a small scope pilot to a larger scope effort.

166