Importance of Physical Activity & Importance of Subjective Experiences
NUREGICR-3385 BMI-2103 RX
NUREG/CR--3 3 85
DE83 902819
Measures of Risk Importance And Their Applications
Manuscript Completed: March 1983 Date Published: July 1983
Prepared by W. E. Vesely, T. C. Davis, R. S. Denning, N. Saltos
Battelle Columbus Laboratories 505 King Avenue Columbus, Ohio 43201
Prepared for Division of Risk Analysis Office of Nuclear Regulatory Research U.S. Nuclear Regulatory Commission Washington, D.C. 20555 NRC FIN 82386
\
DlSTRfBVTlON OF THIS DOCUMENT IS WntlMlTw n

DISCLAIMER
This report was prepared as an account of work sponsored by an agency of the United States Government. Neither the United States Government nor any agency Thereof, nor any of their employees, makes any warranty, express or implied, or assumes any legal liability or responsibility for the accuracy, completeness, or usefulness of any information, apparatus, product, or process disclosed, or represents that its use would not infringe privately owned rights. Reference herein to any specific commercial product, process, or service by trade name, trademark, manufacturer, or otherwise does not necessarily constitute or imply its endorsement, recommendation, or favoring by the United States Government or any agency thereof. The views and opinions of authors expressed herein do not necessarily state or reflect those of the United States Government or any agency thereof.

DISCLAIMER Portions of this document may be illegible in electronic image products. Images are produced from the best available original document.
ACKNOWLEDGEMENTS
The authors would like to express their appreciation to a number o f people who contributed to this document. Burdick, and other members of the NRC staff provided guidance and suggestions throughout the project. Strenge of Battelle's Pacific Northwest Laboratories supplied the consequence factor information and also provided a thorough review o f the draft document. Pete Cybulskis contributed his insights and suggestions regarding the containment response and system behavior. Angie Galleger, Tina Payne, and Mike Pearson for their assistance in preparation o f this document.
Roger Blond, Ken Murphy, Gary
John Burnham, Russ Rhoads, Ray Galluchi, and Dennis
Thanks also go to Lynn Carey,

I I
NOTICE
This report was prepared as an account of work sponsored by an agency of the United States Government. Neither the United States Government nor any agency thereof, or any of their employees, makes any warranty, expressed or implied, or assumes any legal liability of re- sponsibility for any third party’s use, or the results of such use, of any information, apparatus, product or process disclosed in this report, or represents that its use by such third party would not infringe privately owned rights.
I J
Availability of Reference Materials Cited in NRC Publications
Most documents cited in NRC publications will be available from one of the following sources:
1. The NRC Public Document Room, 1717 H Street, N.W. Washington, DC 20555
2. The NRC/GPO Sales Program, U.S. Nuclear Regulatory Commission, Washington, DC 20555
3. The National Technical Information Service, Springfield,.VA 22161
Although the listing that follows represents the majority of documents cited in NRC publications, it is not intended to be exhaustive.
Referenced documents available for inspection and copying for a fee from the NRC Public Docu- ment Room include NRC correspondence and iriternal NRC memoranda; NRC Office of Inspection and Enforcement bulletins, circulars, information notices, inspection and investigation notices; Licensee Event Reports; vendor reports and correspondence; Commission papers; and applicant and licensee documents and correspondence.
The following documents in the NUREG series are available for purchase from the NRC/GPO Sales Program: formal NRC staff and contractor reports, NRC-sponsored conference proceedings, and NRC booklets and brochures. Also available are Regulatory Guides, NRC regulations in the Code of Federal Regulations. and Nuclear Regulatory Commission Issuances.
Documents available from the National Technical Information Service include NUREG series reports and technical reports prepared by other federal agencies and reports prepared by the Atomic Energy Commission, forerunner agency to the Nuclear Regulatory Commission.
Documents available from public and special technical libraries include al l open literature items, such as books, journal and periodical articles, and transactions. Federal Regisrer notices, federal and state legislation, and congressional reports can usually be obtained from these libraries.
Documents such as theses, dissertations, foreign reports and translations, and non-N RC conference proceedings are available for purchase trom the organization sponsoring the publication cited.
Single copies of NRC draft reports are available free upon written request to the Division of Tech- nical Information and Document Control, U.S. Nuclear Regulatory Commission, Washington, DC 20555.
Copies of industry codes and standards used in a substantive manner in the NRC regulatory process are maintained at the NRC Library, 7920 Norfolk Avenue, Bethesda, Maryland, and are available there for reference use by the public. Codes and standards are usually copyrighted and may be purchased from the originating organization or, if they are American National Standards, from the American National Standards Institute, 1430 Broadway. New York, NY 1001 8.
GPO Printed copy price $425-

i I
TABLE OF CONTENTS
Page
EXECUTIVE SUMMARY . . . . . . . . . . . . . . . . . . . . . . . . . . . . i
PROJECT OVERVIEW . . . . . . . . . . . . . . . . . . . . . . . . . . . . . ix
1.0 INTRODUCTION . . . . . . . . . . . . . . . . . . . . . . . . . . . . 1
2.0 DEFINITION OF RISK ACHIEVEMENT WORTH . . . . . . . . . . . . . . . . 3
3.0 DEFINITION OF RISK REDUCTION WORTH . . . . . . . . . . . . . . . . . 5
4.0 RELATIONSHIP TO OTHER IMPORTANCE MEASURES . . . . . . . . . . . . . . 7
5.0 PORTRAYALS AND UTILIZATIONS OF THE RISK WORTHS . . . . . . . . . . . 9
6.0 EXTENSIONS TO RISK IMPACT CURVES . . . . . . . . . . . . . . . . . . 13
7.0 RSSMAP RISK ESTIMATES . . . . . . . . . . . . . . . . . . . . . . . . 16
8.0 WORTHS OF FEATURES WITH REGARD TO CORE MELT FREQUENCY . . . . . . . . 8.1 Sequoyah . . . . . . . . . . . . . . . . . . . . . . . . . . . . 20 8.2 Oconee . . . . . . . . . . . . . . . . . . . . . . . . . . . . . 26 8.3 Calvert Cliffs . . . . . . . . . . . . . . . . . . . . . . . . . 35 8.4 Grand Gulf . . . . . . . . . . . . . . . . . . . . . . . . . . . 46 8.5 Comparisons . . . . . . . . . . . . . . . . . . . . . . . . . . 52 8.6 Risk Impact Curves . . . . . . . . . . . . . . . . . . . . . . . 57
20
9.0 CONTAINMENT ANALYSIS . . . . . . . . . . . . . . . . . . . . . . . . 64
9.1 Risk Worths of RSSMAP Containments . . . . . . . . . . . . . . . 64 9.2 Effect of Containment Design . . . . . . . . . . . . . . . . . . 69 9.3 Effect of Containment Failure Pressure . . . . . . . . . . . . . 74 9.4 Definition of containment Reliability Measures . . . . . . . . . 75
REFERENCES . . . . . 83
LIST OF FIGURES
Figure 1 . Graphic Portrayal of Risk.Worths . . . . . . . . . . . . . . . 10 Figure 2 . Figure 3 .
Risk Impact Curve on a Ratio Scale . . . . . . . . . . . . . . Risk Impact Curve on an Interval Scale . . . . . . . . . . . .
Regard to Core Melt Frequency . . . . . . . . . . . . . . . .
14
15
Figure 4 . Risk Worth Ratios for Sequoyah Safety Functions With 2 1
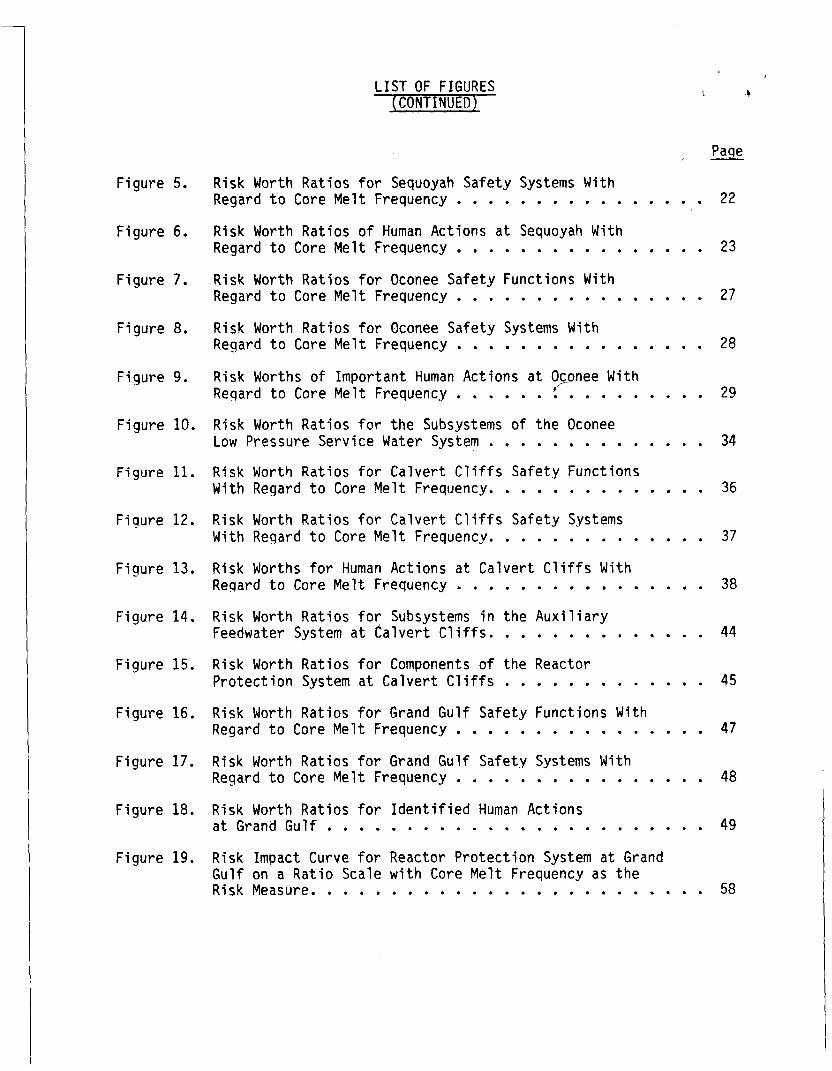
LIST OF FIGURES (CONTINUED)
Page
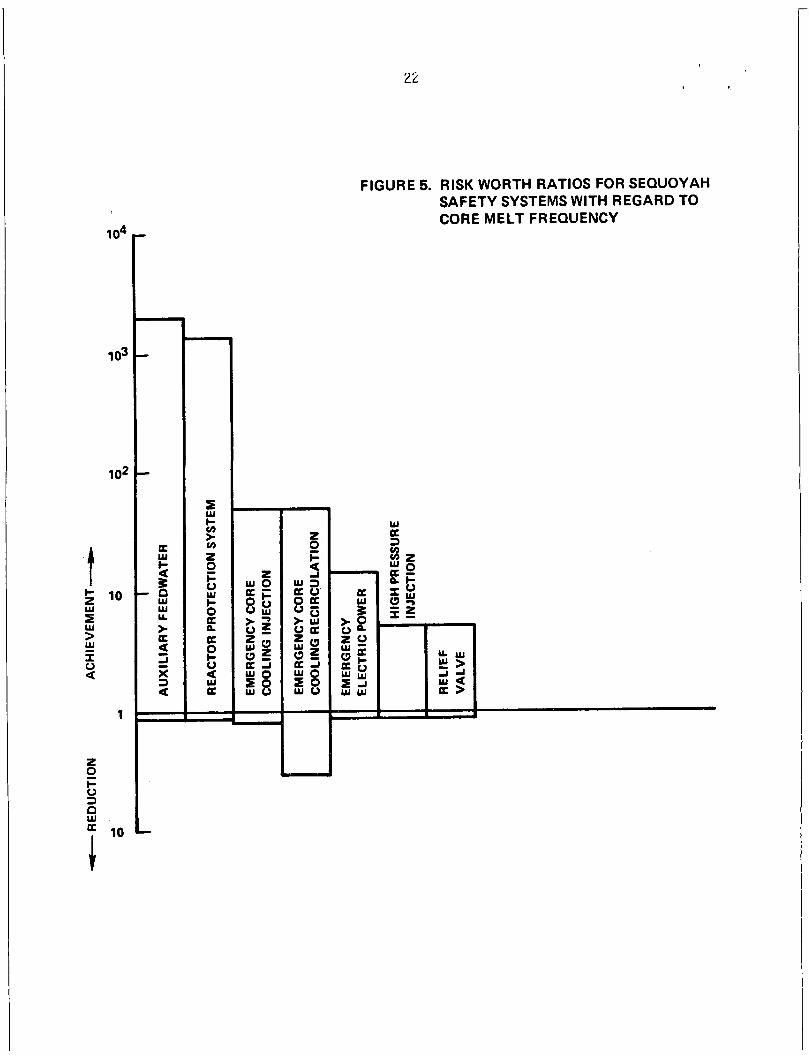
22 F igure 5. Risk Worth Rat ios f o r Sequoyah Safety Systems With
Regard t o Core Mel t Frequency . . . . . . . . . . . . . . . . Figure 6. Risk Worth Rat ios o f Human Act ions a t Sequoyah With
Regard t o Core Mel t Frequency . . . . . . . . . . . . . . . . 23
Figure 7. Risk Worth Rat ios f o r Oconee Safety Functions With Regard t o Core Mel t Frequency . . . . . . . . . . . . . . . . 27
Figure 8. Risk Worth Rat ios for Oconee Safety Systems With Regard t o Core Mel t Frequency . . . . . . . . . . . . . . . . 28
Figure 9. Risk Worths o f Important Human Act ions a t 09onee With Regard t o Core Mel t Frequency . . . . . . ! . . . . . . . . . 29
Figure 10.
F igure 11.
Risk Worth Rat ios fo r the Subsystems o f t h e Oconee Low Pressure Service Water System . . . . . . . . . . . . . . 34
Risk Worth Rat ios fo r Ca lver t C l i f f s Safety Funct ions With Regard t o Core Mel t Frequency. . . . . . . . . . . . . . 36
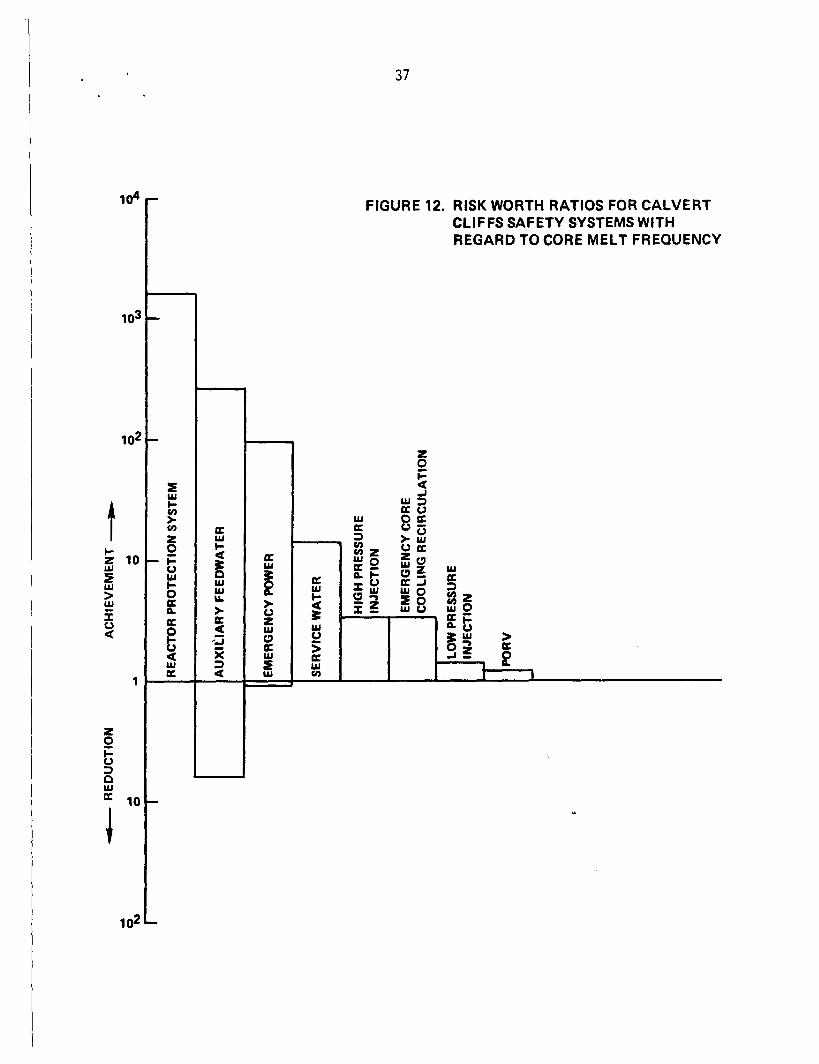
F iqure 12. Risk Worth Rat ios f o r Ca lver t C l i f f s Safety Systems With Regard t o Core Mel t Frequency. . . . . . . . . . . . . . 37
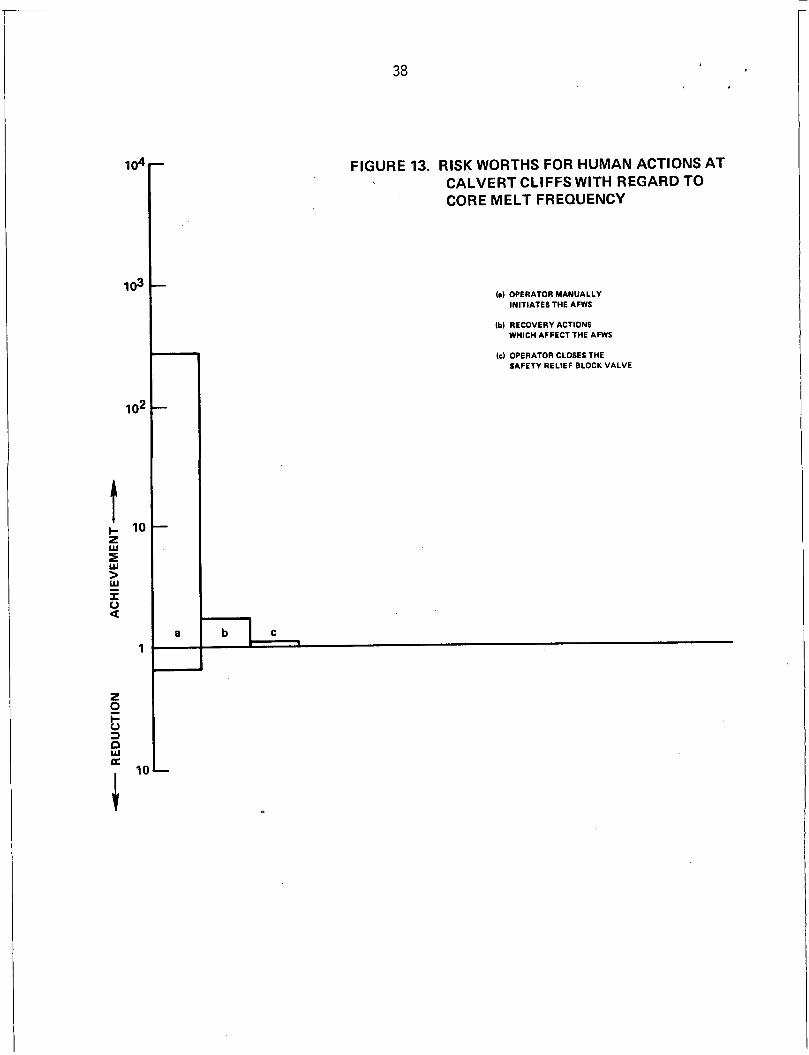
F igure 13. Risk Worths f o r Human Act ions a t Ca lver t C l i f f s With Regard t o Core Mel t Frequency . . . . . . . . . . . . . . . . 38
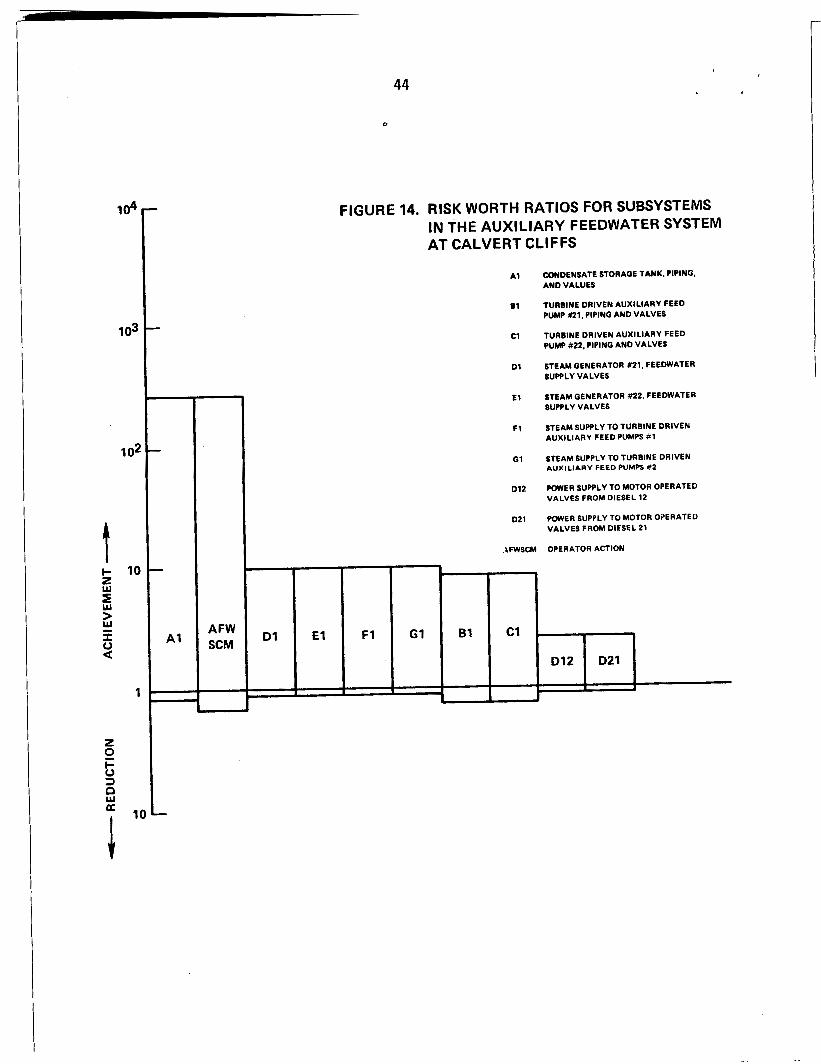
Figure 14. Risk Worth Rat ios f o r Subsystems i n the A u x i l i a r y Feedwater System a t Ca lver t C l i f f s . . . . . . . . . . . . . . 44
Figure 15. Risk Worth Rat ios f o r Components o f the Reactor P r o t e c t i o n System a t Ca lver t C l i f f s . . . . . . . . . . . . . 45
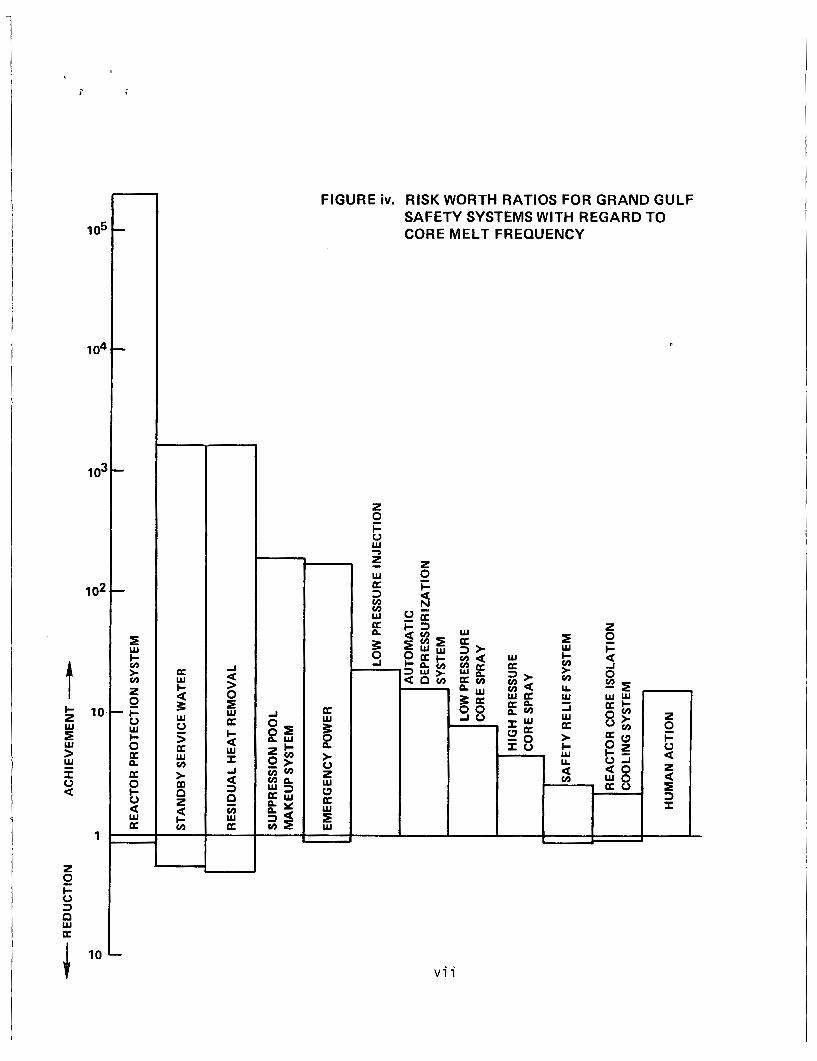
Figure 16. Risk Worth Rat ios f o r Grand Gul f Safety Functions With Regard t o Core Mel t Frequency . . . . . . . . . . . . . . . . 47
Figure 17. Risk Worth Rat ios f o r Grand Gul f Safety Systems With Regard t o Core M e l t Frequency . . . . . . . . . . . . . . . . 48
Figure 18. Risk Worth Rat ios f o r I d e n t i f i e d Human Act ions a t Grand G u l f . . . . . . . . . . . . . . . . . . . . . . . . 49
Figure 19. Risk Impact Curve f o r Reactor Pro tec t ion System a t Grand Gu l f on a R a t i o Scale w i th Core Mel t Frequency as the Risk Measure. . . . . . . . . . . . . . . . . . . . . . . . . 58

....... ..... . . . . . . . . . . . . .
LIST OF FIGURES 1 CONTINUED)
Page
Figure 20. Risk Impact Curve for Auxiliary Feedwater System at Calvert Cliffs on a Ratio Scale With Core Melt Frequency as the Risk Measure . . . . . . . . . . . . . . . . . 59
Figure 21. General Cost Effectiveness Curve. . . . . . . . . . . . . . . 61
Figure 22. Cost Effectiveness Curve for Improvement to the Reactor Protection System at Grand Gulf . . . . . . . . . . . . . . . 62
Figure 23. Cost Effectiveness Curve for Improvement to the Auxiliary Feedwater System at Calvert Cliffs. . . . . . . . . . . . . . 63
Figure 24. Risk Worth Ratios of the Containments at the Four RSSMAP Plants With Respect to Manrem . . . . . . . . . . . . . . . . 66
Figure 25.
Figure 26.
Risk Versus Mean Failure Pressure at Oconee With u = 2 O p s i . . . . . . . . . . . . . . . . . . . . . . . . . . 76
Assumed Mean Failure Pressures. . . . . . . . . . . . . . . . 78 Risk Worth Ratios for Manrem at Oconee for Different
LIST OF TABLES
Table 1. RSSMAP Plants. . . . . . . . . . . . . . . . . . . . . . . . . 16
Table 2. Consequence Factors for a Reference 1120 MWe Plant . . . . . . 19
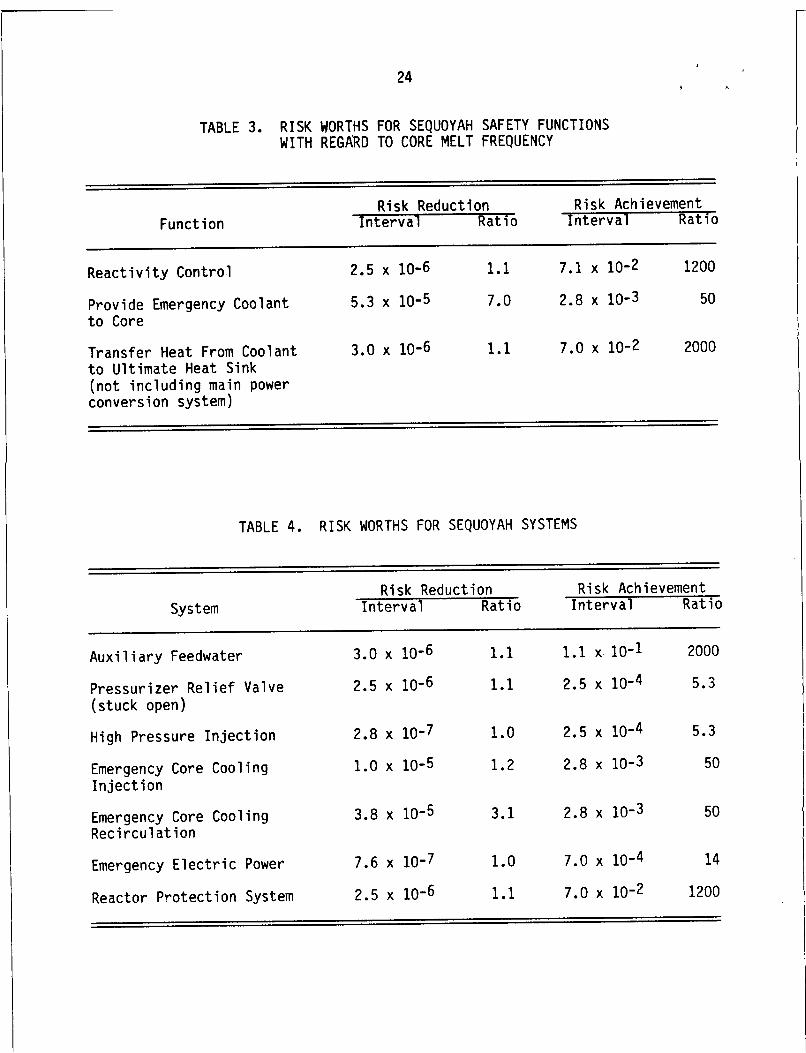
Table 3. Risk Worths for Sequoyah Safety Functions With Regard to Core Melt Frequency. . . . . . . . . . . . . . . . . 24
Table 4. Risk Worths for Sequoyah Systems . . . . . . . . . . . . . . . 24 Regard to Core Melt Frequency. . . . . . . . . . . . . . . . . 25
Table 5. Risk Worths of Human Errors at Sequoyah With
Table 6. Risk Worths for.Oconee Safety Functions With Regard to Core Melt Frequency. . . . . . . . . . . . . . . . . 30
Table 7. Risk Worths for Oconee Systems With Regard to Core Melt Frequency. . . . . . . . . . . . . . . . . . . . . . 30
Table 8.
Table 9.
Risk Worths of Important Human Actions at Oconee
Risk Worths for the Subsystems of the Oconee Low
With Regard to Core Melt Frequency . . . . . . . . . . . . . . 31
Pressure Service Water System. . . . . . . . . . . . . . . . . 33

LIST OF TABLES (CONTINUED) 1 h
Page
Table 10 . Risk Worths for Calvert Cliffs Safety Functions With Regard to Core Melt Frequency . . . . . . . . . . . . . . . . . 35
Table 11 . Risk Worths for Calvert Cliffs Safety Systems With Regard to Core Melt Frequency . . . . . . . . . . . . . . . . . 39
Table 12 . Risk Worths for Calvert Cliffs Human Actions With Regard to Core Melt Frequency . . . . . . . . . . . . . . . . . 39
Table 13 . Risk Worths for Subsystems in the Auxiliary Feedwater System at Calvert Cliffs . . . . . . . . . . . . . . . . . . . 42
Table 14 . Risk Worths for Components in the Auxiliary Feedwater System at Calvert Cliffs . . . . . . . . . . . . . . . . . . . 43
Table 15 . Risk Worths for Components of the Reactor Protection S. ystem at Calvert Cliffs . . . . . . . . . . . . . . . . . . . 46
Table 16 . Risk Worths f o r Grand Gulf Safety Functions With Regard t o Core Melt Frequency . . . . . . . . . . . . . . . . . 46
Table 17 . Risk Worths for Grand Gulf Safety Systems With Regard to Core Melt Frequency . . . . . . . . . . . . . . . . . 50
Table 18 . Risk Worths for Identified Human Actions at Grand Gulf With Regard to Core Melt Frequency . . . . . . . . . . . . . . . 51
Table 19 . Core Melt Frequencies for the Four RSSMAP Plants . . . . . . . 53
Table 20 . Risk Worths for the Reactivity Control Function at the Four RSSMAP Plants . . . . . . . . . . . . . . . . . . . . . . 53
Table 2 1 . Risk Worths for the Emergency Core Cooling Function at the Four RSSMAP Plants . . . . . . . . . . . . . . . . . . . 54
Table 22 . Risk Worths for the Heat Removal Function at the Four RSSMAP Plants . . . . . . . . . . . . . . . . . . . . . . 55
Table 23 . Containment Risk Worths . . . . . . . . . . . . . . . . . . . . 65
Table 24 . Containment Analysis . . . . . . . . . . . . . . . . . . . . . 68
Table 25 . Total Source Release . . . . . . . . . . . . . . . . . . . . . 68
Table 26 . Containment Parameters . . . . . . . . . . . . . . . . . . . . 70
Table 27 . Risk for Different Containments on One Plant . . . . . . . . . 71
LIST OF TABLES (CONTINUED)
Page
Table 28. Risk Worths for Different Containments on One Plant.. . . . . . . . . . . . . . . . . . . . . . . . . . . . 72
Table 29. Risk Estimates as a Function of Mean Failure Pressure. . . . . 75 Table 30. Risk Worths for Oconee as a Function of Mean
Failure Pressure . . . . . . . . . . . . . . . . . . . . . . . 77 Table 31. Containment Reliability Measures for Acute Fatalities
for the RSSMAP Plants Assuming No Evaluation . . . . . . . . . 81
Table 32. Containment Reliability Measures for Manrem for the RSSMAP Plants Assuming No Evacuation . . . . . . . . . . . . . 82
I

. . . . .
I
I EXECUTIVE SUMMARY
The objectives of this work are to evaluate the importance of the containment and the different safety functions as assessed in probabilistic risk analyses. defined to evaluate a feature's importance in further reducing the risk and its importance in maintaining the present risk level. measure, called the feature's risk reduction worth, is useful for prioritizing feature improvements which can most reduce the risk. importance, called the feature's risk achievement worth, is useful for priori- tizing features which are most important in reliability assurance and main- tenance activities.
Any type of feature can be evaluated for its risk reduction worth and its risk achievement worth; safety functions, safety systems, components, surveillance tests, human activities, mitigation functions, and containments can all be quantified as to their worths. Evaluating the worth in a struc- tured manner from general safety function worths to detailed component, test, and human activity worths allows one to successively focus on the important items. The worths also provide important information for cost-benefit and value-impact analysis, as the report describes. The limitations, assumptions and uncertainties of Probabilistic Risk Analysis should be considered when making risk based decisions.
To accomplish this objective, risk importance measures are
One defined importance
The other defined
Sensitivity analysis can be used to identify the importance of assumptions and areas where more in-depth analysis is needed. Since much of the information contained in the risk importance measures is relative, much of the analyses can be made robust to risk analysis u n c e r t a i n t i e s .
The defined risk worth measures are applied to the risk analyses performed in the Reactor Safety Study Methodology Applications Program (RSSMAP). Four plants were analyzed in RSSMAP: Oconee, Grand Gulf, Calvert Cliffs, and Sequoyah, and the risk worths are applied to each of the plant's risk analysis. Safety functions, safety systems, containment, and certain
I components and human activities are specifically evaluated for their worths. A summary of the findings of the RSSMAP evaluations for the systems
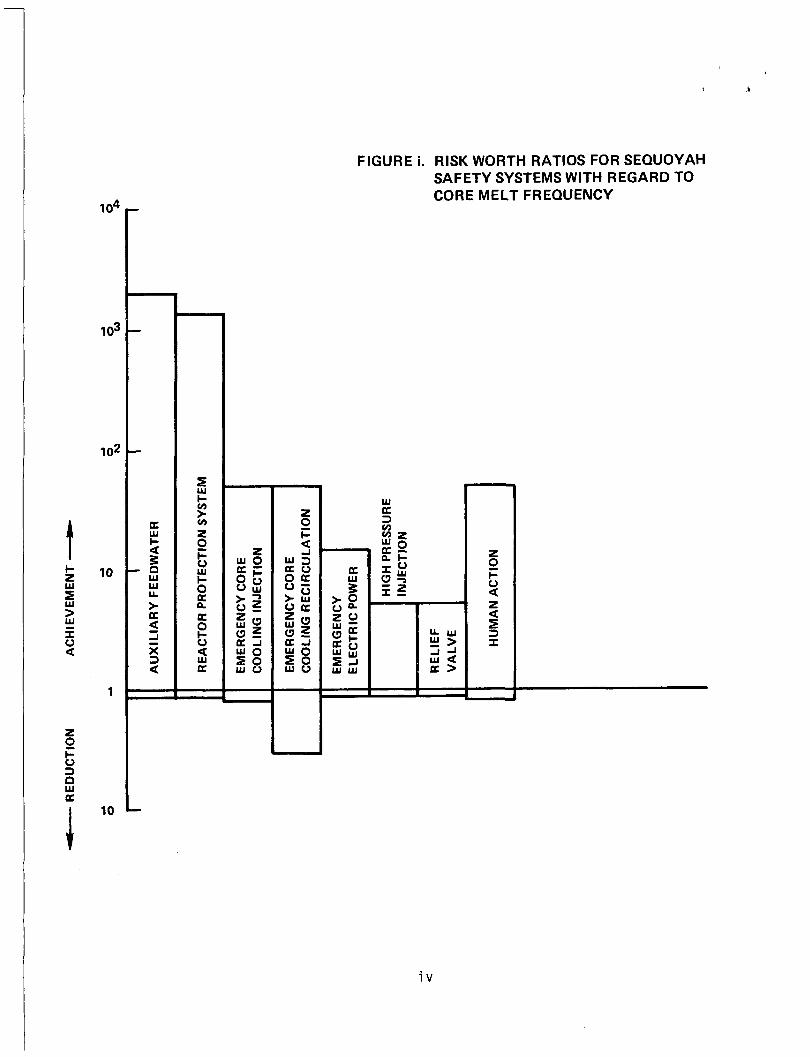
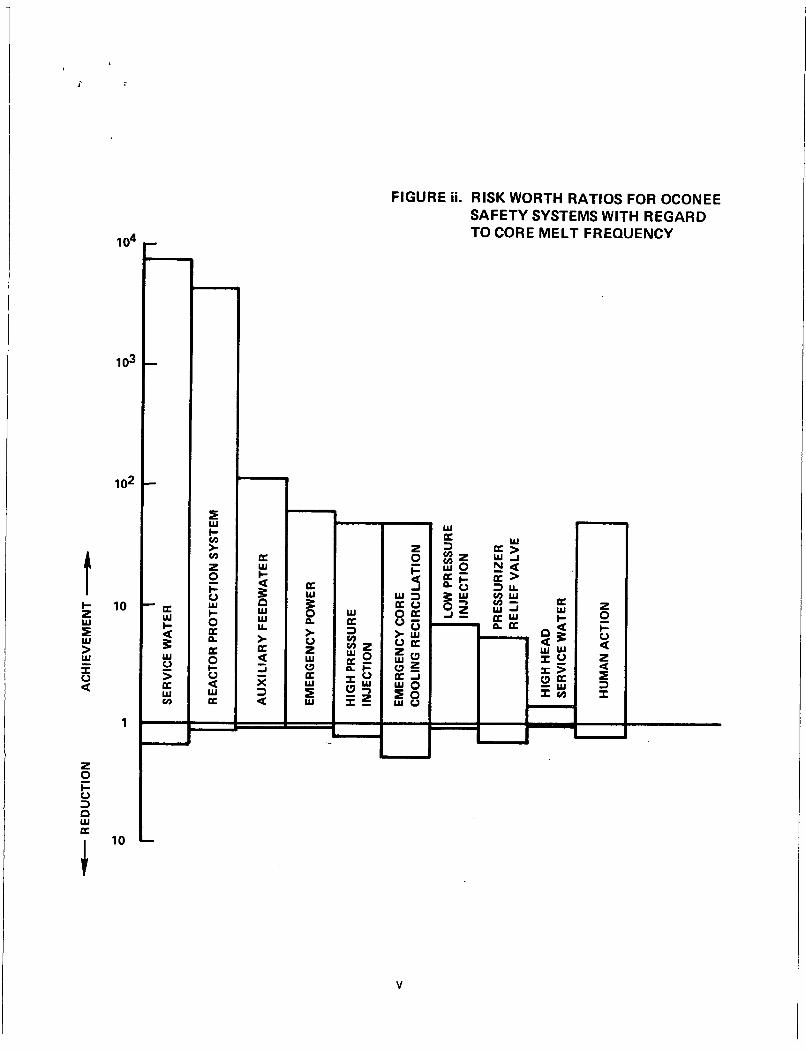
at each of the four plants is presented on Figures i, ii, i i i , and iv which are extracted from the body of the report. The figures show the risk
i

1
achievement ratios and the risk reduction ratios on the same graph with core melt frequency as the risk measure. factor by which core melt frequency would increase if the system did not exist or were not operable. dividing line and indicate the maximum factor by which core melt frequency could be reduced at the plant by improving the system. identified by RSSMAP which had the largest risk achievement worth is also shown for each of the four plants.
most to achieving the present risk level and toward which reliability assur- ance activities should be directed. worths of certain systems and the differences of feature worths amonq plants. The high importance of support systems such as service water is highlighted by the figures. The importance of certain front line systems such as the reactor protection system is also emphasized by their large risk achievement worths.
core melt frequency reduction potentials are small, less than a factor of 2. A core melt frequency reduction potential of greater than a factor of 5 was calculated for only one system at one plant (the auxiliary feed system at Calvert Cliffs).
reduction worths indicate that attention should not be diverted from main- taining and assuring the present reliabilities when efforts are undertaken to reduce risk.
From the importance evaluations performed, human actions as modeled by RSSMAP are found to be near optimal. reliability would not reduce risk significantly whereas degraded human performance could markedly increase risk.
to the containments of each of the RSSMAP plants. containment worths were acute fatalities and dose rather than core melt frequency.
extracted from the body of the report. the containment presently reduces dose by a factor of about 3 and reduces
The risk achievement ratios are the
The risk reduction worths are graphed below the
The human action
The risk achievement worths identified the features which contribute
What stands out most is the very high
As observed from the figures for most systems and human actions t h e
In general, the high risk achievement worths and relatively low risk
Improvement of the associated human
The risk worth measures developed in this report were also applied The risk measures for the
The containment worth results are shown in Table i, which has been The risk achievement ratios indicate
i i
i I
early fatalities by a factor 9f 10. acute fatalities could be reduced to essentially zero (giving a risk reduction ratio of infinity) for those plants not having the V sequence (releases which bypass containment). reduced by a factor of ~10. reduced by a factor of ~ 1 0 0 0 if containment were optimized; for plants with V , a factor of $10 is the most that dose can be reduced.
The risk reduction ratios indicate that I '
With the V sequence acute fatalities could at most be For those plants without V, manrem could be
In order to further investigate the importance of containment, one o f the plants was analyzed assuming different containment designs could be placed on one system design. containment design. order of magnitude or more importance to risk estimates. tivity studies were performed and are described in the report.
The risk worths were then calculated for each The results showed the containment design could have an
Additional sensi-
i i i
- RE
DU
CTI
ON
A
CH
IEV
EM
EN
T
AU
XIL
IAR
Y F
EE
DW
ATE
R
d
0
RE
AC
TOR
PR
OTE
CTI
ON
SY
STE
M
-
a
0
h)
EM
ER
GE
NC
Y
ELE
CTR
IC P
OW
ER
d
0 P
~~ RE
LIE
F V
AL
VE
1
I H
UM
AN
AC
TIO
N
n - G
) C
70
m -.
I
PR
ES
SU
RIZ
ER
R
EL
IEF
VA
LVE
<
7- R
ED
UC
TIO
N
AC
HIE
VE
ME
NT -
4
0 I
i! c
4
0 I
I I
I 1
SE
RV
ICE
WA
TER
I I I
REA
CTO
R P
RO
TEC
TIO
N S
YS
TEM
1 H
UM
AN
AC
TIO
N
E
G)
C
z
m -. -. ..
. m

a
lEA
CTO
R P
RO
TEC
TIO
N S
YS
TEM
- RE
DU
CIT
ON
A
CH
IEV
EM
EN
T -
I PO
RV
4
4
0 F--+---
4
0
a
0
0
4
0 P
a
m -. -. -.
mm
z
a
0-
I
C
RE
DU
CTI
ON
A
CH
IEV
EM
EN
T
I 0
*
4
4
a
0
0
0
0
4 I
I W
P
m
0
N
4
I I
I R
EA
CTO
R P
RO
TEC
TIO
N S
YSTE
M
STA
ND
BY
SE
RV
ICE
WA
TER
RE
SID
UA
L H
EA
T R
EM
OV
AL
SUPP
RES
SIO
N P
OO
L M
AK
EU
P S
YS
TEM
EM
ER
GE
NC
Y P
OW
ER
LOW
PR
ESSU
RE
INJE
CTI
ON
AU
TOM
ATI
C
DE
PR
ES
SU
RIZ
ATI
ON
SY
STEM
LOW
PR
ESSU
RE
CO
RE
SPR
AY
HIG
H P
RES
SUR
E
4.
--lo
n
c)
C 3
m - -. C
L
I- n

1
TABLE i. CONTAINMENT R I S K WORTHS
Risk Reduction Worth Risk Achievement Worth R a t i o R a t i o
P1 an t Acute Acute
Manrem F a t a l i t i e s Manrem F a t a l i t i e s
Sequoyah w i t h V 12.5 w i t h o u t V 1726.
11.8 OD
2.12 2.21
9.09 9.93
Oconee wi th V w i t h o u t V
9.7 888.
10.0 OD
3.53 3.82
13.4 14.6
C a l v e r t C1 i f f s
Grand Gulf
1657.
2886.
OD
OD
2.40
1.34
8.69
10.6
v i i i

i PROJECT OVERVIEW
s $
This work is part of a project being conducted for the Division of Risk Analysis (ORA) of the Nuclear Regulatory Commission (NRC). tives of the project are to evaluate the importances of containment, the different safety functions, and other various contributers as assessed in probabi 1 istic risk analyses and to identify generic conclusions regarding the importances. these objectives.
first identified and then they need to be evaluated for the different risk analyses which have been performed. This report describes the risk importance measures that were defined and were applied to the risk analyses which were performed as part of the Reactor Safety Study Methodology Applications Program (RSSMAP). The risk importance measures defined in this report measure the importance of features not only with regard to risk reduction but also with regard to reliability assurance, or risk maintenance.
The goal of this report is not to identify new mathematical formulas for risk importance but to show how importance measures can be interpreted and can be applied. When the defined risk importance measures are applied to the RSSMAP analyses, specific features and systems stand out as being more impor- tant than others. The containment worth is quantified as a function o f plant and design parameters and critical variables are identified by the importance evaluations. The risk importance measures and graphic displays as applied in this report appear to be useful tools for assisting in prioritizing regulatory and research activities.
only one class of measures that can be applied. measures which can be applied include those which quantify the importance of
where wear-out effects will have the largest risk impact, and those which prioritize contributions to uncertainty to show where data need to be collected and models need be developed. These other importance measures greatly increase the usefulness of probabilistic risk analysis and will be identified and applied in future work.
The objec-
Effective display of the importances is an important part of
To address these objectives, measures of risk importance need to be
The risk importance measures identified in this report constitute Other risk importance
I individual surveillance tests and maintenance activities, those which quantify
1
MEASURES OF RISK IMPORTANCE AND THEIR APPLICATION
1.0 INTRODUCTION
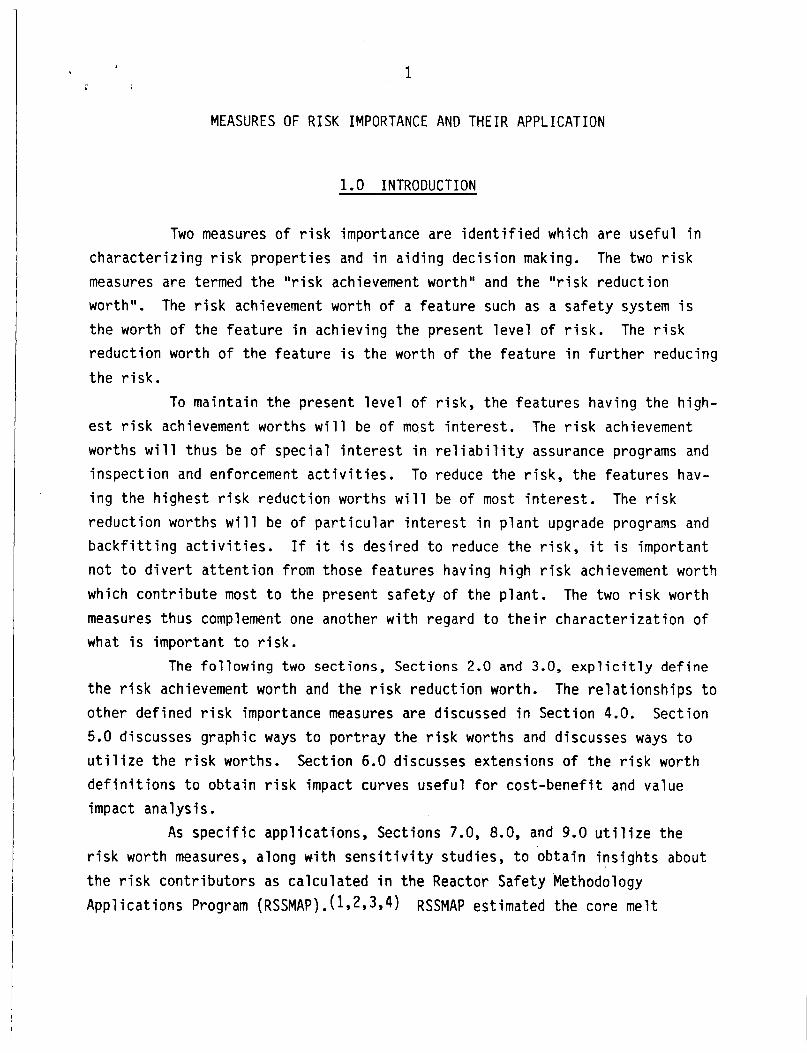
Two measures of risk importance are identified which are useful in characterizing risk properties and in aiding decision making. measures are termed the "risk achievement worth" and the "risk reduction worth". The risk achievement worth of a feature such as a safety system is the worth of the feature in achieving the present level of risk. The risk reduction worth o f the feature is the worth of the feature in further reducing the risk.
To maintain the present level of risk, the features having the high- est risk achievement worths will be of most interest. The risk achievement worths will thus be of special interest in reliability assurance programs and inspection and enforcement activities. To reduce the risk, the features hav- ing the highest risk reduction worths will be of most interest. The risk reduction worths will be of particular interest in plant upgrade programs and backfitting activities. If it is desired to reduce the risk, it is important not to divert attention from those features having high risk achievement worth which contribute most to the present safety of the plant. The two risk worth measures thus complement one another with regard to their characterization of what is important to risk.
The following two sections, Sections 2.0 and 3.0, explicitly define the risk achievement worth and the risk reduction worth. The relationships to other defined risk importance measures are discussed in Section 4.0. Section 5.0 discusses graphic ways to portray the risk worths and discusses ways to utilize the risk worths. Section 6.0 discusses extensions of the risk worth definitions to obtain risk impact curves useful for cost-benefit and value impact analysis.
As specific applications, Sections 7.0, 8.0, and 9.0 utilize the risk worth measures, along with sensitivity studies, to obtain insights about the risk contributors as calculated in the Reactor Safety Methodology Applications Program (RSSMAP). ( 1 9 2 , 3 9 4 )
The two risk
RSSMAP estimated the core melt

frequencies and release category frequencies from four different nuclear power plants using simplified WASH-1400 techniques. Section 7.0 outlines the RSSMAP approach, Section 8.0 evaluates the contributors to core melt frequency, and Section 9.0 focuses on the impact of containment with regard to releases and risks. evaluations also provide insights about the effects of RSSMAP models and assumptions.
In addition to providing insights about the risk contributors, the

i I 3
2.0 DEFINITION OF RISK ACHIEVEMENT WORTH
To measure the worth of a feature in achieving the present risk, a logical approach is to remove the feature and then determine how much the risk has increased. Thus, the risk achievement worth i s formally defined to be the increase in risk if the feature were assumed not to be there or to be failed.
Depending on how the increase in risk is measured, the risk achieve- ment worth can either be defined as a ratio or an interval. Let
RI = the increased risk level without feature i or with feature i assumed failed,
and
Ro = the present risk level, ( 2 )
where the risk can be any measure such as core melt frequency, expected dose, etc. defined as:
Then on a ratio scale the risk achievement worth Ai of feature i is
Ai = R:/Ro . On an interval scale the risk achievement worth Ai is defined as:
( 3 )
( 4 )
In calculating R T with feature i removed, it is important to consider other features which are also effectively removed because of inter- relationships or dependencies with feature i. Whether the ratio or interval definition is most pertinent will depend upon the particular utilization. When risk achievement worths are calculated for a given plant in order to prioritize the features then the ratio and interval definitions will generally give the same rankings. When the features of different plants are compared or when cost-benefit evaluations are performed, even for a single plant, then the

interval definition is generally more appropriate. I f different risk measures
different priorities can result and therefore it generally is useful to examine various risk measures to obtain a more complete picture of a feature's risk worth. further discussed in Section 5.0.
such as core melt frequency and expected early fatalities, are used, then RO ,
Utilizations of risk achievement worths in decision making are

5
3.0 DEFINITION OF R I S K REDUCTION WORTH
To measure the worth of a feature in reducing the pre ent ri k, a logical approach is to "optimize" the feature and then determine how much the risk has been decreased. to be the decrease in risk if the feature were assumed to be optimized or were assumed to be made perfectly reliable.
reduction worth can either be defined as a ratio or an interval. Let
Thus, the risk reduction worth is formally defined
Again, depending on how the decrease in risk is measured, the risk
Ri = the decreased risk level with the feature optimized or assumed to be perfectly reliable, ( 5 )
and again let R o be the present risk level. Then on a ratio scale, the risk reduction worth Di of feature i (the letter "D" denotes decrease) is defined as:
On an interval scale the risk reduction worth Di is:
As defined in the above manner, the risk reduction worth, Di or P i , i s always greater than or equal to one or is always positive, respectively.
features which are also effectively optimized should be included. whether the ratio or interval definition is u'sed will depend upon the specific application. For a given plant and for a given risk measure, the ratio and interval will generally give the same ranking of the features. The risk reduction worths of features will depend on the risk measure being examined. As for the risk achievement worths, when the features of different plants are compared or when cost-benefit analyses are performed, then the interval
In calculating RT with feature i optimized, other interrelated Again,

6
definition is generally more appropriate. reduction worths are further discussed in Section 5.0.
Utilizations of calculated risk
7
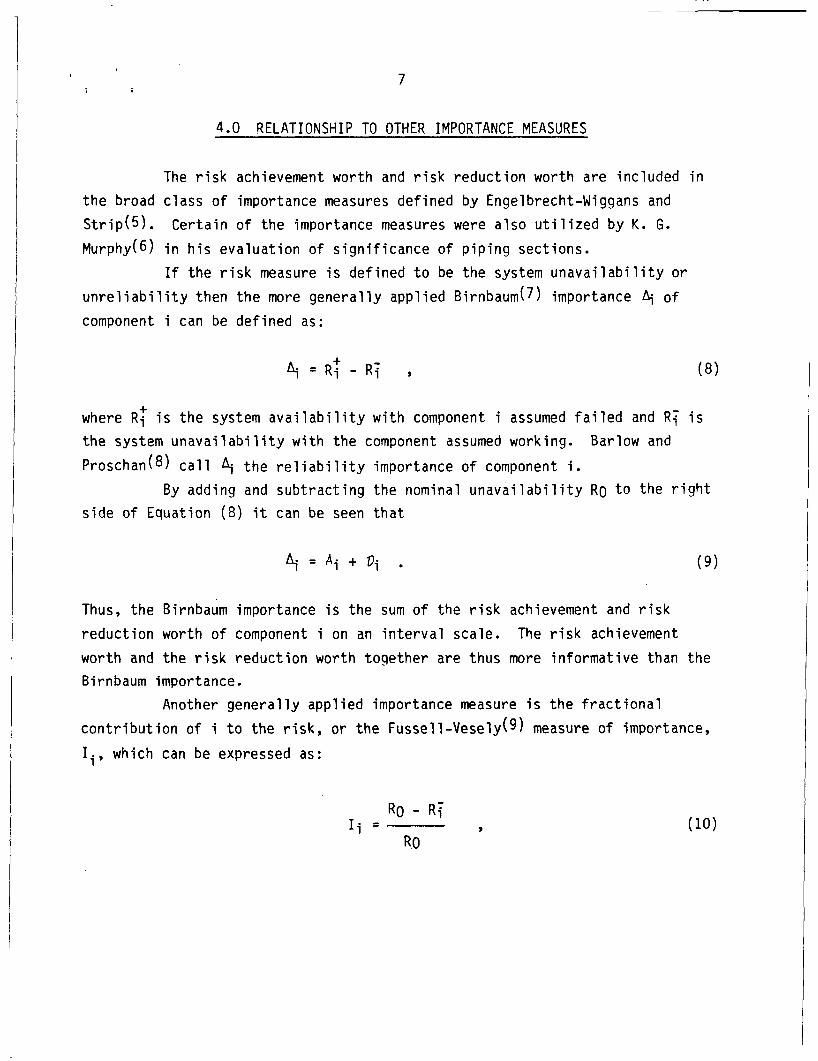
4.0 RELATIONSHIP TO OTHER IMPORTANCE MEASURES
The risk achievement worth and risk reduction worth are included in the broad class of importance measures defined by Engelbrecht-Wiggans and Strip(5). Certain of the importance measures were also utilized by K. G. Murphy(6) in his evaluation of significance o f piping sections.
unreliability then the more generally applied Birnbaum(7) importance 4. of component i can be defined as:
If the risk measure is defined to be the system unavailability or
where Rf is the system availability with component i assumed failed and R Y is the system unavailability with the component assumed working. Proschan(*) call 9 the reliability importance of component i.
side of Equation (8) it can be seen that
Barlow and
By adding and subtracting the nominal unavailability Ro to the right
Thus, the Birnbaum importance is the sum of the risk achievement and risk reduction worth of component i on an interval scale. The risk achievement worth and the risk reduction worth together are thus more informative than the Birnbaum importance.
contribution of i to the risk, or the Fusse l-Vesely(9) measure of importance, Ii, which can be expressed as:
Another generally applied importance measure is the fractional

8
where the numerator represents the risk due to contributor i. Equation (10)
can be expressed as:
or
1
Di - 1 Ii =
Di
Thus, the importance Ii is simply related to the risk reduction worth on a ratio scale, Di. The risk reduction worth on a ratio scale, however, gives only partial information about the risk importance of i; the interval measure and the risk achievement worth give important additional information about the importance o f i.

5.0 PORTRAYALS AND UTILIZATIONS OF THE RISK WORTHS
In addition to tabulating and ranking the risk worths, graphs and bar charts can be constructed to convey the information about the risk impor- tance of the features. risk achievement worth and risk reduction worth o f features on the same graph. The graph can either portray worths on a ratio or interval scale and logar- ithmic scales can be used for the worths (y-axis) when large variations exist in their values. Note in Figure 1 that the scale on the y-axis increases in the downward direction for the risk reduction worth. This type of graph will be used in the applications presented in Sections 7.0, 8.0, and 9.0.
to prioritize resources in a risk management program. highest risk achievement worths are those features indicated as being among those most important to the present safety and present risk level of the plant. Reliability assurance programs and maintenance and surveillance of the plant features can thereby be prioritized using the risk achievement worths of the features as one guide. priorities (e.g., by normalizing by their sum) they are a relative result and are robust to various risk analysis uncertainties. tive risk results has been recommended by a variety of individuals and groups including the Lewis Committee(lo), the TMI Committee(ll), and various NRC organ i tat ions. 12,13914)
to help focus and prioritize activities aimed at reducing risk. These risk reduction activities can focus modifications of plant operation or modifica- tions of design to those features having high reduction worths. Care must be taken when considering more than one change since the present risk level, Ro, would be affected by any change. For cost-benefit or value-impact evalua- tions, the costs of the changes need to be balanced against the risk reduc- tion. Since the risk reduction worth gives the maximum risk reduction possible for an improvement in the feature, the r i s k reduction worths can be
Figure 1 depicts one method of portraying both the
Once the risk worths are determined, they can be used as one guide The features having the
When the achievement worths are interpreted as
The utilization of rela-
Once the risk reduction worths are determined, they too can be used

10 Risk Achievement
Worth
1 eature 1 ea tu re 2
I 1
reature 3
Risk Reduction Worth
FIGURE 1. GRAPHIC POKTRAYAL OF R I S K WORTHS
11
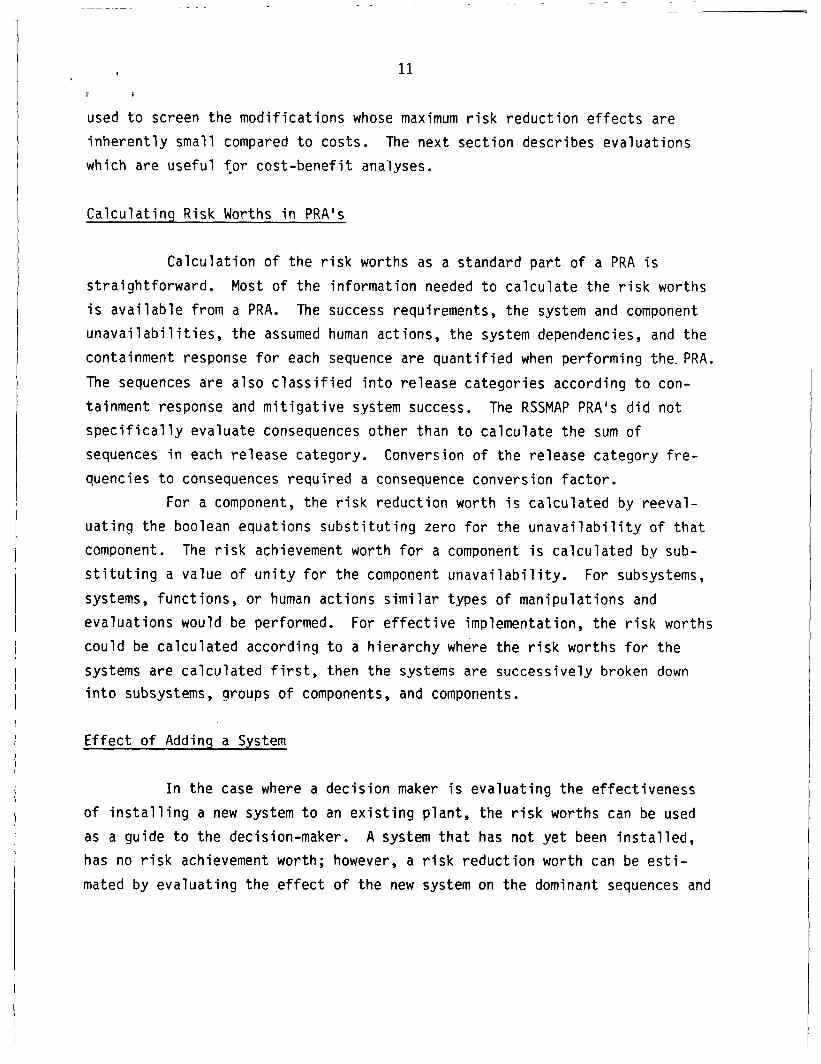
used to screen the modifications whose maximum risk reduction effects are inherently small compared to costs. The next section describes evaluations which are useful for cost-benefit analyses.
Calculating Risk Worths in PRA's
Calculation of the risk rorths as a standard pal t of a PRA is straightforward. Most of the information needed to calculate the risk worths is available from a PRA. The success requirements, the system and component unavailabilities, the assumed human actions, the system dependencies, and the containment response for each sequence are quantified when performing the. PRA. The sequences are also classified into release categories according to con- tainment response and mitigative system success. specifically evaluate consequences other than to calculate the sum of sequences in each release category. quencies to consequences required a consequence conversion factor.
uating the boolean equations substituting zero for tbe unavailability of that component. stituting a value o f unity for the component unavailability. For subsystems, systems, functions, or human actions similar types of manipulations and evaluations would be performed. could be calculated according to a hierarchy where the risk worths for the systems are calculated first, then the systems are successively broken down
into subsystems, groups of components, and components.
The RSSMAP PRA's did not
Conversion o f the release category fre-
For a component, the risk reduction worth is calculated by reeval-
The risk achievement worth for a component is calculated by sub-
For effective implementation, the risk worths
Effect of Adding a System
In the case where a decision maker i s evaluating the effectiveness of installing a new system to an existing plant, the risk worths can be used as a guide to the decision-maker. A system that has not yet been installed, has no risk achievement worth; however, a risk reduction worth can be esti- mated by evaluating the effect of the new system on the dominant sequences and
12
estimating its availability. i s then straightforwardly calkulated. the risk worths o f the existing systems would in general also'be affected.
The decreased risk level due to the added system If a new system were added to a plant,

, 13
6.0 EXTENSIONS TO RISK IMPACT CURVES
The risk achievement and risk reduction worths are somewhat gross measures of the risk importance in that the feature is either removed (assumed failed) or is assumed to be perfectly reliable in calculating the worths. extensions of these definitions, curves of the changes in risk versus the change in the feature's failure probability or reliability can be constructed. These curves are termed "risk impact curves'' since they show the impact on risk of changes in the feature's reliability. depict ratios or intervals depending upon the scale used to measure risk increases or decreases. The risk achievement worth and risk reduction worth will be two points on the curves representing limiting conditions.
Figure 2 illustrates a risk impact curve on a ratio scale; the curve depicts the risk as a function of the feature's failure probability. The risk is measured as a ratio R/Ro relative to the present risk Roo Similarly the feature's failure probability P is measured as a ratio P/Po relative to the present value Po. The risk achievement and risk reduction worths, on a ratio scale, are associated with the two limiting points shown in the figure.
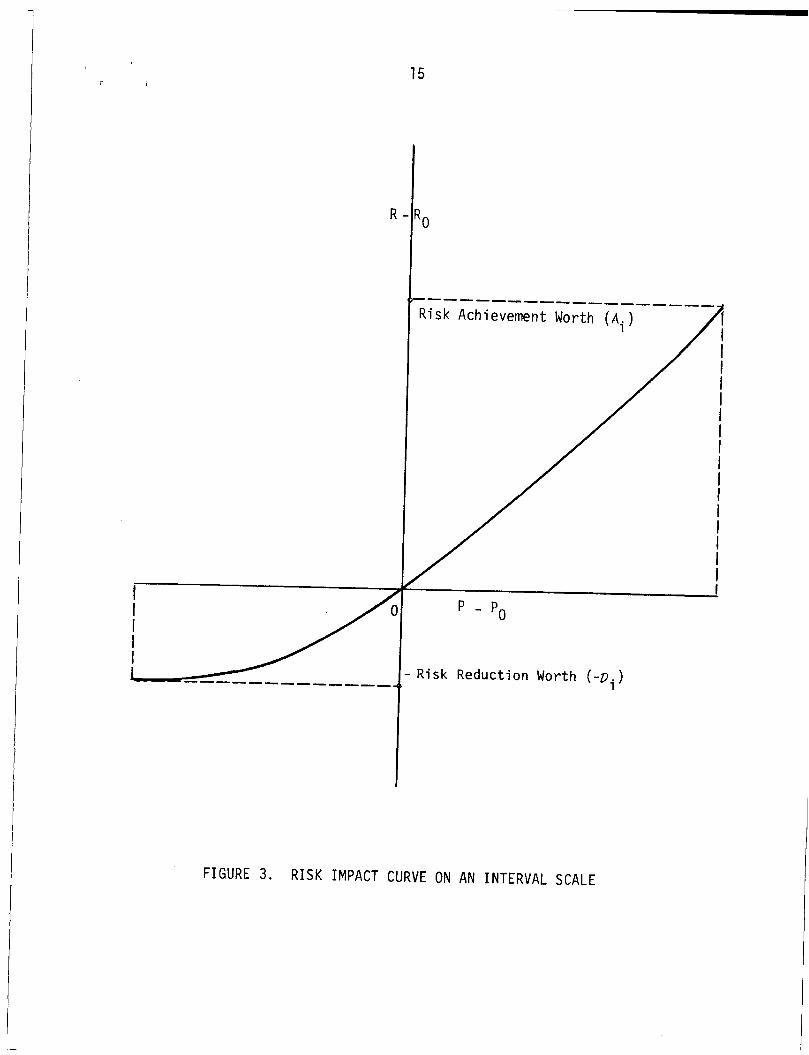
Figure 3 illustrates the risk impact on an interval scal'e. In this case, the risk i s measured as a difference R - Ro relative to the present value and the feature's failure probability is similarly measured as the dif- ference P - Po. The risk achievement and risk reduction worths, now on an interval scale, are associated with the two limiting points in the figure.
The fisk impact curves for the features, particularly those on an interval scale, are useful for cost-benefit or value-impact analyses. If a set of curves is maintained as a "library1', then proposed design or operation modifications need only be evaluated with regard to their impact on the feature's failure probability. The risk impact curves can then be used to relate the impact on the feature's failure probability to the impact on risk. The use of risk impact curves i s made more attractive if a limited set of curves can be used to describe plant behaviors and if simple, analytical equa- tions can be fit to the actual curves.
As
The risk impact curves can

14 I
R
Risk Achievement Worth (A 1 .)
I I I I
I I I I
P 1.0 pg
FIGURE 2. R I S K IMPACT CURVE ON A R A T I O SCALE
15
1-1 -------------
----- Risk Achievement Worth (Ai )
I I I I I
P - Po
R i s k Reduction Worth ( - D i )
FIGURE 3. R I S K IMPACT CURVE ON AN INTERVAL SCALE

16
7.0 RSSMAP RISK ESTIMATES
Sections 8.0 and 9.0 describe the application of the risk worth measures using the results of PRA's performed for the Reactor Safety Study Methodology Applications Program (RSSMAP) as a data base. provides a brief outline of the results and limitations of RSSMAP and also describes the method for estimating consequences based on RSSMAP results. These consequence estimates were used in evaluating risk worth measures for risk defined as probability times consequence. The RSSMAP program used the techniques and insights of the Reactor Safety Study(l5) to perform limited risk analyses on four different plants. Plants with different reactor and containment designs were analyzed in order t o broaden the class of nuclear power plants explicitly analysed in terms of risk. the four plants analyzed are summarized in Table 1.
accident sequences which were assigned a failure probability for each associ- ated containment failure mode. The sequences were then assigned t o a release category. Safety Study (RSS) and were assigned based on analyses performed with the MARCH and CORRAL codes.
This section
The important features of
The results of the RSSMAP analyses consisted o f a set of dominant
These release categories were the same ones used in the Reactor
TABLE 1. RSSMAP PLANTS
Power Level MWe Cont ai nmen t Plant
Sequoyah #1 PWR
Oconee #3 PWR
' Calvert Cliffs #2 PWR
Grand Gulf #1 BWR
1148
886
850
1250
Ice Condenser Containment
Large Dry High Pressure Containment
Large Dry High Pressure Containment
Mark I11

17
The sequence frequencies were summed in each category to produce a frequency of release in each category. tree methodology in combination with a survey and analysis technique to deter- mine event probabilities. the RSS hardware and human error data base.
the associated limitations need to be recognized. equipment failures and routine human failures but did not include external events or fires. Also, the RSSMAP analyses were conducted using design information provided in the Final Safety Analysis Reports (FSAR) and did not necessarily reflect the as-built systems. The success/failure criteria used in the RSSMAP analyses were based on the FSAR analyses and the plant technical specifications which may indicate more conservative criteria and guidelines than are actually required for system success. It should be mentioned that in several cases changes to the plant designs and procedures made subsequent to the RSSMAP analyses are not included in the RSSMAP results and therefore are not included in these analyses. The RSSMAP analyses further used only point estimates and did not explicitly estimate uncertainties.
RSSMAP's limitations imply that conclusions drawn from the results need to be checked before any action i s taken. Recognizing the limitations, RSSMAP's results are a useful data base for drawing tentative conclusions on the importance o f features to core melt frequency and to risk. results will also serve to illustrate the information which is obtainable from calculating the risk achievement worth and risk reduction worth for different features.
The risk reduction worth and risk achievement worth defined in this report can be calculated using various risk measures. The three risk measures chosen were core melt frequency, expected dose within 50 miles, and expected acute fatalities. These three measures provide a characterization of the health risks. Other measures such as environmental degradation and economic impact could be treated similarly if desired and may be of interest for cost- benefit studies.
terms o f manrem and acute fatalities was associated with each release category
The accident sequences were determined by event
The system unavailabilities were quantified using
RSSMAP was a valuable program, however in utilizing RSSMAP's results The RSSMAP scope included
RSSMAP's
Using the approach in Andrews et a1(16), a consequence factor in
18
defined in RSSMAP. The consequence factors used for each RSSMAP plant were scaled linearly to the power level of the plant used in Reference 16 (1120 MWe). expected dose and expected acute fatalities are determined by summing the product of the release category frequency and the appropriate consequence factor.
is likely to lead to an over-estimate of the consequences of accident sequences. obtaining a better understanding of retention mechanisms which would reduce the quantity of fission products released from the plant in an accident. The NRC i s currently undertaking a study to revise the RSS release categories but the results of that study were not yet available' to the work that is the subject of this report. relative information obtained from the risk achievement and risk reduction worths is still useful.
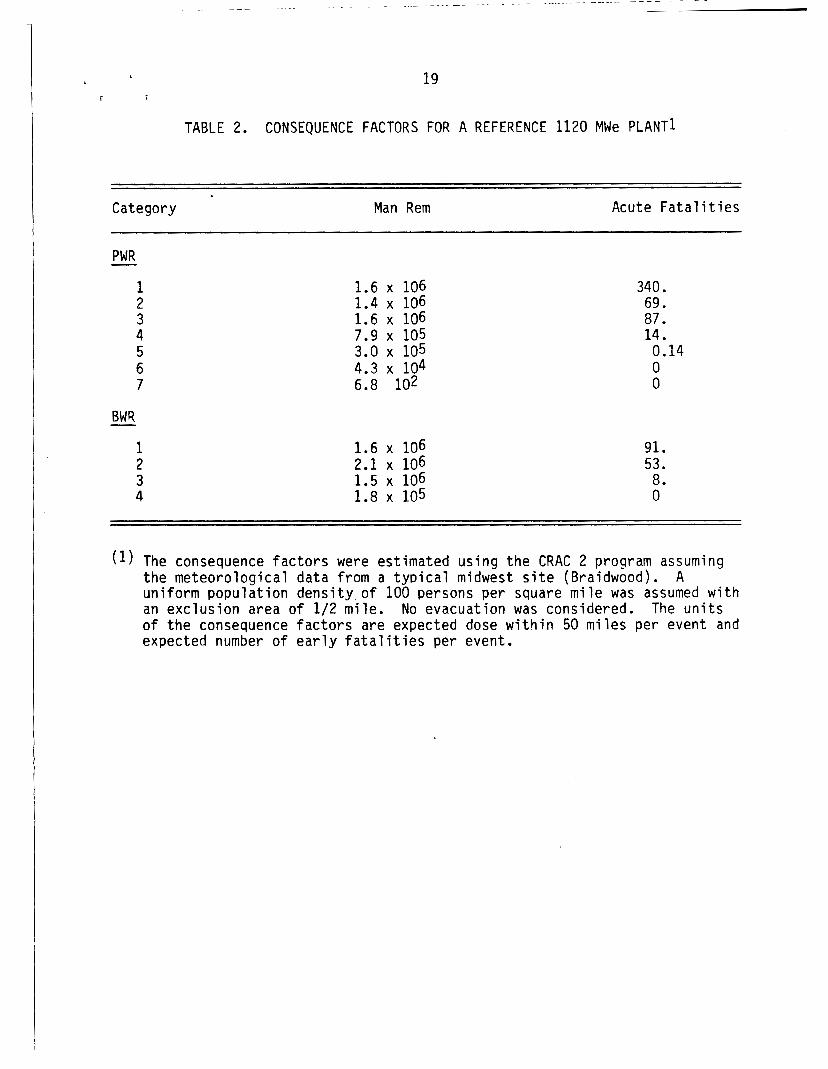
The consequence factors for the base plant are shown in Table 2. The
The reader should recognize that the use of RSS release categories
Since the Reactor Safety Study, research has been directed at
Even though the consequences may be high, the
19
TABLE 2. CONSEQUENCE FACTORS FOR A REFERENCE 1120 MWe PLANT1
Category Man Rem Acute F a t a l i t i e s
1.6 x 10⁶ 1.4 x 10⁶ 1.6 x 10⁶ 7.9 x 10⁵ 3.0 x 10⁵ 4.3 104 6.8 102
340. 69. 87. 14. 0.14 0 0
BWR - 91.
8.
1 1.6 x 10⁶ 2 3 1.5 x 10⁶ 4
2.1 x 10⁶ 53.
1.8 x 10⁵ 0
The consequence f a c t o r s were est imated us ing the CRAC 2 program assumi the meteoro log ica l data f rom a t y p i c a l midwest s i t e (Braidwood). A uniform popu la t ion dens i t y o f 100 persons per square m i l e was assumed an exc lus ion area o f 1/2 mi le . The u n i o f t h e consequence f a c t o r s are expected dose w i t h i n 50 m i les per event expected number o f e a r l y f a t a l i t i e s per event.
No evacuat ion was considered.
ng
w i t h t s
and

20
8.0 WORTHS OF FEATURES WITH REGARD TO CORE MELT FREQUENCY
The r i s k reduc t ion and r i s k achievement worths were ca l cu la ted f o r
t he major sa fe ty func t i ons and the sa fe ty systems i n Sequoyah, Oconee, Ca lver t
C l i f f s , and Grand Gulf . human e r r o r s i d e n t i f i e d i n RSSMAP f o r t he f o u r p lan ts are a lso ca lcu lated.
The r i s k worths are g iven here f o r core mel t frequency. Use o f the o ther r i s k
measures (expected manrem and expected e a r l y f a t a l i t i e s ) gives s i m i l a r r e s u l t s
with regard t o the importance o f fea tures i n a g iven p lan t .
r i s k worths f o r these other r i s k measures are given i n Appendix A.
present t he r i s k worths f o r Sequoyah, Oconee, Ca lver t C l i f f s , and Grand Gulf ,
respec t i ve l y . I n each sec t ion tab les and f i g u r e s o f the worths are given and
observat ions are made. Sect ion 8.5 then compares the f o u r p lan ts w i t h regard t o d i f ferences i n the worths. Tables and f igures are again given and observa- t i o n s are made about the d i f fe rences . b e n e f i t curves f o r a few impor tant systems.
I n add i t ion , the worths o f t he human ac t ions and
Examples of t he
The chapter i s arranged as fo l lows: Sections 8.1, 8.2, 8.3, and 8.4
Sect ion 8.6 presents example r i s k
8.1 Sequoyah
The r i s k worths , fo r t he d i f f e r e n t sa fe ty func t i ons are shown i n The r i s k worth r a t i o s are a lso displayed g r a p h i c a l l y i n F igure 4. Table 3.
The sa fe ty func t i ons are broken down t o a system l e v e l and the r e s u l t s fo r the
se lected sa fe ty systems are presented i n Table 4. Some o f the other systems such as the low pressure r e c i r c u l a t i o n system and serv ice w a t e r were not
analyzable due t o the l i m i t a t i o n s o f Sequoyah study. The r i s k worth r a t f o r t he RSSMAP i d e n t i f i e d systems are shown i n F igure 5.
t o the r i s k est imates. This was a common mode e r r o r which d isabled the The Sequoyah study i d e n t i f i e d one human e r r o r t h a t was a cont r
os
bu tor
emergency core coo l i ng r e c i r c u l a t i o n system (ECCR) and the containment sprays.
The r i s k worths f o r t h i s e r r o r are shown i n Table 5. The r i s k worth r a t i o s
are shown i n F igure 6.

21
FIGURE 4. RISK WORTH RATIOS FOR SEQUOYAH SAFETY FUNCTIONS WITH REGARD TO CORE MELT FREQUENCY
3- R
ED
UC
TIO
N
AC
Hl E
VE
ME
NT -
d
0
-. 0
4
AU
XIL
IAR
Y F
EE
DW
ATE
R
d
a
0 w
0
h)
a-
0 P
EM
ER
GE
NC
Y C
OR
E
CO
OL1
NG
INJE
CTI
ON
EM
ER
GE
NC
Y C
OR
E
CO
OLI
NG
RE
CIR
CU
LATI
ON
EM
ER
GE
NC
Y
ELE
CTR
IC P
OW
ER
HIG
H P
RES
SUR
E IN
JEC
TIO
N
RE
LIE
F V
AL
VE
n
3
rn
P
-I<
OD

.f- R
ED
UC
TIO
N
AC
HIE
VE
ME
NT -
4
-L
0
4
0
-L
d ow
0
h)
I
OP
ER
ATO
R L
EA
VE
S
DR
AIN
S C
LOS
ED
N
w
24 , '
TABLE 3. RISK HORTHS FOR SEQUOYAH SAFETY FUNCTIONS WITH REGARD TO CORE MELT FREQUENCY
Func t ion Risk Reduction Risk Achievement
I n t e r v a l Ra t io I n t e r v a l R a t i o
1200
5.3 x 10⁻⁵ 7.0 2.8 x 10⁻³ 50
3.0 x 10⁻⁶
R e a c t i v i t y Cont ro l 2.5 x 10⁻⁶ 1.1 7.1 x 10⁻²
Provide Emergency Coolant t o Core
Transfer Heat From Coolant t o U l t i m a t e Heat Sink (no t i n c l u d i n g main power conversion system)
1.1 7.0 x 10⁻² 2000
TABLE 4. R I S K WORTHS FOR SEQUOYAH SYSTEMS
System Risk Achievement Risk Reduct i o n
I n t e r v a l Ra t io I n t e r v a l Ra t io
3.0 x 10⁻⁶ 1.1 1.1 x 10⁻¹ 2000
Pressur izer R e l i e f Valve 2.5 x 10⁻⁶ 1.1 2.5 x 10⁻⁴ 5.3
High Pressure I n j e c t i o n 2.8 x 10⁻⁷ 1.0 2.5 x 10⁻⁴ 5.3
Auxi 1 i a r y Feedwater
(s tuck open)
Emergency Core Cool ing 1.0 x 10⁻⁵ 1.2 2.8 x 10⁻³ 50 I n j e c t i o n
Emergency Core Cool ing 3.8 x 10⁻⁵ 3.1 2.8 x 10⁻³ 50 Rec i r c u 1 a t i on
Emergency E l e c t r i c Power 7.6 x 10⁻⁷ 1.0 7.0 x 10⁻⁴ 14
Reactor P r o t e c t i o n System 2.5 x 10⁻⁶ 1.1 7.0 x 10⁻² 1200

. . . . . . . . . . . . . . . . . . . . . - .. . .. . . - . - - - - -. . . - - . .
25
TABLE 5. RISK WORTHS OF HUMAN ERRORS AT SEQUOYAH WITH REGARD TO CORE MELT FREQUENCY
Human Action Risk Reduction Risk Achievement
Interval Ratio Int erv a1 Ratio
Operator Leaves Drains 8.0 x 10⁻⁶ 1.2 2.7 x 10⁻³ 50 Between Upper and Lower Containment Volume in Closed Position
From the results of the Sequoyah analysis, the following observa- tions can be made. At the functional level, the risk reduction worths for the reactivity control and heat transfer to ultimate sink functions are quite low indicating only a small ( ~ 1 0 percent) potential for risk reduction could be achieved by further improving these systems. mately an order of magnitude, however, is possible by optimizing the emergency coolant supply to the core.
The risk achievement ratio worths for the heat transfer function and for reactivity control are about 3 orders of magnitude and are about 20 times more important than the emergency coolant function. emergency coolant function is however still significant, being about a factor of 50. These risk worths indicate the reduction in core melt frequency which occurs due to the presence of the existing safety functions.
largest value i s a factor of 3 for the emergency core coolant recirculation system (ECCR). in fact are very close to 1. ficant improvement in core melt frequency with system improvement.
tance of the reactor protection system and the auxiliary feedwater system in achieving the present risk level. 3 orders o f magnitude higher if these systems were not functioning. The ECC systems and the emergency power system (EPS) also have risk achievement
A risk reduction of approxi-
The ratio worth for the
With regard to risk reduction ratio worths at the system level the
All other system ratio worths are less than a factor of 2 and All these values indicate marginal or insigni-
The risk achievement worths graphed in Figure 5 point out the impor-
The core melt frequency would be more than

26
worths between 1 and 2 orders of magnitude for Sequoyah. systems that were analyzed had risk achievement worths of a factor of 5.
decay heat (AFWS) are very important in preventing core melt, and this is reflected by their high risk achievement values. injection and recirculation systems are also shown to be important. This reflects the relative importance of LOCA's in the predicted core melt fre- quency at Sequoyah. The systems which are called upon during transients (HPI and PORV) have relatively low risk achievement worths reflecting the predicted low importance of transients leading to core melt at Sequoyah. These results in addition to prioritizing system worths, thus also reflect the models and analyses utilized in RSSMAP.
( ~ 2 0 percent) was possible whereas a significant ri-sk achievement value of a factor of 50 was calculated. The risk achievement ratio indicates that as presently carried out, the human activity results in a factor of 50 reduction in core melt frequency. This'worth compares with the worths of 2000 and 1200 for the auxiliary feedwater system and the reactor protection system. high achievement worth and low reduction worth for the human error indicates that the human activity is presently being performed with a near optimal reliability as modeled by RSSMAP. The generally high achievement worths and low reduction worths indicate that attention should be focused on maintaining and assuring the present reliabilities as opposed to formulating retrofits to upgrade them. risk reduction effects, however.)
The other two
The systems which shut down the nuclear reactor (RPS) and remove the
The emergency core cooling
For the human error analyzed, a small core melt frequency reduction
The
(This does not say that new systems may not have significant
8.2 Oconee
The risk worths at the functional level for Oconee are shown in The risk worth ratios are also displayed graphically in Figure 7. Table 6.
The results for specific systems are shown in Table 7 and Figure 8. The Oconee study identified a number of human actions which were important to risk. These have been evaluated and tabulated in Table 8. The risk worth ratios for these human actions are shown in Figure 9.

i I
AC
HIE
VE
ME
NT _
_t
- RE
DU
CTI
ON
4
0 7 c
.a
-L
0
I %
w
-a 0
I I
TRA
NS
FER
HE
AT
FR
OM
CO
OLA
NT
TO
UL
TIM
AT
E H
EA
T S
INK
RE
AC
TIV
ITY
CO
NTR
OL
PR
OV
IDE
EM
ER
GE
NC
Y
CO
OLA
NT
TO C
OR
E
1
-L
0 P
n

AC
HIE
VE
ME
NT _
_t
a
e . R
ED
UC
TIO
N
5 %
d
0
d
N
0
d
d
0 t
II
I
I I
I'
SE
RV
ICE
WA
TER
ME
RG
EN
CY
PO
WER
SE
RV
ICE
WA
TER
n
.. - 0
C
z
m
a,

29
10:
102
t I- z w E w
r a
- 2 0
z I- u 3 w
0
n
i
1
1
10
FIGURE 9. RISK WORTHS OF IMPORTANT HUMAN ACTIONS AT OCONEE WITH REGARD TO CORE MELT FREQUENCY
(a) OPERATOR LEAVES LOW PRESSURE PUMP TRAIN TEST VALVES IN WRONG POSITION
(bl OPERATOR FAILS TO OPEN SUMP VALVES AT THE START OF RECIRCULATION
(C) OPERATOR FAILS TO ALIGN SUCTION OF HPRS TO DISCHARGE OF LPRS
(d) COMMON MODE MISCALIBRATION OF INSTRUMENTS WHICH ACTUATE HPlS
(d OPERATOR FAILS TO START THE HPlS
(I) OPERATOR FAILS TO MANUALLY START HIGH HEAD AUXILIARY SERVICE WATER

30
TABLE 6. RISK WORTHS FOR OCONEE SAFETY FUNCTIONS WITH REGARD TO CORE MELT FREQUENCY
Function Risk Reduction Risk Achievement
Interval Ratio I n t erv a1 Rat i o
7.8 x 10⁻⁶ 1.1 .32 4100 Reactivity Control 4.3 x 10⁻⁵ 2.5 3.4 x 10⁻³ 48 Provide Emergency Coolant
to Core
1.4 0.54 7500 Transfer Heat From Coolant 2.0 10-5 to Ultimate Heat Sink (not including normal power conversion system)
TABLE 7. RISK WORTHS FOR OCONEE SYSTEMS WITH REGARD TO CORE MELT FREQUENCY
System Risk Reduction Risk Achievement
Interval Ratio Inter v a1 Rat io
1.0 7.5 x 10⁻³ 110 Auxiliary Feedwater 3.0 x 10⁻⁶
2.2 x 10⁻⁶ 1.0 2.0 10-5 1.3 High Head Service Water
1.8 x 10⁻⁵ 1.3 3.3 x 10⁻⁴ 5.6
1.4 x 10⁻⁵ 1.2 3.4 10-3 48
Pressurizer Relief Valve (stuck open)
High Pressure Injection 8.8 x 10⁻⁶ 1.1 5.0 10-4 7.0 Low Pressure Injection
1.9 3.4 x 10⁻³ 48 Emergency Core Cooling 3.3 x 10⁻⁵ Recirculation Low Pressure Service Water 1.5 10-5 1.3 0.54 7500
2.2 x 10⁻⁶ 1.0 4.4 x 10⁻³ 62 Electric Power (onsite)
1.1 0.30 4100 Reactor Protect i on System 7.8 x 10⁻⁶

31
TABLE 8. RISK WORTHS OF IMPORTANT HUMAN ACTIONS AT OCONEE WITH REGARD TO CORE MELT FREQUENCY
Human Action Risk Reduction Risk Achievement
Inter v a1 Ratio Interval Rat io
1.2 3.3 x 10⁻³ 47 Operator Leaves LOW Pressure Pump Train Test Valves in Wrong Position
9.9 x 10⁻⁶
9.6 x 10⁻⁶ 1.2 3.2 x 10⁻³ 45 Operator Fails to Open Sump Valves at the Start of Recirculation
8.4 x 10⁻⁶ 1.1 2.8 x 10⁻³ 40 Operator Fails to Align Suction of HPRS to Discharge of LPRS
9.0 x 10⁻⁸ 1.0 2.7 x 10⁻³ 40 Common Mode Miscalibration of Instruments Which Actuate HPIS
1.3 10-5 1.2 4.3 10-4 6.9 Operator Fails to Start the HPIS
1.3 Operator Fails to Manually 2.2 x 10⁻⁶ 1.0 1.9 x 10⁻⁵ Start High Head Auxiliary Service Water
The following observations can be made regarding the Oconee results. At the functional level the risk reduction potential is small for reactivity control and heat transfer to the ultimate heat sink functions. reduction potential for the emergency coolant supply function is somewhat larger but is still less than a factor of three.
risk reduction worths. The ratio worths for the reactivity control and the heat removal functions are between 3 and 4 orders of magnitude.
,’ the emergency coolant supply function is about a factor of 50. achievement worths indicate the present degree of protection provided by the different functions.
The risk
The risk achievement worths are all considerably higher than the
The worth for These risk

32
At the system level ‘all,, the risk reduction worths are quite small, the largest being a factor of 2 for the emergency core coolant recirculation system. The risk achievement worths for Oconee safety system range over almost 4 orders o f magnitude. The low pressure service water system and the reactor protection system stand out as being particularly important with risk achievement ratios of 3 to 4 orders o f magnitude. The auxiliary feedwater, the emergency power supply, the high pressure injection, and the emergency core cooling recirculation systems also have high risk achievement factors of about 50 to 100 which are significant. The low pressure injection system and the pressurizer relief valve have risk achievement factors of about 5 to 10. The high head service water has a factor o f only 1.3. The low pressure service water system has a very high worth (7500) because the auxiliary feedwater, the diesels, and all of the emergency coolant pumps depend on the operation of the service water for component cooling. pressure service water system lead to failure in the other systems in a short time.
achievement worth. the auxiliary feedwater system in the case of loss of onsite and offsite power. this system is not expected to be needed frequently, consequently a low risk achievement worth is calculated.
cate low risk reduction worths. Further improvement in the assumed operator performance of any particular action would not significantly reduce risk esti- mates. The potential increases in risk attributed to degradation of present predicted human reliability however can be quite significant.
divided into components. system or component. This gives useful information regarding the relative importance of each subsystem or component. Inspection, testing, and main- tenance efforts can be focused on the most important components based on the results.
Failure of the low
The high head service water, on the other hand, shows a low risk This system is designed to be used as an alternative to
Since the onsite power at Oconee is predicted to be very reliable,
The risk worth of human actions shown in Table 8 and Figure’9 indi-
If desired, the system can be divided into subsystems and/or further The risk worths can then be calculated for each sub-

33
The results for one of the most important systems (low pressure service water) at the subsystem level have been calculated as an example. This system at Oconee consists of two redundant trains. One train is normally operating while the other is in standby.
failure to start and run the standby train. three subsystems: system for the standby train. sented in Table 9 for each subsystem. The risk worth ratios are presented in Figure 10. more reliable are small, about a factor of 1.2 or less. The risk achievement factors are about 2 orders of magnitude for the operating train and 1 order of magnitude for the standby train. The factor of 10 increase in risk can be interpreted as the increase in risk level when one of the service water trains is down, e.g. out for maintenance.
ratios again indicate that attention should be focused on reliability assurance and risk maintenance activities with these activities in' turn focused on the areas of highest achievement worths.
System failure requires the operating train to fail along with The system can be divided into
the operating train, the standby train, and the actuating The risk worths at the subsystem level are pre-
The potential risk reductions obtainable from making a subsystem
The generally high risk achievement ratios and low risk reduction
TABLE 9. RISK WORTHS FOR THE SUBSYSTEMS OF THE OCONEE LOW PRESSURE SERVICE WATER SYSTEM
Subsystem Risk Reduction Risk Achievement
Inter Val Ratio Inter Val Rat io
Normally Operating Service 1.5 10-5 1.3 1.0 x 10⁻² 120 Water Tr a i n
Standby Service Water Train 1.1 10-5 1.2 7.6 10-4 10
Actuating System for 3.8 x 10⁻⁶ 1.1 7.6 10-4 10 Standby Train
Both Trains of Low Pressure 1.5 x 10⁻⁵ 1.3 0.54 7500 Service Water

34 I
FIGURE 10. RISK WORTH RATIOS FOR THE SUBSYSTEMS OF THE OCONEE LOW PRESSURE SERVICE WATER SYSTEM

35
8.3 Ca lver t C l i f f s
The r e s u l t s o f t he Ca lver t C l i f f s ana lys is p red ic ted a s i g n i f i c a n t l y
h igher core mel t frequency than a t t he o ther th ree RSSMAP p lan ts .
p r i m a r i l y due t o sequences i n v o l v i n g f a i l u r e o f t he emergency feedwater
systems and the assumed i n a b i l i t y t o e s t a b l i s h a "feed and bleed" coo l i ng mode
i n t ime t o prevent core melt .
system t h a t was scheduled t o be upgraded.
s i g n i f i c a n t e f f e c t s on the sequences which dominate r i s k a t Ca lver t C l i f f s . A
rough p r e l i m i n a r y est imate o f the upgrade reduces the p red ic ted core mel t f r e -
quency by a fac to r o f 5 from 2 x 10⁻³ t o 4 x 10⁻⁴ per reac to r year.
c u l a t i o n s o f the r i s k achievement worths and r i s k reduc t i on worths d i d no t
i nc lude the e f f e c t s o f the scheduled upgrade.
i n Table 10.
This was
The Ca lver t C l i f f s ana lys is was based on an a u x i l i a r y feedwater
This upgrade was p red ic ted t o have
The c a l -
The r i s k worths a t t he f u n c t i o n a l l e v e l f o r Ca lver t C l i f f s are shown
The r i s k worth r a t i o s are displayed g r a p h i c a l l y i n Figure 11. The r e s u l t s a t the system l e v e l are shown i n Table 11 and Figure 12. Ca lver t C l i f f s ana lys i s i d e n t i f i e d a number o f human ac t ions which were
important t o r i s k . These have been evaluated and tabu la ted i n Table 12. The
r i s k worth r a t i o s f o r these human ac t ions are shown i n F igure 13.
The
TABLE 10. R I S K WORTHS FOR CALVERT CLIFFS SAFETY FUNCTIONS WITH REGARD TO CORE MELT FREQUENCY
Funct ion Risk Reduction Risk Achievement
I n t e r v a l Ra t io I n t e r va 1 Rat i o
R e a c t i v i t y Cont ro l 6.0 x 10⁻⁵ 1.0 3.0 1500
Provide Emergency Coolant 7.4 x 10⁻⁵ 1.0 3.3 x 10⁻³ 2.6 t o Core
Transfer Heat From Coolant 1.9 x 10⁻³ 28 0.54 2 70 t o U l t ima te Heat Sink (no t i n c l u d i n g main power conversion system)

1-
AC
HIE
VE
ME
NT
0
0
W
h)
-L
0
0
1 I
I I
1 R
EA
CT
IVIT
Y C
ON
TRO
L 1
HE
AT
TRA
NS
FER
TO
U
LT
IMA
TE
SIN
K
I
ECC
4
w
m
- RE
DU
CTI
ON
A
CH
IEV
EM
EN
T -
4
4
0
4
0
SE
RV
ICE
WA
TER
A
I I
I
-
I R
EA
CTO
R P
RO
TEC
TIO
N S
YS
TEM
HIG
H P
RES
SUR
E IN
JEC
TIO
N
EM
ER
GE
NC
Y C
OR
E
CO
OLI
NG
RE
ClR
CU
tAT
lON
I A
UX
lelA
RY
FE
ED
WA
TER
I E
ME
RG
EN
CY
PO
WE
R
104
1 03
102
i o
1
38
FIGURE 13. RISK WORTHS FOR HUMAN ACTIONS AT CALVERT CLIFFS WITH REGARD TO CORE MELT FREQUENCY
<
(I) OPERATOR MANUALLY INITIATES THE AFWS
(b) RECOVERY ACTIONS WHICH AFFECT THE AFWS
(e) OPERATOR CLOSES THE SAFETY RELIEF BLOCK VALVE
b C 4

39
TABLE 11. R I S K WORTHS FOR CALVERT CLIFFS SAFETY SYSTEMS WITH REGARD TO CORE MELT FREQUENCY
System Risk Reduction Risk Achievement
I n t e r v a1 Rat io I n t erva 1 R a t i o
Auxi 1 i a r y Feedwater
Pressur izer R e l i e f Valve
High Pressure I n j e c t i o n
Low Pressure I n j e c t i o n
Emergency Core Cool ing Rec i r c u l a t i on
Ser v i ce Water
Emergency Power
Reactor P r o t e c t i o n System
1.7 x 10⁻³
6.7 x 10⁻⁵
9.9 x 10⁻⁷
4.5 x 10⁻⁵
6.2 10-5
1.7 10-4
6.1 10-5
2.9 x 10⁻⁵
6.3 0.54
1.0 8.4 x 10⁻⁴
1.0 4.8 10-3
1.0 3.3 10-4
1.0 4.9 10-3
1.0 2.5 x 10⁻²
1.1 0.2
1.0 3.0
2 70
1.4
3.4
1.2
3.4
1 3
100
1500
TABLE 12. R I S K WORTHS FOR CALVERT CLIFFS HUMAN ACTIONS WITH REGARD TO CORE MELT FREQUENCY
Human Act ion Risk Reduction Risk Achievement
I n t erva 1 R a t i o I n t e r v a l Rat i o
1.4 0.54 2 70 Operator Manually I n i t i a t e s 5.4 x 10⁻⁴ t h e AFWS
1.6 Recovery Act ions Which 4.8 x 10⁻⁵ 1.0 1.2 10-3
Operator Closes t h e 1.4 x 10⁻⁵ 1.0 1.3 10-4
A f f e c t t h e AFWS
Safety R e l i e f Valve Block Valve
1.1

has a smaller risk achievement worth, about
I
of the risk reduction worth ratios are small iary feedwater which is a factor of 6. It
40 I
The following observatlons are made regarding the Calvert Cliffs The risk reduction ratios for reactivity control and for the emer-
The risk reduction potential for the heat The risk achievement
results. gency coolant function are small. removal function is quite large, about a factor of 30. worth for the reactivity control i s a factor of 1500 and the risk achievement worth ratio for the heat removal function is a factor of almost 300. emergency coolant supply function a factor of 3.
At the system level all except for the value for the auxi is interesting to compare this value with the estimated factor of 5 improve- ment due to the auxiliary feedwater upgrade. On the interval scale the risk reduction worths for the auxiliary feedwater system is quite high in compari- son to the other systems and compared to the systems at other plants. interval risk reduction worths for the other systems are roughly comparable to those at other plants. plants and making value impact decisions. establishing the relative importance at a particular plant.
value o f over 3 orders of magnitude for the reactor protection system, approx- imately 2 orders of magnitude for the auxiliary feedwater and the emergency power systems, 1 order of magnitude for the service water system, and factors of 3 or less for the high pressure injection, the low pressure injection, the pressurizer relief system, and the emergency core coolant recirculation
The
The
The interval measure is more useful for comparing The ratio measure is useful in
For the Calvert Cliffs systems, the risk achievement ratios show a
system.
are shown in Table 12. are all small, less than a factor of 2. manual initiation of AFWS is also high since failure to perform the action effectively disables the auxiliary feedwater system.
Because of the importance of the auxiliary feedwater system at Calvert Cliffs, this system has been analyzed further. divided nto functional groups of components such as a pump and its valves and
The human actions identified by RSSMAP as being important to risk
The risk achievement worth for the The risk +eduction potentials for the human activities
The system has been

-
41
piping. sources, two pumps, and two steam supplies. One of the two in each set must function for successful system operation. The operator can be considered as a subsystem necessary for system operation. The results at the subsystem level are presented in Table 13. The ratios are shown in Figure 14. reduction ratios for any one of the subsystems are small, the largest being a
For this system, there are generally two subsystems, two feedwater
The risk

TABLE 13. RISK WORTHS FOR SUBSYSTEMS I N THE AUXILIARY FEEDWATER SYSTEM AT CALVERT CLIFFS
Subsystem Description Risk Achievement Boolean Failure Risk Reduction
Term Probab i 1 f ty Ratio Interval Ratio I n t erva 1
Condensate Storage Tank, Piping, and Valves
Turbine Driven Auxi l iary Feed Pump #21, Piping and Valves
Turbine Driven Auxi l iary Feed Pump 122, Piping and Valves
Steam Generator #2l, Feedwater Supply Valves
Steam Generator #22, Feedwater Supply Valves
Steam Supply t o Turbine Driven Auxi 1 i a ry Feed Pumps #I
Steam Supply t o Turbine Driven Auxi 1 i ary Feed Pumps #2
Power Supply t o Motor Operated Valves from Diesel 12
Power Supply t o Motor Operated Valves from Diesel 21
Operator Action
A 1 5.0 10-4
E1 2.9 x 10⁻²
Cl 2.9 x 10⁻²
D1 1.3 x 10⁻²
El 1.3 x 10⁻²
F 1 1.3 x 10⁻²
G 1 1.3 x 10⁻²
D12 6.8 x 10⁻²
021. 8.0 x 10⁻²
AFWSCM 1.0 x 10⁻³
2.7 x 10⁻⁴ 1.2
4.5 10-4 1.3
4.5 10-4 1.3
2.0 10-4 1.1
2.0 10-4 1.1
2.0 x 10⁻⁴ 1.1
2.0 10-4 1.1
9.4 x 10⁻⁵ 1.1
1.0 10-4 1.1
5.4 10-4 1.4
0.54
1.5 x
1.5 x 10-2
1.7 x 10⁻²
1.7 x 10⁻²
1.7 x 10⁻²
1.7 x 10⁻²
2.9 x 10⁻³
3.0 10-3
0.54
2 70
8.4
8.4
9.6
P h) 9.6
9.6
9.6
2.5
2.5
270

I
TABLE 14. RISK WORTHS FOR COMPONENTS I N THE AUXILIARY FEEDWATER SYSTEM AT CALVERT CLIFFS 1
Description Risk Reduction Term Fai lure
Designation Probabi 1 i ty Inter Val Ratio Risk Achievement
Interval Ratio
Subsystem A 1 Manual Valve Manual Valve
Manual Valve Manual Valve Manual Valve Check Valve Check Valve Turbine Pump
Manual Valve Manual Valve Manual Valve Check Valve Check Valve Turbine Pump
Manual Valve Check Valve Control Valve
Manual Valve Check Valve Control Valve
Subsystem F1 Check Valve Motor Operated Va 1 ve
Subsystem B1
Subsystem Cl
Subsystem D1
Subsystem El
,Subsystem G1 Check Valve Motor Operated
A 1 c3 c4
61 P1 P4 S6 P3 s5 TP21
c1 P2 P6 S8 P5 s7
TP22
01 H1 H5
CV-4511
El H2 H6
CV-4512
F1 s3
MOV -407 1
G1 54
MOV -4070
5.0 x 10⁻⁴ 2.0 10-4 2.0 x 10⁻⁴
2.9 x 10⁻² 2.0 x 10⁻⁴ 2.0 x 10⁻⁴ 2.0 x 10⁻⁴ 1.0 x 10⁻⁴ 1.0 x 10⁻⁴ 2.8 x 10⁻²
2.9 x 10⁻² 2.0 x 10⁻⁴ 2.0 x 10⁻⁴ 2.0 10-4 1.0 10-4 1.0 10-4 2.8 x 10⁻²
2.0 10-4 2.0 10-4
1.3 x 10⁻²
1.3 x 10⁻²
1.3 x 10⁻² 2.0 x 10⁻⁴
1.3 x 10⁻²
1.3 x 10⁻²
1.3 x 10⁻²
1.3 x 10⁻² 1.0 x 10⁻⁴ 1.3 x 10⁻²
2.0 10-4
1.0 x 10⁻⁴
2.7 x 10⁻⁴ 1.4 10-4 1.4 10-4
4.5 x 10⁻⁴ 3.2 x 10⁻⁶ 3.2 x 10⁻⁶ 3.2 x 10⁻⁶ 1.6 x 10⁻⁶ 1.6 x 10⁻⁶ 4.4 x 10⁻⁴
4.5 10-4 3.2 x 10⁻⁶ 3.2 x 10⁻⁶ 3.2 x 10⁻⁶ 1.6 x 10⁻⁶ 1.6 x 10⁻⁶ 4.4 10-4
2.0 10-4
2.0 x 10⁻⁴
2.0 10-4
2.0 x 10⁻⁴
2.0 10-4
2.0 x 10⁻⁴
2.0 10-4
2.0 x 10⁻⁴
3.1 x 10⁻⁶ 3.1 x 10⁻⁶
3.1 x 10⁻⁶ 3.1 x 10⁻⁶
1.5 x 10⁻⁶
1.6 x 10⁻⁶
1.2 1.1 1.1
1.3 1.0 1.0 1.0 1.0 1.0 1.3
1.3 1.0 1.0 1.0 1.0 1.0 1.3
1.1 1.0 1.0 1.1
1.1 1.0 1.0 1.1
1.1 1.0 1.1
1.1 1.0 1.1
0.54 0.54 0.54
1.5 x 10⁻² 1.5 x 10⁻² 1.5 x 10⁻² 1.5 x 10⁻² 1.5 x 10⁻² 1.5 x 10⁻² 1.5 x 10⁻²
1.5 x 10⁻² 1.5 x 10⁻² 1.5 x 10⁻² 1.5 x 10⁻² 1.5 x 10⁻² 1.5 x 10⁻² 1.5 x IO-2
1.7 x 10⁻² 1.7 x 10⁻² 1.7 x 10⁻² 1.7 x 10⁻²
1.7 x 10⁻² 1.7 x 10⁻² 1.7 x 10⁻² 1.7 x 10⁻²
1.7 x 10⁻² 1.7 x 10⁻² 1.7 x 10⁻²
1.7 x 10⁻² 1.7 x 10⁻² 1.7 x 10⁻²
270 2 70 2 70
8.4 8.4 8.4 8.4 8.4 8.4 8.4
8.4 8.4 8.4 8.4 8.4 8.4 8.9
9.6 9.6 9.6 9.6
9.6 9.6 9.6 9.6
9.6 9.6 9.6
P W
9.8 9.8 9.8
44
0
’” r FIGURE 14. RISK WORTH RATIOS FOR SUBSYSTEMS IN THE AUXILIARY FEEDWATER SYSTEM AT CALVERT CLIFFS
A1
B1
c1
D1
E l
F l
01
D12
D21
CONDENSATE STORAGE TANK, PIPING. AND VALUES
TURBINE DRIVEN AUXILIARY FEED PUMP ml, PIPING AND VALVES
TURBINE DRIVEN AUXILIARY FEED PUMP X22. PIPING AND VALVES
STEAM GENERATOR #21, FEEDWATER SUPPLY VALVES
STEAM GENERATOR #22, FEEDWATER SUPPLY VALVES
STEAM SUPPLY TO TURBINE DRIVEN AUXILIARY FEED PUMPS #1
STEAM SUPPLY TO TURBINE DRIVEN AUXILIARY FEED PUMPS H.
POWER SUPPLY TO MOTOR OPERATED
POWER SUPPLY TO MOTOR OPERATED VALVES FROM DIESEL21
VALVES FROM DIESEL 12
.WWSCM OPERATOR ACTION

45
t I- z w E w L - I o a
2
I- o 3 L3 w K
0
IC
10
10:
1 0:
10
1
FIGURE 15. RISK WORTH RATIOS FOR COMPONENTS OF THE REACTOR PROTECTION SYSTEM AT CALVERT CLIFFS

46 ,
TABLE 15. RISK WORTHS FOR COMPONENTS OF THE REACTOR PROTECTION SYSTEM AT CALVERT CLIFFS
Component Risk Reduction Risk Achievement
Interval Ratio Int erv a1 Ratio
Circuit Breaker (1 of 8)
Relay (1 of 4)
9 x 10⁻⁶
0
1.0 9.0 10-3 5.5
1.0 1.2 x 10⁻² 7.0
8.4 Grand Gulf
The risk worths for the safety functions at Grand Gulf are presented in Table 16 and the ratios are displayed graphically in Figure 16. worths at the system level are presented in Table 17. for the systems are shown in Figure 17. fied in RSSMAP are presented in Table 18 and shown in Figure 18.
The risk The risk worth ratios
The important human actions identi-
TABLE 16. RISK WORTHS FOR GRAND GULF SAFETY FUNCTIONS WITH REGARD TO CORE MELT FREQUENCY
Function Risk Reduction Risk Achievement
Inter va 1 Ratio Interval Ratio ~~
Reactivity Control 5.4 x 10⁻⁶ 1.2 7.0 2.0 10+5
Provide Emergency Coolant 2.3 x 10⁻⁶ 1.1 .72 2.0 10+4 to Core Transfer Heat to Ultimate 2.8 10-5 4.7 5.4 x 10⁻² 1500 Sink (not including main power conversion )

I
- RE
DU
CTI
ON
A
CH
IEV
EM
EN
T I 0
0
0
h)
0
0 I
I V
I P
0
R E
AC
TlV
lTY
CO
NTR
OL
I I
PR
OV
IDE
EM
ER
GE
NC
Y C
OO
LAN
T I I
TRA
NS
FER
HE
AT
TO
I U
LTIM
ATE
SIN
K
n
C 3
m
P, 5 n

a
e R
ED
UC
TIO
N
B %
I
AC
HIE
VE
ME
NT -
4
I.
a
0
ON
w
0
-L
4
0
IEA
CTO
R P
RO
TEC
TIO
N S
YS
TEM
1
I ST
AN
DB
Y S
ER
VIC
E W
ATE
R
I I
RE
SID
UA
L H
EA
T R
EM
OV
AL
EM
ER
GE
NC
Y P
OW
ER
I I
LOW
PR
ESSU
RE
INJE
CTI
ON
I
DE
PR
ES
SU
RIZ
ATI
ON
S
YS
TEM
LOW
PR
ESSU
RE
CO
RE
SP
RA
Y
HIG
H P
RES
SUR
E I CORE
SP
RA
Y
SA
FETY
RE
LIE
F S
YS
TEM
RE
AC
TOR
CO
RE
ISO
LATI
ON
C
OO
LIN
G S
YS
TEM
n
P
03
n

t k z w 5 > w I 0 a
z c 0 3 w
0
n a
11
10
10:
I(
1
10
49
FIGURE 18. RISK WORTH RATIOS FOR IDENTIFIED HUMAN ACTIONS A T GRAND GULF

50
TABLE 17. RISK WORTHS FOR GRAND GULF SAFETY SYSTEMS WITH REGARD TO CORE MELT FREQUENCY
System Risk Reduct ion Risk Achievement
Int erv a1 Ratio Inter v a1 Rat io
Failure of a Safety/Relief Valve to Reseat
Supression Pool Makeup System
AC Onsite Power
Standby Service Water
Low Pressure Coolant Injection System
Residual Heat Removal System
High Pressure Core Spray
Low Pressure Core Spray
Reactor Core Isolation Cooling System
Reactor Protection System
Automatic Depressurization System
6.1 x 10⁻⁶
4.3 10-7
7.1 x 10⁻⁶
1.7 x 10⁻⁵
7.2 10-7
1.8 10-5
1.1 x 10⁻⁶
5.2 10-7
4.2 x 10⁻⁶
5.4 x 10⁻⁶
7.3 10-7
1.2
1.0
1.2
1.9
1.0
2.0
1.0
1.0
1.1
1.2
1.0
5.5 x 10⁻⁵ 2.5
6.8 x 10⁻³ 190
6.1 10-3 170
5.4 x 10⁻² 1500
7.9 x 10⁻⁴ 23
5.4 x 10⁻² 1500
1.2 10-4 4.4
2.4 10-4 7.6
4.2 10-5 2.2
7.0 2.0 105
4.8 10-4 14

TABLE 18. RISK WORTHS FOR IDENTIFIED HUMAN ACTIONS AT GRAND GULF WITH REGARD TO CORE MELT FREQUENCY
Action Risk Reduction Risk Achievement
Interval Rat io Interval Ratio
Operator Initiation of 7.3 x 10⁻⁷ 1 .o 4.8 x 10⁻⁴ 14 Automatic Depressurization System
Recovery 2.8 x 10⁻⁵ 4.5 1.0 x 10⁻⁴ 3.0
At the functional level for the Grand Gulf plant the maximum risk reduction potential is a factor of 5 for the heat removal function. The other functions have small risk reduction potential. The risk achievement worths for the safety functions are all large, with reactivity control being an order of magnitude more important than emergency cooling which in turn is an order of magnitude more important than heat transfer.
orders of magnitude. This value is extremely high primarily because at Grand Gulf a failure to scram was assumed to lead directly to core melt. emergency coolant supply function has a risk achievement worth o f 4 orders of magnitude. This is also very high and is primarily due to the high incidence of transient induced LOCAs predicted for the Grand Gulf RSSMAP study. The
risk achievement worth of the heat removal function i s about 3 orders of magnitude.
service water system have risk reduction worths of about a factor of 2. other systems have risk reduction worths less than 1.2. The risk achievement worth for the reactor protection system is the highest with a ratio over 5 orders of magnitude. water system have risk achievement ratios of 1500. Both of these systems are necessary for long term heat removal. The suppression pool makeup system and the emergency power system have risk achievement ratios of about 200.
The reactivity control function has a risk achievement ratio of 5
The
At the system level the residual heat removal system and the standby All
The residual heat removal system and the standby service
The

52
rest of the system are designed to provide emergency cooling water to the core and have risk achievement ratios that range from a factor of 2 to a factor of 20. for the emergency core cooling function because any one of several systems can accomplish the functional requirements.
The Grand Gulf study identified two human actions that were important to risk. The first involved initiation of the automatic depressuri- zation system. risk achievement worth was a factor o f about 10. maintenance actions to recover failed systems during the time when the supres- sion pool is heated up. tion factor of 5 was possible if the maintenance teams could identify and repair the systems every time and a factor of 3 increase in risk would occur if the repair were done incorrectly.
Notice the risk achievement ratio for any one system is much lower than
The risk reduction worth for this action was small while the The other action involved
Based on the analysis done for RSSMAP, a risk reduc-
8.5 Comparisons
This section briefly compares the results of the risk worth analyses for the four RSSMAP plants. This comparison provides insights regarding the features that are important and also points out areas where modeling assump- tions may be important. frequency as calculated by RSSMAP for the four plants is shown on Table 19. This table shows three of the plants have approximately equal core melt fre- quencies (to within a factor of two) whereas the Calvert Cliffs plant has a core melt frequency of a factor of 25 higher than any other plant analyzed. This indicates that interval values are useful for interplant comparisons of feature worths since they take into account the different base (nominal) risk levels whereas the ratio worths do not.
A comparison of the base case risk level of core melt
I
I

- . -. . . . . . . . . . . . . . .. - - .- - - .
53
TABLE 19, CORE MELT FREQUENCIES OF THE FOUR RSSMAP PLANTS
P lan t Core Mel t Frequency
Ca lve r t C l i f f s
Oconee
2.0 x 10⁻³
8.2 x 10⁻⁵
Sequoyah 5.6 x 10⁻⁵
Grand Gu l f 3.6 x 10⁻⁵
The r i s k worths o f t he s a f e t y func t i ons f o r t h e f o u r p l a n t s are
g iven i n Tables 20, 21, and 22. core m e l t frequency.
t r o l f u n c t i o n a t the f o u r p lan ts . On an i n t e r v a l bas is Ca lver t C l i f f s has the
h ighes t r i s k reduc t i on worth, which i s about an order o f magnitude h igher than
the o ther p lan ts .
A l l the worths are ca l cu la ted w i t h regard t o
Table 20 shows the r i s k worths f o r the r e a c t i v i t y con-
-4
TABLE 20. R I S K WORTHS FOR THE REACTIVITY CONTROL FUNCTION AT THE FOUR RSSMAP PLANTS
P 1 ant Risk Reduction Risk Achievement
I n t e r va 1 Ra t io I n t e r va 1 Rat i o
Grand Gu l f 5.4 x 10⁻⁶ 1.2 7 .O 2.0 x 10⁵
Ca lve r t C l i f f s
Oconee
6.0 x 10⁻⁵
7.8 x 10⁻⁶
1 .o 1.1
3 .O
.32
1500
4100
Sequoyah 2.5 x 10⁻⁶ 1.1 7.1 x 10⁻² 1200

54
The risk achievement worth of the reactivity control function has different priorititations across plants when interval values are used as com- pared to ratio values. When interval values are used, which account for the different baseline core melt frequencies, the worth at Grand Gulf is about a factor of 2 higher than that at Calvert Cliffs which, in turn, is about an order of magnitude higher than the worth at Oconee. These across plant com- parisons are useful as a guide to mandating modifications or in allocating resources among different plants. patterns in the worths.
Table 21 shows the risk worths for the emergency core cooling func- tion at the four plants. (Calvert Cliffs, Oconee, and Sequoyah) are approximately equal on an interval scale. The risk reduction worth at Grand Gulf is about an order of magnitude less. buted to the fact t h a t there are several systems which can provide core
cooling at Grand Gulf in the event of a loss of coolant. This redundancy of systems provides a near optimum function, thus a low risk reduction worth.
They are also useful for identifying
The risk reduction worths for the three PWRs
The difference in emergency core cooling reduction worths may be attri-
TABLE 21. RISK WORTHS FOR THE EMERGENCY CORE COOLING FUNCTION AT THE FOUR RSSMAP PLANTS
Plant Risk Reduction Risk Achievement
Interval Rat io Interval Rat io
Grand Gulf 2.3 x 10⁻⁶ 1.1 .72 2.0 104
Calvert Cliffs 7.4 10-5 1.0 3.3 10-3 2.6
Oconee 4.3 10-5 2.5 3.4 10-3 48
Sequoy ah 5.3 10-5 7.0 2.8 10-3 50
The risk achievement worth for the emergency core cooling function is about the same, on an interval scale for all three PWRs. The worth at the BWR (Grand Gulf) is approximately two orders of magnitude higher than for the

55
PWRs. fail at a BWR thereby requiring the coolant function. some pessimistic modeling assumptions regarding the reliability of these valves. of transient induced LOCA's would be predicted resulting in a lower risk achievement worth for this function at this plant.
Table 22 shows the risk worths for the heat removal function at the four plants. On an interval scale, the risk reduction worth for Calvert Cliffs stands out as being very high, approximately two orders of magnitude higher than the other plants (before modifications to the auxiliary feedwater system at Calvert Cliffs).
This is due to the greater number of safety relief valves which could This also may reflect
If a higher reliability was used for these valves, a lower frequency
TABLE 22. RISK WORTHS FOR THE HEAT REMOVAL FUNCTION AT THE FOUR RSSMAP PLANTS
Plant Risk Reduction Risk Achievement
Inver v a1 Ratio Inter Val Rat io
Calvert Cliffs 1.9 x 10⁻³ 28 .54 270
Oconee 2.0 x 10⁻⁵ 1.4 .54 7500
Seq uoy a h 3.0 x 10⁻⁶ 1.1 .ll 2000
Grand Gulf 2.8 10-5 4.7 5.4 x 10⁻² 1500
The risk achievement worths for the heat removal function consider only the standby heat removal systems such as the auxiliary feedwater and the residual heat removal systems but do not consider the main power conversion system or the suppression pool as being unavailable. The risk achievement worths are equal for Calvert Cliffs and Oconee and are somewhat lower for Sequoyah because of different modeling assumptions. The risk achievement worth at the BWR (Grand Gulf) is the lowest because of the,additional recovery time afforded by the suppression pool's long heatup period.

56
At the system level the following observations are made when com- paring the plants. is seen that the risk reduction worths for the systems at Calvert Cliffs are generally higher than the systems at other plants. The auxiliary feedwater and emergency power are two orders of magnitude higher while the service water, pressure relief system and the reactor protection system are one order of magnitude higher. The high pressure injection, low pressure injection, and emergency core cooling recirculation systems have values that are comparable to the other plants. For the other three plants (Oconee, Sequoyah, Grand Gulf) the risk reduction worths are generally comparable. these plants the systems providing long term cooling, the emergency core cooling recirculation, and the residual heat removal systems have the highest risk reduction worths.
The risk achievement worths for the four plants at the system level
Referring to the risk worths on Tables 4, 7, 11, and 17 it
At all three of
have a wide range of values. siderably higher than the risk reduction worths. considerable variation in the risk achievement worths among different plants. This reflects design differences in the plants but may also be due in part to different modeling assumptions. has the highest risk achievement worth. cooling mode option at Oconee the risk achievement worth is an order of magnitude lower.
high pressure injection, the low pressure injection, the emergency core cool- ing recirculation, the high pressure core spray, and the low pressure core spray have comparable values at all the plants. highest risk achievement value for standby service water since the auxi 1 iary feedwater and the core cooling water will fail if this system is failed. The Calvert Cliffs plant has the highest risk achievement value for emergency power in part because the auxiliary feedwater at Calvert Cliffs depends on electric power.
The human actions identified as being important to risk estimates .are generally quite different at each of the four plants, as can be seen on Tables 5, 8, 12, and 18. The highest risk reduction worth was for operator initiation of the auxiliary feedwater system at Calvert Cliffs.
The values for all plants are generally con- For some systems there is
For the auxiliary feedwater Calvert Cliffs Because of the "feed and bleed"
The risk achievement worths for the core cooling systems such as the
The Oconee plant has the
The risk

1
57
achievement worths for human actions are consistently higher than the risk reduction worths. highest risk achievement worth.
Operator initiation of the auxiliary feedwater also had the
8.6 Risk Impact Curves
As discussed in Section 6.0, to complement the risk worths, risk impact curves can be constructed. is straightforward for systems and components. reactor protection system at Grand Gulf and the auxiliary feedwater system at Calvert Cliffs are shown in Figures 19 and 20, with core melt frequency as the risk measure. These systems have the highest risk reduction worth and the highest risk achievement worth, respectively, for core melt frequency.
The risk impact curve for the reactor protection system at Grand Gulf (Figure 19) shows the relative failure probability of the system on the x-axis. also uses a log scale and displays the relative risk of core melt frequency as a function of the failure probability.
Notice the risk reduction worth and the risk achievement worth are seen on this curve as described in Section 6.0. At the far left side of the curve the failure probability is near zero and the reciprocal of the risk reduction worth is reached. to 1 the relative risk also increases to 1. The relative risk continues to increase as the relative failure probability is increased until the failure probability equals 1. At this level the risk achievement worth i s reached and the curve flattens out. system at Calvert Cliffs (Figure 20) shows similar behavior.
making. For example, the interval change in expected core melt frequency can be converted to a change in expected benefits using the results o f the RSSMAP
consequence analysis and appropriate consequence conversion factors. If, for example, a value of $1000/manrem i s used as a measure of benefit, the change in manrem can be readily converted to dollars. R - Ro in terms of dollars benefitted is then plotted versus the probability
The construction of the risk impact curve The impact curves for the
A log scale is used to display the wide range of values. The y-axis
As the relative failure probability is increased
The risk impact curve for the auxiliary feedwater
Risk impact curves can be adopted to aid cost-benefit decision
The curve of risk reduction

58

- . . . . . . . .
R/R,
103 -
59
-
FIGURE 20. RISK IMPACT CURVE FOR AUXILIARY FEEDWATER SYSTEM AT CALVERT CLIFFS ON A RATIO SCALE WITH CORE MELT FREQUENCY AS THE RISK MEASURE
10-1 -
I I I I 10'2 I I I
-
I I I I I I
.

60
decrease P - PO of the component or system. decrease is more than the dollar benefit then the modification is not cost effective. and the region below the curve is the cost effective region. can then be used to aid decision making.
If the cost of the probability
The region above the curve is thus the "not cost effective" region These regions
Figure 21 is a general illustration of a cost-effectiveness type curve. are plotted. the resulting impact on the system failure probability PO - P can be identi- fied on the x-axis. effective region then the modification is indicated to be cost effective. Otherwise it is not. Even with uncertainties these kinds of curves can give useful information. fication having cost above Bmax is not cost effective regardless of the risk reduction.
Figures 22 and 23 show the calculated cost effectiveness curves for the two systems analyzed earlier in this section. The consequence factors for manrem shown in Section 7 were used along with the conversion factor of $1000
In the figure, risk reduction Ro - R and failure probability reduction To evaluate a proposed modification to a system, for example,
If the cost of the modification is within the cost
For example, from Figure 21 it is seen that any modi-
per manrem.
the maximum benefit is seen to be less than $12,000 per year. this level translated to a total plant lifetime would not be cost effective. Achieving the maximum benefit would require reducing the system failure proba- bility to near zero, which may be impossible to accomplish. mental improvements would have smaller benefits as indicated on the curve.
The auxiliary feedwater system at Calvert Cliffs had the highest risk reduction worth of any system analyzed. benefit values on the cost benefit curve shown in Figure 23. Benefits of almost $2,000,000 per year are predicted by improving the present system. effect of the planned changes to the system described in the RSSMAP study are approximately indicated on the curve by P i . improvement is realized by these changes.
For the reactor protection system at Grand Gulf, shown in Figure 22, Costs above
Smaller incre-
This is reflected by the high
The
About 90 percent of the potential
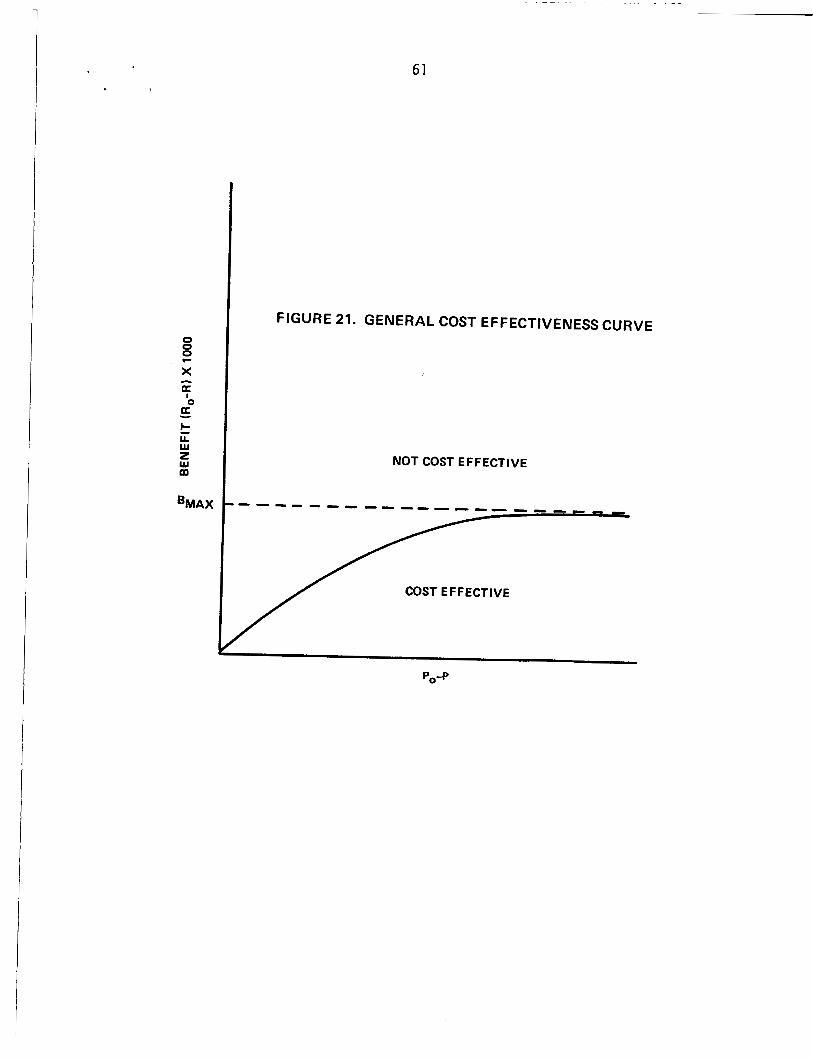
- - . - - . . . . . . . . - .
61
FIGURE 21. GENERAL COST EFFECTIVENESS CURVE
NOT COST EFFECTIVE
COST EFFECTIVE
Po-P

62
20
19
18
17
16
15
14
13
12 CT c 0
FIGURE 22. COST EFFECTIVENESS CURVE FOR IMPROVEMENT TO THE REACTOR PROTECTION SYSTEM AT GRAND GULF
- - -
-
-
- -
- NOT COST EFFECTIVE
-
COST EFFECTIVE

63
FIGURE 23. COST EFFECTIVENESS CURVE FOR IMPROVEMENT TO THE AUXILIARY FEEDWATER SYSTEM A T CALVERT CLIFFS
I I I I I I I
COST EFFECTIVE
I I I I I I .
0 s X 10-4 1 x 10⁻³ 1.5 10-3 2~ 10-3 2.5 10-3 I 3~ 10-3
Po-P P1
INTERVAL DECREASE IN FAILURE PROBABILITY

64
9.0 CONTAINMENT ANALYSIS
In this section risk worth measures and sensitivity studies are applied to the containment in order to investigate its risk importance. Section 9.1 the risk worths for the four RSSMAP plants are calculated. Section 9 .2 the importance of containment design is investigated by assuming different containments are placed on one plant and calculating the risk worths for each containment design. Section 9 . 3 examines the importance of the assumed mean failure pressure to risk estimates at one plant. defines two measures of containment reliability and evaluates the RSSMAP designs using these measures. sures calculated are expected manrem and expected acute fatalities. (Core melt frequency is not a useful measure for calculating importances of consequence mitigating features since it is assumed the containment has no effect on core melt frequency.)
In In
Section 9.4
For the risk worth evaluations, the risk mea-
9.1 Risk Worths of RSSMAP Containments
The risk worth calculations involve determining the decreased risk level with the containment assumed optimized and the risk level with no con- tainment and comparing to the risk level predicted by RSSMAP.
23. The risk achievement ratios indicate the containment presently reduces dose by a factor of about 3 and reduces early fatalities by a factor of 10. The risk reduction ratios indicate that acute fatalities could be reduced to essentially zero (giving a risk reduction ratio of infinity) for those plants not having the V sequence (releases which bypass containment). where the V sequence is important, acute fatalities could at most be reduced by a factor of ~ 1 0 . factor of % l o 3 i f containment were optimized; for plants with V, a factor of ~ 1 0 is the most that dose can be reduced. The risk worths of the four containments are graphed on Figure 24 using manrem as the risk measure and neglecting the V sequence.
The containment worth ratios for the four plants are shown in Table
For the plants
For those plants without V , manrem could be reduced by a

TABLE 23. CONTAINMENT R I S K WORTHS
Risk Reduction Worth Risk Achievement Worth I n t e r v a 1 Rat i o I n t e r v a l Rat i o
Acute Acute Acute Acute P1 ant Manrem F a t a l i t i e s Manrem F a t a l i t i e s Manrem F a t a l i t i e s Manrem F a t a l i t i e s
Sequoyah w i t h V 65.6 3.0 x 10⁻³ 12.5 11.8 79.0 2.7 x 10⁻² 2.12 9.09 w i thou t V 65.6 3.0 x 10⁻³ 1726. m 2.21 9.93 79.0 2.7 x 10⁻²
0, 2.0 x 10⁻³ 9.7 10.0 107.4 2.7 x 10⁻² 3.53 13.4 vl Oconee w i th V 38.2 w i t h o u t V 38.2 2.0 10-3 888. m 107.4 2.7 x 10⁻² 3.82 14.6
Ca lver t C l i f f s 1710. 9.3 x 10⁻² 1657. m 2388. 7.1 x 10⁻¹ 2.40 8.69
Grand Gu l f 80.8 2.0 x 10⁻³ 2886. W 27.6 1.9 x 10⁻² 1.34 10.6

102
I
I C
1
1
103
104
66
FIGURE 24. RISK WORTH RATIOS OF THE CONTAINMENTS AT THE FOUR RSSMAP PLANTS WITH RESPECT TO MANREM
I
I a
U 2 3 8
z 4 8
n
a

67
It is interesting to note that the ratio measures of risk worth are independent of the core melt frequency while the interval values are a function of the magnitude of the core melt frequency. The ratio worths thus tend to isolate the effectiveness of containment whereas the interval worths are useful for decisions involving the risk level or cost-benefit comparisons.
tainment optimized is calculated by assuming the containment is capable of withstanding all threats to containment integrity, the containment never fails to isolate, and the sprays always operate. Since these assumptions are equi- valent to a PWR Category 7 release, the consequence factors for that category are applied to the total core melt frequency to determine the risk level with an optimized containment. RSSMAP plants are shown in Table 24. of risk which could be obtained from an optimized or ssperfect" containment. Other considerations may introduce limits to the containment's reliability resulting in a somewhat higher risk.
to the present risk level. sequence, the containment has no effect on the V sequence. therefore, cannot be reduced below this level no matter how effective the containment. If the risk is to be further reduced, the frequency o f the V sequence must be reduced. To show the impact of the V sequence, the risk worths have been calculated with and without the V sequence for the plants where t h i s sequence was considered important.
For the evaluation o f the risk achievement worths, the increased risk level from a failed containment or a containment that was not installed was determined by assuming there was no containment. With no containment there would be no fission product removal mechanisms such as sprays, filters, or deposition on walls and floors. With this assumption, all of the fission products released from the primary system are released directly to the environment. primary system, all of the fission products released from the fuel would be released to the environment. The source assumed is shown in Table 25. The source is equivalent to the WASH-1400 source release from the fuel.
For the above evaluations, the decreased risk level with the con-
The decreased risk levels calculated for the four These values represent the lower limit
For two of the plants, the V sequence was determined to be important Since the containment is bypassed for this
The risk level,
If it is further assumed that there is no deposition within the
These
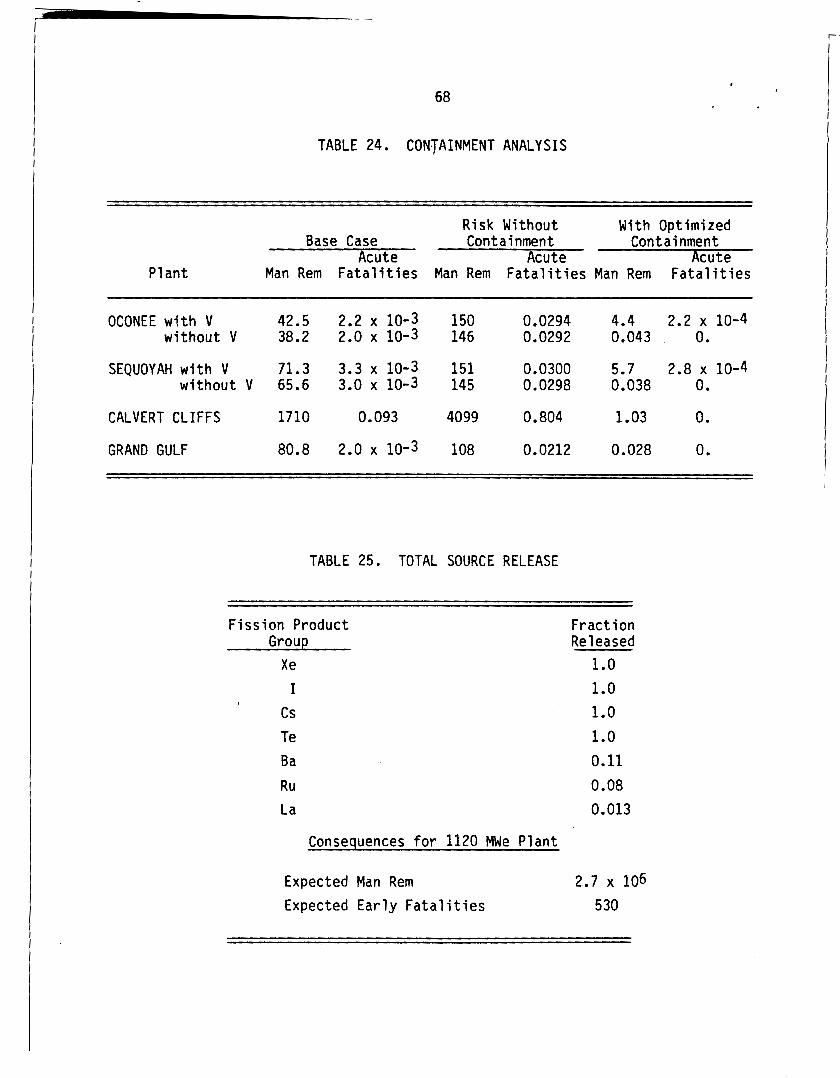
TABLE 24. ca
68
ITAINMENT ANALYSIS
Risk Without Base Case Containment Con t a i nmen t With Opt i m i zed Acute Acute Acute
Man Rem F a t a l i t i e s Man Rem F a t a l i t i e s Man Rem P1 an t F a t a l i t i e s
42.5 2.2 x 10⁻³ 150 0.0294 4.4 2.2 x 10⁻⁴
71.3 3.3 x 10⁻³ 151 0.0300 5.7 2.8 10-4
OCONEE w i th V
SEQUOYAH w i th V w i t h o u t V 65.6 3.0 x 10⁻³ 145 0.0298 0.038
wi thou t V 38.2 2.0 x 10⁻³ 146 0.0292 0.043 0.
CALVERT CLIFFS 1710 0.093 4099 0.804 1.03 0.
GRAND GULF 80.8 2.0 x 10⁻³ 108 0.0212 0.028 0.
0.
TABLE 25. TOTAL SOURCE RELEASE
F i s s i o n Product F r a c t i o n Group Released
i n Xe I
Cs Te Ba
Ru La
Consequences f o r 1120 MWe P lan t
Expected Man Rem Expected E a r l y F a t a l i t i e s
1.u
1.0 1 .o 1.0 0.11 0.08 0.013
2.7 x lo6 530

69
release fractions were input to the CRAC code to determine consequence factors which are shown in Table 25. each plant is shown in Table 24. The assumption o f no deposition in the pri- mary system causes the consequences to be overestimated. indicates the retention factors within the primary system can be significant for some isotopes under certain conditions. due to this mechanism would lead to a lower environmental release and corres- pondingly lower health effects. case risk similarly. become available.
The expected risk with these assumptions for
Ongoing analyses
This reduction of the source term
A reduced source term would affect the base Future analyses should address this issue as results
9.2 Effect of Containment Desian
To obtain further insights into the effectiveness of containment ,
The Oconee plant was chosen as the base case system design on which parametric studies were performed by placing different containments at a plant. different containments were placed. in Table 26 for each of the containment designs considered. important assumptions in the analysis are included in Table 26. The same type of analyses could be applied to other plants and other containment designs. The effectiveness of a containment design for a plant depends primarily on the design of the containment (volume, failure pressure, sprays, etc.) and the loadings imposed on the containment which are determined by the character- istics o f the important accident sequences at that plant.
that are calculated for each containment assuming that containment could be placed on the Oconee plant. the probability of gross containment failure given a core melt. calculated by summing the products of the accident sequence frequency and the containment failure probability for that sequence over all sequences and dividing the sum by the total core melt frequency.
ities for different containments on Oconee are tabulated in Table 27. The results are presented with and without the V sequence to show the impact of this scenario. The risk worths fer t h e various containment9 om Oconee are shown in Table 28.
The containment parameters ar: presented Some of the
Also included on Table 26 are the conditional failure probabilities
The conditional failure probability is defined as This has been
The risks as measured by expected manrem and expected acute fatal-

70
TABLE 26. CONTAINMENT PARAMETERS
Nomi na 1 Conditional Design Fai lur Failure
P1 ant Vo 1 ume Pressure Pressurefl) Probabi lity(2) (ft3) (psis) (Psi4
133 + 20 .459 Oconee 1.91 x 10⁶ 74 - (Prestressed Concrete 1 Calvert Cliffs 2.0 x 10⁶ 65 135 + 10 .18
135 20 .30 ( Prestressed - Concrete)
100 + 15 .95 Surry 1.8 x 10⁶ 60 - (Reinforced Concrete)
Zion 2.72 x 10⁶ 62 148 + 4 .Ol - (Prestressed Concrete)
(1)The nominal failure pressure and failure distribution in each case For Oconee, Calvert was taken from a PRA analyses for that plant.
Cliffs, and Surry, the failure distribution was assumed to be Gaussian with the mean equal to the nominal failure.pressure and the standard deviation as given. For Oconee, the data was taken from the RSSMAP report which assumed a nominal failure pressure of 2 times the design pressure (in psig) and a standard deviation of 20 psi. The Calvert Cliffs RSSMAP analyses assumed a nominal failure pressure 2.5 times the design pressure (in psig) and a standard deviation of 10 psi. analyses was carried out with two standard deviations to show the effect of this assumption. The data for Surry was identical to the containment nalyses in the Reactor Safety Study (100 + 15) psia. The Zion PRAT17) assumed a different set of assumption?. A greater reliance on the containment t o maintain functional integrity is assumed, thus the high failure pressure. The standard deviation is based on statistical variation in materials properties. Because of the relatively large volume and high nominal failure pressure of this design, overpressure failures were negligible risk contributors.
The calculations for the Calvert Cliffs
(2)The conditional failure probability is defined as the probability of gross containment failure (RSS Release Categories 1, 2, or 3) given a core melt. prof i le.
All calculations assumed the Oconee system risk

71
TABLE 27. RISK FOR DIFFERENT CONTAINMENTS ON ONE PLANT1
Containment Design Assumptions
Risk Man Rem Acute Fatalities
Oconee with V without V
Surry with V
without V
Calvert Cliffs 135 - + 10 with V
without V
with V
without V
135 - + 20
Zion with V without V
No Containment with V without V
'I P e r f ec t Con t a i nme n t with V without V
42. 38.
78.
74.
20. 16.
31.
27.
5.0 0.6
150. 146.
4.4 .04
2.2 x 10⁻³ 2.0 x 10⁻³
4.2 x 10⁻³
4.0 x 10⁻³
1.1 x 10⁻³ 9.0 x 10⁻⁴
1.6 x 10⁻³
1.4 x 10⁻³
2.4 10-4 2.0 10-5
2.94 x 10⁻² 2.92 x 10⁻²
2.2 x 10⁻⁴ 0.
1 All values on this table are for the Oconee accident risk profile with the indicated containment design assumptions.

TABLE 28. R I S K WORTHS FOR DIFFERENT CONTAINMENTS ON ONE PLANT
Risk Reduction Worth Risk Achievement Worths In terv a1 Ratio Interval R atio
Containment Acute Acute Acute Acute Assu m ed Man Rem Fatalit ies Man Rem Fatalit ies Man Rem Fatal i t ies Man Rem Fatalit ies
2.0 10-3 2.0 10-3
9.5 950
10 OD
108 108
2.7 x 10⁻² 2.7 x 10⁻²
3.6 3.8
13 15
Oconee with V without V
38 38
2.5 x 10⁻² 2.5 x 10⁻²
4.0 10-3 4.0 10-3
1.9 2.0
7.0 7.3
74 74
18 1900
19 00
72 72
surry with V without V
4 N 27
32 18 21
Calvert Cl i f fs 135 - + 10 with V
without V 135 + 20 with V
without V
2.9 x 10⁻² 2.9 x 10⁻² 2.8 x 10⁻² 2.8 x 10⁻²
9.0 x 10⁻⁴ 9.0 10-4 1.4 10-3 1.4 x 10⁻³
7.5 9.1 4.8 5.4
4.5 400 7.0 680
5.0
7.3 OD
OD
130 130 123 123
16 16 27 27
2.9 x 10⁻² 2.9 x 10⁻²
120 1500
2.0 x 10⁻⁵ 2.0 10-5
1.1 00
145 145
30 240
Zion with V without V
0.6 0.6
1.1 15

73
The results in Tables 27 and 28 show the importance of the contain-
Excluding the Zion contain- ment design to risk estimates. how the worth of containment varies with design. ment design the containment worths for early fatalities range from about a factor of 10 to about a factor of 30. design is a factor of 102 to 103 depending upon whether event V is assumed to be deleted or not. For manrem protection, the ratio worths of containment range from about a factor of 3 to about a factor of 10. the Zion design is a factor of ~ 3 0 to &lo0 for manrem reduction, depending
The risk achievement ratios in Table 28 show
The worth for the Zion containment
The ratio worth of
upon the event V scenario. are not very useful here since the high final risk masks the differences
The risk reduction ratios in Table 28 indicate the improvement
The risk achievement worths on an interval scale
(R; - Ro u R Y ).
possible for the containment designs. the Zion design is near optimal, although hypothetically acute fatalities could be reduced to zero without Sequence V (giving a risk reduction ratio of m). Since the acute fatalities for the Zion containment are relatively small, as measured by the risk reduction interval of 2 x 10⁻⁵, further reduc- tion would not have the priority of the other containment designs. For the containment designs other than Zion, the risk reduction ratios for early fatalities range from a factor of 10 upwards. For manrem, the reduction ratios are all about a factor of 10 with V and are all about a factor of lo3 without V .
and risk reduction worths for all the containment designs except Zion are about the same. other designs in reducing early fatalities and manrem. worth of containment by about a factor o f 3 for manrem reduction. fatalities, the effect of event V is larger as measured by the risk ratio because of the possibility of achieving zero early fatalities if event V is assumed to be deleted.
The risk reduction ratios indicate that
Considering the uncertainties in the analyses, the risk achievement
The Zion design is worth about a factor of 10 more than the
For early Event V reduces the

74
9.3 Effect of Containment Failure Pressure
While examining the effect of different containments, the risk was found to be sensitive to the assumed failure pressure distribution. considerable uncertainty associated with the failure pressure distribution. For the Oconee analyses the nominal failure pressure was taken to be two times the design pressure. three times the design pressure. The failure pressure distribution for Oconee was assumed to be a Gaussian distribution with a mean of 133 psia and a standard deviation of 20 psi. The importance of this assumption to risk esti- mates can be shown by recalculating the risk using different mean failure pressure assumptions. ultimate strength) were chosen to represent an upper and lower bound on containment effectiveness at this plant. sents the based case as assumed in the RSSMAP r e p o r t . The 2.5 x Design
pressure represents greater confidence in the containment to maintain func- tional integrity under load and may represent more recent analyses.
virtual certainty given the predicted pressure history for the dominant sequences at Oconee. This assumption represents a lower bound o f containment effectiveness since the "true" containment failure pressure cannot realis- tically be this low. The ultimate strength assumption (approximately 3 x Design pressure) represents an upper bound of containment effectiveness. dominant sequences at Oconee (overpressure by hydrogen burning) have a very low probability of failing containment at this assumed pressure. risk contributors are steam explosions, leakage, and the V sequence.
ment failure due to overpressure is significant (.2 to .5) for the dominant sequences. failure due to overpressure is smaller but still significant (.01 to .07).
The same standard deviation about the mean (20 psi) was assumed for all calculations. It should also be mentioned that the failure pressure and the failure mode, and therefore the consequences, may not be independent. ( 18)
There is
The ultimate strength is estimated as approximately
Two of these assumed values (1 x Design pressure and
The 2 x Design pressure value repre-
At the 1 x Design pressure assumption, containment failure is a
The
The dominant
At the 2 x Design pressure assumption, the probability of contain-
At the 2.5 x Design pressure assumption, the probability of

. . . ..... . . . . . . ~ . ............ ~ ~
75
Table 29 shows the risk estimates for a variety of different assump- tions on the containment failure pressure. pressure is seen to have over an order of magnitude importance considering the V sequence and two orders of magnitude importance if the V sequence is dis- counted. The risk as measured by manrem is plotted in Figure 25. The risk worths are presented in Table 30. for each of the assumed failure pressures with the V sequence discounted. risk reduction worth and risk achievement worths are seen to be strong functions of the assumed mean failure pressure.
The assumption of mean failure
The risk worths are displayed in Figure 26 The
TABLE 29. RISK ESTIMATES AS A FUNCTION OF MEAN FAILURE PRESSURE
Assumption Risk
Man Rem Acute Fatalities
1 x Design Pressure with V 89 without Y 85
2 x Design Pressure with V without V
2.5 x Design Pressure with Y without Y
Ultimate Strength with V without V
42 38
11 7
7.0 x 10⁻³ 6.8 x 10⁻³
2.2 x 10⁻³ 2.0 x 10⁻³
5.9 x 10⁻⁴ 3.9 x 10⁻⁴
5.0 2.4 x 10⁻⁴ .6 2.0 x 10⁻⁵
9.4 Definition of Containment Reliability Measures
Instead of utilizing risk worth measures, another way of evaluating containment importance i s to utilize containment reliability measures. measures which can be used to characterize containment reliability are:
Two
P = the probability o f any individual dying given a core melt (or source core damage) accident

100
5 a 3 E
c z
K
1 .o
0.
76
FIGURE 25. RISK VS MEAN FAILURE PRESSURE AT OCONEE *-
WITH u = 20 PSI
\ \ \ \
\ \
\ \
\
\
\ \
\ \ \ - -
L I
1 1
80 90 100 1 I I
110 120 130 140 150 160 170 180 190 200 210 I I I I I 1

I
TABLE 30. R I S K WORTHS FOR OCONEE AS A FUNCTION OF MEAN FAILURE PRESSURE ( a- = 20 p s i )
Assumption
R i s k Reduction Worth Risk Achievement Worth I n t e r v a1 Rat io I n t e r v a l Rat io
Manrem F a t a l i t i e s Manrem F a t a l i t i e s Manrem F a t a l i t i e s Manrem F a t a l i t i e s Acute Acute Acute Acute
1 x Design Pressure w i t h V 85 w i t h o u t V 85
2 x Design Pressure w i th V 38 w i thout V 38
2.5 x Design Pressure w i th V 7 w i thout V 7
U1 t imate Strength w i th V w i t h o u t V
.6
.6
6.8 x 10⁻³ 20 6.8 x 10⁻³ 2100
2.0 10-3 9.5 2.0 10-3 950
3.9 10-4 2.5 3.9 10-4 180
2.0 10-5 2.0 10-5
1.1 15
32 m
10 m
2.7 00
1.1 00
61 6 1
2.2 x 10⁻² 2.2 x 10⁻²
108 2.7 x 10⁻² 108 2.7 x 10⁻²
139 2.9 x 10⁻² 139 2.9 x 10⁻²
1.7 1.7
3.6 3.8
14 21
145 2.9 x 10⁻² 30 145 2.9 x 10⁻² 240
4.2 4.3
13 15
50 75
120 1500
U U

r
I
78
102
10
1
1c
10:
10
i o
X
N u!
FIGURE 26. RISK WORTH RATIOS FOR MANREM AT OCONEE FOR DIFFERENT ASSUMED MEAN FAILURE PRESSURES
z E n v) w
X N

79
E = the expected number of individuals dying given a core
In the above definit are protected by the and probabilities it containment reliabil
melt or source core damage accident
ons, the individual or individuals are the public, which containment. is known that E > P for all cases. Another measure of ty is the probability that more than X individuals are
From the relationship between expectation
-
killed where X i s some large number. protecting against large numbers of people dying when a major accident occurred. larger numbers o f people will be small.
tainment reliability can also be redefined in terms of radiological releases:
This measure focuses on the containment
If P and E are sufficiently small then the probability of killing
Instead of focusing on fatalities, the above two measures of con-
P = the probability that no significant radiological release occurs when a major accident occurs
E = the radiological release which is expected to occur when a major accident, occurs
To apply the above definitions, "significant radiological release" would need to be translated to numerical values for explicitly defined iso- topes. Explicit criteria would also need to be defined for categorizing an accident sequence as a major accident or one causing source core damage.
by using factors for each release category. frequency and ai is the acute fatalities factor for that category, then the expected acute fatalities A is simply
For the RSSMAP evaluations, expected acute fatalities are calculated If fi is the release category
where the sum is over the release categories.
ity measure E can be simply expressed in terms of A: If acute fatalities are focused upon then the containment reliabil-

Cfiai Hi
- - -
Thus E is the weighted average of the release category frequencies where each release category is weighted by its acute fatality importance ai.
In a similar way, the expected manrem which is calculated for the RSSMAP conclusions can be related to the containment reliability measure in terms of expected release. The expected manrem M is calculated by
where mi i s the manrem factor for a release category 4. expressed as manrem then the containment reliability measure in terms o f
expected release E i s simply related to M by
If release is
Thus E i s a weighted average of the release category frequencies where the weight is now Mi which is the importance of the category in terms of manrem re 1 ease.
TABULATION OF CONTAINMENT RELIABILITY MEASURES FROM RSSMAP
Table 31 lists the acute reliability measure E for those cases Table 32 lists the manrem reliability evaluated in the RSSMAP analyses.
measure for the RSSMAP cases. These values in Tables 31 and 32 are rela- tively high since no evacuation was assumed for the consequence evaluations.

81
This was purposely done to separate the effect of containment from the effect of evacuation. As observed from the table, within about a factor of 2, the containment relia- bility measures for expected fatalities and expected manrem are all about the same, about 50 expected acute fatalities and about 1 x 10⁶ expected manrem per core melt. core melts are not necessarily benign and that containment design improvements and other improvements in mitigative measures could significantly reduce these values.* The previous risk worth evaluations on containment gave risk reduction ratios of at least 10 which, if initiated, would result in expected acute fatalities being less than ~5 and expected manrem being less than %lo5 with the no evacuation assumption.
The reliability measures tend to focus on the consequences.
These relatively high values indicate that the consequences of
TABLE 31. CONTAINMENT RELIABILITY MEASURES FOR ACUTE FATALITIES FOR THE RSSMAP PLANTS ASSUMING NO EVACUATION
Sequoyah 3 . 2 x 10⁻³ Oconee 2.6 x 10⁻³ Calvert Cliffs 1.2 x 10⁻¹ Grand Gulf 2.0 x 10⁻³
5.6 x 10⁻⁵ 57 8.2 x 10⁻⁵ 32 2.0 x 10⁻³ 60 3.6 10-5 56
*Because o f RSSMAP's conservative modeling, the values in Tables 31 and 32 can be significantly higher than those calculated using more realistic analyses. These conclusions are thus dependent on the RSSMAP results and would need to be validated before any implementation is pursued. This conclusion is also dependent on the source term assumptions which are currently being reevaluated.

82
T A B L E 32. CONTAINMENT R E L I A B I L I T Y MEASURES FOR EXPECTED MANREM FOR THE RSSMAP PLANTS ASSUMING NO EVACUATION
,
P l a n t
67 5.6 x 10⁻⁵ 1.2 x 10⁶ 48 8.2 x 10⁻⁵ 5.9 x 10⁵
2200 2.0 x 10⁻³ 1.1 x 10⁶
S e q u o y ah O c o n e e C a l v e r t C l i f f s G r a n d G u l f 83 3.6 x 10⁻⁵ 2.3 x 10⁶

83 s .
REFERENCES
(1) Carlson, D. D., et al., "Reactor Safety Study Methodology Applications Program: Sequoyah #1 PWR Power Plant", NUREG/CR-1659/1 of 4 (February 1981).
( 2 ) Kolb, G. J., et al., "Reactor Safety Study Methodoloqy Applications Program: Oconee #3 PWR Power Plant", NUREG/CR-1659/2 of 4 (January 1981).
( 3 ) Kolb, G. J., et al., "Reactor Safety Study Methodology Applications Program: be published).
Calvert Cliffs #2 PWR Power Plant", NUREG/CR-1659/3 of 4 (to
( 4 ) Hatch, S. W., Cybulskis, P., and Wooten, R. O., "Reactor Safety Study Methodology Applications Program: NUREG/CR-1659/4 of 4 (October 1981).
Engelbrecht-Wiggins, R., and Strip, D. R., On the Relation of Various Reliability Measures to Each Other and to Same Theoretic Values, NUREG/CR-1860 (January 1981).
K. G. Morphy, NRC Letter of July 30, 1980 to R. M. Bernero.
Birnbaum, Z. W . , "On the Importance of Different Components in a
Grand Gulf #1 BWR Power Plant",
(5)
(6)
(7) Multicomponent System" in Multivariate Analyses--11, ed P. R. Kreshnai ah, Academic Press, New York, pp. 581-592 (1969).
(8) Barlow, R. E., and Proschan, F., Statistical Theory of Reliability and Life Testinq: Probability Models, Holt, Rinehart and Winston, Inc., New York (19i5).
(9) Lambert, H. E., "Measures o f Importance of Events", in Reliability and Fault Tree Analyses, ed. R. E. Barlow, J. B. Fussell, and N. D. Singpurwalla, SIAM Press, Philadelphia, pp. 77-100 (1975).
(10) Risk Assessment Review Group Report to the U.S. Nuclear Regulatory Commi ss ion, NUREG/CR-0400 (September 1978).
(11) Three Mile Island, A Report t o the Commissioners and to the Public, NRC Special Inquiry Group (January 1980).
(12) NRC Views and Analyses o f the Recommendations of the President's Commission on the Accident at Three Mile Island, NUREG-0632 (November 1979).
(13) TMI-2 Lessons Learned Task Force--Final Report, USNRC (1980).

84
Murley, T. E., Ernst, M. L., and Thadani, A., "NRC Regulatory Perspective on Reliability and Risk Assessment'', ANS Proceesings on Probabilistic Risk Assessment, Conference 81905, pp. 1077 -1086 (1978).
"Reactor Safety Study, An Assessment o f Accident Risks in U.S. Commercial Nuclear Power Plants", WASH-1400 (October 1975).
Andrews, W. B., et al., "Guidelines For Nuclear Power Plant Safety Issue Prioritization Information Development1', PNL-4297 (May 1982).
Commonwealth Edison, "Zion Probabilistic Safety Study", (1981).
Cybulskis, P., "On the Definition of Containment Failure", International Workshop on Containment Integrity, Washington D.C., June 7-9, 1982.

APPENDIX A
EXAMPLE R I S K WORTHS FOR OTHER R I S K MEASURES

t A- 1
TABLE A-1. RISK REDUCTION WORTHS FOR OCONEE SAFETY SYSTEMS
Risk Reduction Worth Interval Ratio
Core Melt Acute Core Melt Acute System Frequency Man Rem Fatalities Frequency Manrem Fatalities
Auxi 1 iary Feedwat er
Pressurizer Relief Valve (Stuck Open)
High Pressure Inject ion
Low Pressure Injection
Emergency Core Cooling Recirculation
Service Water
Electric Power (On-Si te)
Reactor Protection System
High Head Ser v i ce Water
3.0 x 10⁻⁶
1.8 10-5
1.4 x 10⁻⁵
8.8 x 10⁻⁶
3.3 x 10⁻⁵
1.5 x 10⁻⁵
2.2 x 10⁻⁶
7.8 x 10⁻⁶
2.2 x 10⁻⁶
1.9 1.0 x 10⁻⁴
10 5.6 x 10⁻⁴
8.5 4.7 10-4
2.0 1.2 10-4
19 1.0 x 10⁻³
12 6.4 10-4
1.8 9.6 x 10⁻⁵
4.8 2.6 x 10⁻⁴
1.4 7.4 10-5
1.0 1.0 1.0
1.3 1.3 1.3
1.2 1.3 1.3
1.1 1.1 1.1
1.9 1.8 1.8
1.3 1.3 1.3
1.0 1.0 1.0
1.1 1.1 1.1
1.0 1.0 1.0
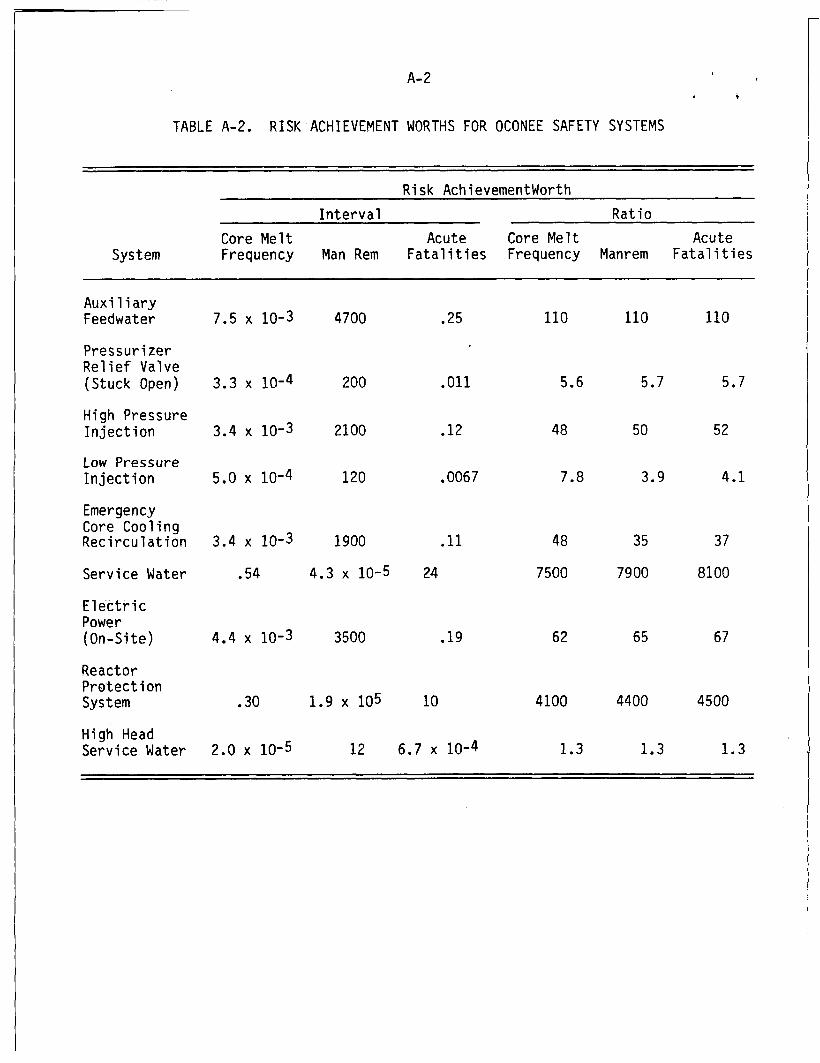
A-2
TABLE A-2. RISK ACHIEVEMENT WORTHS FOR OCONEE SAFETY SYSTEMS
t
Risk Achievementworth Inter Val Rat io
Core Melt Acute Core Melt Acute System Frequency Man Rem Fatalities Frequency Manrem Fatalities
Auxi 1 i ary Feedwater
Pressurizer Relief Valve (Stuck Open)
High Pressure Injection
Low Pressure Injection
Emergency Core Cooling Recirculation
Service Water
Electric Power (On-Si te)
Reactor Protection System
High Head Service Water
7.5 x 10⁻³
3 .3 10-4
3.4 x 10⁻³
5.0 x 10⁻⁴
3.4 x 10⁻³
.54
4.4 x 10⁻³
.30
2.0 x 10⁻⁵
4700
200
2100
120
.25
.Oll
.12
.006 7
1900 .ll
4.3 10-5 24
110 110
5.6 5.7
48 50
7.8 3.9
110
5.7
52
4.1
48
7500
35 37
7900 8100
3500 .19 62 65 67
1.9 x 10⁵ 10 4100 4400 4500
12 6.7 x 10⁻⁴ 1.3 1.3 1.3

L A- 3 <
TABLE A-3. RISK REDUCTION WORTHS FOR HUMAN ACTIONS AT OCONEE
Risk Reduction Worth Int erva 1 Rat io
Individual Core Melt Acute Core Melt Acute Human Actions Frequency Man Rem Fatalities Frequency Manrem Fatalities
Operator Fails to Start the High Pressure Injection System 1.3 x 10⁻⁵ 8.2
Failure o f Operator to Align Suction o f HPRS to Discharge o f LPRS 8.4 x 10⁻⁶ 5.2
Operator Leaves LP Pump Train Test Valves in Wrong Position 9.9 x 10⁻⁶ 5.6
Operator Fails to Open Sump Valves at the Start o f Recirculation 9.6 x 10⁻⁶ 4.8
Common Mode Miscalibration of Instruments Which Actuate HPIS 9.0 x 10⁻⁸ 0.056
Operator Fails to Manually Start High Head Auxiliary Service Water 2.2 x 10⁻⁶ 1.3
4.4 x 10⁻⁴ 1.2 1.2 1.2
2.8 x 10⁻⁴ 1.1 1.1 1.1
3.1 x 10⁻⁴ 1.2 1.2 1.2
2.8 10-4 1.2 1.1 1.2
3.0 x 10⁻⁶ 1.0 1.0 1.0
7.3 x 10⁻⁵ 1.0 1.0 1.0

A- 4
TABLE A-4. RISK ACHIEVEMENT WORTHS FOR HUMAN ACTIONS AT OCONEE
Risk Achievement Worth Interval Ratio
Individual Core Melt Acute Core Melt Acute Human Actions Frequency Man Rem Fatalities Frequency Manrem Fatalities
Operator Fai 1s to Start the High Pressure Injection System 4.3 x 10⁻⁴
Failure o f Operator to A1 i gn Suction o f HPRS to Discharge o f LPRS 2.8 x 10⁻³
Operator Leaves LP Pump Train Test Valves in Wrong Position 3.3 x 10⁻³
Operator Fai 1 s to Open Sump Valves at the Start o f Recirculation 3.2 x 10⁻³
Common Mode Miscalibration o f Instruments Which Actuate HPIS 2.8 x 10⁻³
Operator Fails t o Manually Start High Head Auxi 1 i ary Service Water 1.9 x 10⁻⁵
260 0.014 6.9 7.2 7.4
1700 0.094 40 42 43
1900 0.10 47 45 46
1600 0.076 45 38 35
1700 0.094 40 42 43
12 6.5 x 10⁻⁴ 1.3 1.3 1.3

NRC Q35 U.S. NUCLEAR REGULATORY COMMISSION 111 81r
I BIBLIOGRAPHIC DATA SHEET I TITLE AND SUBTITLE (Add Volume No., /fappropnare)
Measures of Risk Importance and Their Applications
1. REPORT NUMEER Mssignedby DOC)
NUREG/CR 3385 BY1 2103
2. (Leave blank)
3. RECIPIENT'S ACCESSION NO. 1 7. AUTHOR(S1
W.E. Vesely, T.C. Davis, R.S. Denning, And N.Saltos 3 . PERFORMING ORGANIZATION NAME AND MAIL ING ADDRESS //nclude Zfp Codel
Battel l e Columbus Laboratories 505 King Avenue Co1,umbus ,Ohio 43201
5. DATE REPORT COMPLETED MONTH Y E A R
March 1983 DATE REPORT ISSUED MONTH Y E A R
Jul v 1983 6. (Leave blank)
I 8. (Leave blank)
13. TYPE OF REPORT
12. SPONSORING ORGANIZATION NAME AND MAIL ING ADDRESS (Include ZIP Code)
Division of Risk Analysis Office of Nuclear Regulatory Research U. S. Nuclear Regulatory Commission Washington,D.C. 20555
P E R I O D C O V E R E D (Inchsfwe dates1
I 110. PROJECT/TASK/WORK UNIT NO.
15. SUPPLEMENTARY NOTES 14. (Leave ol ;nkl
8 AVAILABIL ITY STATEMENT 19 SECURITY CLASS lThfs reporrl . .
The objectives of t h i s work are t o evaluate the ivportance o f t h e containment and the d i f fe ren t safety functions as assessed in probaSil is t ic r isk .analyses. defined t o evaluate a feat t i re 's importance in further 'reducing the r isk and
i ts- importance i n m d i n t 3 i n i n g t h e present r isk level . On? defined importance measure, called the f ea tu re ' s r isk reduction worth, i s useful for pr ior i t iz ing fenture imp-aveic-r7ts w h i c h can m o s t reduce t h e r i sk . The o t h e r d e f i n e d
iTJr.rt?riiP, c a l l e d t h e f ea tu re ' s r isk achi?vznsnt wcrth, i s us2Tul for p r i o r i -
t i z in ; f S t ' J r 2 5 w ? i c h a r e m b t i f i i p o r t a n t in r e l i a b i l i t y a s s J r z i c 2 and msin-
To accomplish t h i s objective, r i sk importance measures ars
- A ) tenance a c t i v i t i e s .
21 NO OF PAGES
17. K E Y WORDS AND DOCUMENT ANALYSIS 17a. DESCRIPTORS
l7b. I DENTI F I€ RS/OPEN-EN DE D TERMS
NRC FORM 335 111-811