Purchasing and Its Management Prepared by: Bhakti Joshi Presented on: August 06, 2013.
Upload
sheryl-blairCategory
view
217download
0
Measures of Central Tendency
Prepared by: Bhakti JoshiDate: November 21, 2011

Ogives
Ages
Frequency of Mobile Phones Owned
Cumulative Frequency
Percentage Cumulative Frequency
10 - 15 3 3 (3/30)*100=10%
15 - 20 2 3+2 = 5 (5/30)*100=16.67%
20 - 25 6 5+6=11 (11/30)*100= 36.67%
25 - 30 7 11+7=18 (18/30)*100=60%
30 - 35 5 18+5=23 (23/30)*100=76.67%
35 - 40 2 23+2=25 (25/30)*100= 83.33%
40 - 45 5 25+5=30 (30/30)*100=100%

Frequency of mobile phones owned
10 15 20 25 30 35 40 45
1
2
3
4
5
6
7
8

Percentage Cumulative Frequencies of mobile phones owned
15 20 25 30 35 40 45
10
20
30
40
50
60
70
80
90
10
0
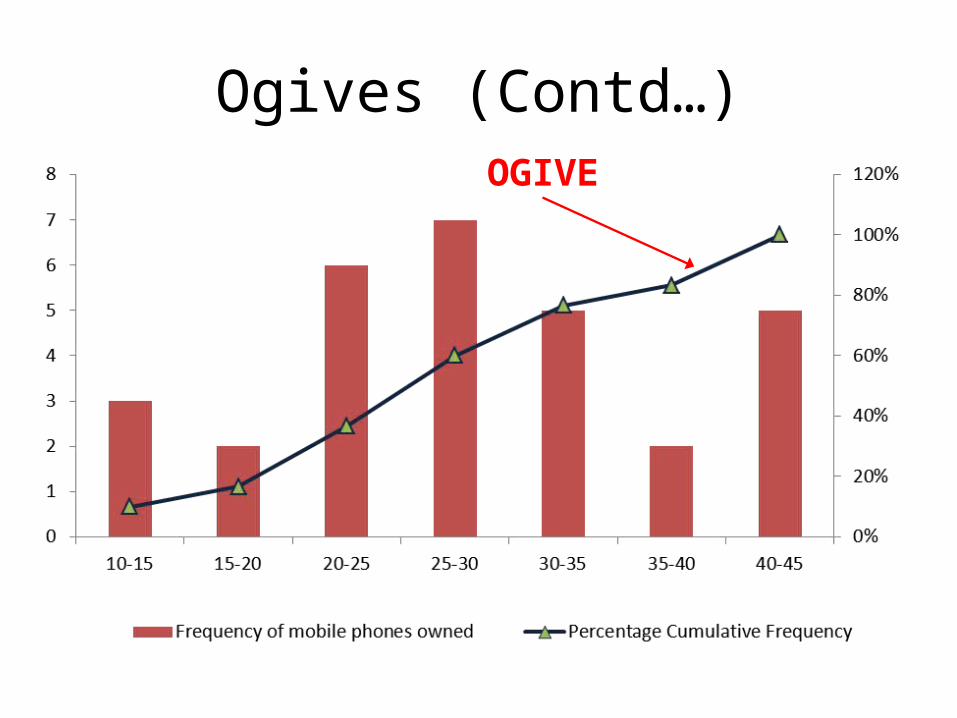
Ogives (Contd…)OGIVE
Measures of Central Tendency
• Known as summary statistics• Description of numerical information• Analysis of information from the middle point
of a distribution and hence the term “Central Tendency”
• The starting point to analyse the spread of the data (Measure of Dispersion)

Mean or Arithmetic Mean (AM)
Roll No. Age
1 182 183 184 185 196 167 188 179 1810 18
Mean= 178/10 = 17.8
Interpretation?

Weighted Mean
Age Intervals
Frequency of Mobile
Phones Owned (f)
Mid-point
(x)fx
10 - 15 20 12.5 20*12.5= 250
15 - 20 40 17.5 40*17.5= 700
20 - 25 60 22.5 60*22.5=1350
25 - 30 70 27.5 70*27.5=1925
30 - 35 60 32.5 60*32.5=1950
35 - 40 30 37.5 30*37.5=1125
40 - 45 20 42.5 20*42.5=850
Interpretation? Weighted Mean= 27.16

Median
Roll No. Age
1 182 183 184 185 196 167 188 179 1810 18
…Central Item of a data set
(N+1) /2 = MN = Number of observationsM= Median

Median
Age Intervals
Frequency of Mobile
Phones Owned (f)
Cumulative Frequency
10 - 15 20 20
15 - 20 40 60
20 - 25 60 120
25 - 30 70 190
30 - 35 60 250
35 - 40 30 280
40 - 45 20 300
Interpretation?

Mode…Value that is repeated most often in the data set. Mode is not used for ungrouped data
Age Intervals
Frequency of Mobile
Phones Owned (f)
Cumulative Frequency
10 - 15 20 20
15 - 20 40 60
20 - 25 60 120
25 - 30 70 190
30 - 35 60 250
35 - 40 30 280
40 - 45 20 300
Interpretation?

Relationship between Mean-Median-Mode
• Mean < Median < Mode = Negatively Skewed
• Mean> Median> Mode = Positively Skewed
• Mean = Median = Mode = Normal

ProjectsStock Prices of Companies representing any one of the following industries listed on the BSE or NSE•Textiles•Banking•Automobiles•IT/Telecommunication•Pharmaceutical•Foods & Beverages•Infrastructure•Steel•Oil & Gas•Chemicals

Email: [email protected]: www.headscratchingnotes.net