Measurements on FM Transmitters for Acceptance ... · mon in broadcast radio. In a stereo...
89
Measurements on FM Transmitters for Acceptance, Commissioning and Maintenance Application Note Product: | R&S ETL Despite the advent of advanced digital transmission methods, analog broadcast- ing remains highly important. Until now, measurements on FM transmitters in connection with acceptance testing, com- missioning and maintenance required using a variety of T&M instruments. The R&S ® ETL TV analyzer combines these instruments' capabilities in a single unit and can completely replace them. Now, for the first time, acceptance test measurements can be conducted on FM transmitters quickly and easily using just one compact test instrument. The R&S ® ETL provides the functionalities of a power meter, spectrum analyzer, audio generator, FM measurement demodulator, stereo decoder, audio analyzer and more in just one box. Measurements on FM Transmitters for Acceptance, Commissioning and Maintenance Klaus,Christiane Sep-13 – 7BM105_0E
Transcript of Measurements on FM Transmitters for Acceptance ... · mon in broadcast radio. In a stereo...

Measurements on FM Transmitters for Acceptance, Commissioning and Maintenance Application Note
Product:
| R&SETL
Despite the advent of advanced digital
transmission methods, analog broadcast-
ing remains highly important. Until now,
measurements on FM transmitters in
connection with acceptance testing, com-
missioning and maintenance required
using a variety of T&M instruments.
The R&S®ETL TV analyzer combines
these instruments' capabilities in a single
unit and can completely replace them.
Now, for the first time, acceptance test
measurements can be conducted on FM
transmitters quickly and easily using just
one compact test instrument. The
R&S®ETL provides the functionalities of a
power meter, spectrum analyzer, audio
generator, FM measurement demodulator,
stereo decoder, audio analyzer and more
in just one box.
Mea
sure
men
ts o
n F
M T
rans
mitt
ers
for
Acc
epta
nce,
Com
mis
sion
ing
and
Mai
nten
ance
Kla
us,C
hris
tiane
Sep
-13 –
7BM
105_
0E

7BM105_0E Rohde & Schwarz Measurements on FM Transmitters for Acceptance, Commissioning and Maintenance 2
Contents
1 Overview ................................................................................. 4
2 FM Basics ............................................................................... 6
2.1 The Multiplex (MPX) Signal ......................................................................... 6
2.1 Pre- and Deemphasis ................................................................................... 8
2.2 RF Bandwidth ............................................................................................... 8
2.3 Stereo Decoder ............................................................................................. 8
2.4 Transmitter Inputs ........................................................................................ 9
3 R&S®ETL Settings for FM Measurements .......................... 10
3.1 General FM Settings – Radio Settings .....................................................11
3.1.1 Modulation Standard ....................................................................................12
3.1.2 Stereo Decoder ............................................................................................13
3.1.3 Outputs .........................................................................................................14
3.1.4 Universal Interface (Option B201) ................................................................15
3.1.5 DUT Parameters...........................................................................................15
3.2 Audio Generator Settings ..........................................................................16
3.2.1 Type ..............................................................................................................17
3.2.2 Signal ............................................................................................................18
3.2.3 Connector Config .........................................................................................19
3.2.4 Waveform .....................................................................................................19
3.2.5 Ampl Definition and Level .............................................................................20
3.2.6 Preemphasis/Preemphasis Compensation ..................................................20
3.3 Configuration Dialogs for Audio Analysis Measurements ....................21
3.3.1 Demodulator .................................................................................................21
3.3.2 Audio Generator ...........................................................................................22
3.3.3 Measurement Options ..................................................................................22
3.4 Configuration Dialogs for Modulation Analysis Measurements ...........22
4 Preparatory Steps ................................................................ 23
4.1 Required Equipment ..................................................................................23
4.2 Test Setup ...................................................................................................23
4.3 Protection Against Destructive Input Power ...........................................25
4.4 R&S®ETL Default Configuration for Measurements ...............................25

7BM105_0E Rohde & Schwarz Measurements on FM Transmitters for Acceptance, Commissioning and Maintenance 3
5 Measurements ...................................................................... 27
5.1 Transmitter Output Level ...........................................................................27
5.2 Frequency Accuracy ..................................................................................30
5.3 Frequency Deviation Constant: Checking the Transmitter's Frequency
Modulator Constant ...................................................................................32
5.4 Frequency Response .................................................................................37
5.4.1 Amplitude-Frequency Response ..................................................................37
5.4.2 Phase Response ..........................................................................................43
5.4.3 Balance .........................................................................................................48
5.5 Stereo Crosstalk .........................................................................................51
5.6 Nonlinear Distortion ...................................................................................54
5.6.1 Total Harmonic Distortion (THD) ..................................................................54
5.6.2 Dual Frequency Distortion (DFD) .................................................................58
5.7 Spurious modulation (Signal-to-Noise Ratio, S/N) .................................65
5.7.1 Spurious Frequency Modulation...................................................................65
5.7.2 Spurious Amplitude Modulation ....................................................................70
5.7.3 Noise Power Density at 57 kHz ....................................................................73
5.8 Polarity of the Input ....................................................................................76
5.9 Digital Input Signal (AES/EBU) .................................................................79
6 Abbreviations ....................................................................... 81
7 Auxiliary Information ........................................................... 81
8 Ordering Information ........................................................... 82
A Input Level and Frequency Deviation ................................. 83
A.1 Overview in Tables .....................................................................................83
A.2 Mathematical Correlation Between the Input Level and the Frequency
Response ....................................................................................................84
A.3 Example for Calculating the Required Audio Level ................................85
B Automated Measurements with R&S®TxCheck ................. 86

Overview
7BM105_0E Rohde & Schwarz Measurements on FM Transmitters for Acceptance, Commissioning and Maintenance 4
1 Overview Frequency modulation (FM) remains very popular in analog broadcasting. Compared
with amplitude modulation (AM), FM needs more bandwidth, but it is also more im-
mune to interference and offers a better signal-to-noise ratio (modulation gain). FM
also supports nonlinear (class C) amplifiers, which are more efficient.
Despite the advent of advanced digital transmission methods, analog broadcasting
remains highly important. Until now, measurements on FM transmitters in connection
with acceptance testing, commissioning and maintenance required using a variety of
T&M instruments.
The R&S®ETL TV analyzer combines these instruments' capabilities in a single unit
and can completely replace them. Now, for the first time, acceptance test measure-
ments can be conducted on FM transmitters quickly and easily using just one compact
test instrument. The R&S®ETL provides the functionalities of a power meter, spectrum
analyzer, audio generator, FM measurement demodulator, stereo decoder, audio
analyzer and more in just one box.
Fig. 1: R&S
®ETL.
This application note covers the fundamental FM measurements performed during FM transmitter acceptance testing, commissioning and maintenance. These measure-ments are conducted using test signals. FM transmitter test standards are highly country- and customer-specific, so the settings and test limits contained in this applica-tion note are only intended as examples. The measurements described here are based on field reports and Rohde & Schwarz transmitter test department reports, as well as the IEC 244-13 test standard, and technical guidelines issued by the Institute for Broadcasting Technology (IRT) for public broadcasters in Germany, Austria and Swit-zerland.
Section 2 briefly describes the basics of FM broadcast technology. Section 3 explains the settings available on the R&S
®ETL. Section 4 begins by covering the preparations
for testing. That includes information on the necessary test equipment and setup, as well as steps to protect the T&M equipment against destructively high input power. Section 4 then goes on to describe basic configuration of the R&S
®ETL for conducting
measurements. Section 5 details individual types of measurements, including the requisite R&S
®ETL configurations.

Overview
7BM105_0E Rohde & Schwarz Measurements on FM Transmitters for Acceptance, Commissioning and Maintenance 5
Appendix A explains the linkage between a transmitter's modulation input level and the resulting frequency deviation. Appendix B shows how to use the R&S
®TxCheck soft-
ware with the R&S®ETL to automate many of the measurements covered here in this
document.

FM Basics
The Multiplex (MPX) Signal
7BM105_0E Rohde & Schwarz Measurements on FM Transmitters for Acceptance, Commissioning and Maintenance 6
2 FM Basics In frequency modulation (FM), the carrier frequency wave is varied in sync with the
transmitted signal. The change in the carrier frequency caused by modulation is re-
ferred to as the frequency deviation. The greater the amplitude of the information
signal, the greater the frequency deviation (see Fig. 2 and Fig. 3).
Fig. 2: Audio scope display showing a frequency-modulated 1 kHz audio signal – on the left with a
20 kHz frequency deviation (resulting from 0 dBu), and on the right with a 40 kHz frequency deviation
(resulting from 6 dBu).
Fig. 3: RF spectrum of a frequency-modulated 1 kHz audio signal – on the left with a 20 kHz frequen-
cy deviation (resulting from 0 dBu), and on the right with a 40 kHz frequency deviation (resulting
from 6 dBu).
2.1 The Multiplex (MPX) Signal
There are two types of audio signals: mono and stereo. Stereo signals are more com-
mon in broadcast radio. In a stereo transmission, the FM transmitter is used to transmit
stereophonic signals, which consist of two independent audio channels.
The FM stereo system was designed to be backward compatible and allow broadcast
signals to be received on mono equipment as well. The pilot tone multiplex system,
defined in CCIR recommendation 450, section 2, was developed for this purpose. In
this system, the modulation signal is generated by a special stereo coder. This can be
a separate, upstream device, or it can be integrated in a transmitter. A transmitter
without a stereo coder can be used as a mono transmitter.

FM Basics
The Multiplex (MPX) Signal
7BM105_0E Rohde & Schwarz Measurements on FM Transmitters for Acceptance, Commissioning and Maintenance 7
A matrix circuit in the stereo coder generates a sum signal M (middle) and a difference
signal S (side) from the left and right audio signals (each of which has a bandwidth of
15 kHz). The sum signal M equates to the mono signal transmitted by a mono transmit-
ter. The difference signal S is amplitude-modulated on a subcarrier at 38 kHz. This
subcarrier is suppressed to reduce the bandwidth required, and a pilot tone at 19 kHz
is transmitted instead. The pilot tone enables a receiver (decoder) to identify that the
broadcast signal is stereo; it also enables a stereo receiver to recover the suppressed
subcarrier (at 38 kHz) and demodulate the difference signal.
The stereo coder's full output signal is called a multiplex (MPX) signal. This essentially
consists of three parts:
The sum signal M
2
RL, with a bandwidth of 40 Hz to 15 kHz
The 19 kHz pilot tone
The modulated difference signal S
2
RL, with a bandwidth of
23 kHz to 53 kHz
As VHF radio evolved, the following ancillary signals were incorporated to support
additional services:
Radio Data System (RDS): This carries static information (such as the sta-
tion identifier and track titles) that appears on receiver displays. The infor-
mation is transmitted digitally on a 57 kHz subcarrier
o The precursor of RDS was ARI (Autofahrer-Rundfunk-Information,
automobile radio information)
Data Radio Channel (DARC): This is a system similar to RDS, and is used
mainly in Japan and the USA
Subsidiary Communication Authorization (SCA): This carries an additional,
telephone-grade audio signal. The SCA ancillary signal's standard fre-
quencies are 41 kHz (for mono transmitters only), 67 kHz and 92 kHz
These ancillary signals are added to the MPX signal (see Fig. 4).
Fig. 4: Schematic diagram of an MPX signal spectrum.

FM Basics
Pre- and Deemphasis
7BM105_0E Rohde & Schwarz Measurements on FM Transmitters for Acceptance, Commissioning and Maintenance 8
2.1 Pre- and Deemphasis
Frequency modulation has a triangular noise spectrum. This means that the noise
power density is not constant but increases with the audio-frequency bandwidth. To
improve the signal-to-noise ratio at high frequencies, the stereo coder uses preempha-
sis. This is a process in which high frequencies are boosted prior to transmission.
Preemphasis utilizes a time constant that differs from country to country: In Europe and
Japan, it is generally 50 µs; in the USA, 75 µs. To return to a linear frequency re-
sponse, the preemphasis must be reversed by the receiver in a process called deem-
phasis.
2.2 RF Bandwidth
The signal generated in the stereo coder is frequency-modulated in an exciter. Based
on Carson's rule, the following applies approximately to the bandwidth of a frequency-
modulated signal (see Fig. 5):
98 % of the spectral power within
99 % of the spectral power within
where Carrierf frequency deviation
Fig. 5: RF spectrum of a frequency-modulated 1 kHz audio signal (left) and a frequency-modulated
15 kHz audio signal (right). Both signals have a frequency deviation of 40 kHz.
2.3 Stereo Decoder
In the decoder, the left channel (L) consists of the sum signal plus the difference sig-
nal; the right channel (R) consists of the difference of the sum signal and the difference
signal:
L = 2
R-L
2
RL = S+M
R = 2
R-L
2
RL = S-M

FM Basics
Transmitter Inputs
7BM105_0E Rohde & Schwarz Measurements on FM Transmitters for Acceptance, Commissioning and Maintenance 9
2.4 Transmitter Inputs
Transmitters have an MPX input into which the MPX signal is fed. Transmitters with an
integrated stereo coder have L and R inputs in addition to the MPX input.
Audio Engineering SocietyEuropean Broadcasting Union Most of today's advanced
transmitters have an Audio Engineering Society/European Broadcasting Union
(AES/EBU) input that accepts both stereo and mono digital audio signals. This input is
specified in the AES3 standard. AES/EBU supports impedances of 110 ohms (on
AES3 balanced cables) and 75 ohms (on unbalanced coaxial cable). The signal level
for AES/EBU is given in decibels relative to full scale (dBFS) and is relative to the
highest possible audio level.

R&S®ETL Settings for FM Measurements
7BM105_0E Rohde & Schwarz Measurements on FM Transmitters for Acceptance, Commissioning and Maintenance 10
3 R&S®ETL Settings for FM Measurements The R&S
®ETL combines several FM signal analyzers (see Fig. 6) with a stereo coder
and an audio test signal generator in a single instrument. This means it offers a wide
variety of possible settings. For the most part, though, only a few settings need to be
made for any given measurement. This application note details the settings required
for each type of measurement (see Section 5).
Fig. 6: Simplified overview of the analysis functions for acceptance-testing an FM transmitter.
This section provides an overview of the available settings, what they do, and how they
interact. Having this background knowledge is not a prerequisite for performing the
measurement, because information on all of the required settings is provided along
with the measurement descriptions in Section 5. Here, in Section 3, users can read
about what the settings actually mean.
The R&S®ETL provides the following configuration dialogs for FM measurements:
Radio settings (3.1)
Audio generator (3.2)
Configuration dialogs for individual measurements:
Audio analysis measurements (3.3):
Frequency response
Crosstalk
Level
Signal-to-noise (S/N) ratio
Total harmonic distortion (THD)
Dual frequency distortion (DFD)
Modulation analysis measurements (3.4):
Audio scope
Audio spectrum
MPX power and peak deviation
MPX deviation distribution
Multipath detection
RDS

R&S®ETL Settings for FM Measurements
General FM Settings – Radio Settings
7BM105_0E Rohde & Schwarz Measurements on FM Transmitters for Acceptance, Commissioning and Maintenance 11
In configuration dialogs, it is important always to configure the settings from the top
down, because some of the settings available are contingent upon others. For in-
stance, the "Stereo Decoder" setting under "Radio Settings" is only available if "FM
Stereo" has been selected under "Radio Standard".
3.1 General FM Settings – Radio Settings
The basic FM settings are available when the R&S®ETL is set to "Radio" mode under
"TV/Radio Analyzer/Receiver" (MODE→TV/Radio Analyzer/ Receiver→Radio), and
they can be configured under "Radio Settings" (see Fig. 7 ).
Fig. 7: Switching the R&S
®ETL to "Radio" mode and opening the "Radio Settings" dialog.
The settings in the "Radio Settings" configuration dialog comprise the following five
groups; these are described in the sections indicated below in parentheses (see
Fig. 8).
Fig. 8: The "Radio Settings" configuration dialog, accessed via MEAS→Radio Settings.
Modulation Standard (3.1.1)
Stereo Decoder (3.1.2)
Outputs (3.1.3)
Universal Interface (Option B201) (3.1.4)
DUT Parameters (3.1.5)

R&S®ETL Settings for FM Measurements
General FM Settings – Radio Settings
7BM105_0E Rohde & Schwarz Measurements on FM Transmitters for Acceptance, Commissioning and Maintenance 12
3.1.1 Modulation Standard
Radio Standard
The radio standard must be selected to match the transmitter's operating mode:
FM Mono: This should be selected for mono-only transmitters because, ac-
cording to some specifications (such as RaiWay) they may require an audio-
frequency bandwidth of up to 17.5 kHz. In stereo, this bandwidth is technically
unfeasible. Choosing "FM Mono" means that no stereo measurements will be
available for selection in the R&S®ETL menu.
"FM Stereo" should be selected as the radio standard for measurements on
stereo transmitters in mono mode when an audio-frequency bandwidth of
15 kHz is sufficient, or for measurements on the sum signal M.
FM Stereo: This setting causes the R&S®ETL to behave like a receiver with a
stereo measurement decoder. The audio-frequency bandwidth is limited to
15 kHz.
Channel Bandwidth
A narrow channel selection (lower bandwidth) clips the sidebands. As bandwidths
narrow, distortion increases. For this reason, to take precise measurements on trans-
mitters, users should select the largest available bandwidth (1 MHz). However, when
conducting measurements on a receive antenna with adjacent channels, it may be
necessary to select narrower bandwidths in order to limit interference from adjacent
channels as much as possible.
Data System
The "Data System" setting enables measurements to be performed on RDS signals
(including the RBDS variant used in the USA) and on DARC signals. Choosing "None"
under "Data System" means that these measurements will not be available or per-
formed.
The only measurement available for DARC is frequency deviation ("DARC Deviation").
The R&S®ETL has a decoder for RDS and RBDS (MEAS→Modulation Analy-
sis→RDS→Extended RDS Analysis). "RBDS mode" must be enabled for RBDS (see
Fig. 9, top right). The "extended RDS analysis” option in the R&S®ETL makes it possi-
ble, among other things, to analyze transmitter names and alternative frequencies.

R&S®ETL Settings for FM Measurements
General FM Settings – Radio Settings
7BM105_0E Rohde & Schwarz Measurements on FM Transmitters for Acceptance, Commissioning and Maintenance 13
Fig. 9: RDS/RBDS decoder.
SCA Mode
The "SCA Mode" setting allows the SCA ancillary signal to be demodulated and meas-
ured. The setting distinguishes between "Narrow" (approx. 14 kHz bandwidth of the
modulated subcarrier, which is used in the USA, for instance) and "Wide" (approx.
26 kHz bandwidth of the modulated subcarrier, which is used, in Italy, for example). If
this is set to "Off", these measurements are not available or performed. If SCA is
activated, the center frequency of the subcarrier to be demodulated must be entered
under "SC Freq" (SC = subcarrier); this frequency defaults to 41 kHz (mono transmit-
ters only) or 67 kHz. For stereo transmitters, 92 kHz is also common.
3.1.2 Stereo Decoder
Pilot Dev Threshold
"Pilot Dev Threshold" sets how high the minimum frequency deviation caused by the
pilot signal must be in order for the signal to be recognized as stereo. This affects the
appearance of the status bar on the lower right of the measurement screen: If the pilot
deviation is smaller, the R&S®ETL displays the red warning "MONO". This setting also
affects the automatic switching of the 1/L and 2/R output signals from stereo to mono
(see 3.1.3).
The stereo decoder's actual synchronization with the pilot signal does not depend on
this setting.

R&S®ETL Settings for FM Measurements
General FM Settings – Radio Settings
7BM105_0E Rohde & Schwarz Measurements on FM Transmitters for Acceptance, Commissioning and Maintenance 14
3.1.3 Outputs
Selected signals can be fed in analog or, in some instances, in digital form to an exter-nal audio analyzer for extended analysis. Two outputs are available for this purpose (see Fig. 10):
CCVS (color composite video signal; the R&S®ETL also uses this to output analog
TV signals – thus the name)
Balanced outputs (1/L and 2/R)
Fig. 10: The R&S®ETL has two outputs for more extensive audio analysis.
The demodulated digital signal in AES/EBU format (available on the CCVS output) has better signal quality than the demodulated analog signals on the 1/L and 2/R outputs. This is why, if possible, the AES/EBU format should be used when an external audio analyzer is connected.
1/L, 2/R Output
Outputs 1/L and 2/R can be used for two purposes. First, outputs 1/L and 2/R can
supply a generator signal to feed a transmitter. Second, a signal (a mono, decoded
stereo, M&S or SCA signal) received on the RF input can be output for more detailed
audio analysis (e.g. on an external audio analyzer). If "Auto" is selected under "1/L, 2/R
Output", a mono or stereo signal is output, depending on the pilot signal threshold
setting (see 3.1.2).
The selected signal also appears on the headphone output (AF Out) and in the
AES/EBU signal; the latter can be selected on the CCVS output if required.
It is important to note that the 1/L and 2/R outputs are balanced but not floating. This
means that it is not possible to produce an unbalanced signal by connecting an output
to ground.
Deemphasis
The "Deemphasis" setting under "Outputs" affects the headphone output (AF Out), the
1/L and 2/R outputs and the AES signal. The deemphasis settings available for "Auto",
"Mono", "Stereo" and "M&S" under "1/L, 2/R Output" are 50 µs, 75 µs or off. The
deemphasis settings available for SCA under "1/L, 2/R Output" are 100 µs, 150 µs or
off.
Deviation for 6 dBu output level
For technical reasons, the output levels on 1/L and 2/R are limited to 12 dBu. By
changing the "Deviation for 6 dBu output level" setting, it is possible to adjust the
output level range to suit specific requirements. If this is set to 40 kHz, signals with a
frequency deviation of up to 80 kHz can be output without clipping. If set to 75 kHz,
signals with a maximum deviation of 150 kHz can be output without clipping.
Note that the maximum possible signal-to-noise ratio on this output drops as the fre-
quency deviation increases.

R&S®ETL Settings for FM Measurements
General FM Settings – Radio Settings
7BM105_0E Rohde & Schwarz Measurements on FM Transmitters for Acceptance, Commissioning and Maintenance 15
CCVS Output
The MPX signal, the demodulated signal in digital AES/EBU format, the pilot signal or
the RDS/DARC or SCA subcarrier can be output on the CCVS output.
The demodulated signal in the digital AES/EBU format contains the signal selected
under "1/L, 2/R Output" (mono, stereo, or M&S).
3.1.4 Universal Interface (Option B201)
Connector Config
The "Connector Config" setting allows the way the audio generator's signal outputs are
assigned to be adjusted to the transmitter's signal inputs. This helps to avoid having to
disconnect and reconnect cables.
There are two choices available for output signal assignment:
"L/MPX/AF – R – AES"
This is used if the transmitter under test has a combined input for L and MPX.
"L – R – MPX/AF/AES"
This can be selected if the transmitter has separate L, R and MPX inputs. Recon-
nection will be necessary in order to measure the AES/EBU modulation input.
If the way the signal outputs are assigned does not match the transmitter's signal
inputs, reconnection will be necessary.
A third possible choice is available under "Connector Config"; this allows received and
decoded RDS data and the RDS clock to be output:
RDS Clk – RDS Dat – none:
This setting is not required in connection with the measurements described here.
The same setting is available in the audio generator configuration dialog on the
R&S®ETL (see 3.2.3).
3.1.5 DUT Parameters
The settings under "DUT Parameters" (DUT = device under test, in other words the FM
transmitter being tested) enable the R&S®ETL to automatically compute the requisite
signal level for a desired frequency deviation. Depending on the transmitter input used,
the deviation and either the analog input level ("Input Level Analog") or the digital input
level ("AES/EBU") must be entered in accordance with the transmitter settings.

R&S®ETL Settings for FM Measurements
Audio Generator Settings
7BM105_0E Rohde & Schwarz Measurements on FM Transmitters for Acceptance, Commissioning and Maintenance 16
3.2 Audio Generator Settings
The requisite audio generator settings are available if the R&S®ETL is set to "Radio"
mode under "TV/Radio Analyzer/Receiver" (MODE→TV/Radio Analyzer/ Receiv-
er→Radio). The audio generator settings can be configured under Audio Genera-
tor→Audio Generator Setup (see Fig. 11 and Fig. 12).
Fig. 11: Switching to "Radio" mode on the R&S
®ETL and initiating the "Audio Generator Setup"
configuration dialog.
Fig. 12: The "Audio Generator Setup" configuration dialog. This is accessed via MEAS→Audio
Generator→Audio Generator Setup.
The generator settings for audio analysis measurements can also be configured in the
configuration dialog ("Setup") for each type of measurement (see 3.3). The settings are
easier to make there because the configuration dialog only offers relevant and appro-
priate settings, which is why using this dialog is recommended. In the THD setup, for
instance, no waveform setting is available because the measurement is only carried
out with a single tone. If the audio generator is to be used for purposes other than
audio analysis measurements, the settings must be made in "Audio Generator Setup".
R&S®ETL Settings for FM Measurements
Audio Generator Settings
7BM105_0E Rohde & Schwarz Measurements on FM Transmitters for Acceptance, Commissioning and Maintenance 17
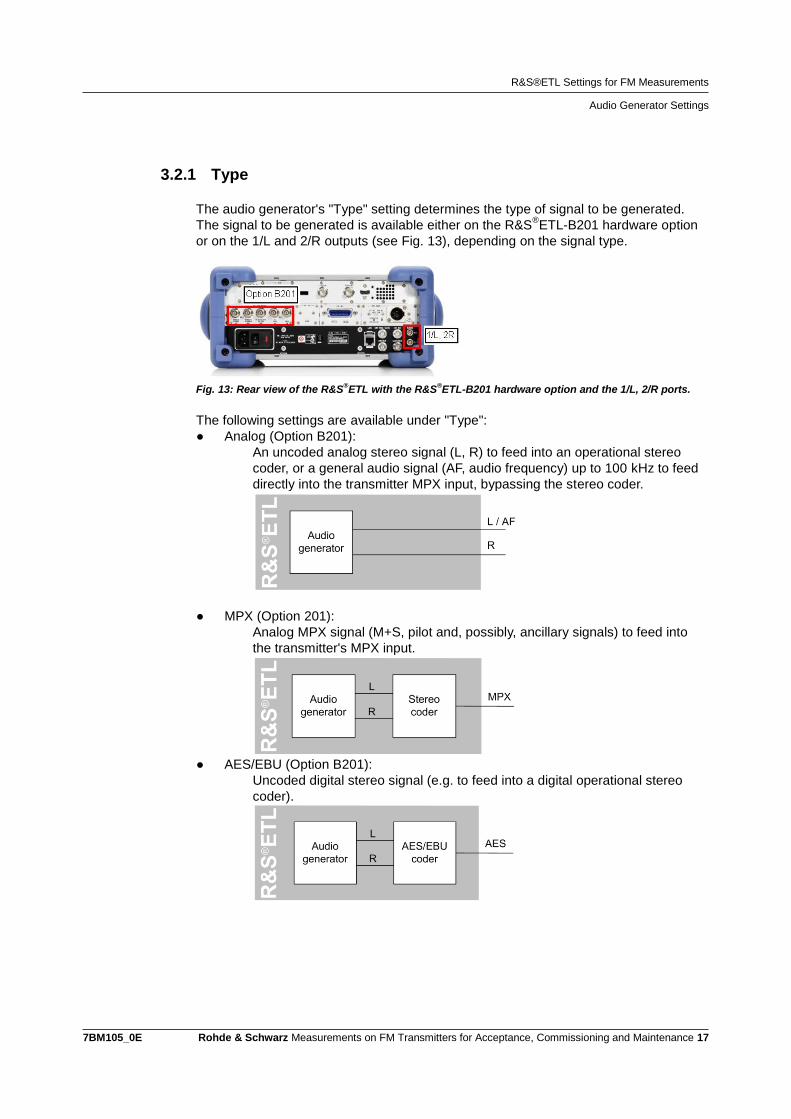
3.2.1 Type
The audio generator's "Type" setting determines the type of signal to be generated.
The signal to be generated is available either on the R&S®ETL-B201 hardware option
or on the 1/L and 2/R outputs (see Fig. 13), depending on the signal type.
Fig. 13: Rear view of the R&S®ETL with the R&S
®ETL-B201 hardware option and the 1/L, 2/R ports.
The following settings are available under "Type":
Analog (Option B201):
An uncoded analog stereo signal (L, R) to feed into an operational stereo
coder, or a general audio signal (AF, audio frequency) up to 100 kHz to feed
directly into the transmitter MPX input, bypassing the stereo coder.
MPX (Option 201):
Analog MPX signal (M+S, pilot and, possibly, ancillary signals) to feed into
the transmitter's MPX input.
AES/EBU (Option B201):
Uncoded digital stereo signal (e.g. to feed into a digital operational stereo
coder).

R&S®ETL Settings for FM Measurements
Audio Generator Settings
7BM105_0E Rohde & Schwarz Measurements on FM Transmitters for Acceptance, Commissioning and Maintenance 18
Analog (1/L, 2/R):
Uncoded analog stereo signal that uses the 1/L and 2/R ports. Unlike the
"Analog (Option B201)" type, the output signal is balanced; L=-R and L<>R
signals are available, too (see 3.2.2). However, the signal-to-noise ratio and
bandwidth (15 kHz) are lower and the frequency response greater. The "Ana-
log (Option B201)" type should therefore be used if possible.
3.2.2 Signal
The composition of the signal generated can be selected here. The following signals
are available:
AF (= audio frequency): general audio signal up to 100 kHz
L: left only, right off
R: right only, left off
L=R: left and right with same phase
L=-R: left and right with opposed phase
L<>R: left and right with different frequencies; the frequency and level can be
selected separately
The options available depend on the setting under "Type" (see 3.2.1):
Analog (Option B201): AF, L, R, L=R
MPX (Option B201): L, R, L=R, L<>R, L=-R, SCA
AES/EBU (Option B201): L, R, L=R, L=-R, L<>R
Analog (1/L,2/R): L, R, L=R, L=-R, L<>R

R&S®ETL Settings for FM Measurements
Audio Generator Settings
7BM105_0E Rohde & Schwarz Measurements on FM Transmitters for Acceptance, Commissioning and Maintenance 19
3.2.3 Connector Config
As already noted in 3.1.4, this setting makes it possible to adapt the R&S®ETL-B201
hardware option's audio generator outputs to the transmitter's modulation inputs, and
this setting can also be changed in the Radio Setting menu.
The graphic display in "Audio Generator Setup" (see Fig. 14) shows the signals cur-
rently configured on the R&S®ETL-B201 hardware option's output or on the 1/L and
2/R outputs. Green means that the signal is output; red means that no signal is output.
Fig. 14: Screenshots showing two possible signal configurations for the audio generator (bottom)
and how they map to the generator outputs on the R&S®ETL (top).
3.2.4 Waveform
Depending on the type of measurement, a single-tone or dual-tone signal needs to be
generated. The following settings are available:
"Single Tone":
A single sine-wave tone is generated at a chosen frequency for each channel. This
is needed, for instance, for measuring frequency response (5.4) or total harmonic
distortion (5.6.1).
"Dual Tone, constant spacing" or "Dual Tone independent frequencies":
Two sine-wave signals are generated on each channel. Both tones have the same
amplitude. Due to the different requirements, the R&S®ETL offers two convenient
input options to suit different test specifications:
– Dual Tone, constant spacing: The frequency of the higher tone and the fre-
quency spacing are specified – to measure the dual-frequency distortion, for
example (5.6.2.1)
– Dual Tone independent frequencies: Two independent frequencies are speci-
fied – to test input polarity, for example (5.8)

R&S®ETL Settings for FM Measurements
Audio Generator Settings
7BM105_0E Rohde & Schwarz Measurements on FM Transmitters for Acceptance, Commissioning and Maintenance 20
3.2.5 Ampl Definition and Level
The dimension (unit) for the generator amplitude is selected under "Ampl Definition":
Level:
The level in dBu (0 dBu = V7746,0≈mW1•Ω600 ).
Peak Voltage:
The peak voltage in V. The peak-to-peak voltage cannot be entered as such, but it
can be specified easily here by applying a conversion factor of 2.
With a dual-tone signal, the selected peak voltage is the total of the amplitude of
both tones.
The reason for entering the peak value here rather than the RMS value (more
common in audio analysis) is that with FM the frequency deviation resulting from
the generator signal is usually specified as the peak deviation.
Desired DUT Deviation:
The desired transmitter frequency deviation in kHz resulting from the generator
level is entered directly here. This convenient function computes and inserts the
requisite level based on the "DUT Parameters" entered under "Radio Settings"
(see 3.1.5). For instance, if a THD measurement is conducted with a deviation of
100 kHz, entering the "Desired DUT Deviation" here saves having to calculate the
requisite generator level (see appendix A).
If preemphasis is enabled on the modulator, "Preemphasis Comp" (see 3.2.6) can
compensate by reducing the level generated by the audio generator.
3.2.6 Preemphasis/Preemphasis Compensation
Preemphasis
The preemphasis function is only available for the generator type "MPX (Option
B201)". It is part of the MPX generator contained in the stereo measurement decoder.
Preemphasis compensation
If "Ampl Definition" = "Desired DUT Deviation" has been selected, the "Preemphasis
Compensation" setting is available for all other generator types ("Analog (Option
B201)", "AES/EBU (Option B201)" and "Analog (1/L, 2/R)").
In accordance with the chosen time constant, the audio generator's level is reduced
automatically in line with the frequency to provide a constant frequency deviation when
transmitter preemphasis is activated. This makes measurements that require a con-
stant frequency deviation (e.g. THD or crosstalk) easier to conduct.

R&S®ETL Settings for FM Measurements
Configuration Dialogs for Audio Analysis Measurements
7BM105_0E Rohde & Schwarz Measurements on FM Transmitters for Acceptance, Commissioning and Maintenance 21
3.3 Configuration Dialogs for Audio Analysis Measure-
ments
The following audio analysis measurements are available:
Frequency response
Crosstalk
Level
Signal-to-noise (S/N) ratio
Total harmonic distortion (THD)
Dual frequency distortion (DFD)
The audio analysis measurements' configuration dialogs can be called up in the rele-
vant measurement mode, and they are organized into three groups (see Fig. 15).
Fig. 15: "TV/Radio Analyzer/Receiver" operating mode, MEAS→Audio Analysis→Frequency Re-
sponse→Frequency Response Setup.
The configurations available depend on the given measurement type and are ex-
plained here using an example based on a frequency response measurement.
3.3.1 Demodulator
The signal to be analyzed is selected under "Signal Path". In audio analyzer measure-
ments, the choices available are limited to the signals that the generator can generate.
A deemphasis setting of 50 µs, 75 µs or off can be selected for stereo-decoded signals
(L, R, L&R, M&S, M, S).
Demodulator (3.3.1)
Audio generator (3.3.2)
Measurement options (3.3.3)

R&S®ETL Settings for FM Measurements
Configuration Dialogs for Modulation Analysis Measurements
7BM105_0E Rohde & Schwarz Measurements on FM Transmitters for Acceptance, Commissioning and Maintenance 22
3.3.2 Audio Generator
The choice of generator settings under "Audio Generator" is confined to generator
settings relevant for the selected type of measurement (see 3.2). With measurements
that call for automatic switching between the L path and the R path (in Amplitudenfre-
quenzgang, 5.4.1, for instance), the colored indicator is half green and half red (see
Fig. 15). The outputs are switched automatically in automated measurements.
To avoid unnecessary wear on the relays in the R&S®ETL-B201 option, measurements
are only carried out once in each position. (A measurement can be restarted with the
RUN hardkey if required.) If the generator signal needs to alternate (e.g. for long-term
measurements), "Alternate L and R continuously" can be enabled.
3.3.3 Measurement Options
The configurations available under "Measurement Options" depend on the given
measurement type and are explained in context in this application note (see Section 5).
3.4 Configuration Dialogs for Modulation Analysis
Measurements
The following measurements are available under "Modulation Analysis". They are
mainly intended to be conducted during operation:
Audio scope
Audio spectrum
MPX power and peak deviation
MPX deviation distribution
Multipath detection
RDS
The settings in the modulation analysis measurements' configuration dialogs can be
called up during the relevant measurements. The configurations available depend
largely on the given measurement type.
This application note does not cover measurements conducted during operation, so
the individual configuration options are not explained here.

Preparatory Steps
Required Equipment
7BM105_0E Rohde & Schwarz Measurements on FM Transmitters for Acceptance, Commissioning and Maintenance 23
4 Preparatory Steps
4.1 Required Equipment
Basic configuration
R&S®ETL TV analyzer with:
options as needed (see Section 8)
current firmware (available free of charge at
www.rohde-schwarz.com/product/ETL.html)
Application- or measurement-specific configurations
Transmitter operation without signal broadcasting for transmitter ac-ceptance testing or commissioning
Dummy antenna
For measuring transmitter output level with a measurement uncertainty of < 0.1 dB
Additional power sensor, e.g. R&S®NRP-Z91
If the directional coupler is not part of the transmitter
Directional coupler

Preparatory Steps
Test Setup
7BM105_0E Rohde & Schwarz Measurements on FM Transmitters for Acceptance, Commissioning and Maintenance 24
4.2 Test Setup
Fig. 16: Test setup.
The EXT REF reference input located at the rear of the R&S®ETL TV analyzer is used
to connect the instrument to the 10 MHz GPS time reference available at the transmit-
ter station. The optional power sensor can be connected to the R&S®ETL via USB or
via the sensor input on the R&S®ETL hardware option R&S
®FSL-B5.
The RF input on the R&S®ETL (IN1) or the optional power sensor (IN2) is connected to
the measurement interface of the transmitter output (M1 = forward, M2 = reflected).
For transmitter acceptance tests, the audio generator outputs located at the rear of the R&S
®ETL are connected to the transmitter inputs (marked green, see 3.1.4).
The transmitter output is connected to a dummy antenna before the broadcast signal is
applied to the antenna diplexer. As a result, the test port at the antenna diplexer (M3)
is available as an additional measurement point.

Preparatory Steps
Protection Against Destructive Input Power
7BM105_0E Rohde & Schwarz Measurements on FM Transmitters for Acceptance, Commissioning and Maintenance 25
4.3 Protection Against Destructive Input Power
The R&S®ETL allows maximum input power peaks of 36 dBm (short-term, < 3 s), while
the recommended, separate R&S®NRP-Z91 power sensor can handle up to 23 dBm.
It is, therefore, recommended that additional attenuators be used as needed to limit the
average total power at the individual test ports to a range from 0 dBm to 10 dBm. This
range provides adequate protection against short-term power peaks, while having a
negligible effect on the instrument accuracy. The resulting attenuation must of course
be taken into consideration during specific measurements, such as the transmitter
output level.
4.4 R&S®ETL Default Configuration for Measurements
The following conventions are used in these procedures:
Terms in capital letters refer to key labels, e.g. "FREQ" for
Bulleted lists (e.g. Radio Standard) identify settings made in the currently dis-
played configuration dialog box
All other terms refer to the softkeys that are currently displayed along the right-
hand side of the screen. Arrows (→) separate the keys to be pressed in sequence.

Preparatory Steps
R&S®ETL Default Configuration for Measurements
7BM105_0E Rohde & Schwarz Measurements on FM Transmitters for Acceptance, Commissioning and Maintenance 26
General settings
SETUP→Reference Ext: Use the external 10 MHz reference frequency1
MODE→TV/Radio Analyzer/Receiver→Radio
MEAS→Radio Settings Modulation Standard Radio Standard: FM Stereo Select Channel Bandwidth: 400 kHz Data System: None SCA Mode: Off Stereo Decoder Pilot Dev Threshold: 500 Hz Outputs: Setting only required if the outputs 1/L and 2/R or CCVS are used for ex-tended signal analysis (see 3.1.3) Universal Interface (Option B201): To be configured to match transmitter (see 3.1.4) DUT Parameters: To be configured to match the transmitter (see 3.1.5)
FREQ→Channel RF: Select based on the transmit frequency
Level adjustment
MENU→Adjust Attenuation2
AMPT→Preamp: Off
AMPT→More→Preselector: Off
AMPT→RF Atten Manual: Select the lowest possible setting without overloading3
1 Only necessary if the frequency accuracy is to be measured with very high precision
(> 10-5
) 2 For rough level adjustment.
3 Overload warnings appear centered at the top of the display as "IFovl" or "Ovld".

Measurements
Transmitter Output Level
7BM105_0E Rohde & Schwarz Measurements on FM Transmitters for Acceptance, Commissioning and Maintenance 27
5 Measurements This section explains the measurements that are performed on the analog transmitter
input. After that, Section 5.9 covers the differences associated with using the digital
transmitter input (AES/EBU input).
5.1 Transmitter Output Level
When measuring the transmitter output level, it is important to ensure that the dis-played power level refers exclusively to the power that has been decoupled by the directional coupler. The coupling attenuation can be entered using the R&S
®ETL's "Ref
Level Offset" function, which is then automatically calculated into the displayed value. From the "Overview" mode, you can have the R&S
®ETL measure the signal level
directly via the RF input, at an accuracy of 1 dB. Using a separate power sensor makes it possible to achieve an accuracy of 0.1 dB. When using the "Overview" menu, it is possible to select the unit of measurement and set the predefined limits from the table via MEAS→Overview→Edit Table (see Fig. 17). Measured values that are not within the set limits are displayed in red. To ensure that it is possible to quickly recognize values that are outside the limits – even on black-and-white printouts – such values are also marked with an asterisk (*).
Fig. 17: "TV/Radio Analyzer/Receiver" mode in the MEAS→Overview→Edit Table menu: Selecting the
unit of measurement for the level results.

Measurements
Transmitter Output Level
7BM105_0E Rohde & Schwarz Measurements on FM Transmitters for Acceptance, Commissioning and Maintenance 28
This section describes how the transmitter output level is measured for a signal that is modulated with a maximum operating deviation (for example, 75 kHz). For the dimen-sion (unit of measurement), the configuration proposed here employs "Desired DUT Deviation" for the generator amplitude (for the "Ampl Definition" setting). As an alterna-tive, it is also possible to use the "Level" or the "Peak Voltage".
Procedure: Transmitter output level
Check to ensure that the max. input power is not exceeded (see Section 4.3).
In each case, perform these steps at the test port: M1, for forward power M2, for reverse power
Configure the general settings as described in Section 4.4.
Set the transmitter input to "AF Stereo".
On the transmitter, turn on the preemphasis.
MEAS→Overview→Audio Generator→Audio Generator Setup:
Type: Analog (Option B201) Signal: L=R Connector Config: Set this parameter to match the transmitter (see 3.2.3) Waveform: Single Tone Freq: 500 Hz Ampl Definition: Desired DUT Deviation1 Desired DUT Dev: For example, 75 kHz Preemphasis Comp: Set this parameter to match the transmitter's
preemphasis setting
Adjust the level as described in Section 4.4.
Method 1: "TV/Radio Analyzer/Receiver"
Method 2: Power sensor
AMPT→More→ExpectedLv Offset: Set to the full coupling attenuation at the test port for immediate compensation.
AMPT→More→Ref Level Offset: Set to
the full coupling attenuation at the test
port for immediate compensation.
Feed a signal into the RF input on the R&S
®ETL (IN1)
Connect the power sensor (IN2), which is
connected to the R&S®ETL via USB or
sensor input, to the test port.
MODE→Spectrum Analyzer
MEAS→Overview MENU→Power Meter→Frequency Cou-
pling: Center
MENU→Power Meter→Power Meter→On
Read the level value (see Fig. 18). Read the level value (see Fig. 19).
1 For this it is necessary – as described in the section on the basic settings (Sec-
tion 4.4) – for the transmitter's target operating parameters to be set correctly under “DUT Parameters“.

Measurements
Transmitter Output Level
7BM105_0E Rohde & Schwarz Measurements on FM Transmitters for Acceptance, Commissioning and Maintenance 29
Fig. 18: "TV/Radio Analyzer/Receiver" mode, MEAS→Overview menu: The level can be read in the
first table row, in the status bar on the test screen or in the zoomed view (MEAS→Overview→Zoom).
Fig. 19: Spectrum analyzer mode: FM spectrum with integrated reading from the power sensor
displayed at the top right.

Measurements
Frequency Accuracy
7BM105_0E Rohde & Schwarz Measurements on FM Transmitters for Acceptance, Commissioning and Maintenance 30
5.2 Frequency Accuracy
It is possible to measure the frequency accuracy with or without modulation. The
R&S®ETL has been designed to also be able to measure the frequency accuracy with
modulation.
The level of precision at which the frequency accuracy can be measured depends on
how long it has been since the last time that the T&M instrument was calibrated. In
general, it is possible to assume that an external reference is required in order to
measure at an accuracy > 10-5
(see Basic Configuration 4.4).
Procedure: Frequency accuracy
Check to ensure that the max. input power is not exceeded (see 4.3).
Connect the R&S®ETL (IN1) to test port M1.
Configure the general settings as described in Section 4.4.
Method 1: With modulation
Method 2: Without modulation
Set the transmitter input to AF stereo.
On the transmitter, turn on preemphasis. Set the transmitter to MPX.
MEAS→Overview→Audio Generator→Audio Generator Setup:
Type: Analog (Option B201) Signal: L=R Connector Config: Set to match the
transmitter (see 3.2.3) Waveform: Single Tone Freq: 500 Hz Ampl Definition: Desired DUT Devia-
tion1 Desired DUT Dev: For example,
40 kHz Preemphasis Comp: Set to match
the transmitter's preemphasis setting
Signal: OFF (None of the other settings influence the results.)
Adjust the level as described in Section 4.4.
MEAS→Overview
Read the value for the carrier frequency offset (see Fig. 20).
1 For this it is necessary – as described in the section on the basic settings (Sec-
tion 4.4) – for the transmitter's target operating parameters to be set correctly under “DUT Parameters“.

Measurements
Frequency Accuracy
7BM105_0E Rohde & Schwarz Measurements on FM Transmitters for Acceptance, Commissioning and Maintenance 31
Fig. 20: "TV/Radio Analyzer/Receiver" mode, MEAS→Overview menu: You can read the results for
frequency accuracy ("Carrier Frequency Offset") in the second table row, in the status bar on the test
screen or in the zoomed view (MEAS→Overview→Zoom).

Measurements
Frequency Deviation Constant: Checking the Transmitter's Frequency Modulator Constant
7BM105_0E Rohde & Schwarz Measurements on FM Transmitters for Acceptance, Commissioning and Maintenance 32
5.3 Frequency Deviation Constant: Checking the
Transmitter's Frequency Modulator Constant
When the transmitter's frequency modulator constant is set correctly, the correspond-
ing nominal deviation (of the frequency) arises at a nominal level (usually 6 dBu). In the
TR 5/3.5 guideline, the nominal deviation is also referred to as the standard testing
deviation. In this measurement, the nominal deviation is the measurement variable to
be tested.
Depending on the specific country and on the applicable specifications, the input level
is expressed in dBu or in volts. As a "pseudo" unit of measurement, dBu is a logarith-
mic measure of voltage (√ ). The nominal deviation also
varies depending on the country and on the applicable specifications. Germany, for
instance, uses 40 kHz at 6 dBu, and Switzerland uses 50 kHz at 6 dBu for this. To-
gether, the input level and the frequency deviation yield the modulator constant.
To enable you to make a quick check, the frequency deviation of the L, R, M, S and
MPX signals are shown in the overview (see Fig. 20, lines 4 to 8). The values indicated
there are measured using a peak detector.
For precise verification, it is possible to perform a measurement in the level mode
(MEAS→Audio Analysis→Level). In that case, there are four detectors, each featuring
different characteristics, available for measuring the frequency deviation:
Selective: An FFT-based detector that selectively measures the largest spectral
lines arising in the AF spectrum. Harmonics are not included in the measurement
and, due to the narrowband characteristics, noise has very little influence on the
measurement results. In addition, the system displays the frequency of the meas-
ured signal.
PK: Peak detector. Used to measure the peak deviation of composite signals.
Since the peak value is determined in an absolute measurement, noise has a rela-
tively large influence on the measurement results. Consequently, the measured
value tends to be somewhat too high. This detector is also used for the frequency
deviation display in the R&S®ETL overview menu.
QPK: Quasi-Peak Detector. As specified by ITU-R BS.468-4, this detector shows
the RMS value for a sinusoidal signal, but not for other types of signals. It reacts to
specific pulses and pulse groups in a predefined manner. Consequently, it is de-
signed to deliver the best possible T&M representation of the effect that interfer-
ence has on the human ear. In order to be able to indicate values from the various
detectors in the same order of magnitude, the measured value is multiplied by the
factor √ . The display shows 𝑄𝑃𝐾 √ .
RMS: Root mean square detector. Shows the average value independently of the
shape of the curve. Noise has relatively little influence on the results, although this
influence is significantly stronger than it is with the selective detector. As with the
QPK value, this value is multiplied with the factor √ . The display shows 𝑅𝑀𝑆 √ .
The measured values for the various detectors are displayed simultaneously (see
Fig. 24 and Fig. 25).

Measurements
Frequency Deviation Constant: Checking the Transmitter's Frequency Modulator Constant
7BM105_0E Rohde & Schwarz Measurements on FM Transmitters for Acceptance, Commissioning and Maintenance 33
For displaying the measured frequency deviation, the R&S®ETL offers four possibili-
ties, which can be selected in the "Audio Level Setup" under "Mode" (see Fig. 21):
Absolute: Absolute frequency deviation measured in Hz (for example, 40.525 kHz)
Relative (dB): Variance of the frequency deviation in dB relative to the reference
deviation entered under "Ref Deviation" (for example, 0.114 dB)
Relative deviation dB logDeviation
Reference Deviation
Relative (%): Frequency deviation expressed as a percentage of the value entered
under "Ref Deviation" (for example, 101.317 %)
Relative deviation Deviation
Reference Deviation
Relative Δ(%): Difference between the frequency deviation and the value entered
under "Ref Deviation" (reference deviation) expressed as a percentage (for exam-
ple, 1.317 %)
Relative deviation Deviation – Reference Deviation
Reference Deviation
Fig. 21: Configuration dialog for "Audio Level Setup," which can be called up via MEAS→Audio
Analysis→Level→Level Setup.

Measurements
Frequency Deviation Constant: Checking the Transmitter's Frequency Modulator Constant
7BM105_0E Rohde & Schwarz Measurements on FM Transmitters for Acceptance, Commissioning and Maintenance 34
This section describes the settings for testing the modulator constant without or with
the operating stereo encoder:
Case 1: Without the operating stereo encoder
Feeding of an audio signal (AF) into the transmitter's MPX input and analysis of the
demodulated MPX signal (see Fig. 22). This verifies the transmitter's modulator
constant.
Fig. 22: Measurement configuration for verifying the transmitter's modulator constant.
Case 2: With the operating stereo encoder
Feeding of the L and R signals into the transmitter's operating stereo encoder and
analysis of the decoded L and R signals (see Fig. 23). In addition, this makes it
possible to check to see if the modulator constant is also correct for the operating
stereo encoder being used, in other words, to ensure that the stereo encoder's
gain is one.
Fig. 23: Measurement configuration for verifying the transmitter's modulator constant when us-
ing the operating stereo encoder.

Measurements
Frequency Deviation Constant: Checking the Transmitter's Frequency Modulator Constant
7BM105_0E Rohde & Schwarz Measurements on FM Transmitters for Acceptance, Commissioning and Maintenance 35
For the dimension (unit of measurement) of the generator amplitude ("Ampl Definition"
setting), the configuration proposed here uses the "Desired DUT Deviation". As an
alternative, it is possible to use the "Level" or the "Peak Voltage".
Procedure: Verifying the transmitter's modulator constant
Test to ensure that the max. input power is not exceeded (see Section 4.3).
Connect the R&S®ETL (IN1) to test port M1.
Configure the general settings as described in Section 4.4.
Case 1:
Without the stereo encoder
Case 2:
With the operating stereo encoder
Set the transmitter input to "MPX". Set the transmitter input to "AF Stereo".
On the transmitter, turn off the preemphasis.
MEAS→Audio Analysis→Level→Level Setup:
Demodulator:
Signal Path: MPX
Signal Path: L&R Deemphasis: Off
Audio Generator:
Type: Analog (Option B201)
Signal: AF
Type: Analog (Option B201) Signal: L=R
Connector Config: Set this value to match the transmitter (see 3.2.3) Waveform: Single Tone Freq: 500 Hz Ampl Definition: Desired DUT Deviation
1
Desired DUT Dev: For example, 40 kHz Preemphasis Comp: Off
Measurement Options: Mode: Select the desired display mode (such as "Absolute", for instance).
Adjust the level as described in Section 4.4.
Read the "MPX Selective" values (see Fig. 24). Use PRINT to generate a printout as needed.
Read the "L Selective" and "R Selective" values (see Fig. 25). Use PRINT to generate a printout as needed.
1 For this it is necessary – as described in the section on the basic settings (Section
4.4) – for the transmitter's target operating parameters to be set correctly under “DUT Parameters“.

Measurements
Frequency Deviation Constant: Checking the Transmitter's Frequency Modulator Constant
7BM105_0E Rohde & Schwarz Measurements on FM Transmitters for Acceptance, Commissioning and Maintenance 36
Fig. 24: "TV/Radio Analyzer/Receiver" mode, Audio Analysis→Level menu: Variance of the frequency
deviation for the MPX signal compared to the entered standard test deviation, in percent: Level
Setup: Relative Δ(%).1
Fig. 25: "TV/Radio Analyzer/Receiver" mode, MEAS→Audio Analysis→Level: Frequency deviation for
the L&R signal: Level Setup: Absolute.
1 There is no need to take action in response to the red "MONO" warning in the status
bar, because that warning only indicates that no pilot has been found.

Measurements
Frequency Response - Amplitude-Frequency Response
7BM105_0E Rohde & Schwarz Measurements on FM Transmitters for Acceptance, Commissioning and Maintenance 37
5.4 Frequency Response
With the R&S®ETL, it is possible to measure the amplitude-frequency response and
the phase response up to 100 kHz as well as the balance (i.e., the difference between
the amplitude-frequency responses in the right and left channels).
5.4.1 Amplitude-Frequency Response
The amplitude-frequency response is measured to ensure that the output signal re-
mains constant across the frequency range being used. With the R&S®ETL, you can
measure the amplitude-frequency response using two different detectors (RMS and
Selective). The selective detector also makes it possible to simultaneously measure
the phase and, due to its narrower bandwidth, it offers advantages for the dynamic
range; nevertheless, it requires a slightly longer measurement period.
5.4.1.1 Audio Frequency Characteristic (up to 15 kHz, or 17.5 kHz for Mono Transmit-
ters)
With the R&S®ETL, the preemphasis can be subtracted directly from the representation
of the audio frequency response, or the preemphasis can be included in the represen-
tation. If the preemphasis is included in the representation, you can employ markers at
certain reference values to check the audio frequency response (see Fig. 26), for
example at a time constant of 50 µs at 15 kHz, an amplitude change of 13.66 dB (see
appendix A.2 for calculation). The R&S®ETL can directly subtract the preemphasis and
plot the variance from the ideal characteristic curve, and it can display the maximum
positive and negative variance in a table (see Fig. 28). This makes it easier to read the
results and ensures that the entire amplitude characteristic is checked, and not just
individual reference points.
Fig. 26: "TV/Radio Analyzer/Receiver" mode, MEAS→Audio Analysis→Frequency Response: Typical
amplitude characteristic for an FM signal with the transmitter's preemphasis turned on and without
deemphasis on the receiver (measured as described below for Method 1 with "Deemphasis" set to
"OFF").

Measurements
Frequency Response - Amplitude-Frequency Response
7BM105_0E Rohde & Schwarz Measurements on FM Transmitters for Acceptance, Commissioning and Maintenance 38
The audio amplitude-frequency response up to 15 kHz can be measured separately
one after the other for input signal L and input signal R. Alternatively, the R&S®ETL can
switch automatically between the channels. For this, "L&R" is selected under "Signal
Path". The results are displayed in a diagram with two traces.
IEC 244-13 specifies that the exciter's preemphasis is to be turned on and that the
input level is to maintained at a constant level during the measurement. The input level
is to be selected so that the frequency deviation up to 15 kHz does not exceed the
peak deviation.
In conjunction with a transmitter that has a nominal deviation of 40 kHz at an input
level of 6 dBu, in order not to exceed a peak deviation of 75 kHz, it is possible to
calculate a maximum audio input level of: log (
) . When preempha-
sis with a time constant of 50 µs is turned on, this value must be reduced by:
log
√ for the audio frequency 15 kHz. That results in a
max. audio input level of –2.1 dBu.
For the max. audio input level for other transmitter configurations and peak deviations,
and for the corresponding calculation, refer to Appendix A.
Besides the measurement with a constant level, the following configuration table also
contains the settings for a measurement with a constant frequency deviation. In the
following section, 500 Hz is used as the reference frequency. In practice, 40 Hz is also
used frequently for this.

Measurements
Frequency Response - Amplitude-Frequency Response
7BM105_0E Rohde & Schwarz Measurements on FM Transmitters for Acceptance, Commissioning and Maintenance 39
Procedure: Audio frequency characteristic
Check to ensure that the max. input power is not exceeded (see Section 4.3)
Connect the R&S®ETL (IN1) to test port M1.
Configure the general settings as described in Section 4.4.
Set the transmitter input to "AF Stereo". On the transmitter, turn on preemphasis.
Method 1: With a constant level
(in line with IEC 244-13)
Method 2: With a constant frequency deviation
MEAS→Audio Analysis→Frequency Response→Frequency Response Setup (see Fig. 27)
Demodulator:
Signal Path: L&R
Deemphasis: Set to match the trans-mitter's preemphasis setting
Deemphasis: Off
Audio Generator: Type: Analog (Option B201) Connector Config: Set to match the transmitter's configuration (see 3.2.3) Output: Alternate L and R continuously: deactivate (see 3.3.2)
Ampl Definition: Level Level: For example, –2.1 dBu (see
Appendix A)
Ampl Definition: Desired DUT Devia-tion
1
Desired DUT Dev: For example, 75 kHz
Preemphasis Comp: Set to match the transmitter's preemphasis setting
Measurement Options: Response Type: Amplitude (selective) Ref Freq: For example, 500 Hz Sweep: Linear Sweep Points: 100
2
Start Freq: 40 Hz Stop Freq: 15 kHz
Adjust the level as described in Section 4.4.
Start the measurement by selecting RUN.
Set MEAS→Audio Analysis→Frequency Response→Diagram Range→Freq Re-sponse Range so that the entire frequency response is clearly visible.
Read the variance for the audio frequency response in the table of results, (see Fig. 28). Use PRINT to generate a printout of the measurement screen as needed.
1 For this it is necessary – as described in the section on the basic settings (Section
4.4) – for the transmitter's target operating parameters to be set correctly under “DUT Parameters“. 2 Increasing the number of sweep points results in a higher resolution but requires a
longer measurement period.

Measurements
Frequency Response - Amplitude-Frequency Response
7BM105_0E Rohde & Schwarz Measurements on FM Transmitters for Acceptance, Commissioning and Maintenance 40
Fig. 27: "TV/Radio Analyzer/Receiver" mode, MEAS→Audio Analysis→Frequency Re-
sponse→Frequency Response Setup: Configuration for measurement of the audio amplitude-
frequency response in line with Method 1.
Fig. 28: "TV/Radio Analyzer/Receiver" mode, MEAS→Audio Analysis→Frequency Response: Meas-
ured audio frequency response in line with Method 2; maximum positive / negative variance from the
ideal amplitude-frequency response in the table.

Measurements
Frequency Response - Amplitude-Frequency Response
7BM105_0E Rohde & Schwarz Measurements on FM Transmitters for Acceptance, Commissioning and Maintenance 41
5.4.1.2 Baseband Frequency Characteristic (up to 100 kHz).
The baseband frequency characteristic, which is also referred to as the MPX ampli-
tude-frequency response, is measured up to 100 kHz. IEC 244-13 specifies that the
exciter's preemphasis is to be turned off and that the input level is to maintained at a
constant level during the measurement.
The R&S®ETL enables you to either enter the constant audio level (“Ampl Definition“ =
“Level“) or enter the corresponding frequency deviation (”Ampl Definition“ = ”Desired
DUT Deviation“).
Procedure: Baseband frequency characteristic
Check to ensure that the max. input power is not exceeded (see Section 4.3).
Connect the R&S®ETL (IN1) to test port M1.
Configure the general settings as described in Section 4.4.
Set the transmitter input to MPX.
MEAS→Audio Analysis→Frequency Response→Frequency Response Setup (see Fig.29):
Demodulator:
Signal Path: MPX
Audio Generator: Type: Analog (Option B201) Connector Config: Configure to match the transmitter (see 3.2.3)
Ampl Definition: Level Level: For example, 6 dBu
Ampl Definition: Desired DUT Devia-tion
1
Desired DUT Dev: For example, 40 kHz
Preemphasis Comp: Off
Measurement Options: Response Type: Amplitude (selective) Ref Freq: 500 Hz Sweep: Linear Sweep Points 100
2
Start Freq: 10 Hz Stop Freq: 100 kHz
Adjust the level as described in Section 4.4.
Start the measurement by selecting RUN.
Set MEAS→Audio Analysis→Frequency Response→Diagram Range→Freq Re-sponse Range so that the entire frequency response is clearly visible.
Read the values for the variances in the results for the baseband frequency response in the table of results (see Fig. 30). Use PRINT to generate a printout of the meas-urement screen as needed.
1 For this it is necessary – as described in the section on the basic settings (Section
4.4) – for the transmitter's target operating parameters to be set correctly under “DUT Parameters“. 2 Increasing the number of sweep points results in a higher resolution but requires a
longer measurement period.

Measurements
Frequency Response - Amplitude-Frequency Response
7BM105_0E Rohde & Schwarz Measurements on FM Transmitters for Acceptance, Commissioning and Maintenance 42
Fig.29: "TV/Radio Analyzer/Receiver" mode, MEAS→Audio Analysis→Frequency Re-
sponse→Frequency Response Setup: Configuration for measurement of the amplitude frequency
response up to 100 kHz.
Fig. 30: "TV/Radio Analyzer/Receiver" mode, MEAS→Audio Analysis→Frequency Response: Meas-
ured frequency response with MPX input signal; maximum positive / negative variance from the ideal
amplitude-frequency response in the table.1
1 There is no need to take action in response to the red "MONO" warning in the status
bar, because that warning only indicates that no pilot has been found.

Measurements
Frequency Response - Phase Response
7BM105_0E Rohde & Schwarz Measurements on FM Transmitters for Acceptance, Commissioning and Maintenance 43
5.4.2 Phase Response
Besides measuring the amplitude-frequency response, the R&S®ETL makes it possible
to measure the phase frequency response as required, for example, by the technical
guidelines "Stereo Encoders for the Pilot-tone System" (TR No. 5/3.2) and "VHF/FM
Radio Broadcasting Transmitters" (TR No. 5/3.1). These specifications require meas-
urement of the phase response in the baseband (see 5.4.2.2).
The phase response of the transmitter's transfer function influences crosstalk in the
stereo channels. In the past, measuring the frequency phase response required a
great deal of effort. For that reason, the decision was frequently made to merely meas-
ure the effects (the crosstalk) instead. Nevertheless, the R&S®ETL makes it easy to
measure the phase response directly, which then makes it possible to analyze what is
causing the crosstalk.
The technical guidelines cited above stipulate that the phase tolerance is to be meas-
ured using a reference frequency of 500 Hz (or 57 kHz for the additional RDS signal).
Nonetheless, at a reference frequency of 500 Hz, the highpass filter at the transmitter
input causes a residual phase shift, even when the cutoff frequency is very low. That,
in turn, leads to a downward tendency in the measured curve (see Fig. 31, left), which
makes it appear that the limits are not being maintained when the frequencies are high.
In such cases, Rohde & Schwarz recommends measuring the phase response with a
higher reference frequency (such as 5 kHz), which leads to a horizontal curve progres-
sion (see Fig. 31, right).
Fig. 31: "TV/Radio Analyzer/Receiver" mode, MEAS→Audio Analysis→Frequency Response: Meas-
ured phase response up to 100 kHz with a reference frequency of 500 Hz (left) or 5 kHz (right).
It is also possible, for instance, to measure the phase in the L and R signals (which is
equivalent to the audio phase response; see 5.4.2.1). The specifications "VHF/FM
Radio Broadcasting Transmitters" (TR No. 5/3.1) and "Stereo Encoders for the Pilot-
tone System" (TR No. 5/3.2) do not required that.

Measurements
Frequency Response - Phase Response
7BM105_0E Rohde & Schwarz Measurements on FM Transmitters for Acceptance, Commissioning and Maintenance 44
5.4.2.1 Audio Phase Response
Procedure: Audio phase response
Check to ensure that the max. input power is not exceeded (see Section 4.3).
Connect the R&S®ETL (IN1) to test port M1.
Configure the general settings as described in Section 4.4.
Set the transmitter input to AF stereo. On the transmitter, turn on preemphasis.
Method 1: With a constant level
Method 2: With a constant frequency deviation
MEAS→Audio Analysis→Frequency Response→Frequency Response Setup:
Demodulator:
Signal Path: L&R
Deemphasis: Set to match the trans-mitter's preemphasis setting
Deemphasis: Off
Audio Generator: Type: Analog (Option B201) Connector Config: Set to match the transmitter (see 3.2.3) Output: Alternate L and R continuously: deactivate (see 3.3.2)
Ampl Definition: Level Level: For example, −2.1 dBu (see
Appendix A)
Ampl Definition: Desired DUT Devia-tion
1
Desired DUT Dev: For example, 40 kHz
Preemphasis Comp: Set to match the transmitter's preemphasis setting
Measurement Options: Response Type: Phase Ref Freq: For example, 5 kHz Sweep: Linear Sweep Points 100
2
Start Freq: 40 Hz Stop Freq: 15 kHz
Adjust the level as described in Section 4.4.
Start the measurement by selecting RUN.
Set MEAS→Audio Analysis→Frequency Response→Diagram Range→Phase Range so that the entire phase response is clearly visible.
In the results table, read the values for any nonconformance in the phase response (see Fig. 32). Use PRINT to generate a printout of the measurement screen as need-ed.
1 For this it is necessary – as described in the section on the basic settings (Section
4.4) – for the transmitter's target operating parameters to be set correctly under ”DUT Parameters“. 2 Increasing the number of sweep points results in a higher resolution but requires a
longer measurement period.

Measurements
Frequency Response - Phase Response
7BM105_0E Rohde & Schwarz Measurements on FM Transmitters for Acceptance, Commissioning and Maintenance 45
Fig. 32: "TV/Radio Analyzer/Receiver" mode, MEAS→Audio Analysis→Frequency Response: Meas-
ured phase response of L&R signal with a reference frequency of 5 kHz; maximum positive / negative
variance from the ideal phase response in the table.

Measurements
Frequency Response - Phase Response
7BM105_0E Rohde & Schwarz Measurements on FM Transmitters for Acceptance, Commissioning and Maintenance 46
5.4.2.2 Baseband Phase Response
Procedure: Baseband phase response
Check to ensure that the max. input power is not exceeded (see Section 4.3).
Connect the R&S®ETL (IN1) to test port M1.
Configure the general settings as described in Section 4.4.
Set the transmitter input to MPX.
MEAS→Audio Analysis→Frequency Response→Frequency Response Setup:
Demodulator:
Signal Path: MPX
Audio Generator: Type: Analog (Option B201) Connector Config: Set to match the transmitter (see 3.2.3)
Ampl Definition: Level Level: For example, 6 dBu (see
Appendix A)
Ampl Definition: Desired DUT Devia-tion
1
Desired DUT Dev: For example, 40 kHz
Preemphasis Comp: Off
Measurement Options: Response Type: Phase Ref Freq: For example, 5 kHz Sweep: Linear Sweep Points 100
2
Start Freq: 10 Hz Stop Freq: 100 kHz
Adjust the level as described in Section 4.4.
Start the measurement by selecting RUN.
Set MEAS→Audio Analysis→Frequency Response→Diagram Range→Phase Range so that the entire phase response is clearly visible.
In the results table, read the values for any nonconformance in the phase response (see Fig. 33). Use PRINT to generate a printout of the measurement screen as need-ed.
1 For this it is necessary – as described in the section on the basic settings (Section
4.4) – for the transmitter's target operating parameters to be set correctly under “DUT Parameters“. 2 Increasing the number of sweep points results in a higher resolution but requires a
longer measurement period.

Measurements
Frequency Response - Phase Response
7BM105_0E Rohde & Schwarz Measurements on FM Transmitters for Acceptance, Commissioning and Maintenance 47
Fig. 33: "TV/Radio Analyzer/Receiver" mode, MEAS→Audio Analysis→Frequency Response: Meas-
ured phase response of the MPX signal up to 100 kHz the 5 kHz reference frequency; maximum
positive / negative variance from the ideal phase response in the table.1
1 There is no need to take action in response to the red "MONO" warning in the status
bar, because that warning only indicates that no pilot has been found.

Measurements
Frequency Response - Balance
7BM105_0E Rohde & Schwarz Measurements on FM Transmitters for Acceptance, Commissioning and Maintenance 48
5.4.3 Balance
The difference in the amplitude-frequency responses for the right and left channels is
referred to as balance. The individual frequency responses are measured with the
RMS detector.
Procedure: Balance
Check to ensure that the max. input power is not exceeded (see Section 4.3).
Connect the R&S®ETL (IN1) to test port M1.
Configure the general settings as described in Section 4.4.
Set the transmitter input to AF stereo.
On the transmitter, turn on preemphasis.
Method 1: With a constant level
Method 2: With a constant frequency deviation
MEAS→Audio Analysis→Frequency Response→Frequency Response Setup, (see Fig. 34)
Demodulator:
Signal Path: L&R
Deemphasis: Set to match the trans-mitter's preemphasis
Deemphasis: Off
Audio Generator: Type: Analog (Option B201) Connector Config: Set to match the transmitter (see 3.2.3) Output: Alternate L and R continuously: deactivate (see 3.3.2)
Ampl Definition: Level Level: For example, −2.1 dBu (see
Appendix A)
Ampl Definition: Desired DUT Devia-tion
1
Desired DUT Dev: For example, 40 kHz
Preemphasis Comp: Set to match the transmitter.
Measurement Options: Response Type: Balance (rms) Sweep: Linear Sweep Points 100
2
Start Freq: 40 Hz Stop Freq: 15 kHz
Adjust the level as described in Section 4.4.
1 For this it is necessary – as described in the section on the basic settings (Section
4.4) – for the transmitter's target operating parameters to be set correctly under “DUT Parameters“. 2 Increasing the number of sweep points results in a higher resolution but requires a
longer measurement period.

Measurements
Frequency Response - Balance
7BM105_0E Rohde & Schwarz Measurements on FM Transmitters for Acceptance, Commissioning and Maintenance 49
Start the measurement by selecting RUN.
Set MEAS→Audio Analysis→Frequency Response→Diagram Range→Freq Re-sponse Range so that the entire frequency response is clearly visible.
In the results table, read the values for any nonconformance in the balance (see Fig. 35). Use PRINT to generate a printout of the measurement screen as needed.
When audio generator type "MPX (Option B201)" or "Analog (1,L 2,R)" is used, it is
possible to measure the balance M&S.

Measurements
Frequency Response - Balance
7BM105_0E Rohde & Schwarz Measurements on FM Transmitters for Acceptance, Commissioning and Maintenance 50
Fig. 34: "TV/Radio Analyzer/Receiver" mode, MEAS→Audio Analysis→Frequency Re-
sponse→Frequency Response Setup: Configuration for measuring the balance.
Fig. 35: "TV/Radio Analyzer/Receiver" mode, MEAS→Audio Analysis→Frequency Response: Meas-
ured balance; maximum positive / negative variance in the table.

Measurements
Stereo Crosstalk
7BM105_0E Rohde & Schwarz Measurements on FM Transmitters for Acceptance, Commissioning and Maintenance 51
5.5 Stereo Crosstalk
The undesired transmission of the L and R signals from each of those two channels
into the other is known as stereo crosstalk. To perform the measurement, the first step
is to feed in an L input signal and measure the frequency deviation in the R signal.
After that, an R signal is fed in, and the frequency deviation is measured in the
L signal.
To measure the stereo crosstalk, the R&S®ETL makes – in line with IEC 244-13 –
three possibilities available, which can be selected for the "Crosstalk Setup" under the
"Crosstalk Type" (see Fig. 36):
Linear:
With linear crosstalk, a ratio is formed out of the RMS value for the modulation sig-
nal at the output of the modulated channel and the RMS value for the fundamental
at the output of the unmodulated channel. This ratio is then indicated in dB.
If, for example, the amplitude of the R signal in the M and S signals does not
match (as the result of linear distortion), the R signal's component is no longer
completely canceled out through formation of L=M+S. In such cases, linear cross-
talk has produced the components contained in the L signal that remain because
of the inequality of the R signal.
Nonlinear:
In the case of nonlinear crosstalk, the system measures harmonics from sum sig-
nal M in the difference signal S (total harmonic distortion) and intermodulation from
the difference signal S in the sum signal M (difference frequency distortion), which
determines the non-linear distortions. In addition, because of the measurement
principle, noise is also measured.
Linear and nonlinear combined:
When the sum is derived from both linear and nonlinear crosstalk, this is also re-
ferred to as crosstalk attenuation or stereophonic channel separation.
In line with IEC 244-13, it makes sense to measure the combined linear and nonlinear
crosstalk or to measure these two components separately as linear crosstalk and
nonlinear crosstalk.
For measuring the crosstalk on the SCA channel, the R&S®ETL offers the possibility of
using an imaginary channel as a reference (Ref Dev).
IEC 244-13 specifies that stereo crosstalk be measured with preemphasis turned on
and with a constant frequency deviation. With conventional measuring equipment,
accomplishing that can require a great deal of effort, because it is necessary to recal-
culate and enter the audio level for each frequency. The R&S®ETL performs that task
for you. To configure the device for that, it is necessary to select the "Desired DUT
Deviation" and activate "Preemphasis Comp" (see Method 1).
Due to the significant effort required for performing a measurement using a constant
frequency deviation, until now, test technicians have often performed the measure-
ments using a constant level instead. Method 2 shows the configuration for doing that.

Measurements
Stereo Crosstalk
7BM105_0E Rohde & Schwarz Measurements on FM Transmitters for Acceptance, Commissioning and Maintenance 52
Procedure: Stereo crosstalk
Check to ensure that the max. input power is not exceeded (see Section 4.3).
Connect the R&S®ETL (IN1) to test port M1.
Configure the general settings as described in Section 4.4.
Set the transmitter input to AF stereo. On the transmitter, turn on preemphasis.
Method 1: With a constant frequency deviation
(in line with IEC 244-13)
Method 2: With a constant level
MEAS→Audio Analysis→Crosstalk→Crosstalk Setup (see Fig. 36):
Demodulator:
Signal Path: L&R
Deemphasis: Off Deemphasis: Set to match the trans-mitter's preemphasis setting
Audio Generator: Type: Analog (Option B201) Connector Config: Set to match the transmitter (see 3.2.3) Output: Alternate L and R continuously: deactivate (see 3.3.2)
Ampl Definition: Desired DUT Devia-tion
1
Desired DUT Dev: For example, 75 kHz
Preemphasis Comp: Set to match the transmitter
Ampl Definition: Level Level: For example, –2.1 dBu (see
Appendix A)
Measurement Options: Crosstalk Type: Linear and Nonlinear combined Reference: R&L Sweep: Linear Sweep Points 100
2
Start Freq: 10 Hz Stop Freq: 15 kHz
Adjust the level as described in Section 4.4.
Start the measurement by selecting RUN.
If necessary, set the MEAS→Audio Analysis→Crosstalk→Diagram Range→Crosstalk Range and Ref Position so that the trace is clearly visible.
In the results table, read the values for stereo crosstalk (see Fig. 37). Use PRINT to generate a printout of the measurement screen as needed.
If you intend to measure the crosstalk from the M channel and S channel, it is neces-
sary to use ports 1/L and 2/R; furthermore, in the "Audio Generator Setup" under
"Type", you must select "Analog (1/L, 2/R)". After that, the "Crosstalk Setup" under
"Signal Path" offers the options M, S or M&S.
1 For this it is necessary – as described in the section on the basic settings (Section
4.4) – for the transmitter's target operating parameters to be set correctly under “DUT Parameters“. 2 Increasing the number of sweep points results in a higher resolution but requires a
longer measurement period.

Measurements
Stereo Crosstalk
7BM105_0E Rohde & Schwarz Measurements on FM Transmitters for Acceptance, Commissioning and Maintenance 53
Fig. 36: "TV/Radio Analyzer/Receiver" mode, MEAS→Audio Analysis→Crosstalk→Crosstalk Setup:
Configuration of the measurement for stereo crosstalk according to Method 1.
Fig. 37: "TV/Radio Analyzer/Receiver" mode, MEAS→Audio Analysis→Crosstalk: Measured stereo
crosstalk; max. value in the table.

Measurements
Nonlinear Distortion - Total Harmonic Distortion (THD)
7BM105_0E Rohde & Schwarz Measurements on FM Transmitters for Acceptance, Commissioning and Maintenance 54
5.6 Nonlinear Distortion
5.6.1 Total Harmonic Distortion (THD)
Total harmonic distortion is a measure of nonlinearity distortion. It indicates the extent
to which the overall signal is made up of undesired harmonics and is specified as a
percentage or in dB. According to IEC 244-13, for this, the RMS values for all harmon-
ics (d2, d3, …) are set in relation to the sum of the RMS value for the fundamental and
the RMS values for all harmonics:
√
√∑
∑
Besides that definition, there is another definition, according to which the RMS values
for all harmonics (d2, d3, …) are set in relation to the RMS value for the fundamental:
√
As is the case with most analyzers, the implementation realized in the R&S®ETL corre-
sponds to Definition 1. In the case of the distortion that arises in practice, both defini-
tions lead to the same results.
The voltages for the harmonics – and thus their influence on the overall harmonic
distortion – decrease as the order increases.
For the measurement of the overall harmonic distortion, the R&S®ETL offers two
measured values, which are displayed on the results screen:
THD: For the sum of the harmonics, the first eight harmonics (d2-d9) are meas-
ured selectively and added together.
THD+N (Total Harmonic Distortion + Noise): For the sum of the harmonics, the
individual harmonics are not measured selectively; instead, the overall RMS
after the suppressed fundamental up to the cut-off frequency (15 kHz) is used
as the sum for the harmonics. This captures all harmonics up to the cut-off fre-
quency. Nevertheless, this measurement also captures all other forms of inter-
ference, such as noise and intermodulation (much as is the case with nonline-
ar stereo crosstalk; see 5.5).

Measurements
Nonlinear Distortion - Total Harmonic Distortion (THD)
7BM105_0E Rohde & Schwarz Measurements on FM Transmitters for Acceptance, Commissioning and Maintenance 55
5.6.1.1 THD – Audio
IEC 244-13 specifies that the harmonic distortion is to be measured with preemphasis
turned on. The input frequency is to be varied between 40 Hz and 7.5 kHz. The fre-
quency deviation is to be kept constant for the different input frequencies. The
R&S®ETL performs the complex level calculations that are required for this because of
the fact that preemphasis is turned on. Using "Desired DUT Deviation" and
"Preemphasis Comp" makes it possible to enter the desired frequency deviation direct-
ly.
Procedure: THD – Audio
Check to ensure that the max. input power is not exceeded (see Section 4.3).
Connect the R&S®ETL (IN1) to test port M1.
Configure the general settings as described in Section 4.4.
Set the transmitter input to AF stereo. On the transmitter, turn on preemphasis.
MEAS→Audio Analysis→THD→THD Setup:
Demodulator:
Signal Path: L&R Deemphasis: Off
Audio Generator: Type: Analog (Option B201) Connector Config: Set to match the transmitter (see 3.2.3) Output: Alternate L and R continuously: deactivate (see 3.2.3) Freq: For example, set to 40 Hz, 500 Hz, 5 kHz and 7.5 kHz one after the
other Ampl Definition: Desired DUT Deviation1 Desired DUT Dev: For example, 40 kHz Preemphasis Comp: Set to match the transmitter's preemphasis setting
Measurement Options: Unit: dB or %2
Adjust the level as described in Section 4.4.
Start the measurement by selecting RUN.
MEAS→Audio Analysis→THD→Diagram Range→Auto Range
In the results table, read the THD values (see Fig. 38). Use PRINT to generate a printout of the measurement screen as needed.
1 For this it is necessary – as described in the section on the basic settings (Section
4.4) – for the transmitter's target operating parameters to be set correctly under ”DUT Parameters“. 2 Depending on how you want to display the results.

Measurements
Nonlinear Distortion - Total Harmonic Distortion (THD)
7BM105_0E Rohde & Schwarz Measurements on FM Transmitters for Acceptance, Commissioning and Maintenance 56
Fig. 38: "TV/Radio Analyzer/Receiver" mode, MEAS→Audio Analysis→THD: Measuring the total
harmonic distortion at 500 Hz.

Measurements
Nonlinear Distortion - Total Harmonic Distortion (THD)
7BM105_0E Rohde & Schwarz Measurements on FM Transmitters for Acceptance, Commissioning and Maintenance 57
5.6.1.2 THD – Baseband
When performed in line with the technical guideline "VHF/FM Radio Broadcasting
Transmitters" (TR No. 5/3.1), the measurement is taken without a stereo encoder or
decoder.
Procedure: THD – baseband
Check to ensure that the max. input power is not exceeded (see Section 4.3).
Connect the R&S®ETL (IN1) to test port M1.
Configure the general settings as described in Section 4.4.
Set the transmitter input to MPX.
MEAS→Audio Analysis→THD→THD Setup:
Demodulator:
Signal Path: MPX
Audio Generator: Type: Analog (Option B201) Connector Config: Set to match the transmitter (see 3.2.3) Freq: Set to the selected frequency
Ampl Definition: Desired DUT Devia-tion
1
Desired DUT Dev: For example, 75 kHz
Preemphasis Comp: Set to match the transmitter
Ampl Definition: Level Level: For example, −2.1 dBu (see
Appendix A)
Measurement Options: Unit: dB or %2
Adjust the level as described in Section 4.4.
Start the measurement by selecting RUN.
MEAS→Audio Analysis→THD→Diagram Range→Auto Range
In the results table, read the THD value. Use PRINT to generate a printout of the measurement screen as needed.
1 For this it is necessary – as described in the section on the basic settings (Section
4.4) – for the transmitter's target operating parameters to be set correctly under “DUT Parameters“. 2 Depending on how you want to display the results.

Measurements
Nonlinear Distortion - Dual Frequency Distortion (DFD)
7BM105_0E Rohde & Schwarz Measurements on FM Transmitters for Acceptance, Commissioning and Maintenance 58
5.6.2 Dual Frequency Distortion (DFD)
Dual frequency distortion is a measure of undesired second and third-order nonlinear
distortion. It is expressed as percentage or as a ratio in dB. This measurement is
based on the technique of using two signals – f1 and f2 – of the same amplitude with a
frequency spacing of 1 kHz. This leads to quadratic distortion (of the second order)
representing the difference frequency distortion (f2 – f1 = 1 kHz) and the sum frequency
distortion (f1 + f2). In addition to second-order products (depending on the measure-
ment specification: d2 = f1 – f2 or d2 = f1 – f2 & f1 + f2) , the third-order intermodulation
products (d3 = 2f2 – f1 & 2f1 – f2) are also important here:
– log ( –
)
( –
)
(
)
5.6.2.1 Audio Intermodulation
IEC 244-13 specifies that the exciter's preemphasis is to be turned on, that the input
frequency is to be varied, and that the signals' input level is to be selected so that the
signal components generate the same deviation. Entering the individual signal levels
for the two-tone signal on the R&S®ETL is not necessary. The signal levels are auto-
matically set so that, together, they result in the desired frequency deviation or level
that was entered and so that each signal component generates the same frequency
deviation.
Unlike IEC 244-13 (Method 1 in the section below) the technical guideline "Stereo
Encoders for the Pilot-tone System" (TR No. 5/3.2) requires that the measurement be
performed with preemphasis or deemphasis (Method 2 in the section below).
It must be ensured that, during measurement of audio intermodulation (signal path:
L&R) the upper cut-off frequency is 15 kHz. Intermodulation influences that arise above
this cut-off frequency are not reflected in the results. The measured intermodulation
products (in dB) refer to the measured frequency deviation of
.

Measurements
Nonlinear Distortion - Dual Frequency Distortion (DFD)
7BM105_0E Rohde & Schwarz Measurements on FM Transmitters for Acceptance, Commissioning and Maintenance 59
Procedure: Audio intermodulation
Check to ensure that the max. input power is not exceeded (see 4.3).
Connect the R&S®ETL (IN1) to test port M1.
Configure the general settings as described in Section 4.4.
Method 1: Preemphasis turned on (in line with IEC 244-13)
Method 2: Preemphasis turned of (in line with TR 5/3.2)
Set the transmitter input to AF stereo.
On the transmitter, turn on preemphasis. On the transmitter, turn off preemphasis.
MEAS→Audio Analysis→DFD→DFD Setup:
Demodulator:
Signal Path: L&R Deemphasis: Off
Audio Generator: Type: Analog (Option B201) Connector Config: Set to match the transmitter (see 3.2.3) Waveform: Dual Tone, constant spacing Upper Freq: For example, 6 kHz Freq Spacing 1 kHz Ampl Definition: Desired DUT Deviation
1
Desired DUT Dev: For example, 40 kHz
Preemphasis Comp: Set to match the transmitter's preemphasis
Preemphasis Comp: Off
Measurement Options: Unit: dB or %
Adjust the level as described in Section 4.4.
Start the measurement by selecting RUN.
In the table of results, read the values for the intermodulation products (d2 and d3; see Fig. 39). Use PRINT to generate a printout of the measurement screen as needed.
1 For this it is necessary – as described in the section on the basic settings (Section
4.4) – for the transmitter's target operating parameters to be set correctly under “DUT Parameters“.

Measurements
Nonlinear Distortion - Dual Frequency Distortion (DFD)
7BM105_0E Rohde & Schwarz Measurements on FM Transmitters for Acceptance, Commissioning and Maintenance 60
Fig. 39: "TV/Radio Analyzer/Receiver" mode, MEAS→Audio Analysis→DFD: Measurement of dual-
frequency distortion (DFD) with the upper frequency (f2) 6 kHz.
5.6.2.2 Intermodulation in the Baseband (up to 100 kHz)
IEC 244-13 specifies that the exciter's preemphasis is to be turned off, that the input
frequencies are to be varied, and that the signals' input levels are to be selected so
that the signal components have the same amplitude. It is not necessary to enter the
individual signal levels for the two-tone signal on the R&S®ETL. The signal levels are
automatically set so that, together, they result in the desired frequency deviation or
level that was entered and so that each signal component generates the same fre-
quency deviation. The frequency deviation for the different input frequencies is to be
kept constant. The R&S®ETL enables you to either enter the audio level or enter the
corresponding frequency deviation. Both configurations lead to the same result.
The technical guideline "VHF/FM Radio Broadcasting Transmitters" (TR No. 5/3.1)
specifies that the measurement is to be taken in the frequency range from 15 kHz to
76 kHz.
It must be ensured that, during measurement of intermodulation in the baseband
("Signal Path: MPX") the upper cut-off frequency is 100 kHz. Intermodulation products
that arise above this cut-off frequency are not reflected in the results. The measured
intermodulation products (in dB) refer to the measured frequency deviation of
.

Measurements
Nonlinear Distortion - Dual Frequency Distortion (DFD)
7BM105_0E Rohde & Schwarz Measurements on FM Transmitters for Acceptance, Commissioning and Maintenance 61
Procedure: Intermodulation in the baseband
Check to ensure that the max. input power is not exceeded (see Section 4.3).
Connect the R&S®ETL (IN1) to test port M1.
Configure the general settings as described in Section 4.4.
Set the transmitter input to MPX.
MEAS→Audio Analysis→DFD→DFD Setup:
Demodulator:
Signal Path: MPX Deemphasis: Off
Audio Generator: Type: Analog (Option B201) Connector Config: Set to match the transmitter (see 3.2.3) Waveform: Dual Tone, constant spacing Upper Freq: For example, 16 kHz, 26 kHz, 41 kHz, 51 kHz, 76 kHz Freq Spacing 1 kHz
Ampl Definition: Level Level: For example, 6 dBu
Ampl Definition: Desired DUT Devia-tion
1
Desired DUT Dev: For example, 40 kHz
Preemphasis Comp: Off
Measurement Options: Unit: dB or %
Adjust the level as described in Section 4.4.
Start the measurement by selecting RUN.
In the table of results, read the values for the intermodulation products (d2 and d3; see Fig. 40). Use PRINT to generate a printout of the measurement screen as needed.
1 For this it is necessary – as described in the section on the basic settings (Section
4.4) – for the transmitter's target operating parameters to be set correctly under “DUT Parameters“.

Measurements
Nonlinear Distortion - Dual Frequency Distortion (DFD)
7BM105_0E Rohde & Schwarz Measurements on FM Transmitters for Acceptance, Commissioning and Maintenance 62
Fig. 40: "TV/Radio Analyzer/Receiver" mode, MEAS→Audio Analysis→DFD: Measurement of dual-
frequency distortion (DFD) with the upper frequency (f2) of 16 kHz.1
1 There is no need to take action in response to the red "MONO" warning in the status
bar, because that warning only indicates that no pilot has been found.

Measurements
Nonlinear Distortion - Dual Frequency Distortion (DFD)
7BM105_0E Rohde & Schwarz Measurements on FM Transmitters for Acceptance, Commissioning and Maintenance 63
5.6.2.3 Intermodulation at 57 kHz
In the technical guidelines "VHF/FM Radio Broadcast Transmitters" (TR No. 5/3.1) and
"VHF/FM Rebroadcast Receivers" (TR No. 5/3.5), the measurement of the intermodu-
lation is performed using these input frequency pairs: 6.2 kHz and 31.6 kHz as well as
9.3 kHz and 47.7 kHz. Here, the intermodulation products at 57 kHz are to be ana-
lyzed:
f1 = 6.2 kHz, f2 = 31.6 kHz: d3 = 2·f2 – f1 = 57 kHz
f1 = 9.3 kHz, f2 = 47.7 kHz: d2 = f1 + f2 = 57 kHz
In each case, the guidelines require a frequency deviation of ±22.5 kHz or ±10 kHz,
respectively. Since the overall frequency deviation is entered on the R&S®ETL, the
value entered here must be 45 kHz or 20 kHz. TR 5/3.1 stipulates that the intermodula-
tion products be referenced to a calculated frequency deviation of 40 kHz. Since the
reference to a calculated frequency deviation is a special case, the intermodulation
products are not measured using the R&S®ETL's DFD function (which references the
intermodulation products to the measured frequency deviation); instead, they are
measured in the audio spectrum.
Procedure: Intermodulation at 57 kHz
Check to ensure that the max. input power is not exceeded (see Section 4.3).
Connect the R&S®ETL (IN1) to test port M1.
Configure the general settings as described in Section 4.4.
Set the transmitter input to MPX.
MEAS→Modulation Analysis→Audio Spectrum→Audio Spectrum Setup:
Signal Path: MPX
MEAS→Modulation Analysis→Audio Spectrum→Audio Generator→ Audio Generator Setup
Type: Analog (Option B201) Signal: AF Connector Config: Set to match the transmitter (see 3.2.3) Waveform: Dual Tone, independent frequencies Freq 1: 6.2 kHz or 9.3 kHz
Freq 2: 31.6 kHz or 47.7 kHz Ampl Definition: Desired DUT Deviation
1
Desired DUT Dev: For example, 20 kHz or 45 kHz Preemphasis Comp: Off
Adjust the level as described in Section 4.4.
MKR→Marker 1: 57 kHz
TRACE→Trace Mode: Average
MEAS→Modulation Analysis→Audio Spectrum→Diagram Range→Ref Deviation: 40 kHz
Read the measured marker value (see Fig. 41). Use PRINT to generate a printout of the measurement screen as needed.
1 For this it is necessary – as described in the section on the basic settings (Section
4.4) – for the transmitter's target operating parameters to be set correctly under “DUT Parameters“.

Measurements
Nonlinear Distortion - Dual Frequency Distortion (DFD)
7BM105_0E Rohde & Schwarz Measurements on FM Transmitters for Acceptance, Commissioning and Maintenance 64
Fig. 41: "TV/Radio Analyzer/Receiver" mode, MEAS→Modulation Analysis→Audio Spectrum: Meas-
urement of intermodulation products at 57 kHz using the marker function (top right).1
1 There is no need to take action in response to the red "MONO" warning in the status
bar, because that warning only indicates that no pilot has been found.

Measurements
Spurious Modulation (Signal-to-Noise Ratio, S/N) - Spurious Frequency Modulation
7BM105_0E Rohde & Schwarz Measurements on FM Transmitters for Acceptance, Commissioning and Maintenance 65
5.7 Spurious Modulation (Signal-to-Noise Ratio, S/N)
For the signal-to-noise ratio, a differentiation is made between the spurious frequency
modulation and spurious amplitude modulation. The higher the S/N value is, the higher
the signal quality. The signal-to-noise ratio is defined as the ratio of the audio signal
(wanted signal) to noise, and it is expressed in dB:
𝑆
5.7.1 Spurious Frequency Modulation
5.7.1.1 Unweighted and Weighted Noise Voltage
IEC 244-13 specifies that the unweighted and the weighted noise voltage be measured
using a QPK detector. In the weighted measurement of the noise voltage, the ITU-R
BS.468-4-compliant filter is also used. This filter accounts for the effects that noise has
on the human ear and provides the best possible representation of these requirements
from a T&M perspective.
Besides the QPK detector, which also takes the effects on the human ear into account,
the R&S®ETL also makes it possible to perform the measurement with an RMS detec-
tor. The test specifications stipulate which detector is to be used for measurement.
The test specification stipulates which frequency deviation is to be used to generate
the signal when measuring the signal-to-noise ratio. That means that the signal ampli-tude ( ) is predefined and does not have to be measured separately; measure-
ment of the incidental deviation ( ) is sufficient. Measuring the signal amplitude
would cause the results to be overdetermined.
With the R&S
®ETL, is calculated using the data entered in the "DUT Parame-
ters" (see 3.1.5) and the reference deviation (frequency deviation from the test specifi-
cation). When entering the "Deviation" under "DUT Parameters", it is important to
ensure that the peak deviation is always entered on the R&S®ETL. Prior verification of
the transmitter's modulator constant (see 5.3) ensures that a measurement of
leads to the same value as to the one that was determined through calculations.
If the FM noise voltage is measured with the R&S®ETL for channels L and R in combi-
nation ("Signal Path: L&R"), the user must select whether the measurement will be
weighted or unweighted ("Weighting Filter ITU-R BS.468-4"). If the channels are
measured sequentially ("Signal Path: L " or "Signal Path: R") both values are always
shown.

Measurements
Spurious Modulation (Signal-to-Noise Ratio, S/N) - Spurious Frequency Modulation
7BM105_0E Rohde & Schwarz Measurements on FM Transmitters for Acceptance, Commissioning and Maintenance 66
The section below provides an example of the settings for measuring the left channel.
Procedure: Unweighted and weighted noise voltage
Check to ensure that the max. input power is not exceeded (see Section 4.3).
Connect the R&S®ETL (IN1) to test port M1.
Configure the general settings as described in Section 4.4.
Set the transmitter input to AF stereo. On the transmitter, turn on preemphasis .
MEAS→Audio Analysis→ S/N→S/N Setup (see Fig. 42).
Demodulator:
Signal Path: L Deemphasis: Set to match the transmitter's preemphasis setting
Audio Generator: Signal: Off No configuration of the signal (such as "Waveform", "Ampl Definition") is
necessary, because the signal is not measured
Measurement Options: Ref Deviation: Frequency deviation of the reference audio signal, for ex-
ample: 40 kHz
MEAS→Audio Analysis→S/N: Read the measured values (see Fig. 43).
Fig. 42: “TV/Radio Analyzer/Receiver" mode, MEAS→Audio Analysis→S/N→S/N Setup: Configuration
for measuring the spurious frequency modulation.

Measurements
Spurious Modulation (Signal-to-Noise Ratio, S/N) - Spurious Frequency Modulation
7BM105_0E Rohde & Schwarz Measurements on FM Transmitters for Acceptance, Commissioning and Maintenance 67
Fig. 43: "TV/Radio Analyzer/Receiver" mode, MEAS→Audio Analysis→S/N: Unweighted and weighted
signal-to-noise ratio for the L channel in the 2nd/3rd line.

Measurements
Spurious Modulation (Signal-to-Noise Ratio, S/N) - Spurious Frequency Modulation
7BM105_0E Rohde & Schwarz Measurements on FM Transmitters for Acceptance, Commissioning and Maintenance 68
5.7.1.2 Periodic Noise Voltage
Periodic noise includes all discrete, unwanted interference frequencies within the audio
frequency band. It is the ratio, expressed in dB, between an unwanted component and
a reference level or reference deviation.
Besides offering capabilities for using markers to perform manual investigations within
the spectrum, the R&S®ETL also supports the automatic generation of a list of all
peaks. Here, it is also possible to configure the device for certain additional conditions
(such as frequency above 150 Hz or Peak > –80 dB). The user can sort the list accord-
ing to frequency or level.
Procedure: Periodic noise
Check to ensure that the max. input power is not exceeded (see Section 4.3).
Connect the R&S®ETL (IN1) to test port M1.
Configure the general settings as described in Section 4.4.
Set the transmitter input to MPX.
MEAS→Modulation Analysis→Audio Spectrum→Audio Spectrum Setup:
Signal Path: MPX
MEAS→Modulation Analysis→Audio Spectrum→Audio Generator→Audio Generator Setup:
Signal: Off No configuration of the signal (such as "Waveform", "Ampl Definition") is
necessary, because the signal is not measured
MEAS→Modulation Analysis→Audio Spectrum→Audio BW: 20 Hz
MEAS→Modulation Analysis→Audio Spectrum→Diagram Range→Ref Deviation: For example, 40 kHz
Set MEAS→Modulation Analysis→Audio Spectrum→Diagram Range→Ref Position: so that the signal is clearly visible (for instance, 130 %).
TRACE→Trace Mode→Average
MKR→More→Marker Peak List
MKR→More→Marker Peak List→Left Limit: For example, 150 Hz
MKR→More→Marker Peak List→Threshold: For example, 80 Hz
MKR→More→Marker Peak List
Read the measured peak value (see Fig. 44). Use PRINT to generate a printout of the measurement screen (see Fig. 45.) as needed.

Measurements
Spurious Modulation (Signal-to-Noise Ratio, S/N) - Spurious Frequency Modulation
7BM105_0E Rohde & Schwarz Measurements on FM Transmitters for Acceptance, Commissioning and Maintenance 69
Fig. 44: "TV/Radio Analyzer/Receiver" mode, MEAS→Modulation Analysis→Audio Spectrum: List of
the periodic noise voltages (Peak List: MKR→More→Marker Peak List) greater than −105 dB (right).
Fig. 45: "TV/Radio Analyzer/Receiver" mode, MEAS→Modulation Analysis→Audio Spectrum: Period-
ic noise voltage in the spectrum with a limit greater than –105 dB.1
1 There is no need to take action in response to the red "MONO" warning in the status
bar, because that warning only indicates that no pilot has been found.

Measurements
Spurious Modulation (Signal-to-Noise Ratio, S/N) - Spurious Amplitude Modulation
7BM105_0E Rohde & Schwarz Measurements on FM Transmitters for Acceptance, Commissioning and Maintenance 70
5.7.2 Spurious Amplitude Modulation
The configuration for measuring the spurious amplitude modulation depends on the
specific test specification. IEC 244-13 specifies that the measurement be performed
with a PK detector and without a band limitation. Measurements performed in line with
ETSI EN 302 018-1 are also made with a PK detector, but with the band limited to
20 kHz. Measurements performed in line with TR 5/3.1 are taken with and without a
ITU-R 468 wtd-compliant weighting filter with a QPK detector and with the band limited
to 20 kHz. The R&S®ETL supports all four of these configurations.
The spurious amplitude modulation measurement ist taken without FM modulation.
Here, a modulation depth ("Mod Depth") of 100 % is assumed as the reference.
5.7.2.1 Spurious Amplitude Modulation without Input Signal
For the spurious amplitude modulation, the peak voltage at the output of a linear enve-
lope detector is measured without a modulation signal. The result is expressed as a
percentage of the envelope detector output's direct current component.
Procedure: Spurious amplitude modulation without input signal
Check to ensure that the max. input power is not exceeded (see Section 4.3).
Connect the R&S®ETL (IN1) to test port M1.
Configure the general settings as described in Section 4.4.
Set the transmitter input to MPX.
MEAS→Audio Analysis→ S/N→S/N Setup:
Demodulator:
Signal Path: AM Deemphasis: Off
Audio Generator: Signal: Off No configuration of the signal (such as "Waveform" or "Ampl Definition")
is necessary, since the signal is turned off
Measurement Options: Ref Mod Depth: Permanently set to 100 %.
MEAS→Audio Analysis→S/N: Read the measured values (see Fig. 46).

Measurements
Spurious Modulation (Signal-to-Noise Ratio, S/N) - Spurious Amplitude Modulation
7BM105_0E Rohde & Schwarz Measurements on FM Transmitters for Acceptance, Commissioning and Maintenance 71
Fig. 46: "TV/Radio Analyzer/Receiver" mode, MEAS→Audio Analysis→S/N: Spurious amplitude
modulation as required by IEC 244-13 in line 1, by ETSI EN 302 018-1 in line 2 and by TR 5/3.1 (with
and without filter) in line 3/4. 1
1 There is no need to take action in response to the red "MONO" warning in the status
bar, because that warning only indicates that no pilot has been found.

Measurements
Spurious Modulation (Signal-to-Noise Ratio, S/N) - Spurious Amplitude Modulation
7BM105_0E Rohde & Schwarz Measurements on FM Transmitters for Acceptance, Commissioning and Maintenance 72
5.7.2.2 Synchronous Amplitude Modulation
The synchronous amplitude modulation is measured with FM modulation. It is a meas-
ure for the FM-AM conversion using, for example, the RF frequency response in the
transmitter.
Procedure: Synchronous amplitude modulation
Check to ensure that the max. input power is not exceeded (see Section 4.3).
Connect the R&S®ETL (IN1) to test port M1.
Configure the general settings as described in Section 4.4.
Set the transmitter input to MPX.
MEAS→Audio Analysis→ S/N→S/N Setup:
Demodulator:
Signal Path: AM Deemphasis: Off
Audio Generator: Type: Analog (Option B201) Signal: AF Connector Config: Set to match the transmitter (see 3.2.3) Freq: For example, 500 Hz
Ampl Definition: Desired DUT Deviation
1
Desired DUT Dev: For example, 40 kHz
Preemphasis Comp: Off
Ampl Definition: Level Level: For example, 6 dBu (see Ap-
pendix A)
Measurement Options: Ref Mod Depth: Permanently set to 100 %.
MEAS→Audio Analysis→S/N: Read the measured values.
1 For this it is necessary – as described in the section on the basic settings (Section
4.4) – for the transmitter's target operating parameters to be set correctly under ”DUT Parameters“.

Measurements
Spurious Modulation (Signal-to-Noise Ratio, S/N) - Noise Power Density at 57 kHz
7BM105_0E Rohde & Schwarz Measurements on FM Transmitters for Acceptance, Commissioning and Maintenance 73
5.7.3 Noise Power Density at 57 kHz
The technical guideline "VHF/FM Radio Broadcasting Transmitters" (TR No. 5/3.1)
demands that the noise power density measured at the output of a measurement
modulator that has been realized in line with TR 5/3.4 and is terminated with 600 Ω is
not greater than –100
at 57 kHz. This measurement ensures that the signal-to-
noise ratio in the RDS channel is sufficient.
Due to the load impedance of 600 Ω, the noise power results in a voltage. Depending
on that voltage and on the modulation constant, a certain deviation arises. Thus, the
measured quantity that actually exists in physical form at the transmitter output is not
the noise power density, but rather the "noise deviation density." TR 5/3.1, therefore,
describes an indirect measurement of the "noise deviation density" as the noise power
density at the output of a special test configuration (a demodulator constant of 6 dBu
for 40 kHz deviation, load impedance of 600 Ohm). Since this test configuration has
not been standardized internationally, the measurement results achieved in this way
are not valid everywhere.
For this reason, the R&S
®ETL employs a different approach. Without any detours, the
"noise deviation density" is set in direct relation to a reference deviation (the audio spectrum analyzer's reference deviation). This result offers the advantage of general validity and is independent of a specific test setup.
The difference between these two methods lies in the dimension of the output quantity. As defined by TR 5/3.1, the noise power density describes the quotient of the noise
power and bandwidth, referenced to 1 mW (dB
, reduced to
). The "noise
deviation density" for the R&S®ETL, on the other hand, describes the quotient of the
RMS noise deviation and the square of the bandwidth1, set in relation to the reference
deviation (dB (
√ ), reduced to
√ ). These two quantities can be converted
back and forth:
log (
)
log (
√
) log
√ )
Where
In practice, it is possible to avoid the conversion by simply setting the appropriate
reference deviation on the R&S®ETL. The displayed deviation density in
√ (refer-
enced to the reference deviation) corresponds to the noise power density in
, when
the reference deviation is selected so that 0 dBm would arise on the required resistor.
Therefore, at a reference deviation of 40 kHz – which causes 6 dBu to be present at a
600 Ohm resistor (as required by TR 5/3.1) – it would be necessary to enter 20 kHz
(which corresponds to 0 dBm at 600 Ohm) as the reference deviation.
1 For the square of the bandwidth, the physically correct unit √ can be derived by
converting the power density to the "voltage density":
[
√ ] √ [
] [ ] or with SI units: [
√ ] √ [
] [
]

Measurements
Spurious Modulation (Signal-to-Noise Ratio, S/N) - Noise Power Density at 57 kHz
7BM105_0E Rohde & Schwarz Measurements on FM Transmitters for Acceptance, Commissioning and Maintenance 74
The numerical value of the displayed "noise deviation density" then corresponds to the noise power density as defined by TR 5/3.1.
Procedure: Noise power density at 57 kHz
Check to ensure that the max. input power is not exceeded (see Section 4.3).
Connect the R&S®ETL (IN1) to test port M1.
Configure the general settings as described in Section 4.4.
Set the transmitter input to MPX.
MEAS→Modulation Analysis→Audio Spectrum→Audio Generator→ Audio Generator Setup:
Audio Generator: Signal: OFF No configuration of the signal (such as "Waveform" or "Ampl Definition")
is necessary, because the signal is turned off
MEAS→Modulation Analysis→Audio Spectrum→Audio Spectrum Setup: Signal Path: MPX
MEAS→Modulation Analysis→Audio Spectrum→Diagram Range→Ref Deviation: For example, 20 kHz
MEAS→Modulation Analysis→Audio Spectrum→MKR→More→Noise Meas: On
MKR→Marker 1: 57 kHz
TRACE→Trace Mode→Average
MEAS→Audio Analysis→S/N: Read the measured values (see Fig. 46).
Read the marker value (see Fig. 47). Use PRINT to generate a printout of the meas-urement screen as needed.

Measurements
Spurious Modulation (Signal-to-Noise Ratio, S/N) - Noise Power Density at 57 kHz
7BM105_0E Rohde & Schwarz Measurements on FM Transmitters for Acceptance, Commissioning and Maintenance 75
Fig. 47: "TV/Radio Analyzer/Receiver" mode, MEAS→Modulation Analysis→Audio Spectrum: Noise
power density at 57 kHz.1
1 There is no need to take action in response to the red "MONO" warning in the status
bar, because that warning only indicates that no pilot has been found.

Measurements
Polarity of the Input
7BM105_0E Rohde & Schwarz Measurements on FM Transmitters for Acceptance, Commissioning and Maintenance 76
5.8 Polarity of the Input
This measurement is used to check to see if driving the system with a positive instan-
taneous value for the input signal causes a frequency increase in the output frequency.
It is easy to check this with the R&S®ETL by feeding in two audio tones, whereby the
following must be valid: f2 = 2·f1. Since the phases of these signals are generated in
sync, a superposition occurs in which the absolute value of the positive peak values is
greater than the absolute value of the negative peak values (see Fig. 48).
Fig. 48: Superposition of the signals generated with a synchronous phase leads to a signal for which
the absolute value of the positive peak is larger than that of the negative peak.

Measurements
Polarity of the Input
7BM105_0E Rohde & Schwarz Measurements on FM Transmitters for Acceptance, Commissioning and Maintenance 77
The section below specifies the settings for testing the left channel. The right channel
can be verified in the same way. When the polarity is only reversed for only one of the
channels, the M and S signals are switched, and mono receivers will remain "mute." L
and R must be tested separately; otherwise, it would not be possible to establish the
fact that the polarity has been reversed for both inputs.
Procedure: Polarity of the input
Check to ensure that the max. input power is not exceeded (see Section 4.3).
Connect the R&S®ETL (IN1) to test port M1.
Configure the general settings as described in Section 4.4.
Set the transmitter input to AF stereo. On the transmitter, turn off preemphasis.
MEAS→Modulation Analysis→Audio Scope→Audio Generator→ Audio Generator Setup (see Fig. 49):
Audio Generator: Type: Analog (Option B201) Signal: L Connector Config: Set to match the transmitter (see 3.2.3) Waveform: Dual Tone, independent frequencies Freq 1: For example, 500 Hz Freq 2: For example, 1 kHz
Ampl Definition: Level Level: For example, 6 dBu (see
Appendix A)
Ampl Definition: Desired DUT Devia-tion
1
Desired DUT Dev: For example, 40 kHz
Preemphasis Comp: Off
MEAS→Modulation Analysis→Audio Scope→Audio Scope Setup: Signal Path: L
Adjust the level as described in Section 4.4.
MEAS→Modulation Analysis→Audio Scope→Diagram Range→Trigger Level: Set this parameter to a value that results in a steady image; for example, 30 Hz.
Check to see if the absolute values of the positive peak value is greater than the absolute value of the negative peak values (see Fig. 50); if it is greater, the polarity is not reversed.
1 For this it is necessary – as described in the section on the basic settings (Section
4.4) – for the transmitter's target operating parameters to be set correctly under “DUT Parameters”.

Measurements
Polarity of the Input
7BM105_0E Rohde & Schwarz Measurements on FM Transmitters for Acceptance, Commissioning and Maintenance 78
Fig. 49: "TV/Radio Analyzer/Receiver" mode, MEAS→Modulation Analysis→Audio Scope→Audio
Generator→Audio Generator Setup: Configuration for checking the polarity.
Fig. 50: "TV/Radio Analyzer/Receiver" mode, MEAS→Modulation Analysis→Audio Scope: When a
dual tone is being fed in with f2 = 2·f1, the absolute value of the positive peak value (+Peak) is greater
than the absolute value of the negative peak value (–Peak), if a positive instantaneous value for the
input signal causes a frequency increase.

Measurements
Digital Input Signal (AES/EBU)
7BM105_0E Rohde & Schwarz Measurements on FM Transmitters for Acceptance, Commissioning and Maintenance 79
5.9 Digital Input Signal (AES/EBU)
Most transmitters also make an AES/EBU input available that can be used to feed
digital audio signals (stereo or mono) into the transmitter. To test the AES/EBU input, it
is possible to repeat the measurements that were made for the L&R inputs – such as
the measurements for the amplitude-frequency response (5.4.1.1) and stereo crosstalk
(5.5), for instance. The question of which measurements should be performed again
needs to be decided on an individual basis depending on the specific circumstances.
This section will not repeat the details for configuring the individual measurements.
Instead, it will only described the differences and special considerations.
To perform the measurements, the transmitter input is set to "AES Stereo", and the
R&S®ETL's AES encoder is used. To use the R&S
®ETL's AES encoder, the user
selects the "AES/EBU (Option B201)" as the "Audio Generator Type". To match the
transmitter's AES input, the "Impedance" is set to 75 Ω or 110 Ω (see Fig. 51). The
signal level for AES/EBU is expressed in dBFS. As an alternative, it is possible to enter
the desired frequency deviation by selecting "Desired DUT Deviation" under "Type". To
test the AES/EBU input, these adapted settings can be used to repeat all of the meas-
urements that have been described up until this point.
Fig. 51: "TV/Radio Analyzer/Receiver" mode, MEAS→Audio Analysis→Frequency Re-
sponse→Frequency Response Setup: Configuration for measuring the audio amplitude-frequency
response for the transmitter's AES/EBU input.

Measurements
Digital Input Signal (AES/EBU)
7BM105_0E Rohde & Schwarz Measurements on FM Transmitters for Acceptance, Commissioning and Maintenance 80
During the phase measurement, observations could reveal that the characteristic is
marked by triangular outliers (see Fig. 52). This is due to the fact that the instantane-
ous variance in the regeneration of the timing frequency for some AES encoders is too
great; as a result, the phase "runs off" during the measurement and has to be correct-
ed frequently.
Fig. 52: "TV/Radio Analyzer/Receiver" mode, MEAS→Audio Analysis→Frequency Response: Audio
phase frequency for the transmitter's AES/EBU input.

Abbreviations
7BM105_0E Rohde & Schwarz Measurements on FM Transmitters for Acceptance, Commissioning and Maintenance 81
6 Abbreviations
AES/EBU Audio Engineering Society/European Broadcasting Union
AF Audio frequency
AM Amplitude modulation
ARI Autofahrer-Rundfunk-Information (German wireless information service for car drivers)
CCIR Comité Consultatif International des Radiocommunications
DARC Data Radio Channel
FFT Fast Fourier transform
FM Frequency modulation
IRT Institut für Rundfunktechnik
IEC International Electrotechnical Commission
PK Peak
QPK Quasi-Peak
RDS Radio Data System
RMS Root mean square
SCA Subsidary Communication Authorization
TR Technical guidelines for Germany's public broadcasters (Technische Richtlinien der öffentlich-
rechtlichen Rundfunkanstalten in der Bundesrepublik Deutschland)
7 Auxiliary Information Our application notes are regularly revised and updated. Check for any changes at
http://www.rohde-schwarz.com.
Please send any comments or suggestions about this application note to

Ordering Information
7BM105_0E Rohde & Schwarz Measurements on FM Transmitters for Acceptance, Commissioning and Maintenance 82
8 Ordering Information
Designation Type Order No..
Instrument
TV Analyzer, 500 kHz to 3 GHz, with tracking generator R&S®ETL 2112.0004.13
Average Power Sensor; 9 kHz to 6 GHz, 200 mW1 R&S
®NRP-Z91 1168.8004.02
Required options
FM (radio) Firmware R&S®ETL-K110 2112.0410.02
FM (radio) Audio Analyzer/Generator R&S®ETL-K111 2112.0427.02
DTV, ATV, FM Universal Interface R&S®ETL-B201 (MOD3) 2112.0304.03
RF Preselector R&S®ETL-B203 2112.0327.03
One of the following two FM frontends:
High SNR FM frontend R&S®ETL-B110 2112.0233.02
FPGA External Board, High SNR FM R&S®ETL-B310 2112.0340.02
Power Sensor Support with NRP1 R&S
®FSL-K9 1301.9530.02
One of the following three power sensor interfaces1
Additional interfaces R&S®FSL-B5 1300.6108.02
Active USB Adapter R&S®NRP-Z3 1146.7005.02
Passive USB Adapter R&S®NRP-Z4 1146.8001.02
1 Only for measuring the transmitter output level when an accuracy better than 1 dB is
required.

Input Level and Frequency Deviation
Overview in Tables
7BM105_0E Rohde & Schwarz Measurements on FM Transmitters for Acceptance, Commissioning and Maintenance 83
A Input Level and Frequency Deviation
A.1 Overview in Tables
The following tables show the audio level that must be entered in order to generate a
desired frequency deviation at 15 kHz. The transmitter configurations used here (nom-
inal level of 6 dBu and nominal deviation of 40 kHz or 50 kHz) cover the most com-
monly used FM transmitter configurations. If other configurations are required, they can
be calculated easily using the corresponding formulas (see A.2).
Nominal deviation of 40 kHz, nominal level of 6 dBu
Desir
ed
dev
ia-
tio
n [
kH
z]
at
15 k
Hz
Audio level without preemphasis
Audio level Preemphasis 50 µs
Audio level Preemphasis 75 µs
[dBu] [V] [dBu] [V] [dBu] [V]
20 0 0.77 –13.6 0.16 –17 0.11
25 1.9 0.97 –11.7 0.20 –15.1 0.14
40 6 1.55 –7.6 0.32 –11 0.22
50 7.9 1.93 –5.7 0.40 –9.1 0.27
75 11.5 2.90 –2.1 0.60 –5.5 0.41
100 14 3.86 0.4 0.80 –3 0.54
Nominal deviation of 50 kHz, nominal level of 6 dBu
Desir
ed
dev
ia-
tio
n [
kH
z]
at
15 k
Hz
Audio level without preemphasis
Audio level Preemphasis 50 µs
Audio level Preemphasis 75 µs
[dBu] [V] [dBu] [V] [dBu] [V]
20 –2 0.62 –15.6 0.13 –19 0.09
25 0 0.77 –13.6 0.16 –17 0.11
40 4.1 1.24 –9.5 0.26 –12.9 0.17
50 6 1.55 –7.6 0.32 –11 0.22
75 9.5 2.32 –4.1 0.48 –7.5 0.32
100 12 3.09 –1.6 0.64 –5 0.43

Input Level and Frequency Deviation
Mathematical Correlation Between the Input Level and the Frequency Response
7BM105_0E Rohde & Schwarz Measurements on FM Transmitters for Acceptance, Commissioning and Maintenance 84
A.2 Mathematical Correlation Between the Input Level
and the Frequency Response
Depending on the country and on the applicable specifications, the input level is either
expressed in dBu or in volts. As a "pseudo" unit of measurement, dBu is a logarithmic
measure of voltage ( √ ). The conversion from
volts to dBu and back is calculated as follows:
[ ] √ [ ]
– [ ] log [ ]
–
Setting the transmitter's modulator constant results in the corresponding nominal
deviation for a given nominal level. The nominal deviation also varies in different coun-
tries and specifications. For the calculation to determine which input level has to be set
in the audio generator for a desired deviation, the following relationship applies:
[ ]
[ ]
[ ] log (
) [ ]
For the preemphasis, 50 µs is usually used as the time constant in Europe and Japan,
and 75 µs is used in the US. When preemphasis is turned on in the transmitter, a
frequency-dependent increase arises in the audio level. When entering the value on
the audio generator, it is necessary to compensate for this with a corresponding reduc-
tion.
√
[ ]
√
Increase in the audio level for a time constant of 50 µs:
Audio frequency
40 Hz
100 Hz
500 Hz
1 kHz
5 kHz
6 kHz
7.5 kHz
10 kHz
15 kHz
Factor for the in-crease
1.00 1.00 1.01 1.05 1.86 2.13 2.56 3.30 4.82
Increase in dB
0 0 0.1 0.4 5.4 6.5 8.1 10.3 13.6
Increase in the audio level for a time constant of 75 µs:
Audio frequency
40 Hz
100 Hz
500 Hz
1 kHz
5 kHz
6 kHz
7.5 kHz
10 kHz
15 kHz
Factor for the in-crease
1.00 1.00 1.03 1.11 2.56 3.00 3.67 4.82 7.14
Increase in dB
0 0 0.2 0.8 8.1 9.5 11.3 13.6 17

Input Level and Frequency Deviation
Example for Calculating the Required Audio Level
7BM105_0E Rohde & Schwarz Measurements on FM Transmitters for Acceptance, Commissioning and Maintenance 85
A.3 Example for Calculating the Required Audio Level
For a transmitter with a nominal deviation of 50 kHz at an input level of 6 dBu (corre-sponds to about 1.54 volts), a deviation of 100 kHz is to be achieved. This yields an audio input level of:
(
)
By making the corresponding selections in "Audio Generator Setup" under "Ampl
Definition" (see 3.2.5) on the R&S®ETL, it is possible to enter the desired peak devia-
tion ("Desired DUT Deviation"), the audio generator level in dBu ("Level") or the audio
generator level in volts ("Peak Voltage"). Consequently, no conversion is required
when "Ampl Definition" is selected.
If a preemphasis of 50 µs is used with this transmitter, the audio level that is entered
must be reduced by a corresponding amount. If the deviation of 100 kHz at a 15 kHz
audio frequency is to be achieved, the audio level must be reduced as follows:
log
√
√
The audio level to be entered is:
–

Automated Measurements with R&S®TxCheck
7BM105_0E Rohde & Schwarz Measurements on FM Transmitters for Acceptance, Commissioning and Maintenance 86
B Automated Measurements with R&S®TxCheck The R&S
®TxCheck software application is available free of charge on every R&S
®ETL.
This software makes it possible run measurements automatically, and includes the
generation of a weighted report of the results. With the aid of R&S®TxCheck, you can
automate the following measurements:
Transmitter Output Level (5.1)
Frequency Accuracy (5.2)
Audio Frequency Characteristic (up to 15 kHz, or 17.5 kHz for Mono Transmitters)
(5.4.1.1)
Baseband Frequency Characteristic (up to 100 kHz). (5.4.1.2)
Audio Phase Response (5.4.2.1)
Baseband Phase Response (5.4.2.2)
Stereo Crosstalk (5.5)
Total Harmonic Distortion (THD) (5.6.1)
Audio Intermodulation (5.6.2.1)
Intermodulation in the Baseband (up to 100 kHz) (5.6.2.2)
Digital Input Signal (AES/EBU) (5.9)
This Application Note includes the file "7BM105.ETLtxi". When this file is opened in
R&S®TxCheck, the software can perform all of the measurements on the transmitter's
L&R input and MPX input that can be automated:
Performing Automated Measurements Using R&S®TxCheck
Copy the file 7BM105.ETLtxi to the R&S®ETL.
Check to ensure that the max. input power is not exceeded (see 4.3).
Connect the R&S®ETL (IN1) to test port M1.
MODE→TxCheck
In the R&S®TxCheck application, go to File/Open Profile (*.ini) and select the previ-
ously copied profile "7BM105.ETLtxi".
By selecting the “Settings” tab, adjust parameters such as the frequency and transmit-ter parameters (see Fig. 53).
Set the basic configuration using the "Write Settings to ETL" button.
If necessary, select the "Measurements" tab to adapt the configuration of the individu-al measurements (such as the "Desired DUT Deviation" and the "Preemphasis Com-pensation") as well as the limits for the individual measurement parameters (see Fig. 54).
Go to "Measurement/Start Measurement" to start the measurement.
After the measurements are complete, go to "File/Save" to save the results.

Automated Measurements with R&S®TxCheck
7BM105_0E Rohde & Schwarz Measurements on FM Transmitters for Acceptance, Commissioning and Maintenance 87
Fig. 53: R&S®TxCheck User Interface, "Settings" tab.
Fig. 54: R&S
®TxCheck User Interface, "Measurements" tab.
The results of the automated measurement are displayed in the "Measurements" and
the "Graphics" tabs. To view the saved result files on an external PC, first install the
R&S®TxCheck software on that PC (in the R&S
®TxCheck application, go to
"Help/Installation Info…" for more information). Finally, go to "File/Print" to print the
result report. (see Fig. 55).

Automated Measurements with R&S®TxCheck
7BM105_0E Rohde & Schwarz Measurements on FM Transmitters for Acceptance, Commissioning and Maintenance 88
Fig. 55: R&S
®TxCheck: Excerpt from the report.

About Rohde & Schwarz
Rohde & Schwarz is an independent group
of companies specializing in electronics. It is
a leading supplier of solutions in the fields of
test and measurement, broadcasting,
radiomonitoring and radiolocation, as well as
secure communications. Established more
than 75 years ago, Rohde & Schwarz has a
global presence and a dedicated service
network in over 70 countries. Company
headquarters are in Munich, Germany.
Environmental commitment
Energy-efficient products
Continuous improvement in environ-
mental sustainability ISO 14001-certified environmental
management system
Regional contact
Europe, Africa, Middle East
+49 89 4129 12345
[email protected] North America
1-888-TEST-RSA (1-888-837-8772)
[email protected] Latin America
+1-410-910-7988
[email protected] Asia/Pacific
+65 65 13 04 88
[email protected] China
+86-800-810-8228 /+86-400-650-5896
This application note and the supplied
programs may only be used subject to the
conditions of use set forth in the download
area of the Rohde & Schwarz website.
R&S® is a registered trademark of Rohde & Schwarz GmbH & Co. KG; Trade names are trademarks of the owners.
Rohde & Schwarz GmbH & Co. KG
Mühldorfstraße 15 | D - 81671 München
Phone + 49 89 4129 - 0 | Fax + 49 89 4129 – 13777
www.rohde-schwarz.com