Estimation of Raindrop Size Distribution and Rainfall Rate ...

Indian Journal of Radio & Space Physics Vol. 32, October 2003, pp. 286-295
Measurements of raindrop size distribution over Gadanki during south-west and north-east monsoon
K Krishna Reddy Frontier Observational Research System for Global Change, Yokohama, Japan
and
Toshiaki Kozu
Department of Electronic and Control Systems Engineering, Shimane University, Matsue, Japan
Received 13 September 2002; revised 3 February 2003; accepted 10 April 2003
Simultaneous observations of disdrometer and optical rain gauge (at National MST Radar Facility, Gadanki) and their application in rainfall estimation are evaluated. Comparison of rain rate obtained from disdrometer and optical rain gauge in different precipitation events in different seasons show reasonably good agreement between the two instruments. Southern India has two distinct rainfall seasons, namely south-west (S-W) monsoon and north-east (N-E) monsoon periods. Disdrometer data analysis shows a clear seasonal dependence in radar reflectivity factor-rainfall rate (Z-R) relations (i.e. raindrop size distribution characteristics) in S-W monsoon and N-E monsoon periods over Gadanki. It is also found that during S-W monsoon precipitation generally has bigger drops than during N-E monsoon. During the S-W monsoon most of the precipitating cloud systems are associated with mesoscale convection activities. These precipitating systems are shortlived (- 1-2 h) with high intensity of rainfall.
Keywords: Raindrops, Raindrop size distribution, Rainfall, Radar reflectivity
1 Introduction Raindrop size distribution (DSD) and its spatial
variability are the most fundamental but most difficult-to-measure rainfall parameters that form the basis of radar rainfall measurement. The JossWaldvogel impact disdrometer (hereafter JWD) is designed to derive the total integrated rain rate and radar reflectivity factor of the surface rain from drop size measurements in order to improve the scanning radar estimates of rainfall 1 • The JWD gained favour as the reference surface disdrometer due to its durability and accuracy. The JWD has been used very widely to study DSD properties. Several researchers successfully used this instrument to investigate DSD, which improved understanding of the cloud processes associated with precipitation2•3. One source of uncertainty in radar-rainfall estimation is the variability of the DSD. These variations affect radar reflectivity factor (2) and rain rate (R) relationship (Z-R relations) . The DSD varies from one climatological region to another, from one storm to the next, and within a storm system. To investigate the variations, samples of drop size distributions have been collected in both mid-latitudes and the tropics4.5•
A number of these and other studies offered single, dual and multiple Z-R relations. The differences in precipitation type (i .e. convective and stratiform precipitation) are the leading causes for more than one Z-R relation within the same climatic zone. In monsoon meteorology and radar meteorology, accurate measurement of rainfall is important and variations in Z-R relationships are strongly dependent on DSD variations. Several Z-R relationships have been reported from various geographical locations after the pioneering work of Marshall and Palmer6 and are summarized by Battan7• Sarkar et al. 8 utilized a X-band radar data in tropical India for radio communications studies. In order to improve the accuracy of rainfall measurements by radar, a large variety of the size distributions among storms and within individual events should be investigated9•IO• Verma et al. 1 1 carried out theoretical investigations to understand the DSD over Indian region during monsoon. The climatology of the single Z-R relation, derived by using a large database would greatly increase the accuracy of scanning radar rainfall measurements in India during monsoon.

KRISHNA REDDY & KOZU: RAINDROP SIZE DISTRIBUTION OVER GADANKI 287
Tropical Rainfall Measuring Mission (TRMM) satellite with an increased effort made measurements of drop size distribution from precipitation radar at several sites in the tropics. The TRMM satellite aims to retrieve rainfall in the tropics through its active and
• 12 A .
pasSive remote sensors . mong itS sensors, the precipitation radar (PR) operates at (attenuating) 1 3 .8 GHz frequency. An attenuation correction is applied to the reflectivity factor to derive the estimated rainfall . The TRMM microwave imager, a passive sensor on the TRMM satellite, estimates rainfall by adopting a cloud model in which the DSD is prescribed. At Gadanki, the JWD and TRMM PR data are used for comparison of estimated DSD parameters.
Efforts to evaluate the variations in DSD and to develop Z-R relations remain research topics and the differences between radar estimated and rain gauge measured rainfall are often observed in an operational environment. The JWD performance/accuracy in terms of rain rate can be studied by using simultaneous observations of optical rain gauge (hereafter ORG). The main objective of the present study is to investigate the DSD variations during south-west (S-W) and north-east (N-E) monsoon seasons.
2 Instrumentation and database The experimental site, the National MST Radar
Facility (NMRF) at Gadanki ( 13 .5°N, 79.2°E) is situated in a rural environment in the hilly region about 1 20 km to north-west of Chennai (Madras) on the east coast of the southern peninsula. Over the Indian monsoon region, any extensive study using sophisticated and collocated measurements has not been carried out so far. For the first time in India at Gadanki, the collocated facilities of disdrometer and ORG extensive observations are used for understanding the monsoon precipitation and climatology of radar reflectivity factor (Z) and rainfall (R). Brief description of the instruments is given below.
2.1 Joss-Waldvogel disdrometer There are three major types of ground-based
disdrometers, namely, impact disdrometers, optical disdrometers and Doppler radar disdrometers. Here, the characteristics and operating principles of the impact disdrometer are described briefly. The most popular impact disdrometer was originally developed by Joss and Waldvogel 1 and has been commercially available for over 30 years. The Joss-Waldvogel
disdrometer consists of a sensor and signal processing electronic unit. The sensor has a sampling crosssectional area of 50 cm2 . The standard output of JWD is the number of drops that are sorted into 20 size intervals ranging from 0.3 to about 5.0-5 .5 mm for a 30-s or a I -min period. The boundaries of the 20 channels are not uniform and increase with drop size from 0. 1 mm to about 0.5 mm. The calibration of each unit determines the exact channel boundaries 1 3 . The manufacturer provides a table of voltage to drop diameter relation for 1 27 channels of each unit. The user may decide to retrieve the drop counts in 1 27 channels rather than employing the standard output. In general, only 20 channel drop counts are collected in the field and the table of the voltage to drop diameter is useful to determine the precise mid-size of each drop channel. In the present study, the standard output of JWD was used. Whenever the precipitation falls on the ground the disdrometer generates a temporal sequence of raindrop size distributions with an event sampling time of 1 min. The data were collected at I -min intervals.
2.2 Optical rain gauge (ORG) The optical rain gauge (Model 8 15) was
manufactured by Scientific Technology Incorporated, Inc (ScTi). The ORG is not a disdrometer but is a useful reference in this experiment because, unlike conventional gauges, it measures the instantaneous rainfall rate. The ORG provides accurate measurements of precipitation, almost in all weather conditions. The optical precipitation sensors measure rainfall by detecting the optical irregularities induced within the sample volume by hydrometeors passing through a beam of partially coherent infrared radiation. These irregularities are known as scintillation and produce an electromagnetic disturbance that is detected by the instrument. By measuring the intensity of the scintillation characteristics of rainfall, the actual rainfall rate is determined.
The data used for this presentation has been collected from the co-located instruments of disdrometer and ORG. In this paper, disdrometer data sets of almost two years [September-December 1 997, June and July 1 998, and May 1 999-April 2000] are considered. Gadanki disdrometer has been operated continuously, but it also failed for some periods due to broken Styrofoam transducer (head) by bird hitting. The climate in southern India is outlined in Table 1 based on lower atmospheric wind profiler, automatic

288 INDIAN J RADIO & SPACE PHYS, ocrOBER 2003
weather station (A WS) observations. It may be noted that winter and premonsoon are dry seasons at Gadanki with very little rain. For the present study 5639, 1 584 and 9421 minutes of precipitation data collected from disdrometer during the years 1997, 1998 and 1999, respectively, have been utilized to understand the seasonal dependence of DSD for s lmmer and winter monsoon seasons.
Climate
Table l-Climate at Gadanki
Month
Pre-monsoon
Dry to wet transition
South-west (S-W)fsummer monsoon
S-W to North-east(N-E) transition
N-E Monsoon fpost-Monsoon
Winter
March, April and May
May
June, July, August and September
October
October, November and early December
Late December, January and February
100 1 3 May99
(a) - Dl.drometer 80 .. - ORG <E E E 60 W i 40 z � 20
0 1 7:45 18:00 18:14 18:28 18:43
TIME, hr. LT
23 Dec.'99
20
... (C) -Dlsdrometer r. 1 5 - ORG E E ui i 10
z � 5
0
0:00 0:36 1 :12 1 :48 2:24 3:00
TIME. hrs LT
3 Intercomparison of rain rate obtained from JWD and ORG
The JWD was originally designed for the purpose of calculating radar reflectivity factor and rainfall rate. The JWD is a reliable instrument that can be operated continuously and unattended. At NMRF site the disdrometer and ORG are collocated with a spatial distance of about 2 m. The performance and reliability of disdrometer and optical rain gauge were checked in a variety of rainfall regimes during different seasons. Figures 1 and 2 show a comparison of different rain events during 1 999. High correlation of 0.9 is found during S-W monsoon when compared with about 0.8 during N-E monsoon rainfall. During N-E monsoon, dew collected on the ORG receiver lens would cause attenuation of the optical beam and high equivalent rainfall rate. This limitation can be overcome by the adjusted optimal dynamic range of ORG to provide better "low end" sensitivity. Figure 2(a) shows time series of rainfall rate estimates from the disdrometer
30 13 May'99
(b) y .= 1.0897x (- 3.5338)
a: 20 � : = 0.9671 m " S-a: 2- 10 1&1 t-CIC a: � CIC 0 a:
-10
-10 0 10 20 30 RAIN RATE (DISDRO), dBR
23 Dec.'99 30
Y - 0.7376x (- 0.62) (d) tr - 0.6416 a: 20 m "
S-a: 2- 10 � � z �
-10 -10 0 10 20 30
RAIN RATE (DlSDRO). dBR
Fig. l-Comparison of rain rate obtained from disdrometer and ORG on different rainfall events

KRISHNA REDDY & KOZU: RAINDROP SIZE DISTRIBUTION OVER GADANKI 289
Comparison of Rain rate 25
20 (a)
- DISDROMETER - - - - - ORG
1 5
D::: m 1 0 '0 ui 5 � � 0 Z � -5
·10
·15
·20
1 1 20 239 358 477 596 715 834
NUMBER OF MINUTES
Scatter plot of Rain Rate 25 20 (b) Y = 1 .038x (- 3.7337) �
m R2 = 0.8471 � 1 5 S' 10 � 2- 5 w � � 0 •
•
z -5 � a • -10 •
-15 ';'15 ·10 -5 0 5 10 15 20 25
RAIN RATE (DISDRO),dBR Fig. 2--(a) Comparison of rain rate obtained from disdrometer and ORG for 8 precipitation events during May 1999 and (b) Scatter plot of rain rate obtained from disdrometer and ORG for 8 precipitation events during May 1999
and ORG during May 1 999 for 8 different precipitation events and total duration of 9 1 8 min. Different rainfall conditions encountered during May 1 999 including stratiform rainfall, summer-time convective precipitation (> 100 mmlhr) and mesoscale convective systems during the dry to wet transition period.
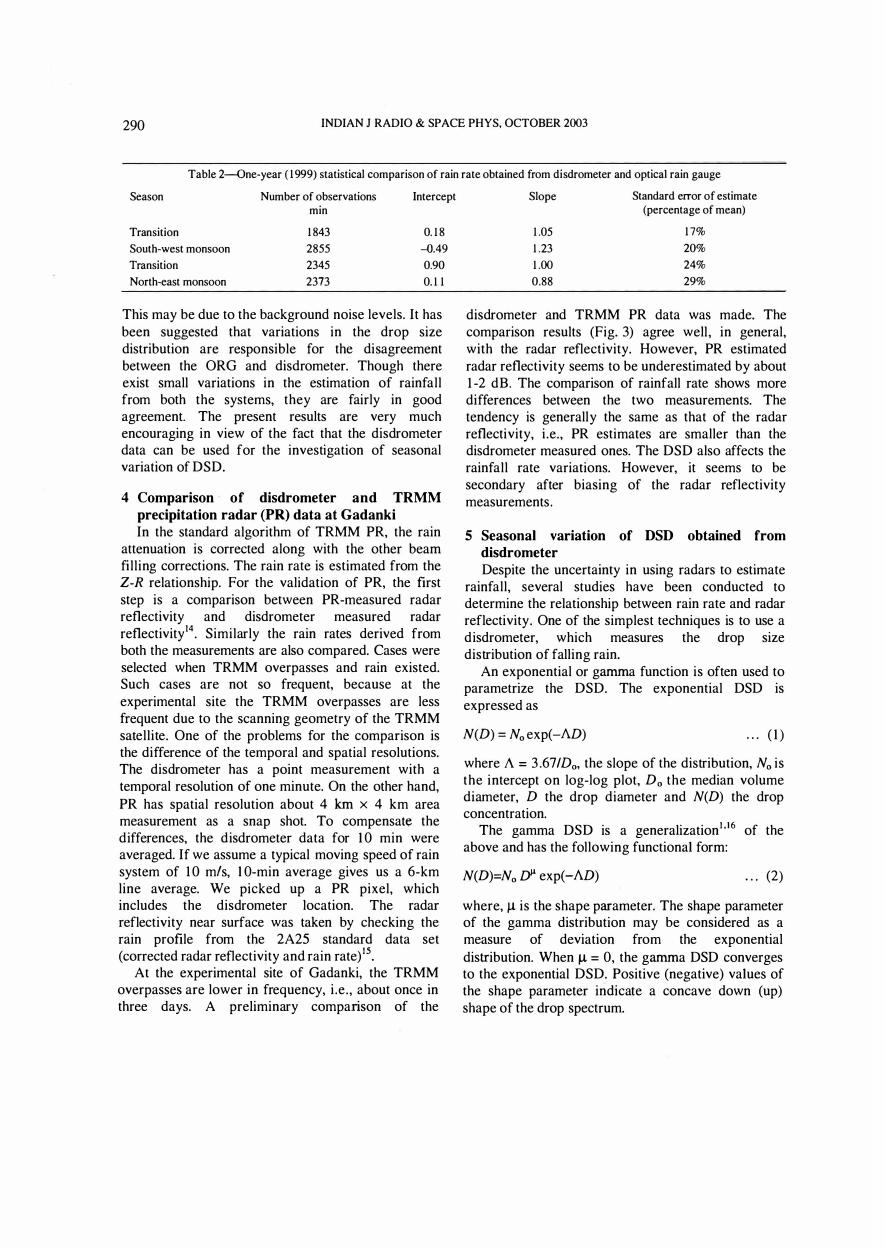
Rain rates obtained from the JWD were compared with ORG estimated rain rates during different seasons. The results of a linear least-squares fit for each season are given in Table 2. The standard error of estimate (SEE) is expressed as a percentage of the
average rain rate from ORG for all seasons. The summer transition (May) showed the smallest value of the linear fit about 17% and winter transition (October) the largest of 29%. Overall, the disdrometer and ORG performed well with inter-correlations of order 0.85 and bias less than 1 5%. However, both instruments showed some l imitations under different rainfall situations. In particular, under extremely heavy rainfall rates (> 1 00 mmlhr), the bias between the disdrometer and the optical rain gauge was low. Under light rainfall rates the optical gauge was more sensitive than the disdrometer and the bias is high.
290 INDIAN J RADIO & SPACE PHYS, OCTOBER 2003
Table 2--Gne-year ( 1999) statistical comparison of rain rate obtained from disdrometer and optical rain gauge
Season Number of observations Intercept min
Transition 1 843 0. 1 8
South-west monsoon 2855 -Q.49
Transition 2345 0.90
North-east monsoon 2373 0. 1 1
This may be due to the background noise levels. It has been suggested that variations in the drop size distribution are responsible for the disagreement between the ORG and disdrometer. Though there exist small variations in the estimation of rainfall from both the systems, they are fairly in good agreement. The present results are very much encouraging in view of the fact that the disdrometer data can be used for the investigation of seasonal variation of DSD.
4 Comparison ' of disdrometer and TRMM precipitation radar (PR) data at Gadanki In the standard algorithm of TRMM PR, the rain
attenuation is corrected along with the other beam filling corrections. The rain rate is estimated from the Z-R relationship. For the validation of PR, the first step is a comparison between PR-measured radar reflectivity and disdrometer measured radar reflectivityl4. Similarly the rain rates derived from both the measurements are also compared. Cases were selected when TRMM overpasses and rain existed. Such cases are not so frequent, because at the experimental site the TRMM overpasses are less frequent due to the scanning geometry of the TRMM satellite. One of the problems for the comparison is the difference of the temporal and spatial resolutions. The disdrometer has a point measurement with a temporal resolution of one minute. On the other hand, PR has spatial resolution about 4 km x 4 km area measurement as a snap shot. To compensate the differences, the disdrometer data for 1 0 min were averaged. If we assume a typical moving speed of rain system of 1 0 mis, l O-min average gives us a 6-km line average. We picked up a PR pixel, which includes the disdrometer location. The radar reflectivity near surface was taken by checking the rain profile from the 2A25 standard data set (corrected radar reflectivity and rain rate) 15.
At the experimental site of Gadanki, the TRMM overpasses are lower in frequency, i .e . , about once in three days. A preliminary comparison of the
Slope
1 .05
1 .23
1 .00
0.88
Standard error of estimate (percentage of mean)
1 7%
20%
24%
29%
disdrometer and TRMM PR data was made. The comparison results (Fig. 3) agree well , in general, with the radar reflectivity. However, PR estimated radar reflectivity seems to be underestimated by about 1 -2 dB. The comparison of rainfall rate shows more differences between the two measurements. The tendency is generally the same as that of the radar reflectivity, i.e., PR estimates are smaller than the disdrometer measured ones. The DSD also affects the rainfall rate variations. However, it seems to be secondary after biasing of the radar reflectivity measurements.
5 Seasonal variation of DSD obtained from disdrometer Despite the uncertainty in using radars to estimate
rainfall, several studies have been conducted to determine the relationship between rain rate and radar reflectivity. One of the simplest techniques is to use a disdrometer, which measures the drop size distribution of falling rain.
An exponential or gamma function is often used to parametrize the DSD. The exponential DSD is expressed as
N(D) = No exp(-AD) . . . ( 1 )
where A = 3 .67IDo, the slope of the distribution, No is the intercept on log-log plot, Do the median volume diameter, D the drop diameter and N(D) the drop concentration.
The gamma DSD is a generalizationl • 16 of the above and has the following functional form:
N(D)=No JYl exp(-AD) . . . (2)
where, 1..1. is the shape parameter. The shape parameter of the gamma distribution may be considered as a measure of deviation from the exponential distribution. When 1..1. = 0, the gamma DSD converges to the exponential DSD. Positive (negative) values of the shape parameter indicate a concave down (up) shape of the drop spectrum.

KRISHNA REDDY & KOZU: RAINDROP SIZE DISTRIBUTION OVER GAD��KI 291
40 20 15 (b)
� 30 '1:1
10 � II: ID C!: 2O '1:1
fd aU 5
.... i u. 0 � 10 i oS 0
·10 � II � � � � � � � � � II; S; S; S; "5 � .., :I "5 "5 CJI Q. 8 j i � I I � c c c .., .., ::J JJ c N CD ... CD � tIS f3 S 0. 0 ... ... ... ... N CD ... CD ... ... . ... ... ... DAY DAY
40 20 • II: ID
15 fit '1:1 • � 30 (C) S' (d) 0 II:
10 a: S2 Q � sa � 2O U) 5
e e. • 1= � 0 • y = 1 .0241 x -{O.OO56) (.) � 10 Y • l.0372x • (2.0085) II:
R2 = 0.784 � z oS w R2 . 0.8201 a: � 0 ·10
0 10 20 30 40 ·10 oS 0 5 10 15 20 REFLECTIVITY (TRMM PRt dBZ RAIN RATE (TRMM PR), dBR
Fig. 3-Comparison of TRMM PR and JWD/ORG data during several precipitating cloud systems passage over Gadanki [(a) Radar reflectivity, (b) Rain rate measured by TRMM PR and disdrometer, (c) Scatter plot of radar reflectivity and (d) Scatter plot of rain rate obtained from TRMM PR and disdrometer)
Integral rainfall parameters, median volume diameter Do (mm), R (mm hr-1 ), and Z (dB) are determined as a function of raindrop size distribution as follows:
J::o D3 N(D)dD = � J:: D3
N(D) dD
R = 6nx lO--{; J:: D3V(D)N(D) dD
Z = J:: D6 N(D) dD
(3)
(4)
(5)
'where, V(D) (cm S-l ) is the terminal velocity of rain drops of diameter D, and DIrulX (mm) is the maximum raindrop diameter.
The gamma DSD parameters are derived by using the higher-order moment method developed by Kozu and Nakamural6 and statistically analyzed to study the
seasonal dependence of DSD obtained from disdrometer data at Gadanki. Figures 4 [(a) and (b)] shows the seasonal variation of Do and No (the latter is for the exponential distribution), respectively. As shown in Fig. 4, there are significant trends from the summer transitionlS-W monsoon to the winter transitionIN-E monsoon such as in the reduction of Do and the increase of No. The DSD variation at Gadanki, generally, depends on seasonal change of monsoon precipitating cloud systems which are characterized by a variety of physical mechanisms that produce strong seasonal winds, a wet summer and a dry winter. The climate of the Gadanki ' s surrounding area is affected by two seasonal winds, namely, the S-W monsoon and the N-E monsoon. The basic monsoon mechanism lies in the fact that land heats up and cools more quickly than the sea; the latter holding its temperature more or less steady. As the sun moves to

292 INDIAN J RADIO & SPACE PHYS, OCTOBER 2003
....e- 97 1·3{mmltt] -'-97 3-10[mmltt] ___ 97 1G-30[mmltt] -0-99 1·3{mmltt] -tr-99 3-10[mmltt] �99 1G-30[mmlh] 3
2.5 E 2 E .:. 0 1 .5
1 0.5 4 6 8 10 1 2
MONTH
50 �
o �40 ����--������� o
30 +------r-----1------+-----� 4 6 8 MONTH
10 1 2 Fig. 4--Seasonal variation of Do and No i n 1997 and 1999
the north bringing out summer heat, the land steadily gets hotter and hotter, while the temperature of the ocean lags far behind. The effect on a larger landmass like India is that the hot air rises over the land, leaving below a vast area of low pressure, which draws in massive amounts of air from over the ocean where higher pressures are maintained. This is the S-W monsoon pattern (it is the wind, and not resulting in rain, which is defined as the monsoon). Around September, as the sun is retreating south, the northern landmass begins to cool rapidly. As it cools, air pressure builds up over the land. Meanwhile the oceans are still holding their warmer summer temperatures. The cooler high-pressure air over inland then starts to move down towards the lower pressure areas over the ocean, and the N-E monsoon is born. Between November and December, the climatic pattern called the N-E monsoon appears i n the Bay of
Bengal, bringing rains to the east coast. Meanwhile the air moving out from inland Asia is replaced and balanced by warmer air moving to northwards from the oceans. Southern peninsular India gets maximum rainfall during the N-E monsoon. Conventionally, November and December is treated as the N-E monsoon season over India [mainly affecting the states of Tamil Nadu, Andhra Pradesh (Rayalaseema) and Kerala] . Only in Tamil Nadu and Andhra Pradesh a major difference is seen, because this area fails to pick up anything but the remnants of the summer monsoon. Between November and December, the climatic pattern called the N-E monsoon appears in the Bay of Bengal, bringing rains to the east coast.
It is the combined effect of these mechanisms that produces (seasonal vanatlOn of raindrop size distribution) the monsoon's characteristic reversals of high winds and precipitating cloud systems. These results are very interesting and different from the subtropics3. The present results suggest that the rain-type dependent of DSD properties in tropics may need more study. It is noted that there are no significant differences between the results of 1 997 and 1999 at Gadanki. Despite the uncertainty in using radars to estimate rainfall, several studies have been conducted to determine the relationship between rain rate and radar reflectivity. By plotting the radar reflectivity against the rain rate, it has been found that the relationship between radar reflectivity and rain rates fol lows a "power-law", i.e.
. . . (6)
The constants a and b are related to the intercept and slope of the best-fit line through a plot of rain rate versus radar reflectivity [on a log Z-log R plot].
In the present study a clear seasonal dependence i n Z-R relations (i.e. DSD characteristics) was found at Gadanki, as shown in Figs 5-7. Figure 5 shows the scatter diagrams of rain rate (dBR) [dBR=10xloglO (R, mm hr-I )] with reflectivity factor (dBZ) [dBZ= 1 0xloglO(Z)] for different seasons during May 1 999 to December 1 999 indicating the seasonal variations. Figure 6 shows the scatter diagrams of dBR with dBZ for September-December 1 997 and 1 999, respectively. It is found that September precipitation (during S-W monsoon) has generally bigger drops than in December. In September, most of the precipitating cloud systems are associated with lightning and mesoscale convection activities. These storms are short-lived around a couple of hours with high

KRISHNA REDDY & KOZU: RAINDROP SIZE DISTRIBUTION OVER GADANKI
1 999
60
50
� 40 "
� � 30 u w ...I II. � 20
10
0
·5 0 5 10 15 20 25
RAIN RATE, dBR
Fig. 5-Scatter plot of reflectivity-rain rate during different seasons over Gadanki
��-----------------------------------.
N 50 Y = 1 .3385x (+ 25.952) CD R2 = 0.9165 1:!. 40 � 30 � 20 II.
&! 1 0
(8)
y = 1 .�2x (+ 19.623)
R2 = 0.8539
o+----.-----.----�---.-----.----�--� ·10
�
50 :it � 40 � � 30 CJ W ...I 20 II. W iii!:
1 0
0
·10
·5 o 5 1 0 1 5 20
RAIN RATE, dBR
y - 1.2732x (+ 26.153)
� - O.822
__ ----.'99
·5
y - 1.4595x (+ 17.186)
� - 0.9038
o 5 1 0 1 5
RAI N RATE, dBR
20
25
(b)
25
Fig. 6--Comparison of scatter plots of Z-R relation in September and December for (a) 1 997 and (b) 1 999
293
294 INDIAN 1 RADIO & SPACE PHYS, OcrOBER 2003
intensity of rainfall. Whereas in December (during NE monsoon) the preCipitation is associated with monsoon depressions. Wilson et al. 17 made a similar study using the disdrometer data obtained in Singapore for several years, and found no significant differences in DSDs in S-W and N-E monsoons. The J ,resent results strongly suggest that this type of i easonal dependence should be taken into account to i mprove the accuracy of the TRMM precipitation , adar algorithm.
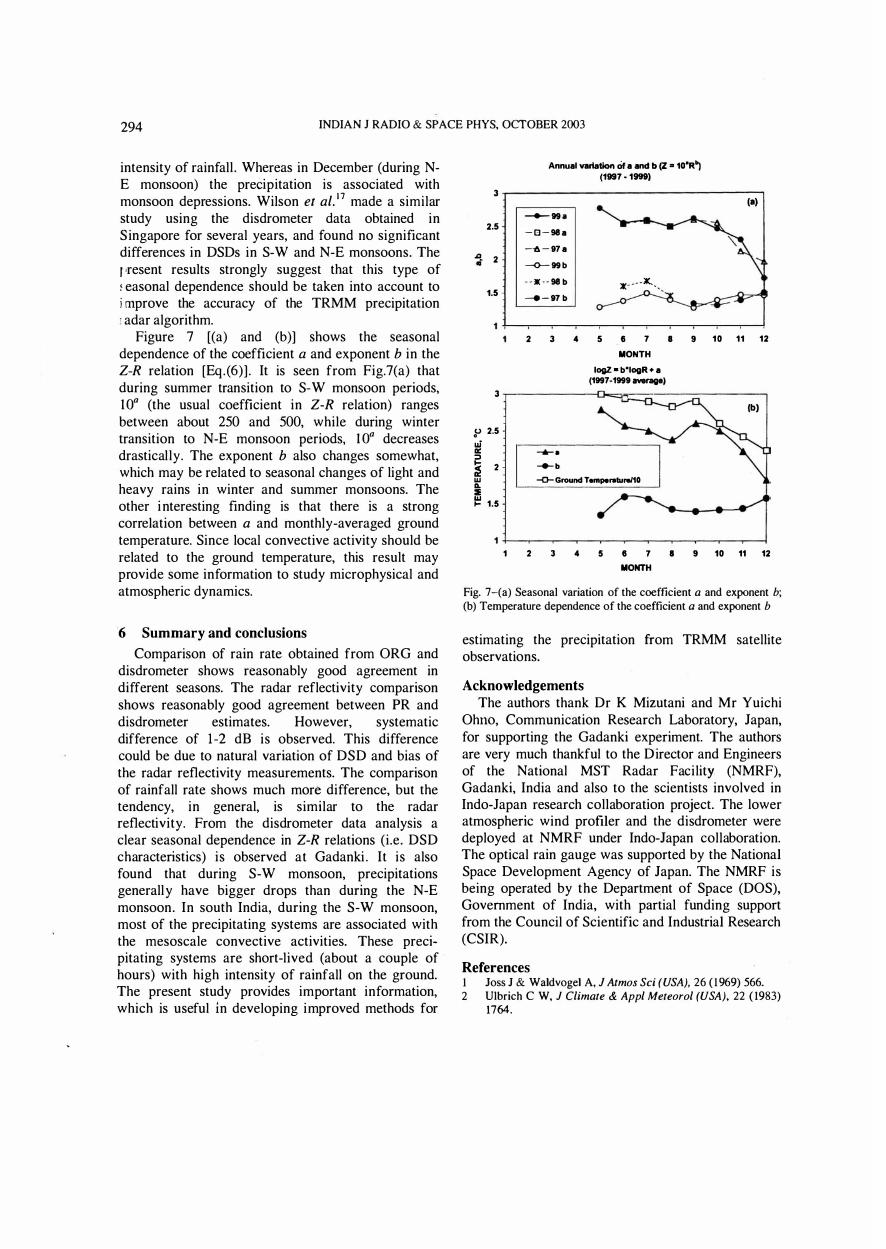
Figure 7 [(a) and (b)] shows the seasonal dependence of the coefficient a and exponent b in the Z-R relation [Eq.(6)] . It is seen from Fig.7(a) that during summer transition to S-W monsoon periods, lOa (the usual coefficient in Z-R relation) ranges between about 250 and 500, while during winter transition to N-E monsoon periods, l Oa decreases drastically. The exponent b also changes somewhat, which may be related to seasonal changes of light and heavy rains in winter and summer monsoons. The other interesting finding is that there is a strong correlation between a and monthly-averaged ground temperature. Since local convective activity should be related to the ground temperature, this result may provide some information to study microphysical and atmospheric dynamics.
6 Summary and conclusions Comparison of rain rate obtained from ORG and
disdrometer shows reasonably good agreement in different seasons. The radar reflectivity comparison shows reasonably good agreement between PR and disdrometer estimates. However, systematic difference of 1 -2 dB is observed. This difference could be due to natural variation of DSD and bias of the radar reflectivity measurements. The comparison of rainfall rate shows much more difference, but the tendency, in general, is similar to the radar reflectivity. From the disdrometer data analysis a clear seasonal dependence in Z-R relations (i.e. DSD characteristics) is observed at Gadanki . It is also found that during S-W monsoon, precipitations generally have bigger drops than during the N-E monsoon. In south India, during the S-W monsoon, most of the precipitating systems are associated with the mesoscale convective activities. These precipitating systems are short-lived (about a couple of ' hours) with high intensity of rainfall on the ground. The present study provides important information, which is useful in developing improved methods for
3
2.S
"!. 2 •
1_S
3
.p 2.S III III: :::l � 2 w II. ::E I!! 1.5
Annual variation Or a and b (Z .. 1O"R"l (1997 - 19991
_ 99 .
- 8 - 98 a
-A - 97 a
� 99 b
- - lIE - - 98 b x- ---lK.. • •
-' - 97 b
2 3 4 S 45 7 8 9
MONTH logZ · b"logR • a
(1997-1999 --eel
..... . ..... b -0- Ground T .... pereturel10
(al
10 11 12
(b)
1 +-�--��--��--��--��--�� 1 2 3 4 5 45 7 8 9 10 11 12
MONTH
Fig. 7-(a) Seasonal variation of the coefficient a and exponent b; (b) Temperature dependence of the coefficient a and exponent b
estimating the precipitation from TRMM satellite observations.
Acknowledgements The authors thank Dr K Mizutani and Mr Yuichi
OhIlO, Communication Research Laboratory, Japan, for supporting the Gadanki experiment. The authors are very much thankful to the Director and Engineers of the National MST Radar Facility (NMRF), Gadanki, India and also to the scientists involved in Indo-Japan research collaboration project. The lower atmospheric wind profiler and the disdrometer were deployed at NMRF under Indo-Japan collaboration. The optical rain gauge was supported by the National Space Development Agency of Japan. The NMRF is being operated by the Departm�nt of Space (DOS), Government of India, with partial funding support from the Council of Scientific and Industrial Research (CSIR).
References 1 loss 1 & Waldvogel A, J Atmos Sci (USA), 26 ( 1 969) 566. 2 Ulbrich C W, J Climate & Appl Meteorol (USA), 22 ( 1983)
1764.

KRISHNA REDDY & KOZU: RAINDROP SIZE DISTRIBUTION OVER GADANKI 295
3 Sheppard B E & Joe P I, J Atmos Ocean Technol (USA). 1 1 ( 1994) 874.
4 Williams C R. Kruger A. Gage K S. Tokay A. Cifelli R. Krajewski W F & Kummerow C. Geophys Res Lett (USA). 27 (2000) 1763.
5 Rao T N. Rao D N. Mohan K & Raghavan S, J Geophys Res (USA). 106 (2001) 17699.
6 Marshall J S & Palmer W M. J Meteorol (USA). 5 ( 1948) 165.
7 Battan L J. Radar observations of the atmosphere (University of the Chicago Press. Chicago. USA). 1973.
8 Sarkar S K. Kumar R. Ahmad I. Prasad M V S N. Das J & De K. Indian J Radio & Space Phys. 32 (2003) 98.
9 Fujiwara M. J Atmos Sci ( USA). 22 ( 1965) 585.
10 Mali p. Sarkar S K & Das J. Indian J Radio & Space Phys. 32 (2003) 296.
1 1 Verma A K & Jha K K. Indian J Radio & Space Phys. 25 ( 1996) 15.
12 Kummerow C. Barnes W. Kozu T. Shiue J & Simpson J. J Atmos Ocean Technol (USA). 15 ( 1998) 809.
13 McFarquhar G M & List R. J Appl Meteorol (USA). 32 ( 1993) 774.
14 Sato T. Teraoka T & Kimura I. IEICE Trans Commun (Japan). E79B ( 1996) 774.
15 Iguchi T. Kozu T. Meneghini R . Awaka J & Okamoto K. J Appl Meteorol (USA). 39 (2000) 2038.
1 6 Kozu T & Nakamura K . J Atmos Ocean Technol (USA). 8 ( 1991 ) 260.
17 Wilson C L. Eastment J D. Tan J . Ladd D N. Ong J T & Thimothy K I. Overview of TRMM related tropical precipitation measurements in Singapore using radar and disdrometer techniques. Preprints. EGS XXVI General Assembly. NHOO6. Nice. France. March 2001 .


![Adherent Raindrop Detection and Removal in Videousers.cecs.anu.edu.au/~shaodi.you/Downloads/CVPR2013/ShaodiYo… · 3. Raindrop Modeling Unlike the previous methods [15,11,23,22,6],](https://static.fdocuments.us/doc/165x107/5fff334422534d04590d6a6c/adherent-raindrop-detection-and-removal-in-shaodiyoudownloadscvpr2013shaodiyo.jpg)