
Measurements of Proton EM Form Factors in TL Region at BESIII · Measurements of Proton EM Form...
22
Measurements of Proton EM Form Factors in TL Region at BESIII Samer Ahmed, Alaa Dbeyssi, Paul Larin, Dexu Lin , Frank Maas, Cristina Morales, Christoph Rosner and Yadi Wang 1. Helmholtz-Institut Mainz, 55128 Mainz, Germany 2. Institut für Kernphysik, JGU Mainz, 55128 Mainz, Germay 3. PRISMA Cluster of Excellence, JGU Mainz, 55128 Mainz, Germay HUGS 2016 May 31 - June 17, 2016 JLab, Newport News D.X. Lin (HIM) Measurements of Proton EM Form Factors in TL Region at BESIII 1 / 22
Transcript of Measurements of Proton EM Form Factors in TL Region at BESIII · Measurements of Proton EM Form...

Measurements of Proton EM Form Factors in TL Regionat BESIII
Samer Ahmed, Alaa Dbeyssi, Paul Larin, Dexu Lin, Frank Maas,Cristina Morales, Christoph Rosner and Yadi Wang
1. Helmholtz-Institut Mainz, 55128 Mainz, Germany2. Institut für Kernphysik, JGU Mainz, 55128 Mainz, Germay
3. PRISMA Cluster of Excellence, JGU Mainz, 55128 Mainz, Germay
HUGS 2016
May 31 - June 17, 2016JLab, Newport News
D.X. Lin (HIM) Measurements of Proton EM Form Factors in TL Region at BESIII 1 / 22

Outline
1 Introduction and MotivationIntroduction of BESIIIProton Form Factors
2 Measurements of the Proton FFs with ISR Methodppγ Event SelectionBackground Evaluation
3 Proton Form Factors form Energy Scan
4 Conclusions of Proton FFs Measurement
D.X. Lin (HIM) Measurements of Proton EM Form Factors in TL Region at BESIII 2 / 22
Introduction and Motivation Introduction of BESIII
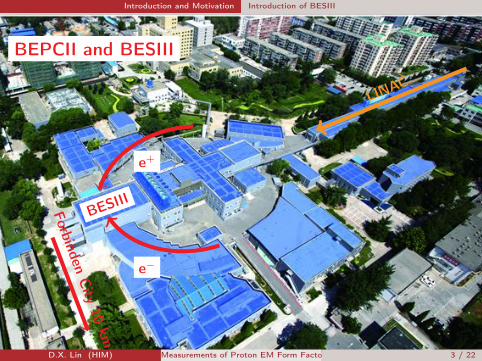
Beijing Electron Positron Collider II (BEPCII)BEPCII and BESIII
BESIII
e+
e−
LINAC
ForbindenCity
10km
D.X. Lin (HIM) Measurements of Proton EM Form Factors in TL Region at BESIII 3 / 22
Introduction and Motivation Introduction of BESIII
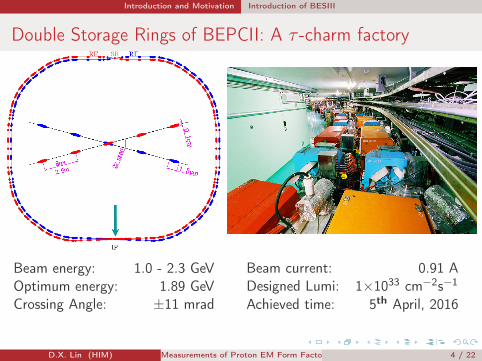
Double Storage Rings of BEPCII: A τ -charm factory
Beam energy: 1.0 - 2.3 GeVOptimum energy: 1.89 GeVCrossing Angle: ±11 mrad
Beam current: 0.91 ADesigned Lumi: 1×1033 cm−2s−1
Achieved time: 5th April, 2016
D.X. Lin (HIM) Measurements of Proton EM Form Factors in TL Region at BESIII 4 / 22

Introduction and Motivation Introduction of BESIII
BESIII Spectrometer
MDCδpp < 0.5% @1 GeVδ(dE/dx)
dE/dx < 6%
TOFδt 80 ps Barrelδt 110 ps Endcap
EMCδEE < 2.5% @1 GeVδz = 0.6/
√E
MUCδ(xy) <2 cm
D.X. Lin (HIM) Measurements of Proton EM Form Factors in TL Region at BESIII 5 / 22
Introduction and Motivation Introduction of BESIII
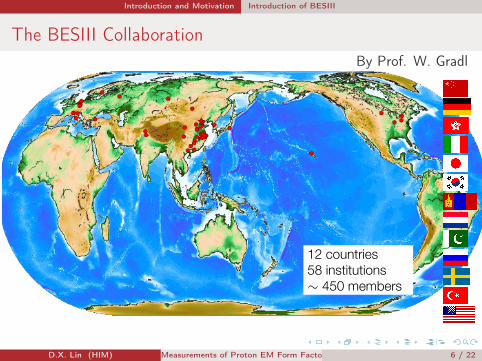
The BESIII Collaboration
12 countries
58 institutions
∼ 450 members
By Prof. W. Gradl
D.X. Lin (HIM) Measurements of Proton EM Form Factors in TL Region at BESIII 6 / 22
Introduction and Motivation Proton Form Factors
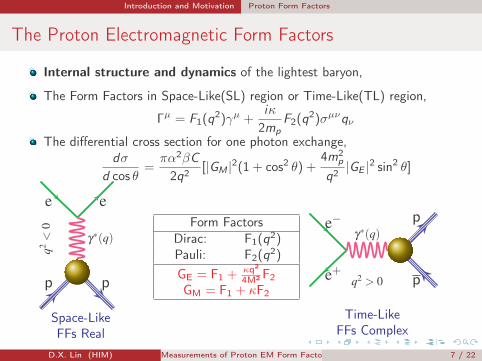
The Proton Electromagnetic Form Factors
Internal structure and dynamics of the lightest baryon,
The Form Factors in Space-Like(SL) region or Time-Like(TL) region,
Γµ = F1(q2)γµ +iκ
2mpF2(q2)σµνqν
The differential cross section for one photon exchange,dσ
d cos θ=πα2βC
2q2 [|GM |2(1 + cos2 θ) +4m2
p
q2 |GE |2 sin2 θ]
e−
e+
γ∗(q)p
pq2 > 0
e e
p p
γ∗(q)
q2<
0
3
e−
e+
γ∗(q)p
pq2 > 0
e e
p p
γ∗(q)
q2<
0
3
Form FactorsDirac: F1(q2)Pauli: F2(q2)
GE = F1 + κq2
4M2F2GM = F1 + κF2
Space-LikeFFs Real
Time-LikeFFs Complex
D.X. Lin (HIM) Measurements of Proton EM Form Factors in TL Region at BESIII 7 / 22

Introduction and Motivation Proton Form Factors
Data on Proton Time-Like Form Factor Ratio
]2 [(GeV/c)2q3 4 5 6 7 8 9 10
|)M
|/|G
E (
|Gem
R
0
0.5
1
1.5
2
2.5PS170
(LA)ARBAB
(R Scan)BESIII
CMD-3
⇒ Only extraction of the ratio |GE||GM| ,
⇒ Inconsistency between BaBarand PS170,
⇒ Maximum at 2 GeV/c2,
⇒ Extraction of an effective FFbased on assumptions,
⇒ 10%–24% statistics uncertainties.
PRD 87, 092005 (2013)Nucl. Phys. B 411, 3 (1994)PRD 91, 112004 (2015)
D.X. Lin (HIM) Measurements of Proton EM Form Factors in TL Region at BESIII 8 / 22
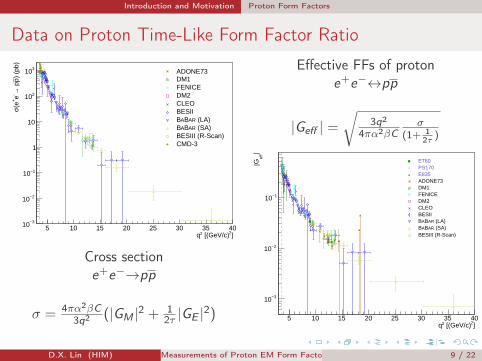
Introduction and Motivation Proton Form Factors
Data on Proton Time-Like Form Factor Ratio
]2 [(GeV/c)2q5 10 15 20 25 30 35 40
|ef
f|G
3−10
2−10
1−10
Effective Form Factor
E760PS170E835ADONE73DM1FENICEDM2CLEOBESII
(LA)ARBAB (SA)ARBAB
BESIII (R-Scan)
Effective Form Factor
Effective FFs of protone+e−↔pp
|Geff | =
√3q2
4πα2βCσ
(1+ 12τ )
]2 [(GeV/c)2q5 10 15 20 25 30 35 40
) (p
b)p
p→- e
+(eσ
3−10
2−10
1−10
1
10
210
310
Cross Section
ADONE73DM1FENICEDM2CLEOBESII
(LA)ARBAB (SA)ARBAB
BESIII (R-Scan)CMD-3
Cross Section
Cross sectione+e−→pp
σ = 4πα2βC3q2 (|GM |2 + 1
2τ |GE |2)
D.X. Lin (HIM) Measurements of Proton EM Form Factors in TL Region at BESIII 9 / 22
Introduction and Motivation Proton Form Factors
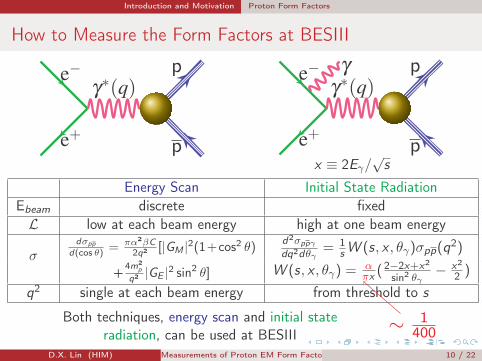
How to Measure the Form Factors at BESIII
e−
e+
γ∗(q)p
p
e−
e+
γ∗(q)p
p
γ
2
e−
e+
γ∗(q)p
p
e−
e+
γ∗(q)p
p
γ
2
x ≡ 2Eγ/√s
Energy Scan Initial State RadiationEbeam discrete fixedL low at each beam energy high at one beam energy
σdσpp
d(cos θ) = πα2βC2q2 [|GM |2(1+cos2 θ)
d2σppγ
dq2dθγ= 1
s W (s, x , θγ)σpp(q2)
+ 4m2p
q2 |GE |2 sin2 θ] W (s, x , θγ) = απx (2−2x+x2
sin2 θγ− x2
2 )
q2 single at each beam energy from threshold to s
∼ 1400
Both techniques, energy scan and initial stateradiation, can be used at BESIII
D.X. Lin (HIM) Measurements of Proton EM Form Factors in TL Region at BESIII 10 / 22
Introduction and Motivation Proton Form Factors
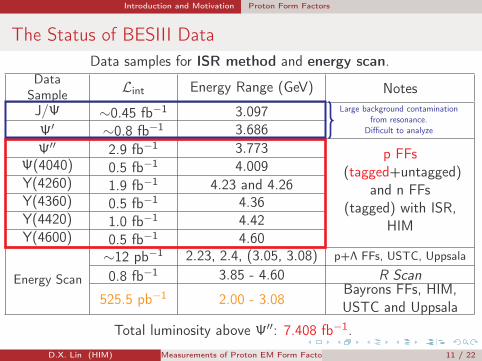
The Status of BESIII DataData samples for ISR method and energy scan.
DataSample Lint Energy Range (GeV) NotesJ/Ψ ∼0.45 fb−1 3.097Ψ′ ∼0.8 fb−1 3.686Ψ′′ 2.9 fb−1 3.773 p FFs
(tagged+untagged)and n FFs
(tagged) with ISR,HIM
Ψ(4040) 0.5 fb−1 4.009Y(4260) 1.9 fb−1 4.23 and 4.26Y(4360) 0.5 fb−1 4.36Y(4420) 1.0 fb−1 4.42Y(4600) 0.5 fb−1 4.60
Energy Scan
∼12 pb−1 2.23, 2.4, (3.05, 3.08) p+Λ FFs, USTC, Uppsala
0.8 fb−1 3.85 - 4.60 R Scan
525.5 pb−1 2.00 - 3.08Bayrons FFs, HIM,USTC and Uppsala
Total luminosity above Ψ′′: 7.408 fb−1.
Large background contaminationfrom resonance.
Difficult to analyze
D.X. Lin (HIM) Measurements of Proton EM Form Factors in TL Region at BESIII 11 / 22
ISR-Tagged ppγ Event Selection
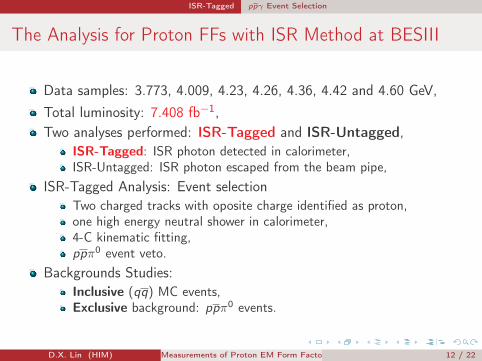
The Analysis for Proton FFs with ISR Method at BESIII
Data samples: 3.773, 4.009, 4.23, 4.26, 4.36, 4.42 and 4.60 GeV,Total luminosity: 7.408 fb−1,Two analyses performed: ISR-Tagged and ISR-Untagged,
ISR-Tagged: ISR photon detected in calorimeter,ISR-Untagged: ISR photon escaped from the beam pipe,
ISR-Tagged Analysis: Event selectionTwo charged tracks with oposite charge identified as proton,one high energy neutral shower in calorimeter,4-C kinematic fitting,ppπ0 event veto.
Backgrounds Studies:Inclusive (qq) MC events,Exclusive background: ppπ0 events.
D.X. Lin (HIM) Measurements of Proton EM Form Factors in TL Region at BESIII 12 / 22

ISR-Tagged ppγ Event Selection
ISR Photon Angular Distribution from MC Simulation
h_isrcosthetaEntries 1e+07Mean -4.685e-05RMS 0.95
γθcos-1 -0.8 -0.6 -0.4 -0.2 0 0.2 0.4 0.6 0.8 1
410
510
610
h_isrcosthetaEntries 1e+07Mean -4.685e-05RMS 0.95
Angular DistributionISR
γ
Geometry Acceptance (| cos θ|)MDC [0.0, 0.93)EMC [0.0, 0.80)∪(0.86, 0.92)
pp pair 42 - 58%
ISR photonTagged Untagged
11 - 12% 31 - 46%
Simulation√s = 4.23 GeV
D.X. Lin (HIM) Measurements of Proton EM Form Factors in TL Region at BESIII 13 / 22
ISR-Tagged ppγ Event Selection
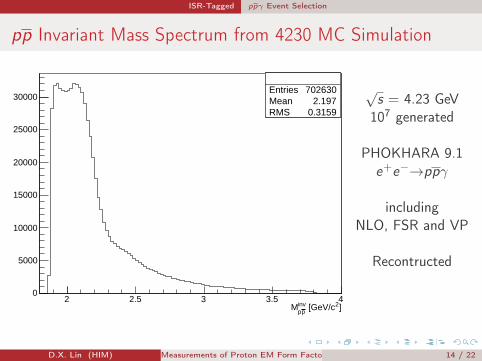
pp Invariant Mass Spectrum from 4230 MC Simulation
Entries 702630Mean 2.197RMS 0.3159
]2 [GeV/cinvpp
M2 2.5 3 3.5 4
0
5000
10000
15000
20000
25000
30000Entries 702630Mean 2.197RMS 0.3159
√s = 4.23 GeV107 generated
PHOKHARA 9.1e+e−→ppγ
includingNLO, FSR and VP
Recontructed
D.X. Lin (HIM) Measurements of Proton EM Form Factors in TL Region at BESIII 14 / 22

ISR-Tagged Background
Dominant Background Evaluation for ISR Ananlysis
Inclusive (qq) MC samples: ppγISR and ppπ0 survived.
Exclusive (dominant) background e+e−→ppπ0
MC samples: 1×10⁷ events generated (PHSP, BesEvtgen with ConExcmodel) for each energy point,Apply ppγ alogrithm on MC sample,Select ppπ0 from data and MC sample
Final ppπ0 background pollution calculation.
Hbkg = Hdatπ0 ×
HMCisr
HMCπ0
Dominant background subtraction
D.X. Lin (HIM) Measurements of Proton EM Form Factors in TL Region at BESIII 15 / 22
ISR-Tagged Background
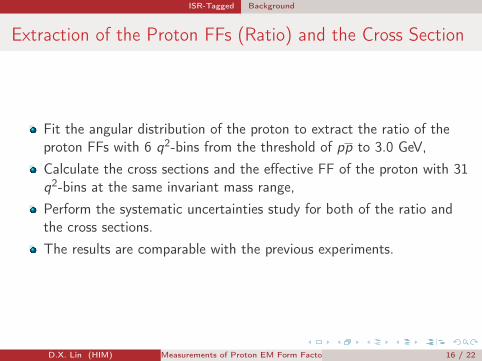
Extraction of the Proton FFs (Ratio) and the Cross Section
Fit the angular distribution of the proton to extract the ratio of theproton FFs with 6 q2-bins from the threshold of pp to 3.0 GeV,Calculate the cross sections and the effective FF of the proton with 31q2-bins at the same invariant mass range,Perform the systematic uncertainties study for both of the ratio andthe cross sections.The results are comparable with the previous experiments.
D.X. Lin (HIM) Measurements of Proton EM Form Factors in TL Region at BESIII 16 / 22

Energy Scan
The First Results of Proton FFs from R-Scan at BESIII
R-Scan data in 2012, limited lunimosity.The First results of e+e−→pp from R-Scan(PRD 91, 112004(2015)).To extract the Ratio (Rem) at 2.23, 2.4 and (3.05, 3.08) GeV.
directly. The expectation value, or moment, of cos2 θp,for a distribution following Eq. (7) is given by
hcos2θpi ¼1
Nnorm
Z2πα2βC
4scos2θp½ð1þ cos2θpÞjGMj2
þ 4m2p
sð1 − cos2θpÞjR2jGMj2�d cos θp: ð8Þ
Calculating this within the interval ½−0.8; 0.8� where theacceptance is nonzero and smooth, gives for the acceptancecorrection
R ¼ffiffiffiffiffiffiffiffiffiffiffiffiffiffiffiffiffiffiffiffiffiffiffiffiffiffiffiffiffiffiffiffiffiffiffiffiffiffiffiffiffiffiffiffiffiffiffiffiffiffiffiffiffis
4m2p
hcos2θpi − 0.243
0.108 − 0.648hcos2θpi
s; ð9Þ
and the corresponding uncertainty
σR ¼ 0.0741Rð0.167 − hcos2θiÞ2
s4m2
pσhcos2θpi; ð10Þ
where σhcos2θpi is given by
σhcos2θpi ¼ffiffiffiffiffiffiffiffiffiffiffiffiffiffiffiffiffiffiffiffiffiffiffiffiffiffiffiffiffiffiffiffiffiffiffiffiffiffiffiffiffiffiffiffiffiffiffiffiffiffiffiffiffiffiffiffi1
N − 1½hcos4θpi − hcos2θpi2�
r: ð11Þ
In the analysis of experimental data, hcos2θpi andhcos4θpi are the average of cos2 θp and cos4 θp which
are calculated by taking the detection efficiency event byevent into account:
hcos2;4θpi ¼ cos2;4θp ¼ 1
N
XNi¼1
cos2;4θpi=εi; ð12Þ
where εi is the detection efficiency with the ith event’skinematics as estimated by the MC simulation.The extracted jGE=GMj ratios and jGMj by MM at
different c.m. energies are also shown in Table IV, wherejGMj is calculated by Nnorm in Eq. (7) using the measuredjGE=GMj ratio. The results are well consistent with thoseextracted by fitting the distribution of the polar anglecos θp, and the statistical uncertainty is found to becomparable between the two different methods due tothe same number of events.
IV. SUMMARY
Using data at 12 c.m. energies between 2232.4 MeVand 3671.0 MeV collected with the BESIII detector, wemeasured the Born cross sections of eþe− → pp̄ andextracted the corresponding effective FF jGj under theassumption jGEj ¼ jGMj. The results are in good agree-ment with previous experiments. The precision of theBorn cross section with
ffiffiffis
p≤ 3.08 GeV is between 6.0%
and 18.9% which is much improved compared with thebest precision of previous results (between 9.4% and26.9%) from the BABAR experiment [15], and theprecision is comparable with those of previous resultsat
ffiffiffis
p> 3.08 GeV. The jGE=GMj ratios and jGMj were
extracted at the c.m. energiesffiffiffis
p ¼ 2232.4 and2400.0 MeV and with a combined data sample withc.m. energy of 3050.0, 3060.0 and 3080.0 MeV, withcomparable uncertainties to previous experiments. Themeasured jGE=GMj ratios are close to unity which areconsistent with those of the BABAR experiment in thesame q2 region. At present, the precision of the jGE=GMjratio is dominated by statistics. An MC simulation studyshows that the precision can achieve 10% or 3.0% if wehave a factor of 5 or 50 times higher integratedluminosity. In the near future, a new scan at BEPCIIwith c.m. energy ranging between 2.0 GeV and 3.1 GeVis foreseen to improve the precision of the measurementof the jGE=GMj ratio in a wide range.
TABLE V. Summary of systematic uncertainties (in %) in the jGE=GMj ratio and jGMj measurements.
Source jGE=GMj jGMjffiffiffis
p(MeV) 2232.4 2400.0 (3050.0,3080.0) 2232.4 2400.0 (3050.0,3080.0)
Background contamination 1.1 7.7 3.2 1.4 7.7 3.2Detection efficiency 2.3 1.1 4.2 2.3 1.1 4.2Fit range 4.6 11.0 22.1 4.6 11.0 22.1Total 5.3 13.5 22.7 5.3 13.5 22.7
)2 (GeV/cppM
2.0 2.2 2.4 2.6 2.8 3.0
|M
/GE
|G
0.0
0.2
0.4
0.6
0.8
1.0
1.2
1.4
1.6
1.82.0
BESIII
BaBar
PS170
FIG. 7 (color online). The measured ratio of electric tomagnetic FFs jGE=GMj at different c.m. energies from BESIII(filled circles), BABAR at SLAC (open crosses) and PS170 atLEAR/CERN (open circles).
MEASUREMENT OF THE PROTON FORM FACTOR BY … PHYSICAL REVIEW D 91, 112004 (2015)
112004-11
Ratio of Proton FFs
considering here, the Coulomb correction factor can besafely assumed to be 1. Furthermore, under the assumptionof the effective FF jGj ¼ jGEj ¼ jGMj and by integratingover θp, it can be deduced that
jGj ¼ffiffiffiffiffiffiffiffiffiffiffiffiffiffiffiffiffiffiffiffiffiffiffiffiffiffiffiffiffiffiffiffiffiffiffi
σBorn
86.83 · βs ð1þ2m2
p
s Þ
s; ð5Þ
where σBorn is in nb and mp, s are in GeV.Experimentally, the Born cross section of eþe− → pp̄ is
calculated by
σBorn ¼Nobs − Nbkg
L · ε · ð1þ δÞ ; ð6Þ
where Nobs is the observed number of candidate events,extracted by counting the number of signal events, Nbkg isthe expected number of background events estimated byMC simulations, L is the integrated luminosity estimatedwith large-angle Bhabha events, ε is the detection effi-ciency determined from a MC sample generated using the
CONEXC generator [30], which includes radiative correc-tions (which will be discussed in detail in the next para-graph), and ð1þ δÞ is the radiative correction factor whichhas also been determined using the CONEXC generator. Thederived Born cross section σBorn, the effective FF jGj, aswell as the related variables used to calculate σBorn areshown in Table II at different c.m. energies. In the table, theproduct value ε0 ¼ ε × ð1þ δÞ is presented to account forthe effective efficiency. Comparisons of σBorn and jGj to theprevious experimental measurements are shown in Fig. 5.Compared to the BABAR results [15], the precision of theBorn cross section is improved by 30% for data sets withffiffiffis
p≤ 3080.0 MeV, and the corresponding precision of
effective FF is improved, too.From Eq. (4), it is obvious that the detection efficiency
depends on the ratio of the electric and magnetic FFs,jGE=GMj, due to the different polar angle θp distributions.In this analysis, the detection efficiency is evaluated withthe MC samples. The ratio of jGE=GMj is measured for datasamples at c.m. energies
ffiffiffis
p ¼ 2232.4 and 2400.0 MeV,and for a combined data with subdata samples atffiffiffis
p ¼ 3050.0, 3060.0, and 3080.0MeV, which have similar
TABLE II. Summary of the Born cross section σBorn, the effective FF jGj, and the related variables used to calculate the Born crosssections at the different c.m. energies
ffiffiffis
p, where Nobs is the number of candidate events, Nbkg is the estimated background yield,
ε0 ¼ ε × ð1þ δÞ is the product of the detection efficiency ε and the radiative correction factor ð1þ δÞ, and L is the integrated luminosity.The first errors are statistical, and the second systematic.ffiffiffis
p(MeV) Nobs Nbkg ε0 (%) L (pb−1) σBorn (pb) jGj ð×10−2Þ
2232.4 614� 25 1 66.00 2.63 353.0� 14.3� 15.5 16.10� 0.32� 0.352400.0 297� 17 1 65.79 3.42 132.7� 7.7� 8.1 10.07� 0.29� 0.312800.0 53� 7 1 65.08 3.75 21.3� 3.0� 2.8 4.45� 0.31� 0.293050.0 91� 10 2 59.11 14.90 10.1� 1.1� 0.6 3.29� 0.17� 0.093060.0 78� 9 2 59.21 15.06 8.5� 1.0� 0.6 3.03� 0.17� 0.103080.0 162� 13 1 58.97 30.73 8.9� 0.7� 0.5 3.11� 0.12� 0.083400.0 2� 1 0 63.34 1.73 1.8� 1.3� 0.4 1.54� 0.55� 0.183500.0 5� 2 0 63.70 3.61 2.2� 1.0� 0.6 1.73� 0.39� 0.223550.7 24� 5 1 62.23 18.15 2.0� 0.4� 0.6 1.67� 0.17� 0.233600.2 14� 4 1 62.24 9.55 2.2� 0.6� 0.9 1.78� 0.25� 0.353650.0 36� 6 4 61.20 48.82 1.1� 0.2� 0.1 1.26� 0.11� 0.073671.0 6� 2 0 51.17 4.59 2.2� 0.9� 0.8 1.84� 0.37� 0.33
)2(GeV/cppM
2.2 2.4 2.6 2.8 3.0 3.2 3.4 3.6
Cro
ss s
ectio
n (p
b)
1
10
210
BESIII
BaBar
BESII
FENICE
CLEO
E760
E835
(a)
)2(GeV/cppM
2.2 2.4 2.6 2.8 3.0 3.2 3.4 3.6
For
m fa
ctor
-210
-110
BESIII
BaBar
BESII
FENICE
CLEO
E760
E835
(b)
FIG. 5 (color online). Comparison of (a) the Born cross section and (b) the effective FF jGj between this measurement and previousexperiments, shown on a logarithmic scale for invariant pp̄ masses from 2.20 to 3.70 GeV=c2.
M. ABLIKIM et al. PHYSICAL REVIEW D 91, 112004 (2015)
112004-8
The Proton Effective FF
D.X. Lin (HIM) Measurements of Proton EM Form Factors in TL Region at BESIII 17 / 22

Energy Scan
Energy Scan from 2.0 - 3.08 GeV at BESIII (Proposal)
Time-Like (from proposal) Space-LikeMpp L (pb−1) δGE
GE
δGMGM
δRemRem
√−q2 δRem
Rem
2.00 8.95 9.0% 3.0% 9.2% 1.99 10.8%2.10 10.8 10.0% 3.0% 10.0%2.20 13.0 11.0% 3.0% 9.5% 2.18 13.9%
2.3084 20.0 10.0% 3.0% 9.7% 2.27 14.9%2.3950 35.0 9.0% 3.0% 8.8% 2.35 31.9%2.644 65.0 16.0% 5.0% 14.6% 2.59 32.1%
2.9 100.0 25.0% 6.0% 24.0% 2.91 129.7%3.08 150.0 35.0% 8.5% 35.0%
Proposal studies with Babayaga (modification) Simulation,The relative error for the last point, 3.08 GeV, is estimated based onthe simulation of 2.9 GeV,To combine the last three energy points, 19% accuracy for Rem andGE , and 6% accuracy for GM would be achieved.NEW: accuracy in time-like region similar as for space-like.Data taking was finished on May 2015.D.X. Lin (HIM) Measurements of Proton EM Form Factors in TL Region at BESIII 18 / 22
Energy Scan
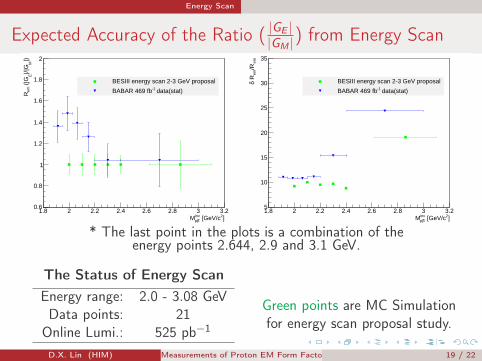
Expected Accuracy of the Ratio ( |GE ||GM |) from Energy Scan
]2 [GeV/cinvppM
1.8 2 2.2 2.4 2.6 2.8 3 3.2
|)M
|/|G
E (
|Gem
R
0.6
0.8
1
1.2
1.4
1.6
1.8
2
BESIII energy scan 2-3 GeV proposal
data(stat)-1BABAR 469 fb
]2 [GeV/cinvppM
1.8 2 2.2 2.4 2.6 2.8 3 3.2
em/R
em Rδ
5
10
15
20
25
30
35
BESIII energy scan 2-3 GeV proposal
data(stat)-1BABAR 469 fb
* The last point in the plots is a combination of theenergy points 2.644, 2.9 and 3.1 GeV.
The Status of Energy ScanEnergy range: 2.0 - 3.08 GeVData points: 21Online Lumi.: 525 pb−1
Green points are MC Simulationfor energy scan proposal study.
D.X. Lin (HIM) Measurements of Proton EM Form Factors in TL Region at BESIII 19 / 22

Conclusions
Conclusions and Outlook
Two methods to measure proton EM FFs at BESIII.
ISR analyses (tagged and untagged) above 3.773 GeV are in review,and the results are expected very soon.The expected accuracy of Rem will be comparable with BaBar fromISR analysis.
The first results of proton FFs from R-Scan was published in 2015.
The Energy Scan (2.0 - 3.08 GeV) data was collected in 2015.Data analysis for proton FFs with Energy Scan is ongoing.It will be the first time to measure the Rem, |GE | and |GM | in a wideenergy range in very narrow q2-bins.An accuracy between 9% - 15% can be achieved for the ratio (Rem)with Energy Scan data.
D.X. Lin (HIM) Measurements of Proton EM Form Factors in TL Region at BESIII 20 / 22
Conclusions
Thank You for Your Attention!
D.X. Lin (HIM) Measurements of Proton EM Form Factors in TL Region at BESIII 21 / 22

Backup
Backup
D.X. Lin (HIM) Measurements of Proton EM Form Factors in TL Region at BESIII 22 / 22