Measurements of CO, HCN, and C2H6 total columns in smoke ...
27
University of Wollongong Research Online Faculty of Science, Medicine and Health - Papers Faculty of Science, Medicine and Health 2013 Measurements of CO, HCN, and C2H6 total columns in smoke plumes transported from the 2010 Russian boreal forest fires to the Canadian high arctic C Viae University of Toronto K Strong University of Toronto C Paton-Walsh University of Wollongong, [email protected] J Mendonca University of Toronto N T. O'Neill Universite De Sherbrooke See next page for additional authors Research Online is the open access institutional repository for the University of Wollongong. For further information contact the UOW Library: [email protected] Publication Details Viae, C., Strong, K., Paton-Walsh, C., Mendonca, J., O'Neill, N. T. & Drummond, J. R. (2013). Measurements of CO, HCN, and C2H6 total columns in smoke plumes transported from the 2010 Russian boreal forest fires to the Canadian high arctic. Atmosphere- Ocean, 51 (5), 522-531.
Transcript of Measurements of CO, HCN, and C2H6 total columns in smoke ...
University of WollongongResearch Online
Faculty of Science, Medicine and Health - Papers Faculty of Science, Medicine and Health
2013
Measurements of CO, HCN, and C2H6 totalcolumns in smoke plumes transported from the2010 Russian boreal forest fires to the Canadianhigh arcticC ViatteUniversity of Toronto
K StrongUniversity of Toronto
C Paton-WalshUniversity of Wollongong, [email protected]
J MendoncaUniversity of Toronto
N T. O'NeillUniversite De Sherbrooke
See next page for additional authors
Research Online is the open access institutional repository for the University of Wollongong. For further information contact the UOW Library:[email protected]
Publication DetailsViatte, C., Strong, K., Paton-Walsh, C., Mendonca, J., O'Neill, N. T. & Drummond, J. R. (2013). Measurements of CO, HCN, andC2H6 total columns in smoke plumes transported from the 2010 Russian boreal forest fires to the Canadian high arctic. Atmosphere-Ocean, 51 (5), 522-531.
Measurements of CO, HCN, and C2H6 total columns in smoke plumestransported from the 2010 Russian boreal forest fires to the Canadian higharctic
AbstractIn August 2010, simultaneous enhancements of aerosol optical depth and total columns of carbon monoxide(CO), hydrogen cyanide (HCN), and ethane (C2H6) were observed at the Polar Environment AtmosphericResearch Laboratory (PEARL, 80.05°N, −86.42°W, 0.61 km above sea level, Eureka, Nunavut, Canada).Moderate Resolution Imaging Spectroradiometer (MODIS) hot spots, Ozone Monitoring Instrument (OMI)aerosol index maps, and Hybrid Single Particle Lagrangian Integrated Trajectory (HYSPLIT) back-trajectories were used to attribute these enhancements to an intense boreal fire event occurring in Russia. Aground-based Fourier Transform InfraRed (FTIR) spectrometer at PEARL provided vertically integratedmeasurements of trace gases transported in smoke plumes. We derived HCN and C2H6 equivalent emissionratios with respect to CO of 0.0054 ± 0.0022 and 0.0108 ± 0.0036, respectively, and converted them intoequivalent emission factors of 0.66 ± 0.27 g kg−1 and 1.47 ± 0.50 g kg−1 (in grams of gas per kilogram of drybiomass burnt, with one-sigma uncertainties). These emission factors add new observations to the relativelysparse datasets available and can be used to improve the simulation of biomass burning fire emissions inchemical transport models. These emission factors for the boreal forest are in agreement with the mean valuesrecently reported in a compilation study.
Keywordsrussian, boreal, forest, hcn, fires, canadian, columns, total, high, arctic, co, c2h6, smoke, plumes, transported,2010, measurements
DisciplinesMedicine and Health Sciences | Social and Behavioral Sciences
Publication DetailsViatte, C., Strong, K., Paton-Walsh, C., Mendonca, J., O'Neill, N. T. & Drummond, J. R. (2013).Measurements of CO, HCN, and C2H6 total columns in smoke plumes transported from the 2010 Russianboreal forest fires to the Canadian high arctic. Atmosphere-Ocean, 51 (5), 522-531.
AuthorsC Viatte, K Strong, C Paton-Walsh, J Mendonca, N T. O'Neill, and J R. Drummond
This journal article is available at Research Online: http://ro.uow.edu.au/smhpapers/1230
1
Measurements of CO, HCN and C2H6 total columns in smoke 1
plumes transported from the 2010 Russian boreal forest fires to the 2
Canadian high Arctic 3
C. Viatte1, K. Strong
1, C. Paton-Walsh
2, J. Mendonca
1, N. T. O’Neill
3, J. R. Drummond
4,1 4
1 Department of Physics, University of Toronto, Toronto, Ontario, Canada.
2 Department of Chemistry, University of Wollongong, Wollongong, New South Wales, Australia.
3 Centre for Research and Applications in Remote Sensing, Université de Sherbrooke, Sherbrooke, Quebec, Canada. 5
4 Department of Physics and Atmospheric Sciences, Dalhousie University, Halifax, Canada. 6
7
Abstract 8
In August 2010, simultaneous enhancements of aerosol optical depth and total columns of carbon 9
monoxide (CO), hydrogen cyanide (HCN), and ethane (C2H6) were observed at the Polar 10
Environment Atmospheric Research Laboratory (PEARL, 80.05°N, -86.42°W, 0.61 km above 11
sea level, Eureka, Nunavut, Canada). Moderate Resolution Imaging Spectroradiometer (MODIS) 12
hot spots, Ozone Monitoring Instrument (OMI) aerosol index maps and HYSPLIT back-13
trajectories were used to attribute these enhancements to an intense boreal fire event occurring in 14
Russia. A ground-based Fourier Transform InfraRed (FTIR) spectrometer at PEARL provides 15
vertically integrated measurements of trace gases transported in smoke plumes. We derived HCN 16
and C2H6 equivalent emission ratios with respect to CO of 0.0054±0.0022 and 0.0108±0.0036, 17
respectively, and converted them into equivalent emission factors of 18
0.66±0.27 g kg-1
and 1.47±0.50 g kg-1
(in grams of gas per kg of dry biomass burnt, with one-19
sigma uncertainties). These emission factors add new observations to the relatively sparse 20
datasets available, and can be used to improve the simulation of biomass burning fire emissions 21
2
in chemical transport models. These emission factors for the boreal forest are in agreement with 22
the mean values recently reported in a compilation study. 23
keywords : atmosphere, FTIR measurements, Arctic, biomass burning, boreal fire, emission 24
factors. 25
I) Introduction 26
Fires release considerable amounts of radiatively and photochemically active trace gases, such as 27
carbon monoxide (CO), hydrogen cyanide (HCN), and ethane (C2H6), as well as aerosols (IPCC, 28
2007; Zhao et al., 2002). Biomass burning has been suggested as an important source of Arctic 29
pollution: boreal fires in Siberia, Canada, and Alaska represent a major perturbation to the Arctic 30
atmosphere in summer, affecting the carbon cycle (Preston and Schmidt, 2006), climate (Amiro 31
et al., 2001), air quality (Colarco et al., 2004), and land ecology (Soja et al., 2007). Several 32
studies have identified biomass burning pollution transport to the Arctic on the basis of model 33
simulations (e.g., Shindell et al., 2008) and aerosol observations (e.g., Saha et al., 2010), but our 34
ability to observe fire plumes in term of vertically integrated chemical composition has been 35
limited. The Polar Environment Atmospheric Research Laboratory (PEARL) located at Eureka, 36
Nunavut, Canada is appropriately situated for sampling the outflow of boreal biomass burning 37
pollution over the Arctic region and is equipped with a Fourier Transform InfraRed (FTIR) 38
spectrometer and a sunphotometer to measure trace gases and aerosols, respectively. To quantify 39
the atmospheric impact of biomass burning in chemical transport models, emission factors of 40
trace gases must be implemented accurately, but those factors are highly variable because they 41
depend on the types of vegetation burned, the combustion phase (smoldering and flaming), and 42
on atmospheric conditions at the time of the fire events (Paton-Walsh et al., 2004, 2005, 2010; 43
3
Vigouroux et al., 2012). Considering their long lifetimes, HCN and C2H6 are considered to be 44
tracers of pollution transport such as that found in biomass burning plumes. Within the past 45
decade, measurements of emission factors of HCN and C2H6 have led to a wide range of values, 46
which may be due to the natural variability of the emissions and/or the discrepancies between 47
sampling methods (laboratory, airborne, satellite, and ground-based measurements) that 48
overestimates or underestimates the combustion phases (smoldering and flaming). Andreae and 49
Merlet (2001) stressed the need for more measurements of HCN emission factors given its value 50
as biomass burning tracer (Li et al., 2000). Concerning C2H6, recent work shows that biomass 51
fires emit more Non Methane Hydrocarbons (including ethane) than previously thought and that 52
may improve the chemical model performance (Akagi et al., 2011). 53
That is why, in this study, precise FTIR measurements of trace gas columns inside smoke plumes 54
are used to assess emission factors in order to add new observations to the sparse datasets that 55
have been reported and compiled in the literature (Andreae and Merlet, 2001; Akagi et al., 2011). 56
2) Measurements and analysis 57
a) FTIR measurements 58
The FTIR spectrometer (a Bruker IFS 125HR) located at PEARL and operational since August 59
2006, is part of the Network for the Detection of Atmospheric Composition Change (NDACC, 60
http://www.ndsc.ncep.noaa.gov/) and the Total Carbon Column Observing Network (TCCON, 61
http://www.tccon.caltech.edu/). Trace gas columns such as biomass burning products CO, HCN, 62
and C2H6 are derived from individual solar absorption spectra in the middle infrared region for 63
NDACC (2057.7-2159.3 cm-1
for CO, 3268.0-3287.5 cm-1
for HCN, and 2976.6-2987.0 cm-1
for 64
C2H6) and in the near infrared region for TCCON (4233-4290 cm-1
for CO) (Bachelor et al., 65
4
2009; Lindenmaier, 2012). NDACC and TCCON measurements are made successively because 66
beamsplitters have to be changed for acquisition. The HITRAN 2008 line parameters (Rothman 67
et al., 2009) were used in both the NDACC and TCCON analysis and all the interfering species 68
inside these micro-windows were scaled from a priori profiles. 69
For the NDACC measurements, total columns of all three molecules are retrieved using the 70
iterative fitting algorithm SFIT2 (Rinsland et al., 1998) based on the Optimal Estimation Method 71
(OEM) of Rodgers (2000), with a priori Volume Mixing Ratio (VMR) profiles for every gas 72
based on the mean of a 40-year run (1980-2020) from the Whole Atmosphere Chemistry Climate 73
Model (WACCM, v5, Eyring et al. (2007)) for Eureka (J. Hannigan, NCAR, personal 74
communication). The retrieved vertical profiles are obtained on a 48-level altitude grid (from 75
0.61 to 120 km). Total columns are then derived by vertically integrating retrieved profiles. Total 76
columns are then derived by vertically integrating retrieved profiles. The diagonal elements of 77
the a priori covariance matrix are used as a tuning parameter, i.e. they are optimized empirically 78
to stabilize the retrievals and maximize the spectral information. We used 50%, 20% and 30% as 79
the one sigma variability to generate the diagonal elements of the covariance matrix for HCN, 80
CO and C2H6 respectively. These values are consistent with the natural tropospheric variabilities 81
derived from the WACCM model. Full error analysis is performed following the formalism of 82
Rodgers (2000), and can be divided into three different error sources: the smoothing error 83
expressing the uncertainty due to the limited vertical resolution of the retrieval, the forward 84
model parameter error, and the measurement noise error. Typical total uncertainties on total 85
columns (including smoothing, temperature, and measurement errors, spectroscopic line width 86
and line intensity uncertainties, and solar zenith angle error, added in quadrature) are 2.5%, 87
9.0%, and 3.5% for CO, HCN, and C2H6, respectively. Average degrees of freedom for signal, 88
5
over the 2007 to 2011 period, are 2.8, 1.6, and 1.9 for CO, HCN, and C2H6 total columns, 89
respectively. For the TCCON retrievals of CO, the GFIT non-linear least-square fitting algorithm 90
is used to scale a priori VMR profiles, which are derived from ACE-FTS climatology, in order to 91
generate the best spectral fit, with a total column error of 2% (Wunch et al., 2011). During the 92
fire event of August 2010, 61 individual middle infrared spectra were recorded through the 93
smoke plume from August 9th
to 30th
, 2010 and 41 near infrared spectra recorded on August 23rd
94
confirmed the rapid enhancement of CO columns on that day. Smoke aerosol is not explicitly 95
included in the spectral fits given that any spectral signatures will be broad compare to the 96
narrow fitting micro-windows. Both NDACC and TCCON spectra and fits have to satisfy quality 97
filters based on signal-to-noise ratios, baseline distortions, fitting residuals. This ensures to 98
optimize the quality of all measurements and retrievals. 99
b) Aerosol measurements 100
Spectral solar irradiance and almucantar radiance is measured by a Cimel sunphotometer/sky 101
radiometer belonging to the AEROCAN/AERONET networks (AEROCAN is a federated 102
Canadian subnetwork of the worldwide, NASA-led AERONET network, 103
http://aeronet.gsfc.nasa.gov/cgi-bin/). It is located at PEARL and has been operational since 104
March 2007. The Cimel instrument, as well as AERONET measurement protocols, are 105
described by Holben et al. (1998). The PEARL Aerosol Optical Depths (AODs) are acquired in a 106
high-frequency (3-minute) temporal mode. Total, fine, and coarse mode AODs at 500 nm are 107
retrieved using the Spectral Deconvolution Algorithm (SDA, AERONET Version 2.0) of O’Neill 108
et al. (2003). We used level 2.0 AERONET to ensure data quality control. 109
c) IASI satellite measurements 110
6
Global CO concentrations are retrieved daily from space-borne Infrared Atmospheric Sounding 111
Interferometer (IASI) radiance spectra using the Fast Optimal Retrievals on Layers for IASI 112
(FORLI) software (Clerbaux et al., 2009; Hurtmans et al., 2012). The quality of IASI FORLI-CO 113
retrievals has been evaluated for highly polluted conditions due to wildfires (Turquety et al., 114
2009) and recently by comparing with NDACC FTIR measurements (Kerzenmacher et al., 115
2012). Data are available at ether.ipsl.jussieu.fr/php/test2.php. 116
d) Calculation of emission factors 117
Trace gas concentrations within smoke plumes vary rapidly with time, so a common way of 118
deriving an emission factor is to measure the emission ratio of the target chemical species 119
relative to a reference species, which is often CO2 or CO (Hurst et al., 1994). Here we use CO as 120
the reference since variations of CO2 concentration are difficult to measure with sufficient 121
accuracy. Because the emission ratio is not measured here at the source of the fire, it is more 122
accurately called an “enhancement ratio”. These ratios are derived from the regression slope of a 123
given trace gas total column versus that of CO. 124
For comparison with previous studies, our enhancement ratios (i.e, equivalent emission ratios) 125
have been converted into equivalent emission factors using (Andreae and Merlet, 2001): 126
��� � ���� �⁄ � � �� ��⁄ � ��� (1) 127
where EFx is the emission factor for trace gas X in grams of gas per kg of dry biomass burnt; 128
ER(x/CO) is the molar emission ratio of trace gas X with respect to CO; MWx is the molecular 129
weight of trace gas X; MWCO is the molecular weight of CO, and EFCO is the emission factor of 130
CO. 131
7
In this study, a values of EFCO of 127±45 g kg-1
and 107±37 g kg-1
for dry matter based on Akagi 132
et al. (2011) and Andreae and Merlet (2001) are taken as the mean emission factor for CO for 133
boreal and extratropical forests, since it is the fuel type of the source fires which were burning. 134
Uncertainties on the measured EFCO are calculated by taking into account the large uncertainty in 135
the CO emission factor (more than 35%) and the uncertainty in the calculated regression slope 136
(7.9% and 5.0% for HCN and C2H6, respectively), as well as the total uncertainties of the 137
retrievals, all combined in quadrature (Paton-Walsh et al., 2005). 138
3) Measurement of biomass burning products 139
a) Trace gas total columns and AODs at Eureka in August 2010 140
Figure 1a presents the time series of the FTIR CO (both TCCON and NDACC), HCN and C2H6 141
total columns, from the 9th
to the 30th
of August 2010, where simultaneous enhancement of the 142
three biomass burning species, with a sharp increase on August 23rd
(yellow box) and persistent 143
elevated concentrations from that day to the 29th
, can be seen. Focusing on August 23rd
, Figure 144
1b shows that the CO total columns measured by the FTIR increase from 1.8x10¹⁸
145
molecules cm-2
at 15:00 UT to 2.1x10¹⁸
molecules cm-2
at 22:00 UT on that day. Furthermore, 146
Figure 1c shows the IASI CO total column distribution over the Eureka area on August 23rd
, 147
where a local enhancement of CO is clearly observed. The IASI higher CO total columns may be 148
due to the potential bias of the thermal emission instrument sensitivity, which is higher in 149
summer. In addition, Figure 1b shows that fine-mode AODs increase throughout that day 150
whereas coarse-mode AODs remain constant. This suggests the presence of a smoke plume 151
inasmuch as fine-mode AODs can be traced to fire events, whereas coarse-mode AODs are 152
characteristic of thin homogeneous clouds, marine aerosols, ash and/or dust in the atmosphere. 153
8
This event is significant but rather weak in terms of smoke-induced, fine-mode AOD variation at 154
Eureka; the variation, < 0.04, is comparable to late-spring / summertime observations made by 155
O’Neill et al. (2008) but significantly less than the strong springtime smoke events observed by 156
Saha et al. (2010) during the ARCTAS campaign of 2008. 157
b) Origin and path of the plume 158
During summer 2010, intense drought and high temperatures, led to several hundred wildfires 159
over Russia. Indeed, July 2010 was considered the warmest month in Moscow since the 160
beginning of modern meteorological recording 130 years ago. The total vegetated area (forest, 161
vegetation and peat land) affected by wildfires on Russian territory reached around five million 162
hectares by early August 2010, leading to a total CO emission between 34 and 40 Tg CO during 163
July and August 2010 [Yurganov et al., 2011]. MODIS and Multi-angle Imaging 164
Spectroradiometer (MISR) images indicate that smoke extended over about 3,000 km (from east 165
to west) in early August and sometimes reached altitudes of 12 km, an altitude at which the 166
plume may travel long distances to affect air quality far away. 167
Figure 2 is a graphical ensemble of evidence illustrating the origin and path of the plume that 168
reached PEARL during August 2010. According to HYSPLIT back-trajectories (Figure 2a), air 169
masses that arrived on August 24th
at PEARL (at 5, 7 and 9 km altitude, 170
http://ready.arl.noaa.gov/hysplit-bin/) originated in Russia nine days earlier, where red dots 171
(Figure 2b) represent the 10-day (August 9th
-18th
) average of fire hot spots identified by the 172
MODIS instrument (http://lance-modis.eosdis.nasa.gov/cgi-bin/imagery/firemaps.cgi). To 173
support this idea, a MODIS image (Figure 2c) taken on August 15th
at 9:00 UT has been 174
superimposed on the trajectory plot (yellow box). One can see that all three dots (red, blue and 175
9
green, Figure 2c), representing the air mass locations at the same time as the MODIS image, are 176
inside a fire area (red dot) or close to the smoke plume. Additional evidence of intense fire 177
events in the Moscow area is illustrated in Figures 2d, which presents high values of UV aerosol 178
index derived from OMI measurements (http://gdata1.sci.gsfc.nasa.gov/daac-bin/) in the same 179
fire region (yellow box) and for the same day. Back-trajectories for the beginning of August 180
2010 confirm that Russian fire affected atmospheric composition at Eureka but are not shown 181
here since their patterns are less clear that the ones for August 24th
. 182
4) Results 183
a) Trace gas correlations 184
The HCN total columns from the 9th
to the 30th
August 2010 are enhanced by more than 50% 185
compared to the four-year (2008-2011) monthly mean of 5.24x10¹⁵
molecules.cm-2
for August 186
measurements at PEARL. Also, all August 2010 measurements (red dots, Figures 3a and 3c) 187
give a similar slope in the correlation plots, therefore all these data (from the 9th
to the 30th
of 188
August) are considered to be fire-affected. 189
The C2H6 total columns have been plotted against CO (NDACC-only) for all (1447) spectra 190
recorded in 2010 (Figure 3a, black) and those for the fire period of August 2010 (Figure 3a, red). 191
Columns of C2H6 and CO are correlated over the year due to their common sink via reaction with 192
OH (Rinsland et al., 1998, 1999, 2000), therefore the seasonal variability of these molecules is 193
identical throughout the year, with maxima in winter-spring (February-March) and minima in 194
summer-fall (August-September) (Zhao et al., 2002). However, the correlation slope for the 195
August columns differs from the annual one. The high correlation (R = 0.94) between C2H6 and 196
CO total columns is consistent for all 58 spectra recorded during the fire period (Figure 3b). 197
10
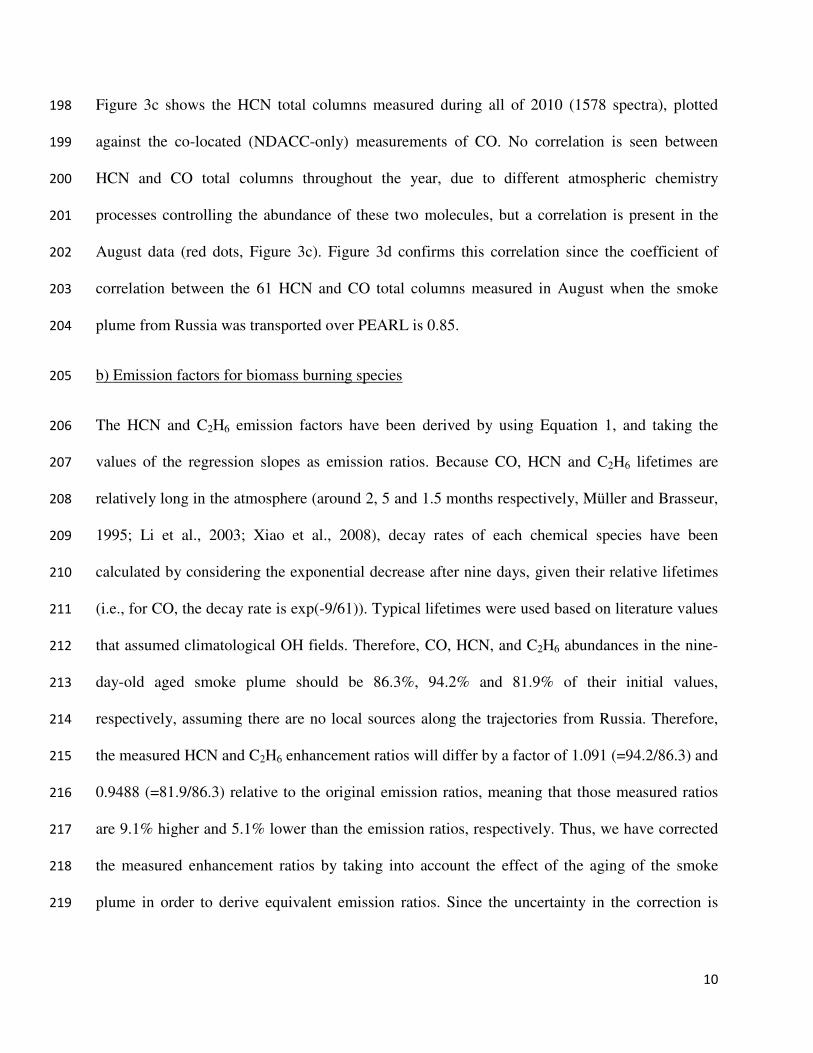
Figure 3c shows the HCN total columns measured during all of 2010 (1578 spectra), plotted 198
against the co-located (NDACC-only) measurements of CO. No correlation is seen between 199
HCN and CO total columns throughout the year, due to different atmospheric chemistry 200
processes controlling the abundance of these two molecules, but a correlation is present in the 201
August data (red dots, Figure 3c). Figure 3d confirms this correlation since the coefficient of 202
correlation between the 61 HCN and CO total columns measured in August when the smoke 203
plume from Russia was transported over PEARL is 0.85. 204
b) Emission factors for biomass burning species 205
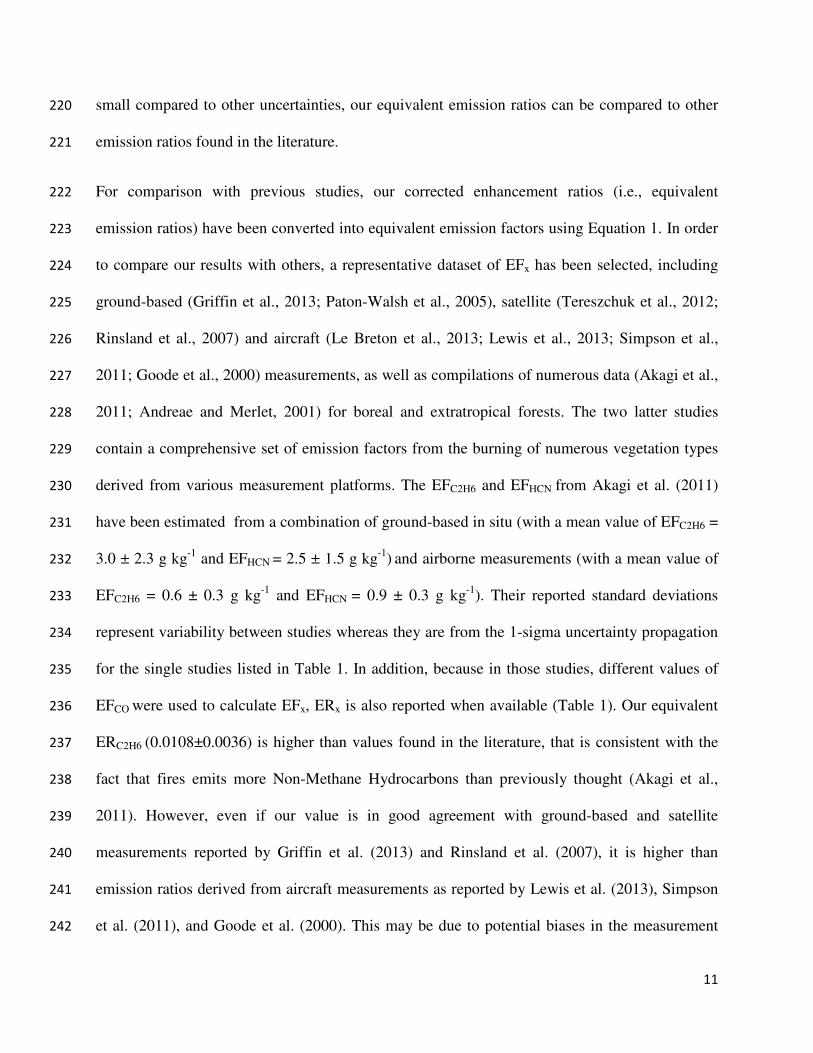
The HCN and C2H6 emission factors have been derived by using Equation 1, and taking the 206
values of the regression slopes as emission ratios. Because CO, HCN and C2H6 lifetimes are 207
relatively long in the atmosphere (around 2, 5 and 1.5 months respectively, Müller and Brasseur, 208
1995; Li et al., 2003; Xiao et al., 2008), decay rates of each chemical species have been 209
calculated by considering the exponential decrease after nine days, given their relative lifetimes 210
(i.e., for CO, the decay rate is exp(-9/61)). Typical lifetimes were used based on literature values 211
that assumed climatological OH fields. Therefore, CO, HCN, and C2H6 abundances in the nine-212
day-old aged smoke plume should be 86.3%, 94.2% and 81.9% of their initial values, 213
respectively, assuming there are no local sources along the trajectories from Russia. Therefore, 214
the measured HCN and C2H6 enhancement ratios will differ by a factor of 1.091 (=94.2/86.3) and 215
0.9488 (=81.9/86.3) relative to the original emission ratios, meaning that those measured ratios 216
are 9.1% higher and 5.1% lower than the emission ratios, respectively. Thus, we have corrected 217
the measured enhancement ratios by taking into account the effect of the aging of the smoke 218
plume in order to derive equivalent emission ratios. Since the uncertainty in the correction is 219
11
small compared to other uncertainties, our equivalent emission ratios can be compared to other 220
emission ratios found in the literature. 221
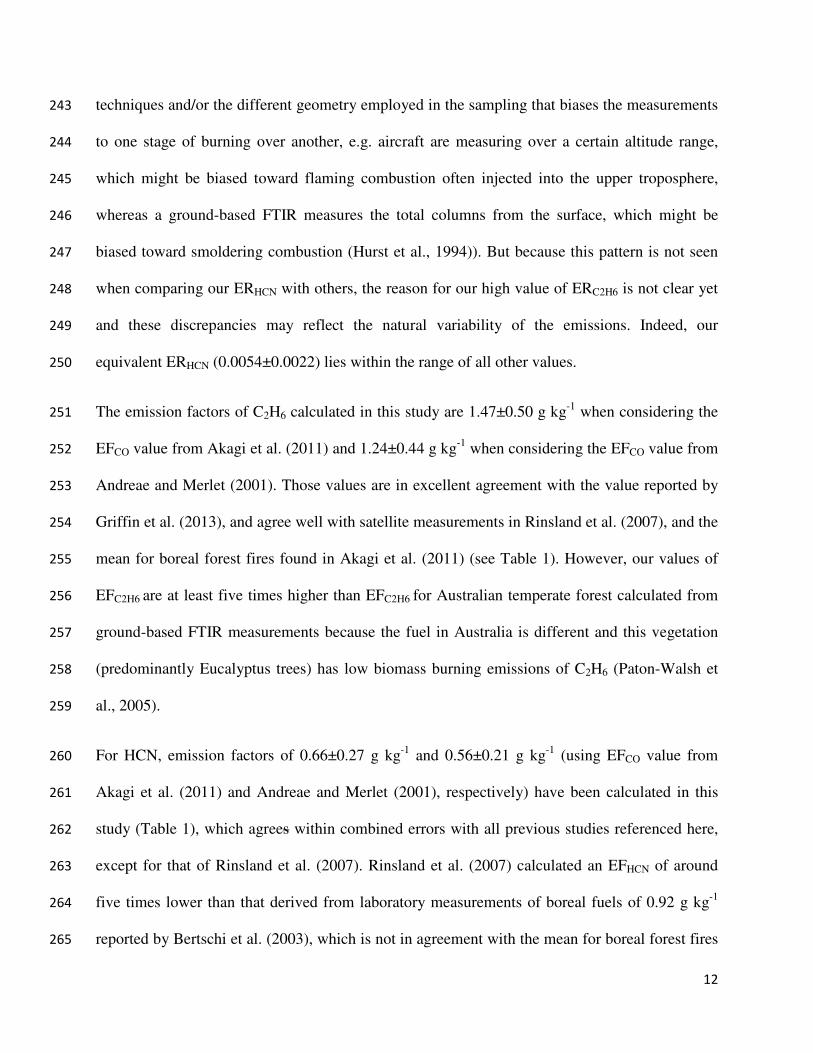
For comparison with previous studies, our corrected enhancement ratios (i.e., equivalent 222
emission ratios) have been converted into equivalent emission factors using Equation 1. In order 223
to compare our results with others, a representative dataset of EFx has been selected, including 224
ground-based (Griffin et al., 2013; Paton-Walsh et al., 2005), satellite (Tereszchuk et al., 2012; 225
Rinsland et al., 2007) and aircraft (Le Breton et al., 2013; Lewis et al., 2013; Simpson et al., 226
2011; Goode et al., 2000) measurements, as well as compilations of numerous data (Akagi et al., 227
2011; Andreae and Merlet, 2001) for boreal and extratropical forests. The two latter studies 228
contain a comprehensive set of emission factors from the burning of numerous vegetation types 229
derived from various measurement platforms. The EFC2H6 and EFHCN from Akagi et al. (2011) 230
have been estimated from a combination of ground-based in situ (with a mean value of EFC2H6 = 231
3.0 ± 2.3 g kg-1
and EFHCN = 2.5 ± 1.5 g kg-1
) and airborne measurements (with a mean value of 232
EFC2H6 = 0.6 ± 0.3 g kg-1
and EFHCN = 0.9 ± 0.3 g kg-1
). Their reported standard deviations 233
represent variability between studies whereas they are from the 1-sigma uncertainty propagation 234
for the single studies listed in Table 1. In addition, because in those studies, different values of 235
EFCO were used to calculate EFx, ERx is also reported when available (Table 1). Our equivalent 236
ERC2H6 (0.0108±0.0036) is higher than values found in the literature, that is consistent with the 237
fact that fires emits more Non-Methane Hydrocarbons than previously thought (Akagi et al., 238
2011). However, even if our value is in good agreement with ground-based and satellite 239
measurements reported by Griffin et al. (2013) and Rinsland et al. (2007), it is higher than 240
emission ratios derived from aircraft measurements as reported by Lewis et al. (2013), Simpson 241
et al. (2011), and Goode et al. (2000). This may be due to potential biases in the measurement 242
12
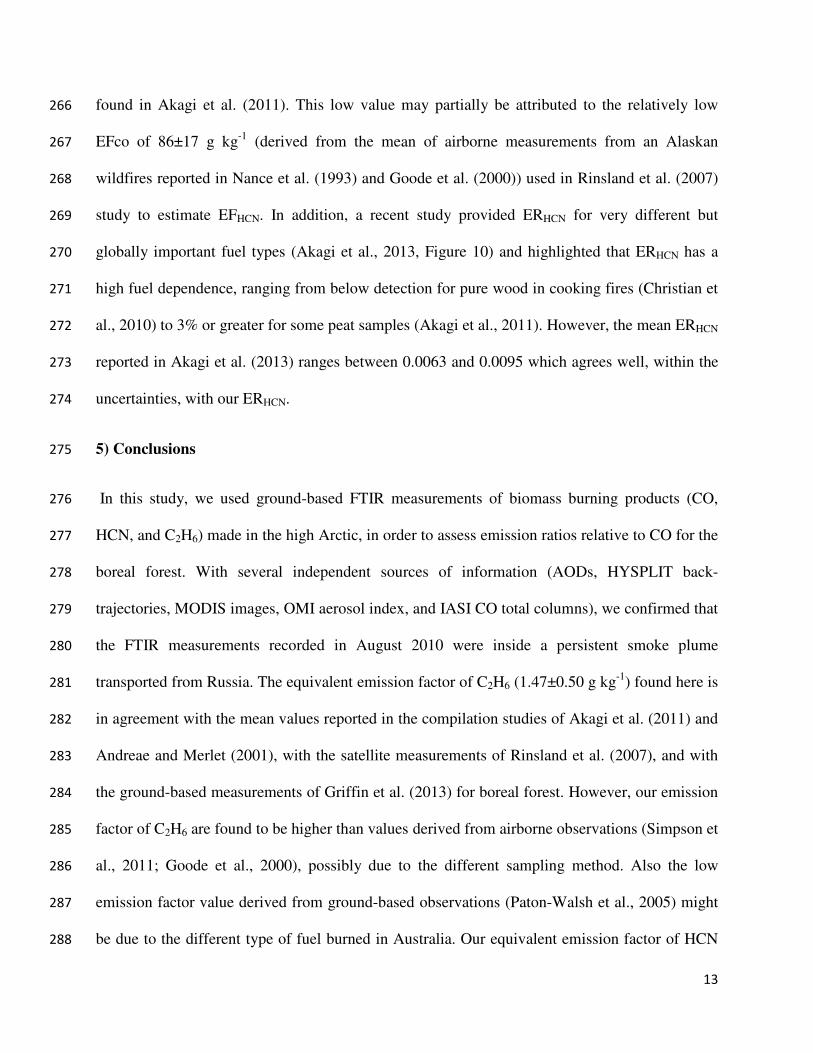
techniques and/or the different geometry employed in the sampling that biases the measurements 243
to one stage of burning over another, e.g. aircraft are measuring over a certain altitude range, 244
which might be biased toward flaming combustion often injected into the upper troposphere, 245
whereas a ground-based FTIR measures the total columns from the surface, which might be 246
biased toward smoldering combustion (Hurst et al., 1994)). But because this pattern is not seen 247
when comparing our ERHCN with others, the reason for our high value of ERC2H6 is not clear yet 248
and these discrepancies may reflect the natural variability of the emissions. Indeed, our 249
equivalent ERHCN (0.0054±0.0022) lies within the range of all other values. 250
The emission factors of C2H6 calculated in this study are 1.47±0.50 g kg-1
when considering the 251
EFCO value from Akagi et al. (2011) and 1.24±0.44 g kg-1
when considering the EFCO value from 252
Andreae and Merlet (2001). Those values are in excellent agreement with the value reported by 253
Griffin et al. (2013), and agree well with satellite measurements in Rinsland et al. (2007), and the 254
mean for boreal forest fires found in Akagi et al. (2011) (see Table 1). However, our values of 255
EFC2H6 are at least five times higher than EFC2H6 for Australian temperate forest calculated from 256
ground-based FTIR measurements because the fuel in Australia is different and this vegetation 257
(predominantly Eucalyptus trees) has low biomass burning emissions of C2H6 (Paton-Walsh et 258
al., 2005). 259
For HCN, emission factors of 0.66±0.27 g kg-1
and 0.56±0.21 g kg-1
(using EFCO value from 260
Akagi et al. (2011) and Andreae and Merlet (2001), respectively) have been calculated in this 261
study (Table 1), which agrees within combined errors with all previous studies referenced here, 262
except for that of Rinsland et al. (2007). Rinsland et al. (2007) calculated an EFHCN of around 263
five times lower than that derived from laboratory measurements of boreal fuels of 0.92 g kg-1
264
reported by Bertschi et al. (2003), which is not in agreement with the mean for boreal forest fires 265
13
found in Akagi et al. (2011). This low value may partially be attributed to the relatively low 266
EFco of 86±17 g kg-1
(derived from the mean of airborne measurements from an Alaskan 267
wildfires reported in Nance et al. (1993) and Goode et al. (2000)) used in Rinsland et al. (2007) 268
study to estimate EFHCN. In addition, a recent study provided ERHCN for very different but 269
globally important fuel types (Akagi et al., 2013, Figure 10) and highlighted that ERHCN has a 270
high fuel dependence, ranging from below detection for pure wood in cooking fires (Christian et 271
al., 2010) to 3% or greater for some peat samples (Akagi et al., 2011). However, the mean ERHCN 272
reported in Akagi et al. (2013) ranges between 0.0063 and 0.0095 which agrees well, within the 273
uncertainties, with our ERHCN. 274
5) Conclusions 275
In this study, we used ground-based FTIR measurements of biomass burning products (CO, 276
HCN, and C2H6) made in the high Arctic, in order to assess emission ratios relative to CO for the 277
boreal forest. With several independent sources of information (AODs, HYSPLIT back-278
trajectories, MODIS images, OMI aerosol index, and IASI CO total columns), we confirmed that 279
the FTIR measurements recorded in August 2010 were inside a persistent smoke plume 280
transported from Russia. The equivalent emission factor of C2H6 (1.47±0.50 g kg-1
) found here is 281
in agreement with the mean values reported in the compilation studies of Akagi et al. (2011) and 282
Andreae and Merlet (2001), with the satellite measurements of Rinsland et al. (2007), and with 283
the ground-based measurements of Griffin et al. (2013) for boreal forest. However, our emission 284
factor of C2H6 are found to be higher than values derived from airborne observations (Simpson et 285
al., 2011; Goode et al., 2000), possibly due to the different sampling method. Also the low 286
emission factor value derived from ground-based observations (Paton-Walsh et al., 2005) might 287
be due to the different type of fuel burned in Australia. Our equivalent emission factor of HCN 288
14
(0.66 ± 0.27 g kg-1
) is in agreement with all studies referenced here (Akagi et al., 2011; Andreae 289
and Merlet, 2001; Simpson et al., 2011; Paton-Walsh et al., 2005), with the exception of 290
Rinsland et al. (2007), who reported a lower value that might describe the real variability of 291
HCN emission (Akagi et al., 2013). Given the large range of values found in the literature, these 292
new measurements add new observations to the sparse dataset of emission factors that have been 293
reported and compiled in the literature. Future work will focus on the detection of other fire 294
events, as well as retrieval of other trace gases from smoke spectra recorded at Eureka. 295
Acknowledgments: The PEARL Bruker 125HR and sunphotometer measurements at Eureka 296
were made by CANDAC, which has been supported by the AIF/NSRIT, CFI, CFCAS, CSA, EC 297
(including operational support of Ihab Abboud for AEROCAN), Government of Canada IPY 298
funding, NSERC, OIT, ORF, PCSP, and FQRNT. The authors wish to thank the staff at the 299
Eureka weather station and CANDAC for the logistical and on-site support provided. Thanks to 300
Rodica Lindenmaier, Rebecca Batchelor, PEARL Site Manager Pierre Fogal, and 301
CANDAC/PEARL operators Ashley Harrett, Alexei Khmel, Paul Loewen, Keith MacQuarrie, 302
Oleg Mikhailov, and Matt Okraszewski, for their invaluable assistance in maintaining the Bruker 303
125HR and for taking measurements. Matthieu Pommier and the ETHER French atmospheric 304
database are acknowledged for providing the IASI data. The authors also acknowledge NOAA-305
ARL for access to the HYSPLIT trajectory model, and NASA for its MODIS, and OMI imagery 306
products available from their Rapidfire website and from the Giovanni online data system, 307
developed and maintained by the NASA GES DISC. The visit of C. Paton-Walsh to the UofT to 308
collaborate on this study was funded by the ARC as part of the project DP110101948. 309
References: 310
15
Amiro, B. D., J. B. Todd, B. M. Wotton, K. A. Logan, M. D. Flannigan, B. J. Stocks, J. A. 311
Mason, D. L. Martell, and K. G. Hirsh (2001), Direct carbon emissions from Canadian forest 312
fires, 1959-1999, Can. J. For., Res., 31, 512–525, doi:10.1139/x2012-104. 313
Andreae, M. O., and P. Merlet (2001), Emission of trace gases and aerosols from biomass 314
burning, Global Biogeochem. Cy., 15, 955–966, doi:10.1029/2000GB001382. 315
Akagi, S. K., R. J. Yokelson, C. Wiedinmyer, M. J. Alvarado, J. S. Reid, T. Karl, J. D. Crounse, 316
and P. O. Wennberg (2011), Emission factors for open and domestic biomass burning for use in 317
atmospheric models, Atmos. Chem. Phys., 11, 4039–4072, doi:10.5194/acp-11-4039-2011. 318
Akagi, S. K., et al. (2013), Measurements of reactive trace gases and variable O3 formation rates 319
in some South Carolina biomass burning plumes, Atmos. Chem. Phys., 13, 1141–1165, 320
doi:10.5194/acp-13-1141-2013. 321
Batchelor, R. L., K. Strong, R. L. Lindenmaier, R. Mittermeier, H. Fast, J. R. Drummond, and P. 322
F. Fogal (2009), A new Bruker IFS 125HR FTIR spectrometer for the Polar Environment 323
Atmospheric Research Laboratory at Eureka, Canada - measurements and comparison with the 324
existing Bomem DA8 spectrometer, J. Atmos. Oceanic Technol., 26, 1328–1340, 325
doi:10.1175/2009JTECHA1215.1. 326
Bertschi, I., R. J. Yokelson, D. E. Ward, R. E. Babbitt, R. A. Susott, J. G. Goode, and W. M. Hao 327
(2003), Trace gas and particle emissions from fires in large diameter and below ground biomass 328
fuels, J. Geophys. Res., 108(D13), 8472, doi:10.1029/2002JD002100. 329
Colarco, P. R., M. R. Schoeberl, B. G. Doddridge, L. T. Marufu, O. Torres, and E. J. Welton 330
(2004), Transport of smoke from Canadian forest fires to the surface near Washington, D.C.: 331
16
Injection height, entrainment, and optical properties, J. Geophys. Res., 109(D6), D06203, doi: 332
10.1029/2003JD004248. 333
Christian, T. J., et al. (2010), Trace gas and particle emissions from domestic and industrial 334
biofuel use and garbage burning in central Mexico, Atmos. Chem. Phys., 10, 565–584, 335
doi:10.5194/acp10-565-2010. 336
Eyring, V., et al. (2007), Multimodel projections of stratospheric ozone in the 21st century, J. 337
Geophys. Res., 112, D16303, doi:10.1029/2006JD008332. 338
Goode, J. G., R. J. Yokelson, D. E. Ward, R. A. Susott, R. E. Babbitt, M. A. Davies, and W. M. 339
Hao (2000), Measurements of excess O3, CO2, CO, CH4, C2H4, C2H2, HCN, NO, NH3, HCOOH, 340
CH3COOH, HCHO, and CH3OH in 1997 Alaskan biomass burning plumes by airborne Fourier 341
transform infrared spectroscopy (AFTIR), J. Geophys. Res., 105(D17), 22147–22166, 342
doi:10.1029/2000JD900287. 343
Griffin, D., et al. (2013), Investigation of CO, C2H6 and aerosols in a boreal fire plume over 344
eastern Canada during BORTAS 2011 using ground- and satellite-based observations, and model 345
simulations, Atmos. Chem. Phys. Discuss., 13, 11071–11109, doi:10.5194/acpd-13-11071-2013. 346
Holben, B. N., et al. (1998), AERONET – A federated instrument network and data archive for 347
aerosol characterization, Rem. Sens. Environ., 66, 1–16. 348
Hurtmans, D., P.-F. Coheur, C. Wespes, L. Clarisse, O. Scharf, C. Clerbaux, J. Hadji-Lazaro, M. 349
George, and S. Turquety (2012), FORLI radiative transfer and retrieval code for IASI, J. Quant. 350
Spectrosc. Ra., 113, 1391–1408, doi:10.1016/j.jqsrt.2012.02.036. 351
17
Hurst, D. F., D. W. T Griffith, and G. D. Cook (1994), Trace gas emissions from biomass 352
burning in tropical Australian savannas, J. Geophys. Res., 99(D8), 16, 441–16, 456, 353
doi:10.1029/94JD00670. 354
IPCC (2007), Climate Change 2007: The Physical Science Basis, chapter 7, edited by: S. 355
Solomon, D. Quin, M. Manning, Z. Chen, M. Marquis, K. B. Averyt, M. Tignor, and H. L. 356
Miller, Cambridge University Press, Cambridge, United Kingdom. 357
Kerzenmacher, T., et al. (2012), Validation of IASI FORLI carbon monoxide retrievals using 358
FTIR data from NDACC, Atmos. Meas. Tech. Discuss., 5, 3973–4002, doi:10.5194/amtd-5-359
3973-2012. 360
Le Breton, M., et al. (2013), Airborne HCN measurements from biomass burning, Atmos. Chem. 361
Phys. Discuss., 13, 5649–5685, doi:10.5194/acpd-13-5649-2013. 362
Lewis, A. C., et al. (2013), The influence of biomass burning on the global distribution of 363
selected non-methane organic compounds, Atmos. Chem. Phys., 13, 851–867, doi:10.5194/acp-364
13-851-2013. 365
Li, Q., D. J. Jacob, R. M. Yantosca, C. L. Heald, H. B. Singh, M. Koike, Y. Zhao, G. W. 366
Sachse, and D. G. Streets (2003), A global three-dimensional model analysis of the atmospheric 367
budgets of HCN and CH3CN: constraints from aircraft and ground measurements, J. Geophys. 368
Res., 108(D21), 8827, doi:10.1029/2002JD003075. 369
Lindenmaier, R. (2012), Studies of Arctic middle atmosphere chemistry using infrared 370
absorption spectroscopy, PhD Thesis, University of Toronto, Toronto, Canada. 371
18
O'Neill, N. T., T. F. Eck, A. Smirnov, B. N. Holben, and S. Thulasiraman (2003), Spectral 372
discrimination of coarse and fine mode optical depth, J. Geophys. Res., 108(D17), 4559–4573, 373
doi:10.1029/2002JD002975. 374
Müller, J.-F., and G. Brasseur (1995), IMAGES: A three-dimensional chemical transport model 375
of the global troposphere, J. Geophys. Res., 100(D8), 16, 445–16, 490, doi:10.1029/94JD03254. 376
Nance, J. D., P. V. Hobbs, L. F. Radke, and D. E. Ward (1993), Airborne measurements of gases 377
and particles from an Alaskan wildfire, J. Geophys. Res., 98, 14,873-14,882, 378
DOI: 10.1029/93JD01196. 379
Paton-Walsh, C., N. B. Jones, S. R. Wilson, A. Meier, N. Deutscher and D. Griffith (2004), 380
Trace gas emissions from biomass burning inferred from aerosol optical depth, Geophys. Res. 381
Lett., 31(5), L05116, doi:10.1029/2003GL018973. 382
Paton-Walsh, C., N. B. Jones, S. R. Wilson, V. Harverd, A. Meier, D. W. T. Griffith, and C. P. 383
Rinsland (2005), Measurements of trace gas emissions from Australian forest fires and 384
correlations with coincident measurements of aerosol optical depth, J. Geophys. Res., 110, 385
D24305, doi:10.1029/2005JD006202. 386
Paton-Walsh, C., N. M. Deutscher, D. W. T. Griffith, B. W. Forgan, S. R. Wilson, N. B. Jones, 387
and D. P. Edwards (2010), Trace gas emissions from savanna fires in Northern Australia, J. 388
Geophys. Res., 115, D16314, doi:10.1029/2009JD013309. 389
Preston, C. M., and M.W. I. Schmidt (2006), Black (pyrogenic) carbon: a synthesis of current 390
knowledge and uncertainties with special consideration of boreal regions, Biogeosciences, 3, 391
397–420, doi:10.5194/bg-3-397-2006. 392
19
Rinsland, C. P., et al. (1998), Northern and Southern Hemisphere ground-based infrared 393
spectroscopic measurements of tropospheric carbon monoxide and ethane, J. Geophys. Res., 394
103(D21), 28, 197–28, 217, doi:10.1029/98JD02515. 395
Rinsland, C. P., et al. (1999), Infrared solar spectroscopic measurements of free tropospheric CO, 396
C2H6, and HCN above Mauna Loa, Hawaii: seasonal variations and evidence for enhanced 397
emissions from the Southeast Asian tropical fires of 1997-1998, J. Geophys. Res., 104(D15), 398
18667–18680, doi:10.1029/1999JD900366. 399
Rinsland, C. P., E. Mahieu, R. Zander, P. Demoulin, J. Forrer, and B. Buchmann (2000), Free 400
tropospheric CO, C2H6, and HCN above center Europe: Recent measurements from the 401
Jungfraujoch station including the detection of elevated columns during 1998, J. Geophys. Res., 402
105, 24, 235–24, 249, DOI:10.1029/2000JD900371. 403
Rinsland, C. P., G. Dufour, C. D. Boone, P. F. Bernath, L. Chiou, P. F. Coheur, S. Turquety, and, 404
C. Clerbaux (2007), Satellite boreal measurements over Alaska and Canada during June–July 405
2004: Simultaneous measurements of upper tropospheric CO, C2H6, HCN, CH3Cl, CH4, C2H2, 406
CH3OH, HCOOH, OCS, and SF6 mixing ratios, Global Biogeochem. Cy., 21, GB3008, 407
doi:10.1029/2006GB002795. 408
Rodgers, C. D. (2000), Inverse Methods for Atmospheric Sounding: Theory and Practice, Series 409
on Atmospheric, Oceanic and Planetary Physics - Vol. 2, World Scientific Publishing Co., 410
Singapore. 411
Rothman, L. S., et al. (2009), The Hitran 2008 molecular spectroscopic database, J. Quant. 412
Spectrosc. Radiat. Transfer, 110, 533–572, doi:10.1016/j.jqsrt.2009.02.013. 413
20
Shindell, D.T., et al., (2008), A multi-model assessment of pollution transport to the Arctic, 414
Atmos. Chem. Phys., 8, 5353–5372, doi:10.5194/acp-8-5353-2008. 415
Simpson, I. J., et al. (2011), Boreal forest fire emissions in fresh Canadian smoke plumes: C1–416
C10 volatile organic compounds (VOCs), CO2, CO, NO2, NO, HCN and CH3CN, Atmos. Chem. 417
Phys., 11, 6445-6463, doi:10.5194/acp-11-6445–2011. 418
Saha, A., et al. (2010), Pan-Arctic sunphotometry during the ARCTAS-A campaign of April 419
2008, Geophys. Res. Lett., 37, L05803, doi:10.1029/2009GL041375. 420
Soja, A. J., et al. (2007), Climate-induced boreal forest change: Predictions versus current 421
observations, Global and Planetary Change, 56(3-4), 274–296, 422
doi:10.1016/j.gloplacha.2006.07.028. 423
Tereszchuk, K. A., et al. (2012), ACE-FTS observations of pyrogenic trace species in boreal 424
biomass burning plumes during BORTAS, Atmos. Chem. Phys. Discuss., 12, 31629-31661, 425
doi:10.5194/acpd-12-31629-2012. 426
Turquety, S., D. Hurtmans, J. Hadji-Lazaro, P.-F. Coheur, C. Clerbaux, D. Josset, and C. 427
Tsamalis (2009), Tracking the emission and transport of pollution from wildfires using the IASI 428
CO retrievals: analysis of the summer 2007 Greek fires, Atmos. Chem. Phys., 9, 4897–4913, 429
doi:10.5194/acp-9-4897-2009. 430
Vigouroux, C., et al. (2012), FTIR time-series of biomass burning products (HCN, C2H6, C2H2, 431
CH3OH, and HCOOH) at Reunion Island (21° S, 55° E) and comparisons with model data, 432
Atmos. Chem. Phys. Discuss., 12, 13733–13786, doi:10.5194/acpd-12-13733-2012. 433
21
Wunch, D., G. C. Toon, J.-F. L. Blavier, R. Washenfelder, J. Notholt, B. J. Connor, D. W. T. 434
Griffith, V. Sherlock, and P. O. Wennberg (2011), The Total Carbon Column Observing 435
Network, Phil. Trans. R. Soc. A, 369, 2087–2112, doi:10.1098/rsta.2010.0240. 436
Xiao, Y., J. A. Logan, D. J. Jacob, R. C. Hudman, R. Yantosca, and D. R. Blake (2008), Global 437
budget of ethane and regional constraints on US sources, J. Geophys. Res., 113, D21306, 438
doi:10.1029/2007JD009415. 439
Yurganov, L. N. et al. (2011), Satellite- and ground-based CO total column observations over 440
2010 Russian fires: accuracy of top-down estimates based on thermal IR satellite data, Atmos. 441
Chem. Phys., 11, 7925–7942, doi:10.5194/acp-11-7925-2011. 442
Zhao, Y., et al. (2002), Spectroscopic measurements of tropospheric CO, C2H6, C2H2, and HCN 443
in Northern Japan, J. Geophys. Res., 107(D18), 4343, doi:10.1029/2001JD000748. 444
22
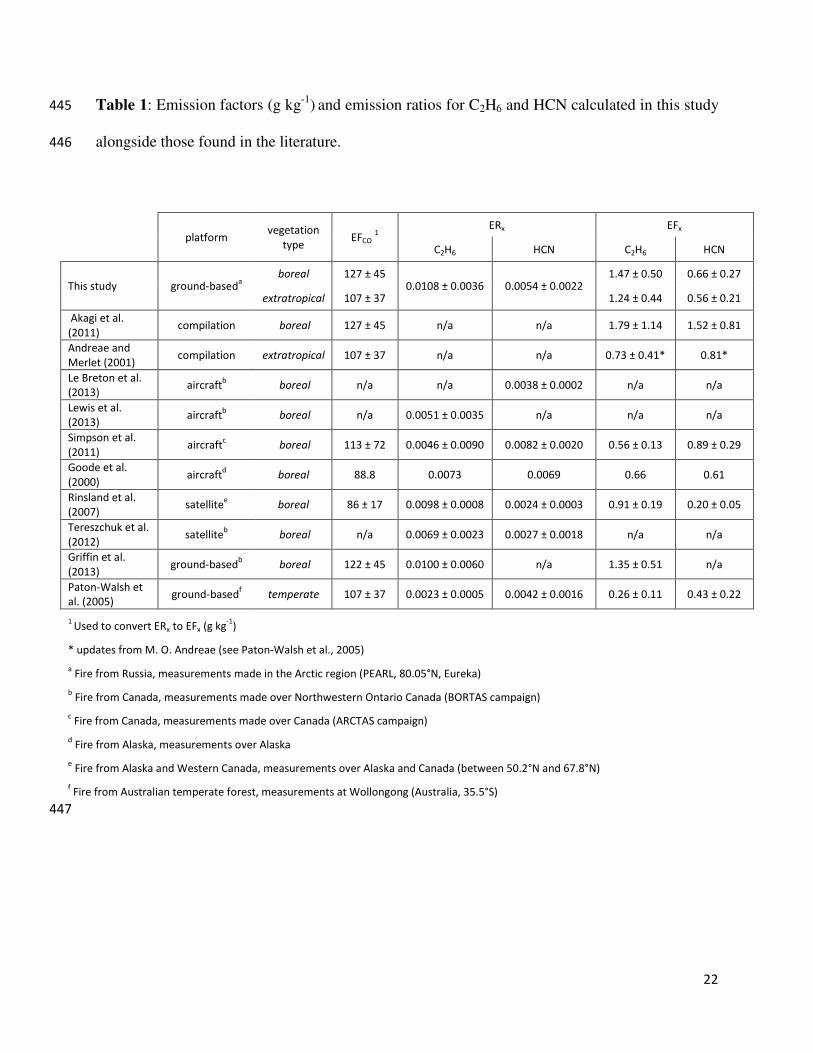
Table 1: Emission factors (g kg-1
) and emission ratios for C2H6 and HCN calculated in this study 445
alongside those found in the literature. 446
447
platform vegetation
type EFCO
1
ERx EFx
C2H6 HCN C2H6 HCN
This study ground-baseda
boreal 127 ± 45 0.0108 ± 0.0036 0.0054 ± 0.0022
1.47 ± 0.50 0.66 ± 0.27
extratropical 107 ± 37 1.24 ± 0.44 0.56 ± 0.21
Akagi et al.
(2011) compilation boreal 127 ± 45 n/a n/a 1.79 ± 1.14 1.52 ± 0.81
Andreae and
Merlet (2001) compilation extratropical 107 ± 37 n/a n/a 0.73 ± 0.41* 0.81*
Le Breton et al.
(2013) aircraft
b boreal n/a n/a 0.0038 ± 0.0002 n/a n/a
Lewis et al.
(2013) aircraft
b boreal n/a 0.0051 ± 0.0035 n/a n/a n/a
Simpson et al.
(2011) aircraft
c boreal 113 ± 72 0.0046 ± 0.0090 0.0082 ± 0.0020 0.56 ± 0.13 0.89 ± 0.29
Goode et al.
(2000) aircraft
d boreal 88.8 0.0073 0.0069 0.66 0.61
Rinsland et al.
(2007) satellite
e boreal 86 ± 17 0.0098 ± 0.0008 0.0024 ± 0.0003 0.91 ± 0.19 0.20 ± 0.05
Tereszchuk et al.
(2012) satellite
b boreal n/a 0.0069 ± 0.0023 0.0027 ± 0.0018 n/a n/a
Griffin et al.
(2013) ground-based
b boreal 122 ± 45 0.0100 ± 0.0060 n/a 1.35 ± 0.51 n/a
Paton-Walsh et
al. (2005) ground-based
f temperate 107 ± 37 0.0023 ± 0.0005 0.0042 ± 0.0016 0.26 ± 0.11 0.43 ± 0.22
1 Used to convert ERx to EFx (g kg
-1)
* updates from M. O. Andreae (see Paton-Walsh et al., 2005)
a Fire from Russia, measurements made in the Arctic region (PEARL, 80.05°N, Eureka)
b Fire from Canada, measurements made over Northwestern Ontario Canada (BORTAS campaign)
c Fire from Canada, measurements made over Canada (ARCTAS campaign)
d Fire from Alaska, measurements over Alaska
e Fire from Alaska and Western Canada, measurements over Alaska and Canada (between 50.2°N and 67.8°N)
f Fire from Australian temperate forest, measurements at Wollongong (Australia, 35.5°S)
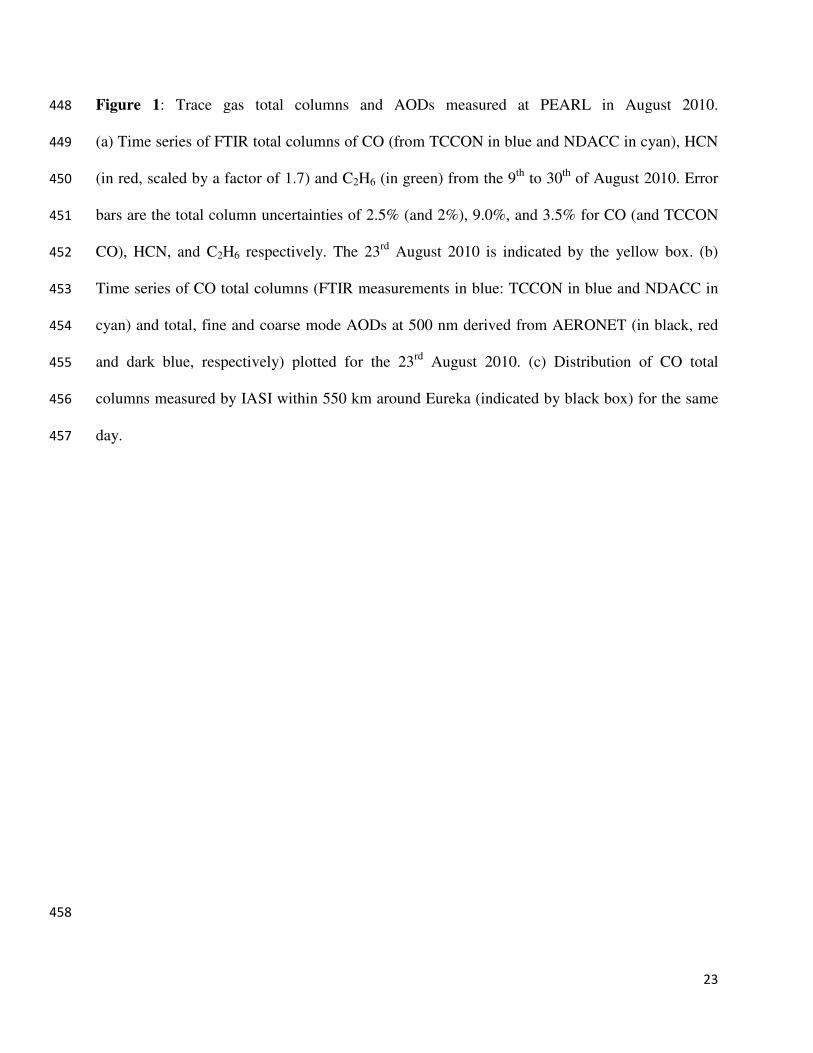
Figure 1: Trace gas total columns and AODs measured at PEARL in August 2010. 448
(a) Time series of FTIR total columns of CO (from TCCON in blue and NDACC in cyan), HCN 449
(in red, scaled by a factor of 1.7) and C450
bars are the total column uncertainties of 2.5% (and 2%), 9.0%, and 3.5% for CO (and TCCON 451
CO), HCN, and C2H6 respectively. The 23452
Time series of CO total columns (FTIR measurements i453
cyan) and total, fine and coarse mode AODs at 500 nm derived from AERONET (in black, red 454
and dark blue, respectively) plotted for the 23455
columns measured by IASI within 550 km a456
day. 457
458
Trace gas total columns and AODs measured at PEARL in August 2010.
(a) Time series of FTIR total columns of CO (from TCCON in blue and NDACC in cyan), HCN
(in red, scaled by a factor of 1.7) and C2H6 (in green) from the 9th
to 30th
of August 2010. Error
bars are the total column uncertainties of 2.5% (and 2%), 9.0%, and 3.5% for CO (and TCCON
respectively. The 23rd
August 2010 is indicated by the yellow box. (b)
Time series of CO total columns (FTIR measurements in blue: TCCON in blue and NDACC in
cyan) and total, fine and coarse mode AODs at 500 nm derived from AERONET (in black, red
and dark blue, respectively) plotted for the 23rd
August 2010. (c) Distribution of CO total
asured by IASI within 550 km around Eureka (indicated by black box) for the same
23
Trace gas total columns and AODs measured at PEARL in August 2010.
(a) Time series of FTIR total columns of CO (from TCCON in blue and NDACC in cyan), HCN
of August 2010. Error
bars are the total column uncertainties of 2.5% (and 2%), 9.0%, and 3.5% for CO (and TCCON
August 2010 is indicated by the yellow box. (b)
n blue: TCCON in blue and NDACC in
cyan) and total, fine and coarse mode AODs at 500 nm derived from AERONET (in black, red
August 2010. (c) Distribution of CO total
round Eureka (indicated by black box) for the same
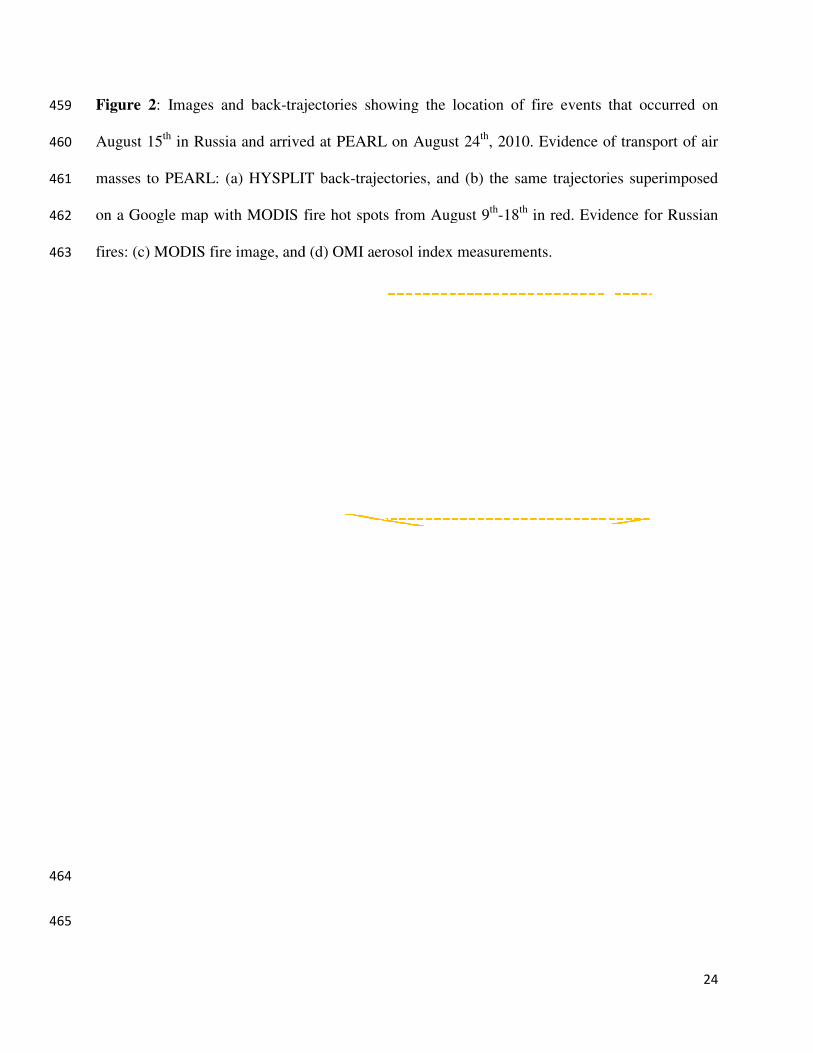
Figure 2: Images and back-trajectories showing the location of fire events that occurred on 459
August 15th
in Russia and arrived at PEARL on August 24460
masses to PEARL: (a) HYSPLIT back461
on a Google map with MODIS fire hot spots from August 9462
fires: (c) MODIS fire image, and (d463
464
465
trajectories showing the location of fire events that occurred on
in Russia and arrived at PEARL on August 24th
, 2010. Evidence of transport of air
PEARL: (a) HYSPLIT back-trajectories, and (b) the same trajectories superimposed
on a Google map with MODIS fire hot spots from August 9th
-18th
in red. Evidence for Russian
fires: (c) MODIS fire image, and (d) OMI aerosol index measurements.
24
trajectories showing the location of fire events that occurred on
, 2010. Evidence of transport of air
trajectories, and (b) the same trajectories superimposed
in red. Evidence for Russian
25
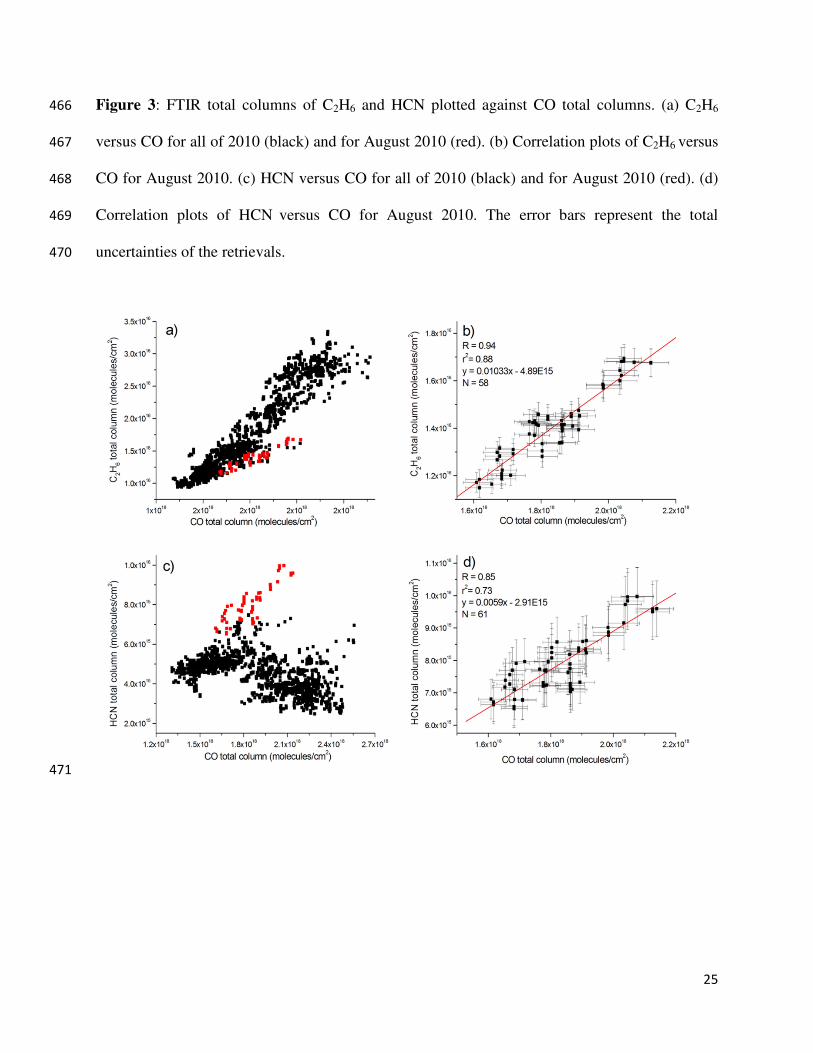
Figure 3: FTIR total columns of C2H6 and HCN plotted against CO total columns. (a) C2H6 466
versus CO for all of 2010 (black) and for August 2010 (red). (b) Correlation plots of C2H6 versus 467
CO for August 2010. (c) HCN versus CO for all of 2010 (black) and for August 2010 (red). (d) 468
Correlation plots of HCN versus CO for August 2010. The error bars represent the total 469
uncertainties of the retrievals. 470
471