Measurement Uncertainty for Single Particle Counting ... May 22-25, 2005 Measurement Uncertainty for...
17
May 22-25, 2005 Measurement Uncertainty for Single Particle Counting Systems Droplet size distributions obtained using single particle counting require Reliable uniform detection of the drops for all size classes Reliable measurement of the size for each size class May 22-25, 2005 Measurement Uncertainty for Single Particle Counting Systems Categories Uncertainty from random effects (Type A) Sizing Counting/detection Uncertainty from systematic effects (Type B) Sizing Counting/detection
Transcript of Measurement Uncertainty for Single Particle Counting ... May 22-25, 2005 Measurement Uncertainty for...
1
May 22-25, 2005
Measurement Uncertainty for Single Particle Counting Systems
Droplet size distributions obtained using single particle counting require
Reliable uniform detection of the drops for all size classes Reliable measurement of the size for each size class
May 22-25, 2005
Measurement Uncertainty for Single Particle Counting Systems
CategoriesUncertainty from random effects (Type A)
SizingCounting/detection
Uncertainty from systematic effects (Type B)Sizing Counting/detection

2
May 22-25, 2005
Measurement Uncertainty for Single Particle Counting Systems
CategoriesUncertainty from random effects (Type A)
Sizing• Low SNR• Local light wave front distortion• Trajectory errors• Droplet shape/deformation
Counting/detection• High number density, coincidence, loss of particles• Low SNR
May 22-25, 2005
Measurement Uncertainty for Single Particle Counting Systems
CategoriesUncertainty from systematic effects (Type B)
Sizing • Faulty calibration• Faulty optical alignment• Improper instrument setup, instrument processing
parameters• Low SNR
Counting/detection• Trajectory errors• Improper detector gain, • Inadequate laser power, light beam attenuation• Improper setup, instrument parameters• Sample volume vs. size effects

3
May 22-25, 2005
Basic Phase Doppler Interferometer (PDI) System
Photodetectors
Receiver LensLaser
BeamsplitterTransmitter Lens
Probe Volume
Frequency and PhaseSignal Processor
θ1
2
3FringeSpacing
Droplet
May 22-25, 2005
Various Debye Terms
i2 (Plot#1) i2 (Plot#2) i2 (Plot#3)
Sca
ttere
d In
tens
ity
Scattering Angle (Degrees)
1.0e+10
1.0e-01
1.0e+00
1.0e+01
1.0e+02
1.0e+03
1.0e+04
1.0e+05
1.0e+06
1.0e+07
1.0e+08
1.0e+09
0 10 20 30 40 50 60 70 80 90
50 µm water drop
Mie Scattering (green)
Refraction (p = 1)
Diffraction + Reflection
PDI Receiver
Various Light Scattering Orders
Separation
(Light source has a Gaussian Intensity Distribution)(Light source has a Gaussian Intensity Distribution)
4
May 22-25, 2005
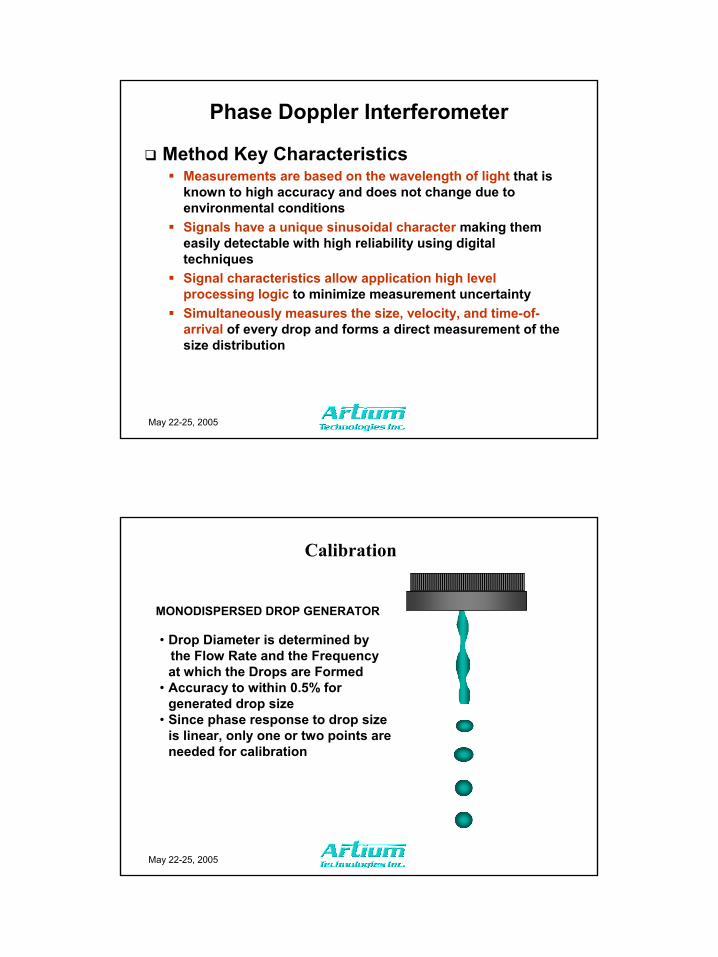
Phase Doppler Interferometer
Method Key CharacteristicsMeasurements are based on the wavelength of light that is known to high accuracy and does not change due to environmental conditionsSignals have a unique sinusoidal character making them easily detectable with high reliability using digital techniquesSignal characteristics allow application high level processing logic to minimize measurement uncertaintySimultaneously measures the size, velocity, and time-of-arrival of every drop and forms a direct measurement of the size distribution
May 22-25, 2005
Calibration
• Drop Diameter is determined bythe Flow Rate and the Frequency at which the Drops are Formed
• Accuracy to within 0.5% for generated drop size
• Since phase response to drop size is linear, only one or two points are needed for calibration
MONODISPERSED DROP GENERATOR

5
May 22-25, 2005
Photograph of the Monodisperse Drop Stream
Expected Value based on flow rate and droplet formation frequency – 160 µm
May 22-25, 2005
Phase Doppler InterferometerCalibration and measurement validation
0.1 µm bin widths

6
May 22-25, 2005
Phase Calibration
Laser diode injects identical signals to each detectorUsed to zero phase delays in the system componentsTests reliable operation of the system before acquiring dataVerifies proper setup of the system
Automated calibration Invisible to the userActivated when system setup parameters are changedEnsures reliable data acquisition for every test
May 22-25, 2005
Uncertainty for small droplet measurements due to Instrument Response Function Instrument
Potential Size ambiguity due to nonlinear response
Comparison of the Lorenz-Mie Theory and Geometrical Optics Theories

7
May 22-25, 2005
Effect of Receiver f# on Phase Response
f# = 7 f# = 3.5
May 22-25, 2005
VARIATION OF THE SAMPLE VOLUME WITH DROP SIZE
LASER BEAMINTENSITY PROFILE
bo
• Causes a change in the effective sampling cross-section as a function of drop size
• Must be accurately characterized to normalize the sampling statistics
• Partially achieves desired affect of reducing sample volume size with decreasing drop size
Gaussian Beam Effect
• Complicates definition of sampling cross-sectional area
Affects size distribution, number density and fluxmeasurements

8
May 22-25, 2005
INCIDENT LASER BEAMS
GENERATION OF NON-SPHERICAL DROPS
MONODISPERSED DROP GENERATOR
May 22-25, 2005
RESPONSE TO NON-SPHERICAL DROPS
MEASUREDSPHERICALDIAMETER
Radius of curvature Measured in this
plane
DEFORMED DROP
PROLATE SPHEROID
DEFORMEDDROP
OBLATE SPHEROID
MEASURED SPHERICAL DIAMETER
Radius of curvature Measured in this
plane
Probe Volume
Probe Volume
9
May 22-25, 2005
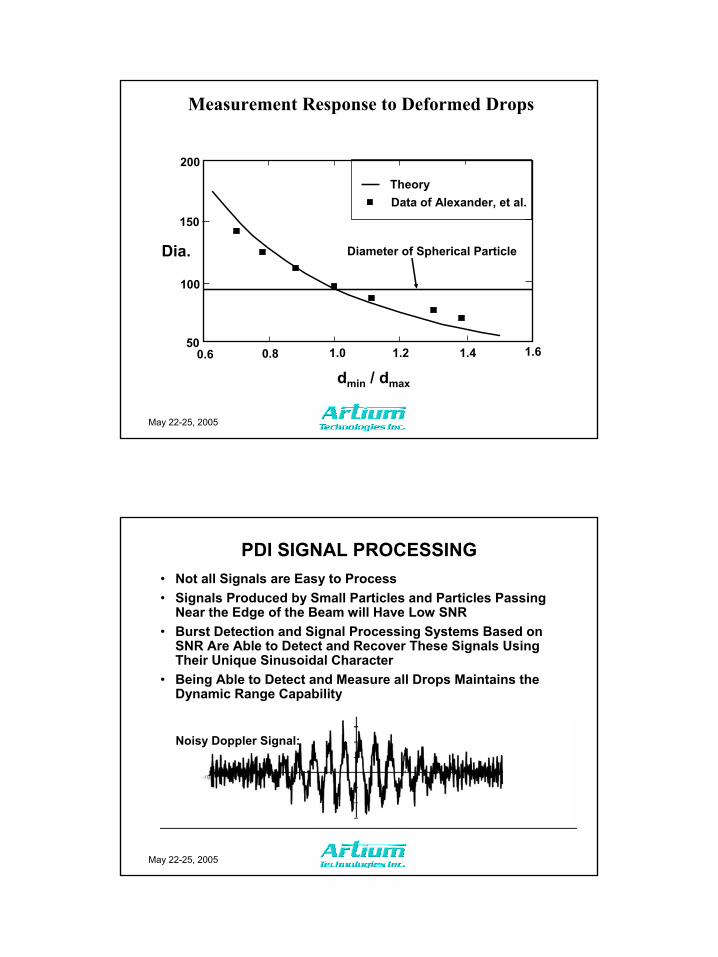
Measurement Response to Deformed Drops
0.6 0.8 1.0 1.2 1.4 1.6
200
150
100
50
Diameter of Spherical Particle
TheoryData of Alexander, et al.
dmin / dmax
Dia.
May 22-25, 2005
PDI SIGNAL PROCESSING• Not all Signals are Easy to Process• Signals Produced by Small Particles and Particles Passing
Near the Edge of the Beam will Have Low SNR• Burst Detection and Signal Processing Systems Based on
SNR Are Able to Detect and Recover These Signals Using Their Unique Sinusoidal Character
• Being Able to Detect and Measure all Drops Maintains the Dynamic Range Capability
Noisy Doppler Signal:

10
May 22-25, 2005
Noisy SignalsNoisy Signals
Time
Vol
tage
Filtered Signals
May 22-25, 2005
Signal Detection based on Sinusoidal Character And Signal-to-Noise Ratio (SNR) of the Signal
Advanced Signal Detection Methods• Based on the Sinusoidal character of the signal• Uses Signal Coherence and SNR for detection/rejection• Requires no adjustment• Reliably separates signal from noise• Capable of 10 million detections per second• No part of the incoming record is missed

11
May 22-25, 2005
PARTICLE NUMBER DENSITY LIMITATIONS
First Two Signal Show Partial Coincidence
Non- Coincident Condition
May 22-25, 2005
Oscilloscope Trace of the Signal and Gate SignalsBeam waist Beam waist DDww = 60= 60µµm, With Splitterm, With Splitter
Time (usec)-500 -400 -300 -200 -100 0 100 200 300 400 500
Sig
nal (
Vol
ts)
-0.02
0.00
0.02
0.04
0.06
0.08Signal
Gate
From Strakey, Talley, Sankar, and Bachalo, ILASS-98
Dense spray problem:
12
May 22-25, 2005
Time (usec)-500 -400 -300 -200 -100 0 100 200 300 400 500
Sig
nal (
Vol
ts)
-0.02
0.00
0.02
0.04
0.06
0.08Signal
Gate
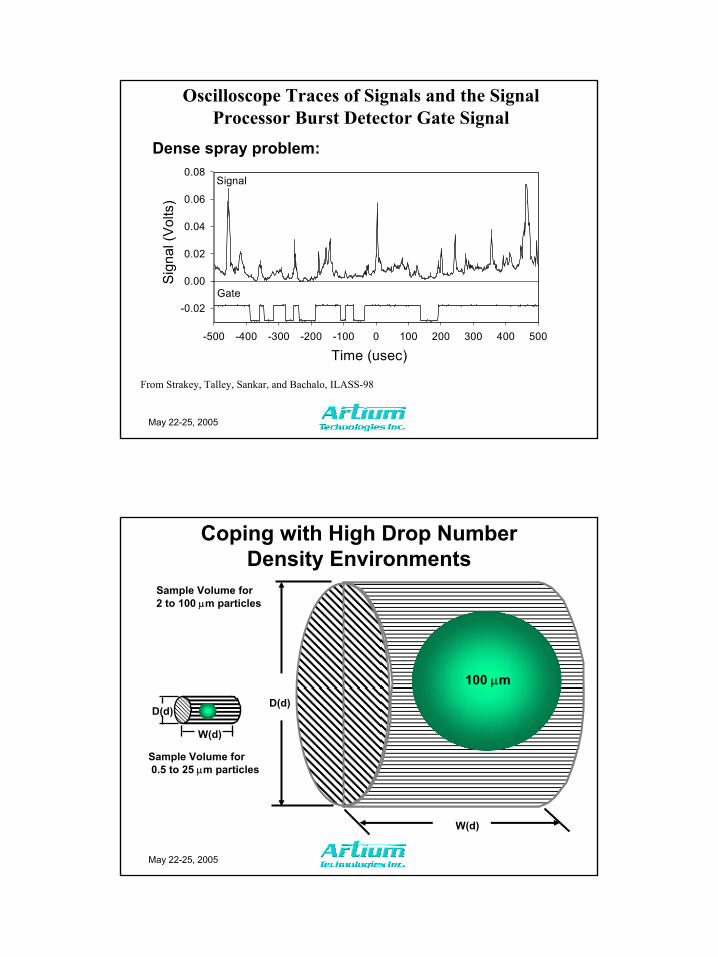
Oscilloscope Traces of Signals and the Signal Processor Burst Detector Gate Signal
From Strakey, Talley, Sankar, and Bachalo, ILASS-98
Dense spray problem:
May 22-25, 2005
Coping with High Drop Number Density Environments
Sample Volume for 2 to 100 µm particles
D(d)
W(d)
100 µm
W(d)
D(d)
Sample Volume for0.5 to 25 µm particles

13
May 22-25, 2005
Particles Have Different• Sizes• Velocities• Trajectories• Inter-Particle Arrival Times
PARTICLE NUMBER DENSITY LIMITATIONS
• Multiple Particles In Sample Volume• Multiple Particles In Sample Volume
d2
V2
d1
V1
Sample Volume
May 22-25, 2005
PARTICLE NUMBER DENSITY LIMITATIONS
• Coherent Scattering by Multiple Particles in Sample Volume• Coherent Scattering by Multiple Particles in Sample Volume
d2
V2
d1
V1
Sample Volume
Reduced Size of Sample VolumeAutomatically to Handle Dense Spray Region
Reduced Size of Sample VolumeAutomatically to Handle Dense Spray Region

14
May 22-25, 2005
REFRACTED RAY
REFLECTED RAY
DROP
LASER BEAMINTENSITY PROFILE
bo
Light Scattering Trajectory Errors• Three Cases:
Γ = d/Dw<<1, drop approximately uniformly illuminatedΓ ~ 1, nonuniform illumination, Refraction ~ reflection on
certain trajectories, complex interferenceΓ > 1, scattering eithereither by refraction or reflection
REFRACTED RAY
REFLECTED RAY
DROP
LASER BEAMINTENSITY PROFILE
bo
REFRACTED RAY
REFLECTED RAYDROP
LASER BEAMINTENSITY PROFILE
bo
REFRACTED RAY
The phenomena also depends on the angle The phenomena also depends on the angle of trajectory. of trajectory.
May 22-25, 2005
D ia m e te r ( µ m )
0 1 0 2 0 3 0 4 0 5 0 6 0
Pha
se D
iffer
ence
(deg
ree)
0
2 0
4 0
6 0
8 0
1 0 0
η = 0 . 0η = − 0 . 5η = − 0 . 8η = − 1 . 0
PHASE DIAMETER CURVE FOR DIFFERENT TRAJECTORIES
Transmitter
Receiverη
1
-1
waist
Phas
e D
iffer
ence
, deg
rees
Diameter, (µm)
Undersized
15
May 22-25, 2005
Diameter ( µ m)
0 20 40 60 80 100 120 140 160
Phase Difference (degree)
0
50
100
150
200
250
300
350
400
η = 0.8η = −0.8η = −1.0
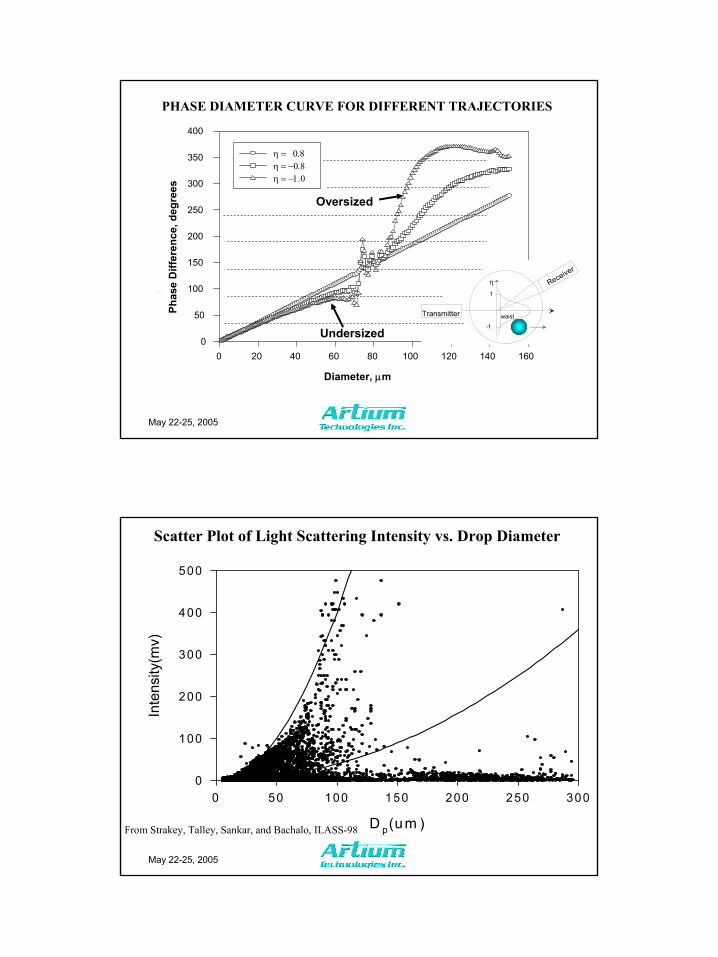
PHASE DIAMETER CURVE FOR DIFFERENT TRAJECTORIES
Transmitter
Receiverη
1
-1
waist
Phas
e D
iffer
ence
, deg
rees
Diameter, µm
Undersized
Oversized
May 22-25, 2005
Scatter Plot of Light Scattering Intensity vs. Drop Diameter
D p(um )
0 50 100 150 200 250 300
Inte
nsity
(mv)
0
100
200
300
400
500
From Strakey, Talley, Sankar, and Bachalo, ILASS-98
16
May 22-25, 2005
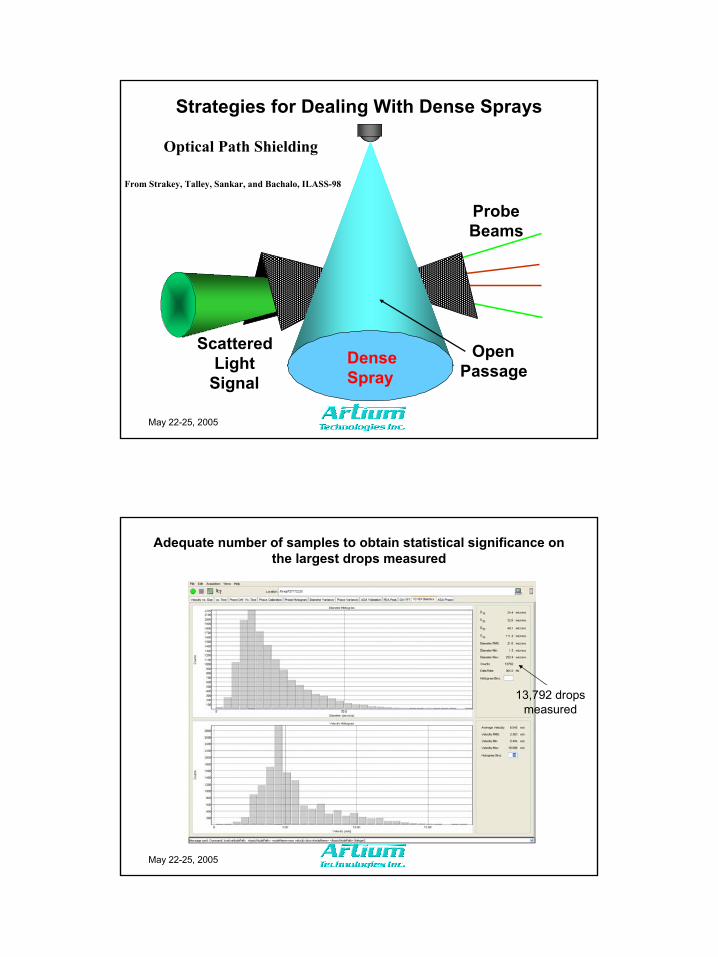
Strategies for Dealing With Dense Sprays
OpenPassage
ProbeBeams
ScatteredLight
Signal
Optical Path Shielding
From Strakey, Talley, Sankar, and Bachalo, ILASS-98
DenseSpray
May 22-25, 2005
Adequate number of samples to obtain statistical significance onthe largest drops measured
13,792 drops measured

17
May 22-25, 2005
Example of the Droplet Size-Velocity Correlation for a Pressure Atomizer
Each dot represents a single drop measurement,~14,000 drops measured
Low NumberOf Samples
May 22-25, 2005
Summary and Conclusions
Single particle counting allows the direct measurement of the spray drop size distributionsPDI provides the greatest information content leading to drop size and velocity distributions, volume flux, number density, and drop dynamics informationSeveral sources of measurement uncertainty existCareful system design and complex logic has been incorporated into the instruments to minimize the measurement uncertainty