Measurement – session 7 Employment & unemployment.
57
Measurement – session 7 Employment & unemployment
-
Upload
bernadette-watts -
Category
Documents
-
view
221 -
download
2
Transcript of Measurement – session 7 Employment & unemployment.

Measurement – session 7
Employment & unemployment

1 – “between theory and history”

Unemployment: between theory and history
• Unemployment, ‘labor force’ are recent concepts
• Only appeared at the end of the 19th century– More people coming to the cities and selling
their work = “labor force”– Firms hiring and firing according to economic
fluctuations– No possibility of going back to other types of
work
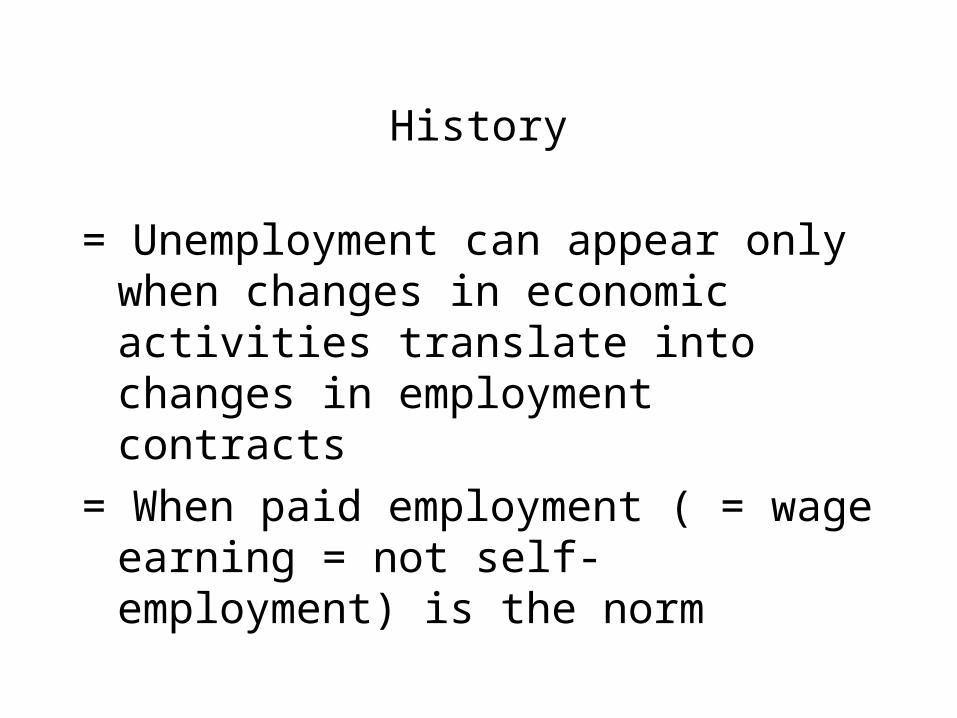
History
= Unemployment can appear only when changes in economic activities translate into changes in employment contracts
= When paid employment ( = wage earning = not self-employment) is the norm

History
• Also require policy relevance: why count these people as “unemployed”?
• At the end of 19th c. appeared– Mutual help societies (workers contributing to
an insurance system against temporary lack of employment)
– Placement offices (registering as “out of work” to find a new job)

History
• Only when wage earning is the unequivocal reference do jobs and employment fluctuate together
• Counter-example: France, 1931-1936:– 1.8 million jobs
+ 400 000 unemployed only
• Rural population, women, youth simply left town / the “labor market”
History
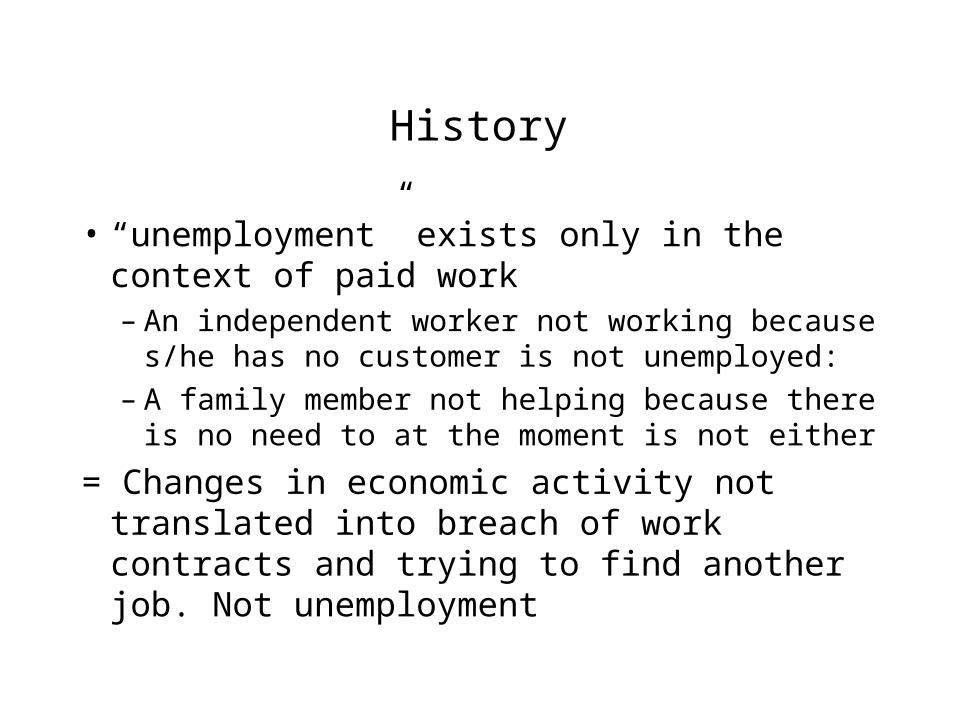
• “unemployment” exists only in the context of paid work– An independent worker not working because
s/he has no customer is not unemployed: – A family member not helping because there is
no need to at the moment is not either
= Changes in economic activity not translated into breach of work contracts and trying to find another job. Not unemployment

The frontiers between the 3 classes
Employment Not in the LF
Unemployment
TrainingForced early retirementDiscouraged workers
Unwanted part-time(underemployment)
Chosen part-time
Informal work

Economic theory
• Usual paradigm of supply and demand in a frictionless environment
• Unemployment = L supply (workers) – L demand (firms)
• Focus on wages, the price of work: why do they not adjust S & D?
• Minimum wage = obvious explanation

Economic theory
• Now more focus on job search, supply/demand skills mismatch, spatial mismatch…
• Introduction of TIME and SPACE in the models
• Supply and demand are linked dynamically: flow approach

Economic theory
• Impact on measurement: demand for measurement of flows, not just stocks of unemployed
Panel data necessary

Unemployment rate : the basic definition
• Idea: percentage of those who want to work who are deprived of work
• Unemployed / total labor force
• 2 things to study: – Measuring the labor force– Counting the unemployed

2 – The labor force
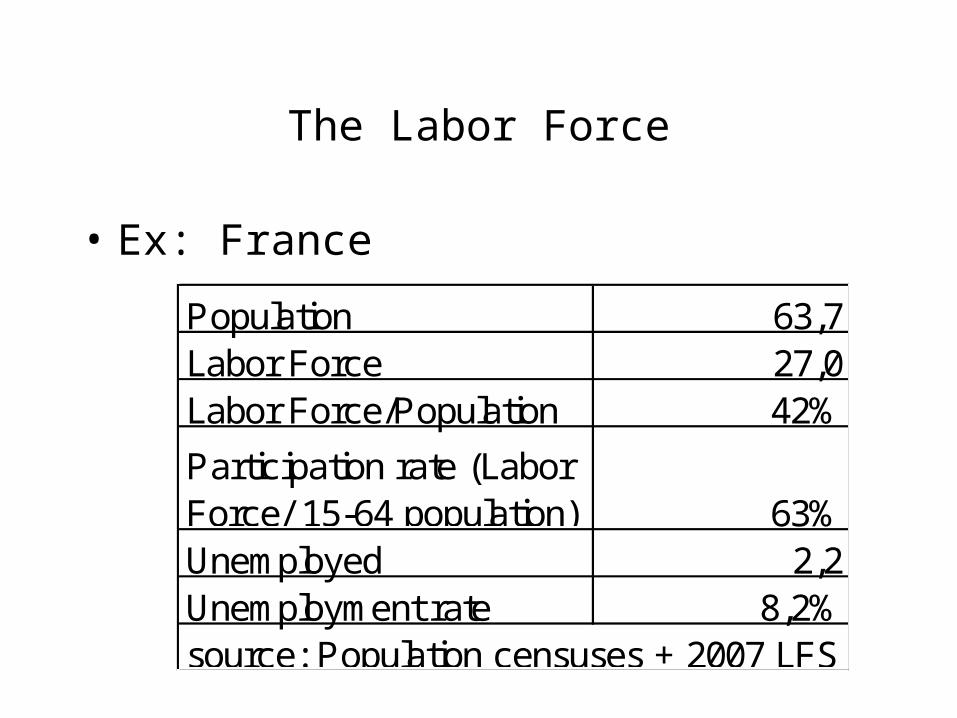
The Labor Force
• Ex: France
Population 63,7Labor Force 27,0Labor Force/Population 42%
Participation rate (Labor Force/ 15-64 population) 63%Unemployed 2,2Unemployment rate 8,2%source: Population censuses + 2007 LFS

The Labor Force
• Ex: Egypt
Population 72,6Labor Force 21,9Labor Force/Population 30%Participation rate (Labor Force/ 15-64 population) 41%Unemployed 2,0unemployment rate 9,1%Source: 2006 Population Census
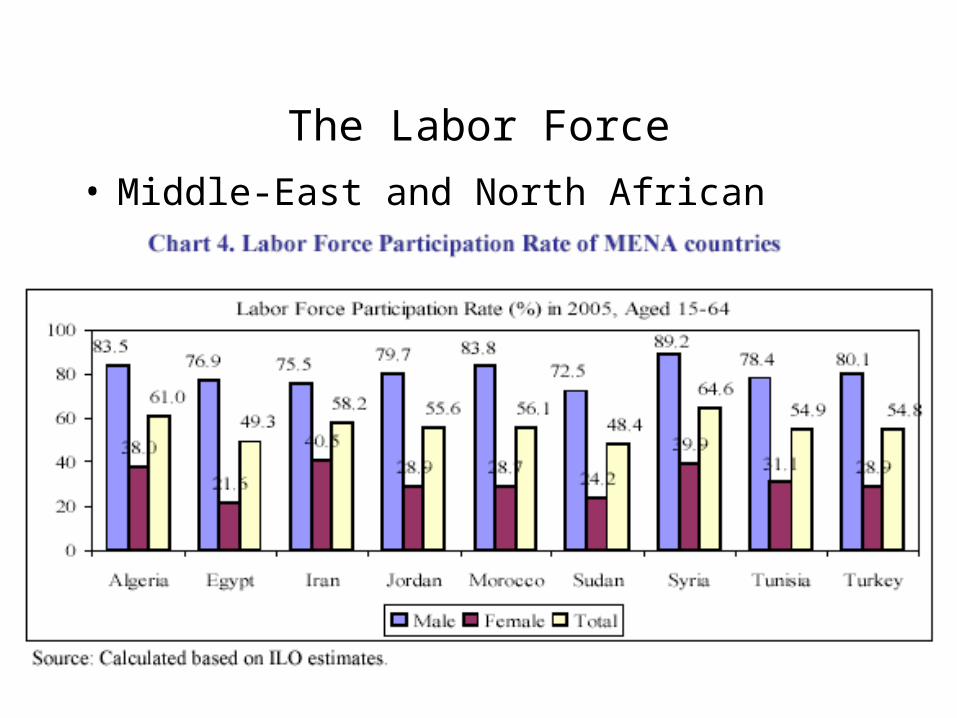
The Labor Force
• Middle-East and North African Countries
The Labor Force
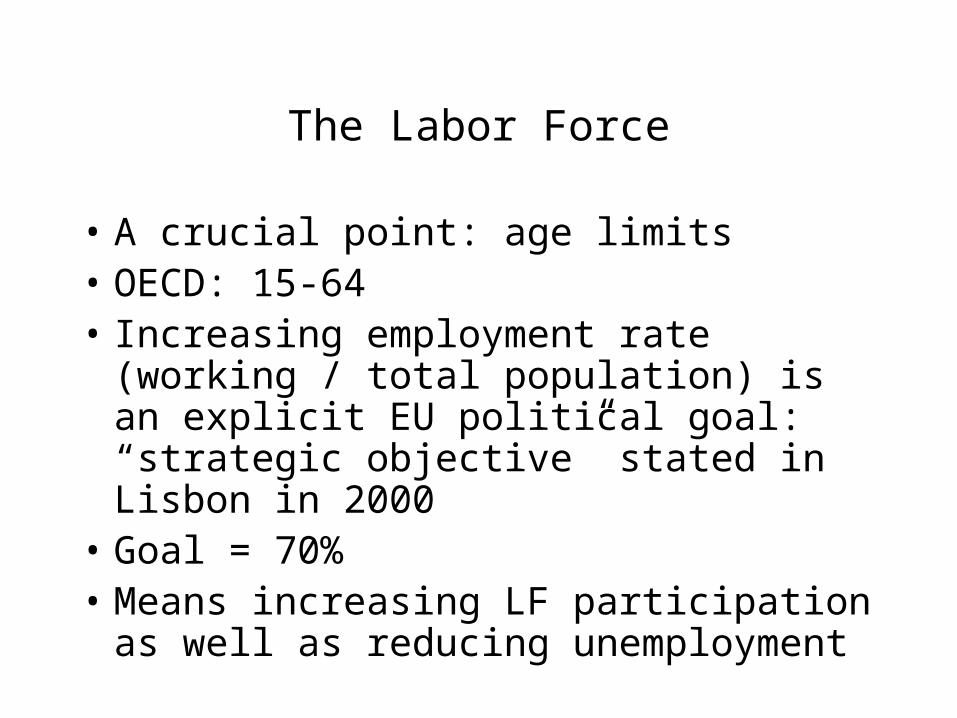
• A crucial point: age limits• OECD: 15-64• Increasing employment rate (working / total
population) is an explicit EU political goal: “strategic objective” stated in Lisbon in 2000
• Goal = 70% • Means increasing LF participation as well
as reducing unemployment

The Labor Force
Employment rate of people aged 55-64
Sweden 69%
UK 56%
France 37%
Average EU (25): 41%
The Labor Force
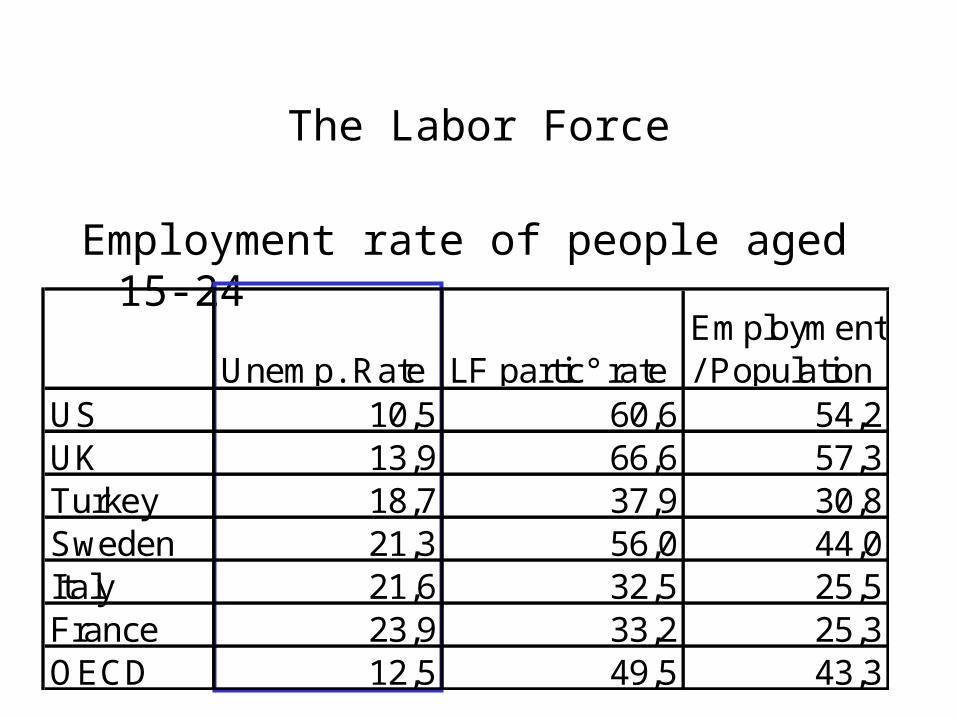
Employment rate of people aged 15-24
Unemp. Rate LF partic° rateEmployment / Population
US 10,5 60,6 54,2UK 13,9 66,6 57,3Turkey 18,7 37,9 30,8Sweden 21,3 56,0 44,0Italy 21,6 32,5 25,5France 23,9 33,2 25,3OECD 12,5 49,5 43,3
The Labor Force
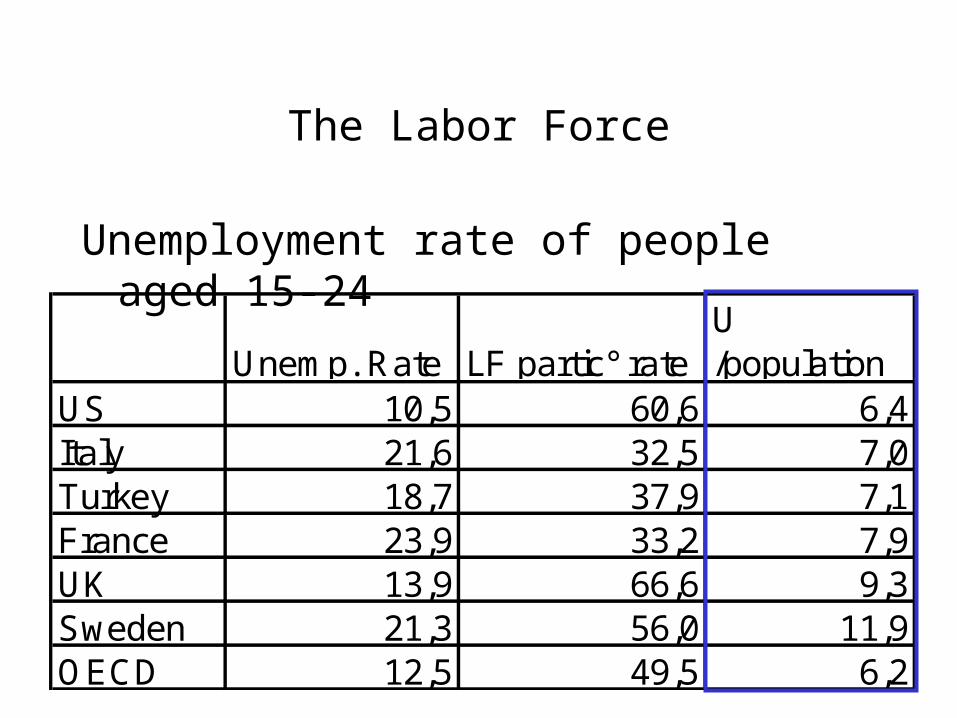
Unemployment rate of people aged 15-24
Unemp. Rate LF partic° rateU /population
US 10,5 60,6 6,4Italy 21,6 32,5 7,0Turkey 18,7 37,9 7,1France 23,9 33,2 7,9UK 13,9 66,6 9,3Sweden 21,3 56,0 11,9OECD 12,5 49,5 6,2

3 – The ILO definition
Unemployment: current definition
• ILO:– « without work »– « currently available for work »– « seeking work »

Unemployment: current definition
• Is subject to interpretation : cf homework

4 – Specific issues in developing countries
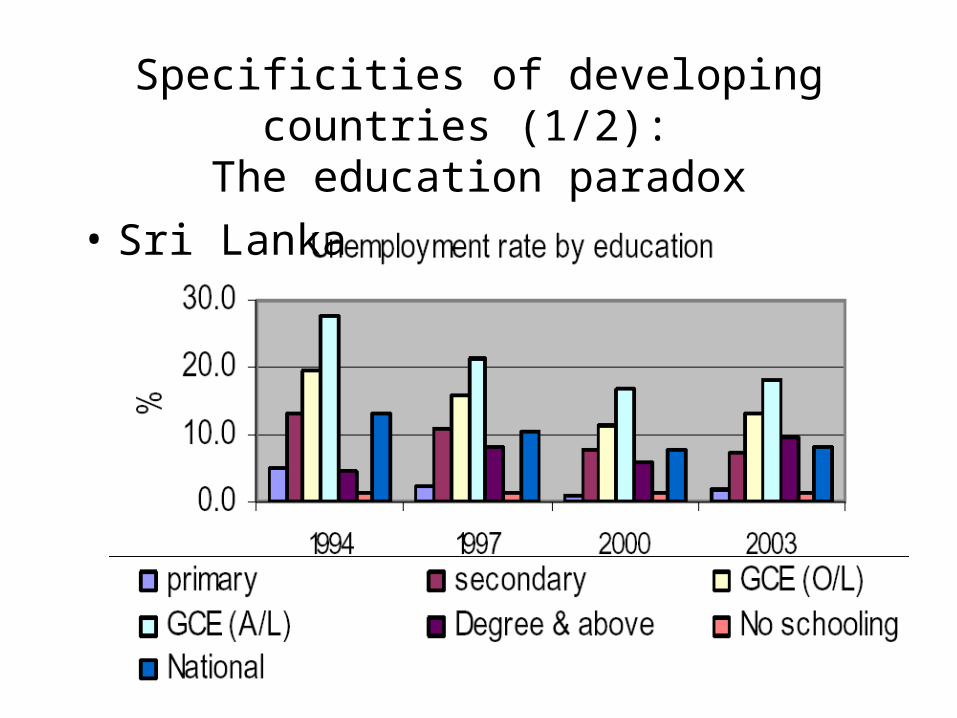
Specificities of developing countries (1/2): The education paradox
• Sri Lanka
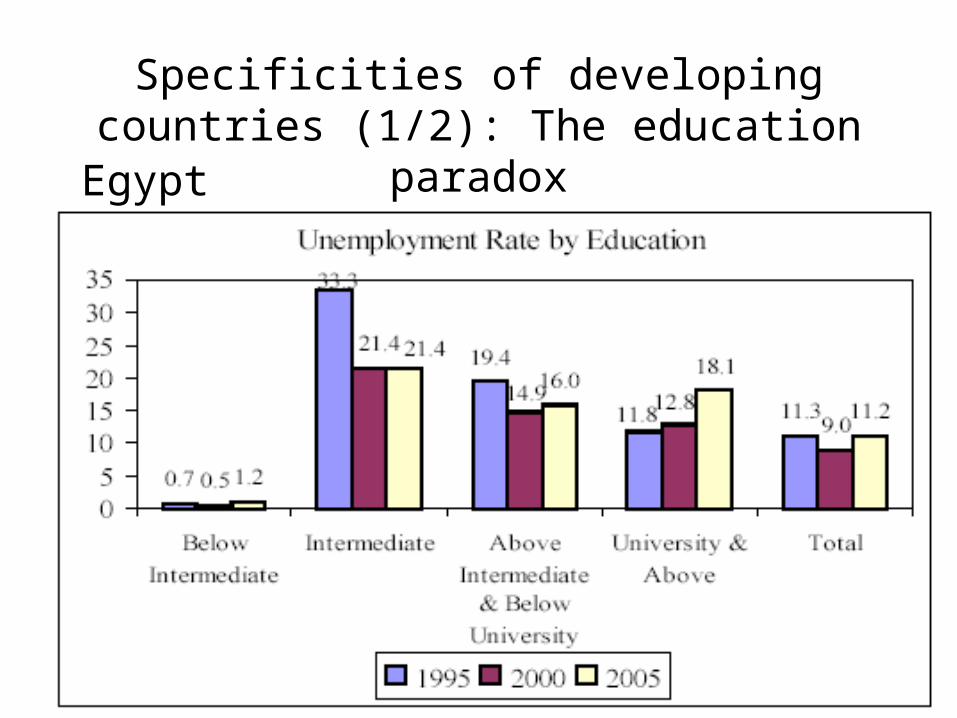
Specificities of developing countries (1/2): The education paradox
Egypt
Specificities of developing countries (½): Competing explanations
(a) The unrealistic wage expectations
• hypothesis: “More educated workers seek jobs which would pay them more than the market is willing to pay, perhaps because workers possess the wrong set of skills.”

Specificities of developing countries (½): Competing explanations
(b) The queuing hypothesis:
• The unemployed wait for an opportunity to take “good” jobs -- jobs in the civil service (stability, generous fringe benefits) and formal private sector.
• By implication, the civil service wage premium attracts job-seekers to queue and thus generates unemployment.
Specificities of developing countries (2/2): The complexity of flows
• ILO : dropping the search criterion may be more appropriate in countries or situations “where the conventional means of seeking work are of limited relevance, where the labor market is largely unorganized or of limited scope, where labor absorption is, at the time, inadequate, or where the labor force is largely self-employed” (ILO, 1982)

Specificities of developing countries (2/2) : The complexity of flows
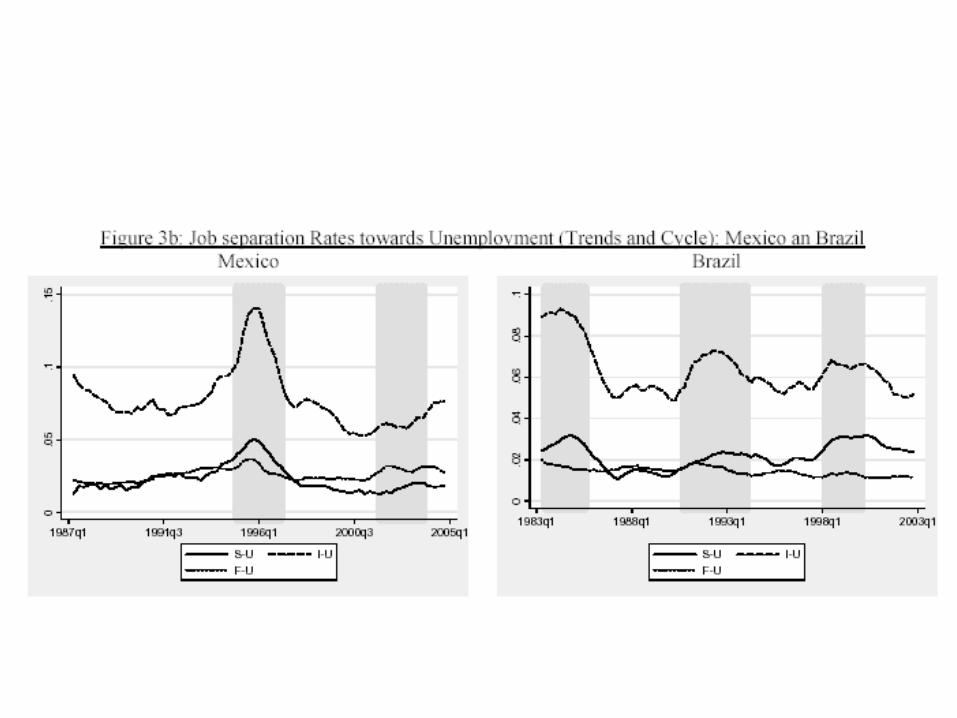
• Cyclical Movements in Unemployment and Informality in Developing Countries, IZA DP No. 3514. Mariano Bosch & William Maloney
• Measure flows from / into – Formal employment– Informal paid work– Informal self-employment
• Panel data, Mexico & Brazil

The complexity of flows
• Mexico: National Urban Employment Survey (Encuesta Nacional the Empleo Urbano, ENEU)
• Quarterly household interviews in the 16 major metropolitan areas.
• Long questionnaire: participation in the labor market, wages, hours worked, etc.
• Tracks a fifth of each sample across a five quarter period

The complexity of flows
• Brazil: Monthly Employment Survey (Pesquisa Mensal de Emprego, PME)
• Monthly household interviews in 6 of the major metropolitan regions (covering 25% of the national labor market)
• Questionnaire = similar to the ENEU• Tracks each household during four consecutive
months and then drop them from the sample for 8 months, after which they are reintroduced for another 4 months
The complexity of flows
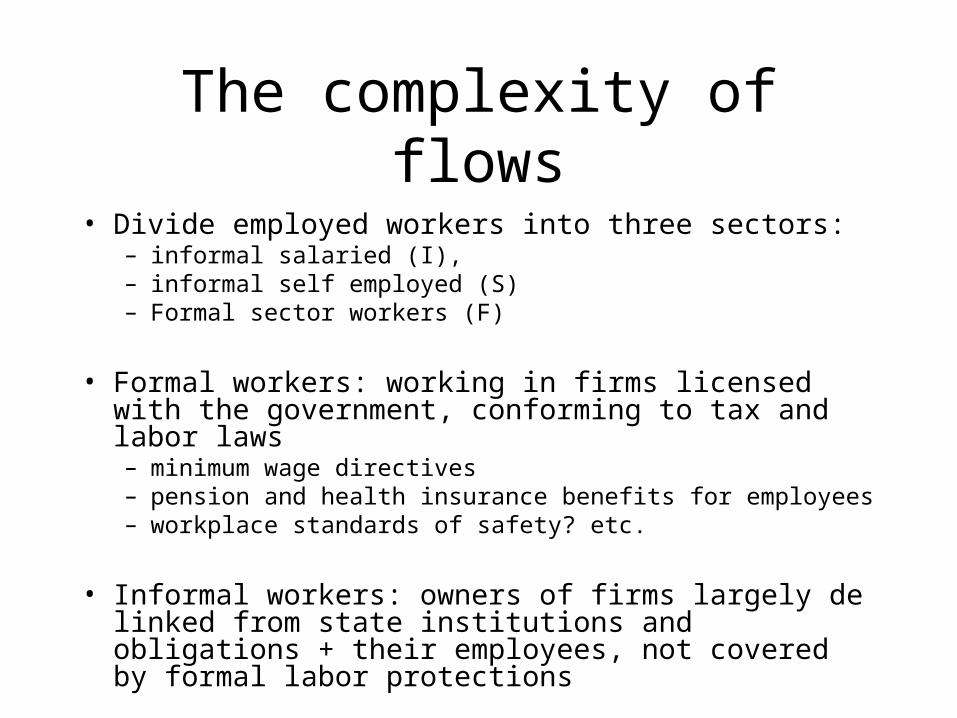
• Divide employed workers into three sectors: – informal salaried (I), – informal self employed (S) – Formal sector workers (F)
• Formal workers: working in firms licensed with the government, conforming to tax and labor laws – minimum wage directives– pension and health insurance benefits for employees– workplace standards of safety? etc.
• Informal workers: owners of firms largely de linked from state institutions and obligations + their employees, not covered by formal labor protections
• 50 – 60% = employed in formal sector (F)
• 25 – 35% = employed in informal sector (I)
• 20 – 30% of the labor force= independent or self-employed workers (S)
• Most of these are informal workers


A note on missing information
• Middle-East and North African Countries

5 – The European Labor Force Surveys

A legally binding framework• European core statistics are subject to
regulations
• Eurlex_CR577_98.pdf
How households are weighted
• Initial weight : 560 • Final weight: around 700
• The weights on the respondents are calculated so that the total population by age and gender is the same as in the latest Census data (2007)
• Non-respondents are replaced by households from same urbanization level, type of dwelling, number of rooms in the dwelling… All we known from the sample frame, the 1999 census (or by another new dwelling if did not exist in 1999)

Data collection
• 6 interviews, every 3 months lasts for 1,5 year
• 1st and last itw = face to face, usually at the respondent’s home
• 2nd to 5th itw = by phone

The « rotation bias »
effet du rang d'interrogation sur le taux de chômage moyenne sur 11 trimestres
8,5
9
9,5
10
10,5
11
1er 2ème 3ème 4ème 5ème 6ème
rang d'interrogation du sous-échantillon
tau
x d
e ch
ôm
age
Données pondérées Données brutes

« The » unemployment figure
• Big controversy in 2007• The trend in monthly statistics from ANPE
rolls was down• The LFS figure was stable
• Insee was paralysed by technical debates (non response, rotation bias, confidence intervals)
« The » unemployment figure
• Confidence interval (95%) on unemployment rate is +/- 0,4 pts
• This represents about 100 000 people
« The » unemployment figure
• Meaning: your 8,81% should rather be stated as “There is a .95 probability that the unemployment rate is in the interval:
[8,4 ; 9,2]”
• Monthly changes are impossible to record
• How politically audible is that? Are the media willing to explain it?

Current trends in LFS
• The current evolution is towards a more complex LFS to better account for:– Self-employed– People with more than 1 job– Underemployment
• The “unemployment” category is exploding along with the production model that saw it become prominent (full time job)
6 – Measuring the grey areas
Measuring the “grey areas”
• Being unemployed is a 0/1 variable
• The notorious “halo”

Measuring the “grey areas”thousands pct
Out of work willing to work 2869 100,0%ILO: Unemployed 2101 73,2%ILO: Out of the LF 768 26,8%
290 10,1%disouraged workers 199 6,9%hampered workers 50 1,7%waiting for results of previous search actions 40 1,4%
478 16,7%personal or family commitments 140 4,9%must complete education/training 117 4,1%sick or disabled 85 3,0%other reasons 136 4,7%
Out of LF: not available within 2 weeks because…
Out of LF: available within 2 weeks but not looking

6 – Measuring policy outcome

Measuring a policy outcome
• Self-Sufficiency Project (SSP): a Canadian research and demonstration project
• Idea: “make work pay” for long-term income assistance (IA) recipients by supplementing their earnings.
• Lone parents on IA qualified for a generous earnings supplement if they took up full-time work and left the welfare rolls within 12 months of entering the project.
• Once qualified, they received a supplement that roughly doubled their pretax earnings during periods of full-time work in the next three years

Measuring a policy outcome
• 2 Canadian provinces– British Columbia – New Brunswick
• November 1992 to December 1999

Measuring a policy outcome: the experimental design
• Evaluation: whether participation in SSP resulted in increased earnings and employment ?
• A social experiment : participants randomly divided into a program group and a control group.
• A series of surveys — a baseline survey at the point of random assignment and follow-up surveys 18, 36 and 54 months after random assignment — was undertaken by Statistics Canada.
• Program designers theorized that the SSP earnings supplement would induce women who would otherwise have stayed on IA to enter and remain in the labor force.
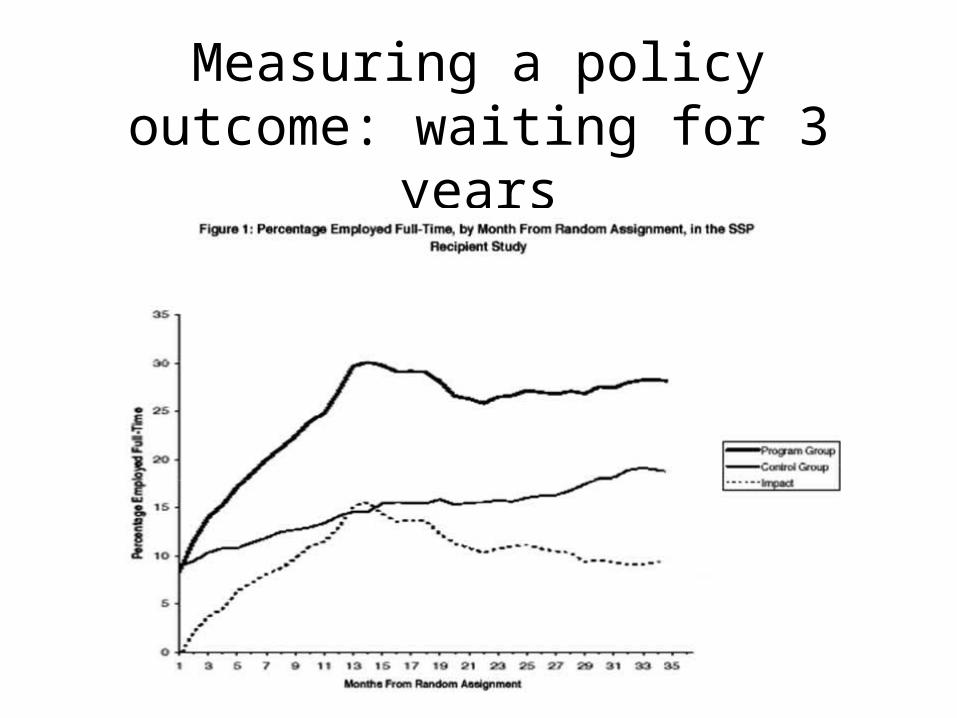
Measuring a policy outcome: waiting for 3 years

Measuring a policy outcome: waiting for 4 years…

Lessons to be learnt
• Numerator is obvious but always remember the denominator
• The population over which you compute a figure (ex: age limits) matter a lot (ex: labor force participation)
• Confidence intervals do not sell well… yet
• Trying to describe “grey zones” with a couple of figures is not a lost cause

Lessons to be learnt
• Long term policy outcomes are worth examining