Measurement. Physical Quantities Measurable characteristics that describe object’s size, position,...
29
Measurement
-
Upload
godwin-cook -
Category
Documents
-
view
238 -
download
1
Transcript of Measurement. Physical Quantities Measurable characteristics that describe object’s size, position,...

Measurement

Physical Quantities• Measurable characteristics that describe
object’s size, position, speed, energy, etc• All measured quantities have a dimension
(length, time, mass, etc)• Units used must be expressed with the
measurement• Quantities are of two types: scalars, with no
directional component, and vectors, which must include a direction

Units of Measurement
• Metric system used for all scientific measurements
• MKS based on meter, kilogram, second; also called SI system
• CGS based on centimeter, gram, second sometimes used for smaller quantities
• We will use the MKS system excluslively

MKS Fundamental UnitsQuantity Symbol Unit Abbrev.
length l meter m mass m kilogram kg time t second s
current I ampere A temp. T kelvin K
amount n mole mol luminous intensity
I candela cd

Standard Units
• Original standard meter was made of platinum, stored in Paris
• Now, meter is based on wavelength of a certain light emission
• Second, once based on part of a day, now based on atomic vibrations
• Only the kilogram is based on physical standard, stored in Paris

Derived Units
• Volume (liter) is derived from the meter
• Other units are combinations of fundamental units
• Newton, volt, joule, meters per second all derived units

Metric Prefixes
• Very large and very small numbers are common in physics, often expressed as powers of ten using scientific notation
• Multiples or fractional parts of any unit can be expressed using metric prefixes combined with a base unit

Metric Prefixes
• giga- G x 109
• mega- M x 106
• kilo-k x 103
• centi- c x 10-2
• milli- m x 10-3
• micro- x 10-6
• nano- n x 10-9
• pico- p x 10-12

Scientific Notation
• Used to simplify operations involving very large or very small numbers
• Use with numbers larger than 9,999 or smaller than 0.001
• Consists of a coefficient multiplied by ten raised to an exponent

Scientific Notation
• All significant digits and only significant digits are placed in coefficient, with one digit to left of decimal
• Exponent of 10 is found by how many places decimal must be moved from original number
• Movement to left is positive, to right is negative

Significant Figures
• Number of significant figures that can be reported depends on precision of measuring instrument
• When calculations are made, significance of answer depends on least significant measurement
• Counting numbers and fundamental constants are not considered in sig. figs., only measured numbers

Rules for Significant Figures• Non-zero numbers are always significant• Zeros between other nonzero digits are
significant• Zeros in front of nonzero digits are not
significant• Zeros at the end of a decimal number are
significant• Zeros at the end of a whole number are not
significant unless they have been measured and are indicated by a line over the zero

Calculations With Significant Figures
• Multiplication and division: answer must be rounded off to the same number of digits as the least significant measurement used to obtain the answer
• Addition and subtraction: answer must be rounded off to the same number of decimal places as the measurement with the smallest number of decimal places

Rules for Rounding
• When the digit(s) following the last significant figure is <5, round down
• When the digit(s) following the last significant figure is >5, round up
• When the digit(s) following the last significant figure is exactly = 5, round down if the last sig fig is even, round up if the last sig fig is odd
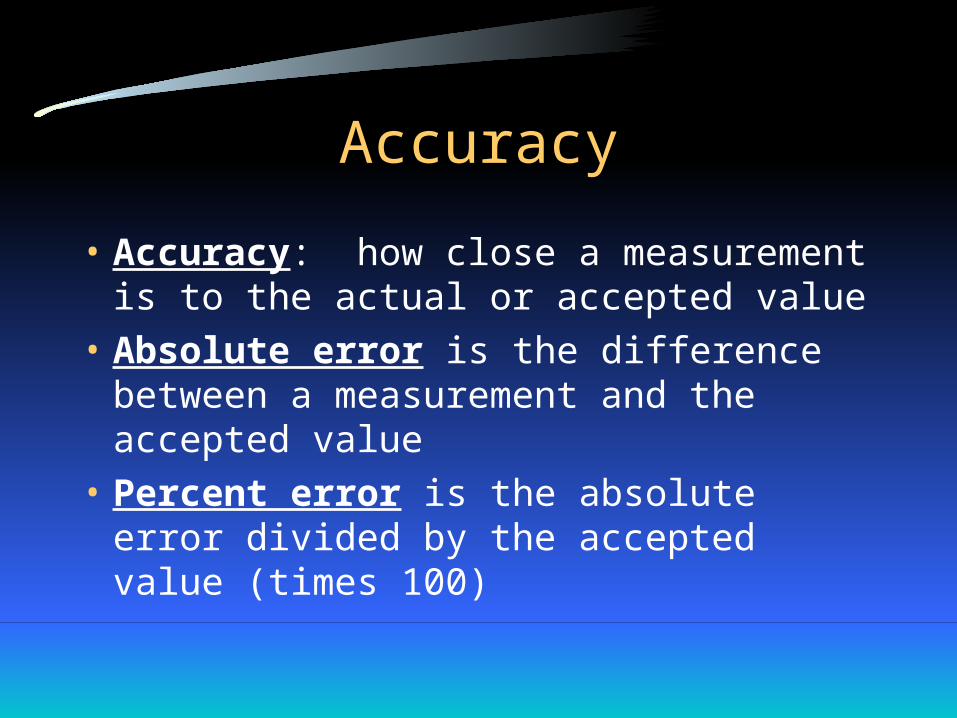
Accuracy
• Accuracy: how close a measurement is to the actual or accepted value
• Absolute error is the difference between a measurement and the accepted value
• Percent error is the absolute error divided by the accepted value (times 100)

Precision
• The degree of exactness of a measurement
• A measure of how many digits can be read from an instrument
• How well a series of measurements agrees with each other
• Precision is often estimated as one-half of the smallest division of the instrument

Types of Error
• Experimental error is not a mistake• Error is a measure of uncertainty of the
measurement• Systematic or systemic error: instruments
not properly calibrated or adjusted or used incorrectly; example: parallax
• Random error: unknown or unpredictable variation in experimental conditions

Graphing Data
• Helps show relationships between measured quantities
• Independent variable: controlled by experimenter, usually plotted on horizontal axis
• Dependent variable: depends on what is done to independent variable, usually plotted on vertical axis
• If time is one of the variables, it is often plotted on the horizontal axis
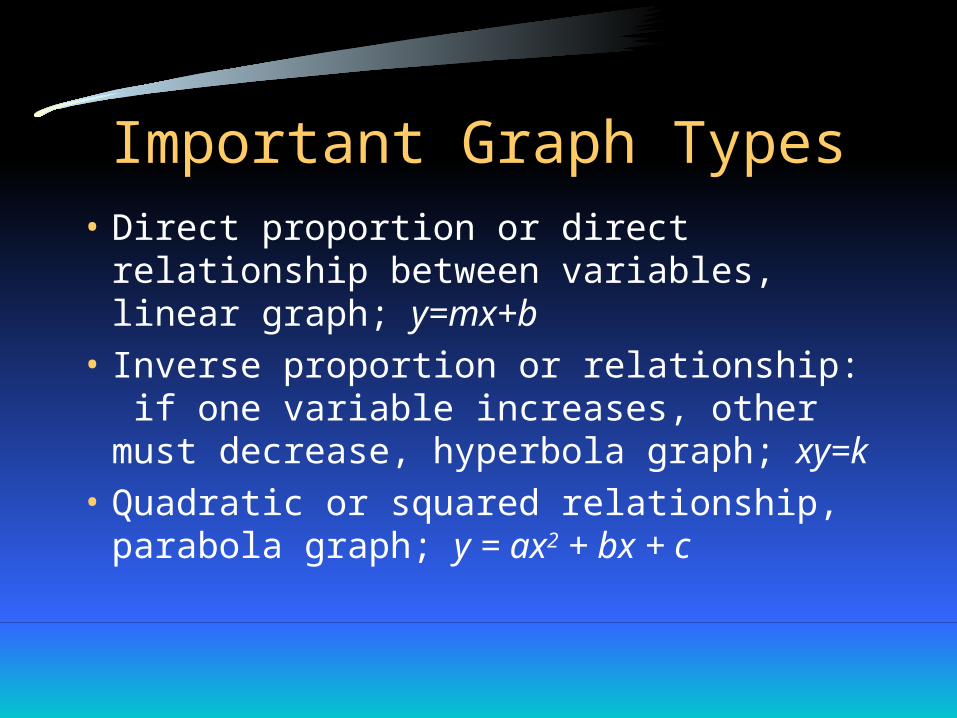
Important Graph Types
• Direct proportion or direct relationship between variables, linear graph; y=mx+b
• Inverse proportion or relationship: if one variable increases, other must decrease, hyperbola graph; xy=k
• Quadratic or squared relationship, parabola graph; y = ax2 + bx + c

Reading the Graph
• Graph is often used to estimate value not measured in experiment
• Interpolation: estimation between measured points
• Extrapolation: estimation beyond range of measured values

Elements of a Good Graph
• Graph must be large enough to be easily read and neat—use a straightedge for all lines
• Decide which variable goes on each axis
• Examine data to find the range; set up scales on axes that are consistent and easy to read
• Decide if the origin is a valid data point—if so, include it in the data set.

Elements of a Good Graph
• Axes must be labeled with units
• Plot the points—make them easily visible
• Determine the relationship shown by the data
• Draw best fit line or curve—don’t connect the points
• Graph must have descriptive title
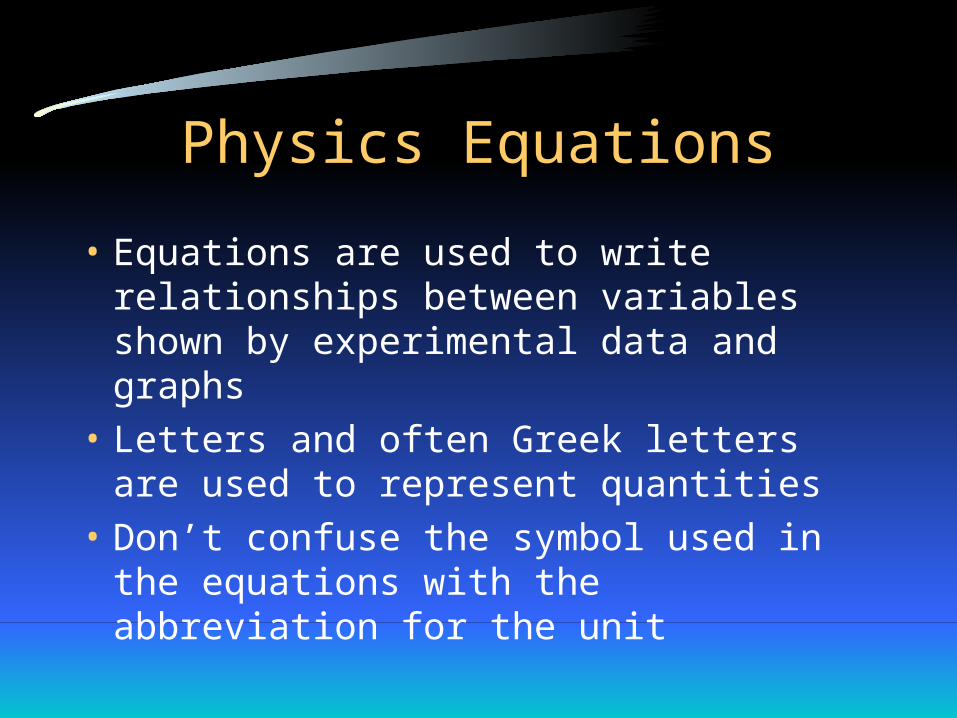
Physics Equations
• Equations are used to write relationships between variables shown by experimental data and graphs
• Letters and often Greek letters are used to represent quantities
• Don’t confuse the symbol used in the equations with the abbreviation for the unit

Dimensional Analysis
• Dimensions can be treated as algebraic quantities
• Quantities can be added or subtracted only if they have the same units
• When multiplying or dividing quantities, units must work out to be the proper unit of the answer
• A good way to check your work

Orders of Magnitude
• Round a number to the nearest power of 10 to find its order of magnitude
• Useful in estimating quantities or checking answers for reasonableness

Problem Solving
• Read problem carefully, write down given information and what is asked for with proper symbols. Draw a sketch
• Find an equation that relates given quantities and unknown. May be a 2 step problem needing 2 equations
• Solve basic equation for the unknown in terms of given quantities

Problem Solving
• Substitute numbers into equation including units and significant digits
• Check dimensions (units) to make sure they match the desired answer
• Do the math, rounding to correct sig figs
• Check to see if answer is reasonable

Vocabulary
• accuracy• precision• fundamental units• derived units• significant digits• absolute error• percent error• scalar
• interpolation• extrapolation• direct proportion• inverse proportion• hyperbola• independent variable• dependent variable• vector

Vocabulary
• personal error• systematic error• random error• parallax