Measurement of Vehicle Air Conditioning Pull-Down … · ORNL/TM-2016/275 Energy and Transportation...
15
ORNL/TM-2016/275 Measurement of Vehicle Air Conditioning Pull-Down Period John F. Thomas Shean P. Huff Larry G. Moore Brian H. West July 2016 Approved for public release. Distribution is unlimited.
Transcript of Measurement of Vehicle Air Conditioning Pull-Down … · ORNL/TM-2016/275 Energy and Transportation...

ORNL/TM-2016/275
Measurement of Vehicle Air Conditioning Pull-Down Period
John F. Thomas Shean P. Huff Larry G. Moore Brian H. West
July 2016
Approved for public release. Distribution is unlimited.

DOCUMENT AVAILABILITY
Reports produced after January 1, 1996, are generally available free via US Department of Energy (DOE) SciTech Connect. Website http://www.osti.gov/scitech/ Reports produced before January 1, 1996, may be purchased by members of the public from the following source: National Technical Information Service 5285 Port Royal Road Springfield, VA 22161 Telephone 703-605-6000 (1-800-553-6847) TDD 703-487-4639 Fax 703-605-6900 E-mail [email protected] Website http://www.ntis.gov/help/ordermethods.aspx
Reports are available to DOE employees, DOE contractors, Energy Technology Data Exchange representatives, and International Nuclear Information System representatives from the following source: Office of Scientific and Technical Information PO Box 62 Oak Ridge, TN 37831 Telephone 865-576-8401 Fax 865-576-5728 E-mail [email protected] Website http://www.osti.gov/contact.html
This report was prepared as an account of work sponsored by an agency of the United States Government. Neither the United States Government nor any agency thereof, nor any of their employees, makes any warranty, express or implied, or assumes any legal liability or responsibility for the accuracy, completeness, or usefulness of any information, apparatus, product, or process disclosed, or represents that its use would not infringe privately owned rights. Reference herein to any specific commercial product, process, or service by trade name, trademark, manufacturer, or otherwise, does not necessarily constitute or imply its endorsement, recommendation, or favoring by the United States Government or any agency thereof. The views and opinions of authors expressed herein do not necessarily state or reflect those of the United States Government or any agency thereof.

ORNL/TM-2016/275
Energy and Transportation Science Division
MEASUREMENT OF VEHICLE AIR CONDITIONING PULL-DOWN
PERIOD
John F. Thomas
Shean P. Huff
Larry G. Moore
Brian H. West
Oak Ridge National Laboratory
Date Published: July 2016
Prepared by
OAK RIDGE NATIONAL LABORATORY
Oak Ridge, TN 37831-6283
managed by
UT-BATTELLE, LLC
for the
US DEPARTMENT OF ENERGY
under contract DE-AC05-00OR22725

iii
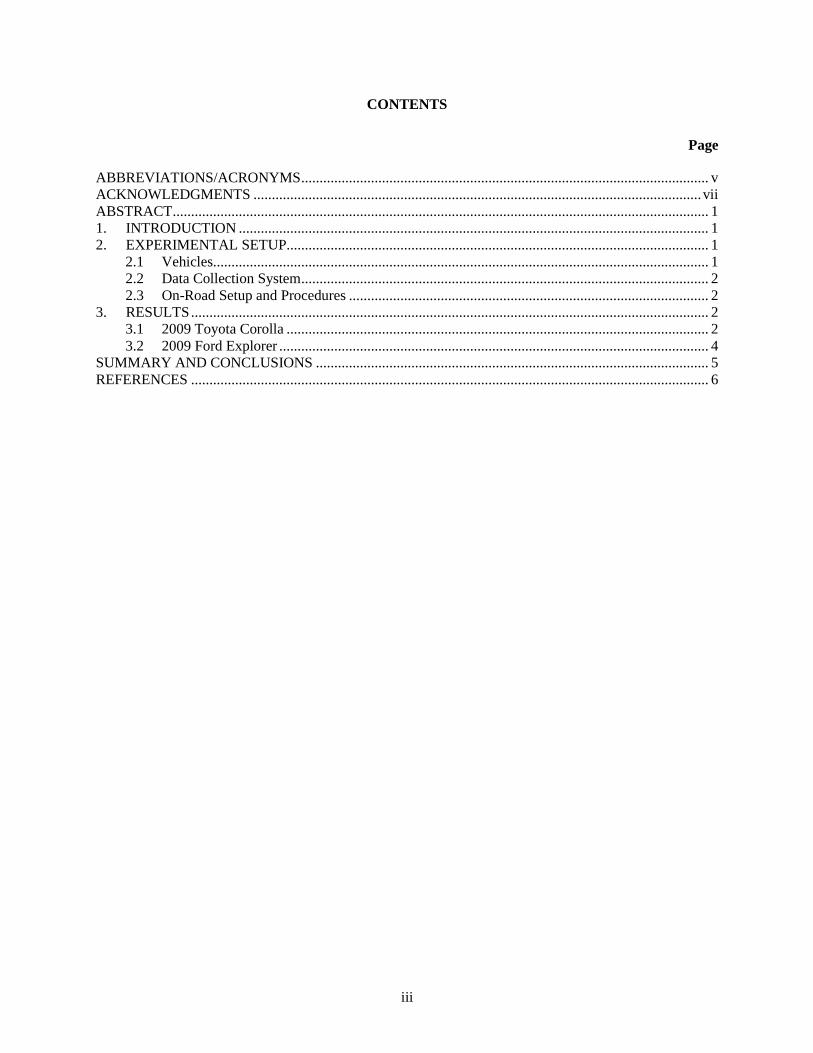
CONTENTS
Page
ABBREVIATIONS/ACRONYMS ............................................................................................................... v ACKNOWLEDGMENTS .......................................................................................................................... vii ABSTRACT .................................................................................................................................................. 1 1. INTRODUCTION ................................................................................................................................ 1 2. EXPERIMENTAL SETUP................................................................................................................... 1
2.1 Vehicles....................................................................................................................................... 1 2.2 Data Collection System ............................................................................................................... 2 2.3 On-Road Setup and Procedures .................................................................................................. 2
3. RESULTS ............................................................................................................................................. 2 3.1 2009 Toyota Corolla ................................................................................................................... 2 3.2 2009 Ford Explorer ..................................................................................................................... 4
SUMMARY AND CONCLUSIONS ........................................................................................................... 5 REFERENCES ............................................................................................................................................. 6

iv

v
ABBREVIATIONS/ACRONYMS
A/C air conditioning
Amb. ambient
Avg. average
ECT engine coolant temperature
°F degrees Fahrenheit
gal gallon
h hour
I4 inline four cylinder configuration
mph miles per hour
OBD-II on-board diagnostic system II, mandated as standard in 1996
s second
TC thermocouple
temp. temperature
V6 V-six cylinder configuration

vi

vii
ACKNOWLEDGMENTS
The work described was sponsored by the U.S. Department of Energy (DOE) Office of Energy Efficiency
and Renewable Energy, Vehicle Technologies Program. The authors gratefully acknowledge the support
of Dennis Smith at DOE. Several Oak Ridge National Laboratory staff made important contributions to
this work, including Bo Saulsbury, Bob Boundy, Robert Gibson, and Janet Hopson.
1
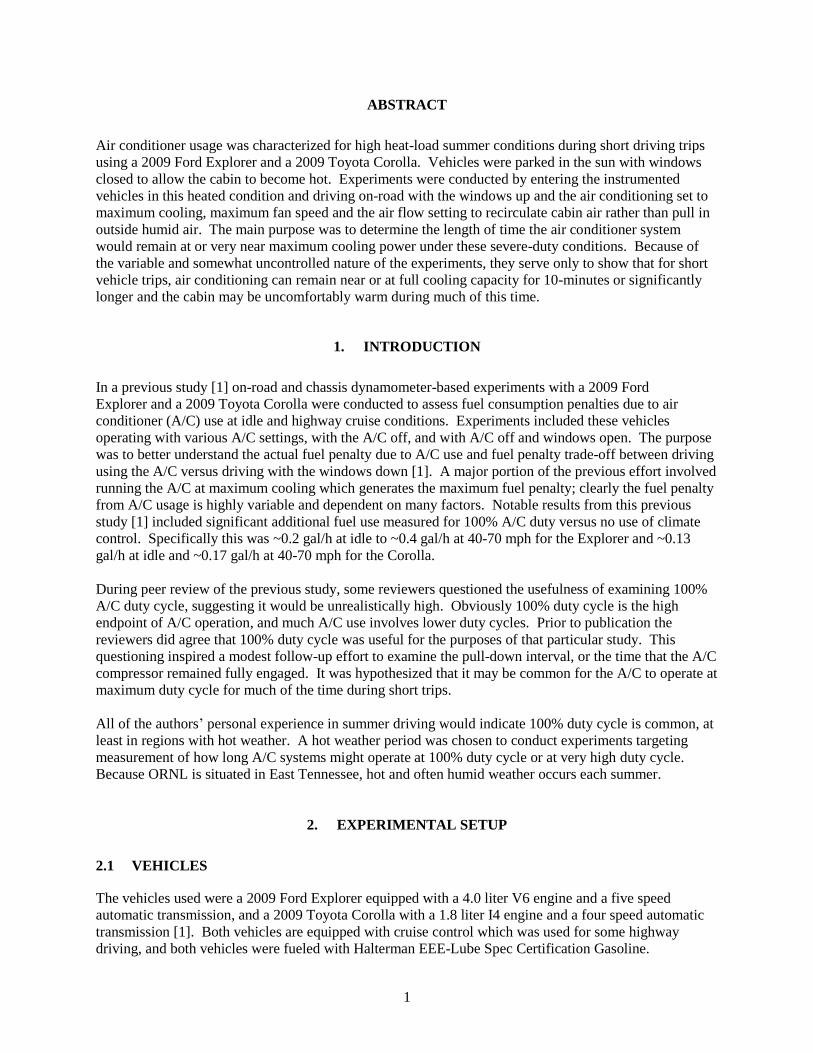
ABSTRACT
Air conditioner usage was characterized for high heat-load summer conditions during short driving trips
using a 2009 Ford Explorer and a 2009 Toyota Corolla. Vehicles were parked in the sun with windows
closed to allow the cabin to become hot. Experiments were conducted by entering the instrumented
vehicles in this heated condition and driving on-road with the windows up and the air conditioning set to
maximum cooling, maximum fan speed and the air flow setting to recirculate cabin air rather than pull in
outside humid air. The main purpose was to determine the length of time the air conditioner system
would remain at or very near maximum cooling power under these severe-duty conditions. Because of
the variable and somewhat uncontrolled nature of the experiments, they serve only to show that for short
vehicle trips, air conditioning can remain near or at full cooling capacity for 10-minutes or significantly
longer and the cabin may be uncomfortably warm during much of this time.
1. INTRODUCTION
In a previous study [1] on-road and chassis dynamometer-based experiments with a 2009 Ford
Explorer and a 2009 Toyota Corolla were conducted to assess fuel consumption penalties due to air
conditioner (A/C) use at idle and highway cruise conditions. Experiments included these vehicles
operating with various A/C settings, with the A/C off, and with A/C off and windows open. The purpose
was to better understand the actual fuel penalty due to A/C use and fuel penalty trade-off between driving
using the A/C versus driving with the windows down [1]. A major portion of the previous effort involved
running the A/C at maximum cooling which generates the maximum fuel penalty; clearly the fuel penalty
from A/C usage is highly variable and dependent on many factors. Notable results from this previous
study [1] included significant additional fuel use measured for 100% A/C duty versus no use of climate
control. Specifically this was ~0.2 gal/h at idle to ~0.4 gal/h at 40-70 mph for the Explorer and ~0.13
gal/h at idle and ~0.17 gal/h at 40-70 mph for the Corolla.
During peer review of the previous study, some reviewers questioned the usefulness of examining 100%
A/C duty cycle, suggesting it would be unrealistically high. Obviously 100% duty cycle is the high
endpoint of A/C operation, and much A/C use involves lower duty cycles. Prior to publication the
reviewers did agree that 100% duty cycle was useful for the purposes of that particular study. This
questioning inspired a modest follow-up effort to examine the pull-down interval, or the time that the A/C
compressor remained fully engaged. It was hypothesized that it may be common for the A/C to operate at
maximum duty cycle for much of the time during short trips.
All of the authors’ personal experience in summer driving would indicate 100% duty cycle is common, at
least in regions with hot weather. A hot weather period was chosen to conduct experiments targeting
measurement of how long A/C systems might operate at 100% duty cycle or at very high duty cycle.
Because ORNL is situated in East Tennessee, hot and often humid weather occurs each summer.
2. EXPERIMENTAL SETUP
2.1 VEHICLES
The vehicles used were a 2009 Ford Explorer equipped with a 4.0 liter V6 engine and a five speed
automatic transmission, and a 2009 Toyota Corolla with a 1.8 liter I4 engine and a four speed automatic
transmission [1]. Both vehicles are equipped with cruise control which was used for some highway
driving, and both vehicles were fueled with Halterman EEE-Lube Spec Certification Gasoline.

2
Thermocouples (TCs) were placed in several locations to collect both ambient and A/C system
conditions. The ambient temperature TC was located under the side view mirror in order to shield it from
direct sunlight. TCs were placed in front of and behind the A/C condenser to monitor the A/C system
heat rejection, and also in the center dash A/C vent to monitor the temperature of the air exiting the A/C
system. Additionally, vehicle cabin temperature was monitored with a TC in the second row passenger
area at a position representative of the approximate location of an adult passenger's head (commonly
referred to as the breath temperature [2]).
Although no solar load was measured, it is noteworthy that the Explorer has a black exterior and interior,
and was equipped with only moderate window tinting. The Corolla had a light gray exterior, a light gray
interior, and minimal window tinting.
2.2 DATA COLLECTION SYSTEM
Data from each vehicle’s data bus were collected using the OBD-II Interface and ScanXL Professional
software from Palmer Performance Engineering (www.palmerperformance.com). With this system OBD-
II data including Vehicle Speed Sensor (VSS), Mass Air Flow (MAF), and Throttle Position Sensor (TPS)
were collected. A diagnostics add-on capability applicable to the Ford vehicle was available from
previous efforts [1] which monitored A/C clutch engagement via the OBD-II port. For the Toyota
Corolla, A/C compressor status was monitored by measuring current to the magnetic clutch. The ambient
and A/C system temperature data were collected using a USB TC-08 Thermocouple Data Logger from
Pico Technology (www.picotech.com).
2.3 ON-ROAD SETUP AND PROCEDURES
The ORNL NTRC site is located in Knoxville and although straight and level stretches of highway are
rare in this region, relatively flat roads and relatively flat sections of Interstate 75 were used for these
experiments [1]. All experiments were completed during 8 test days over a 10 day hot-weather period.
Vehicles were parked in the full mid-day sun in an unshaded parking lot. As expected, some variety in
ambient conditions and vehicle initial conditions were observed during the experiments. Data were
collected over two drive cycles, one to mimic city cycle driving and another for high-speed interstate
driving, with most tests being the latter. These cycles were not consistent due to the changes in ambient
and traffic conditions.
3. RESULTS
3.1 2009 TOYOTA COROLLA
Four experiments were completed with the Corolla; three with mainly highway type driving and one with
city type driving. The highway driving tests began with 1-3 minutes of low-speed stop-and-go driving
until major roads were reached and highway driving was maintained. These experiments are summarized
in Table 1. In all experiments A/C compressor duty cycle was virtually 100% for at least 15 minutes.
The times given (in Table 1) are from the A/C being turned on until the event described. The compressor
command to operate stays on for a long initial period in all cases and even the shortest periods (7/17 and
7/19) were followed immediately by an extended “compressor on” period. Although the city cycle test on
7/17 shows a large time (25 minutes) for the cabin to reach the chosen metric of 80 °F, it only took about
5 minutes to reach 85 °F. For this particular drive cycle, prolonged driving at 40 mph from about 350 to
600 seconds was followed by more stop-and-go driving which reduced the engine speed, slowed the
compressor speed and reduced air flow through the condenser (lowering A/C cooling capacity). There
were no repeats of this individual test, therefore conclusions should be made with caution. Test 5b shows

3
the expected result that an 80 °F cabin temperature is reached sooner with a lower cabin starting
temperature.
Averaged ambient wet bulb, dry bulb and dew point temperature are reported to document that the
weather was hot with significant humidity. The average ambient temperature varies from the dry bulb
temperature slightly because the dry and wet bulb temperatures were averaged over different time
windows (for example, the wet bulb temperature was invalid during stops due to lack of air flow and this
portion of time was excluded from averaging).
Table 1. Summary of pull down experimental results for the 2009 Toyota Corolla
Test Day, Date
City or Highway Driving
Cabin Start
Temp. (°F)
Avg. Amb. Temp.
(°F)
Time Until Compressor First Cycles
Off (s)
Time to Cabin
Reaching 80 °F
(s)
Ambient Wet Bulb
Temp. (°F)
Ambient Dry Bulb Temp.
(°F)
Ambient Dew Point Temp.
(°F)
5a, 7/16 H 138 94 1500 500 74.5 94.2 65.6
5b, 7/16 H 115 91 1480 230 76.1 91.1 70.0
8, 7/19 H 138 94 440* 830 77.7 93.9 71.4
6, 7/17 C 136 98 760* 1500 76.4 98.6 70.0 *compressor cycled off very briefly during a vehicle acceleration, and then stayed on continuously for over 10 additional minutes.
Measured results for experiment 5a are shown in Fig. 1. The first compressor-off event was observed
when the vehicle stopped and then accelerated at about 1500 s. Data review indicates that the compressor
may be turned off briefly due to the engine state (hard acceleration) as well as cooling demand. For the
7/19 case a near-stop is made at 440 seconds followed by a hard acceleration at which point the
compressor cycled off briefly and then was 100% engaged for a long period. In all cases the concept that
the A/C stays at or near full-load for a short trip under common hot weather initial conditions is
supported.
Figure 1. Results for Toyota Corolla pulldown experiment 5a. T=temperature.

4
3.2 2009 FORD EXPLORER
Nine experiments were completed with the Explorer, which are summarized in Table 2. Seven of the
tests involved low-speed, stop and go driving for 1-3 minutes before reaching major roads at which point
highway driving began. The two city driving tests involved mainly lower speed and stop and go driving.
Examples of measured results from the Explorer experiments are shown in Figs. 2 and 3.
The major observation is that A/C full cooling load is observed to continue for 7-23 minutes for this range
of tests. It can also be seen that hotter initial conditions for the highway driving tests consistently show
longer times until the compressor cycles. As expected, the city driving also appears to increase times for
continuous or near-continuous compressor operation, perhaps because the average compressor speeds are
lower and there is less cooling air flow through the condenser, both of which reduce the A/C cooling
capacity. Because the city cycle was only performed twice, conclusions are made with caution. The high
quality A/C clutch engagement data available for the Explorer allowed estimation of compressor on-time
fraction later in each test when cycling on and off was established.
Table 2. Summary of pull down experimental results for the 2009 Ford Explorer
Test Day, Date
City or Highway Driving
Cabin Start
Temp. (°F)
Avg. Amb. Temp.
(°F)
Time Until Compressor First Cycles
Off (s)
Time to Cabin
Reaching 80 °F
(s)
Compressor On-time Fraction
After Cycling Begins
Ambient Wet Bulb
Temp. (°F)
Ambient Dry Bulb
Temp. (°F)
Ambient Dew Point Temp.
(°F)
1, 7/11 H 128 88 600 1500 72% 75.6 87.7 70.7
4, 7/15 H 120 90 570 560 74% 75.4 90.0 69.3
5a, 7/16 H 132 94 960 940 90% 79.3 93.8 74.0
5b, 7/16 H 106.5 95 420 340 85% 79.8 94.8 74.3
6, 7/17 H 131 95 920 800 80% 77.3 95.4 70.0
7a, 7/18 H 139 95 970 1500 88% 76.5 97.2 67.8
7b, 7/18 H 114.5 93 490 490 83% 74.3 92.9 66.1
2, 7/12 C 134 88 1400 1500 95% 74.3 89.2 67.9
3, 7/13 C 128 88 1010 860 91-95% 75.4 89.2 69.7
Figure 2. Results for Ford Explorer highway driving pulldown experiment 1. T = temperature, ECT = engine
coolant temperature.

5
Figure 3. Results for Ford Explorer city driving pulldown experiment 2. T = temperature, ECT = engine
coolant temperature.
SUMMARY AND CONCLUSIONS
A model year 2009 sedan and SUV were parked in the full mid-day sun on hot summer days allowing the
cabins to reach high temperatures, typical of unshaded parking conditions in hot weather. Researchers
entered the vehicles and turned the A/C systems to maximum cooling settings and then drove the vehicles
to measure the time interval of 100% A/C duty cycle.
For the conditions tested, 7-25 minutes of 100% duty cycle was recorded for both vehicles.
After compressor cycling began, compressor on-time remained at 66-95% during the Explorer
tests. Duty cycle is dependent on ambient conditions, driving cycle, etc.
Pulldown of back seat temperature from 128-134°F initial temperature to 85°F generally took 8-
12 minutes.
For the broad range of conditions tested, it typically took 8-25 minutes for the cabin to reach
80°F.
From the previous study [1] the additional fuel use due to running the Ford Explorer A/C at 100%
duty cycle is ~0.2 gal/h at idle (a 55% increase) and ~0.4 gal/h at 40-70 mph (an increase of 27%
at 40 mph and 14% at 70 mph). For the Toyota Corolla the incremental fuel consumption was
~0.13 gal/h at idle (60% increase) and ~0.17 gal/h at 40-70 mph (representing a 22% increase at
40 mph to about a 9% increase at 70 mph).
Pull-down period is dependent on initial conditions. Parking in the shade, opening the windows
briefly before or at the start of the trip, and any other means to move the cabin temperature
toward the desired set point will reduce the A/C compressor load and lower the fuel penalty.

6
REFERENCES
1. S. Huff, B. West, J.F. Thomas, Effects of Air Conditioner Use on Real-World Fuel Economy,
SAE Technical Paper 2013-01-0551, April, 2013. doi: 10.4271/2013-01-0551.
2. Rugh, J., Hendricks, T., and Koram, K., “Effect of Solar Reflective Glazing on Ford Explorer
ClimateControl, Fuel Economy, and Emissions,” SAE Technical Paper 2001-01-3077, 2001,
doi:10.4271/2001-01-3077.