MEASUREMENT OF THE BEST METHOD BETWEEN CERTAINTY FACTOR …
12
Jurnal Ilmiah Informatika dan Komputer Vol. 22 No. 2 Agustus 2017 133 MEASUREMENT OF THE BEST METHOD BETWEEN CERTAINTY FACTOR AND BAYES THEOREM METHODS IN EXPERT SYSTEM BY USING SPSS AND ODM APPLICATIONS Windy Dwiparaswati Fakultas Ilmu Komputer dan Teknologi Informasi, Universitas Gunadarma Jl. Margonda Raya no. 100, Depok 16424, Jawa Barat [email protected] Abstract The science that study how to make a computer can act and have the intelligence of a human being is called artificial intelligence. One field of artificial intelligence is expert systems. Expert system must be able to work in uncertainty. Many researchers use methods in making expert system in a particular domain. In detecting a disease in an expert system, the results of data accuracy is a critical component for the achievement of the expected solution. Two studies explain the differences in the results of the accuracy of the Certainty Factor and Bayes method, although using the same domain that chronic kidney disease. This study aims to use the method of Certainty Factor (CF) and Bayes Theorem in representing the calculation results of ASD in children under 5 years old, compare the final value result of the Certainty Factor and Bayes Theorem Method, determine the best method between certainty factor and Bayes Theorem that has the best accuracy in detecting the possibility of children affected by autism spectrum disorders, with the application of SPSS and ODM. The final accuracy show 66.67% states that the final accuracy value use certainty Factor and Bayes method is as good on SPSS application, and 33.33% states that Certainty Factor which is the best method on ODM application. INTRODUCTION An expert system is a branch of artificial intelligence that uses -/special knowledge to solve a problem at the level of a human expert [1]. Expert system must be able to work in uncertainty. A number of theories have been found to resolve uncertainties, including the cla- ssical probability, Bayesian probability, Hartley theory based on classical sets, Shannon theory based on probability, Dempster Shafer theory, Zadeh's fuzzy theory, and certainty factor [1]. Based on these approaches, many researchers use these methods in making expert system in a particular domain. In detecting a disease in an expert system, the results of data accuracy is a critical component for the achievement of the expected solution. Each of these methods has a di- fferent calculation process, but have the same goal of providing the results of the accuracy of a hypothesis. The results of both methods can be analyzed and com- pared, so as to determine better methods for use in detecting autism spectrum dis- orders in children under 5 years old in this case. LITERATURE REVIEW Certainty Factor Method Certainty factor was introduced by Shortliffe Buchanan in the manufacture
Transcript of MEASUREMENT OF THE BEST METHOD BETWEEN CERTAINTY FACTOR …

Jurnal Ilmiah Informatika dan Komputer Vol. 22 No. 2 Agustus 2017 133
MEASUREMENT OF THE BEST METHOD BETWEEN CERTAINTY FACTOR AND BAYES THEOREM METHODS IN EXPERT SYSTEM
BY USING SPSS AND ODM APPLICATIONS
Windy Dwiparaswati
Fakultas Ilmu Komputer dan Teknologi Informasi, Universitas Gunadarma Jl. Margonda Raya no. 100, Depok 16424, Jawa Barat
Abstract
The science that study how to make a computer can act and have the intelligence of a human being is called artificial intelligence. One field of artificial intelligence is expert systems. Expert system must be able to work in uncertainty. Many researchers use methods in making expert system in a particular domain. In detecting a disease in an expert system, the results of data accuracy is a critical component for the achievement of the expected solution. Two studies explain the differences in the results of the accuracy of the Certainty Factor and Bayes method, although using the same domain that chronic kidney disease. This study aims to use the method of Certainty Factor (CF) and Bayes Theorem in representing the calculation results of ASD in children under 5 years old, compare the final value result of the Certainty Factor and Bayes Theorem Method, determine the best method between certainty factor and Bayes Theorem that has the best accuracy in detecting the possibility of children affected by autism spectrum disorders, with the application of SPSS and ODM. The final accuracy show 66.67% states that the final accuracy value use certainty Factor and Bayes method is as good on SPSS application, and 33.33% states that Certainty Factor which is the best method on ODM application.
INTRODUCTION
An expert system is a branch of artificial intelligence that uses -/special knowledge to solve a problem at the level of a human expert [1]. Expert system must be able to work in uncertainty. A number of theories have been found to resolve uncertainties, including the cla-ssical probability, Bayesian probability, Hartley theory based on classical sets, Shannon theory based on probability, Dempster Shafer theory, Zadeh's fuzzy theory, and certainty factor [1].
Based on these approaches, many researchers use these methods in making expert system in a particular domain. In detecting a disease in an expert system, the results of data accuracy is a critical
component for the achievement of the expected solution.
Each of these methods has a di-fferent calculation process, but have the same goal of providing the results of the accuracy of a hypothesis. The results of both methods can be analyzed and com-pared, so as to determine better methods for use in detecting autism spectrum dis-orders in children under 5 years old in this case.
LITERATURE REVIEW Certainty Factor Method
Certainty factor was introduced by Shortliffe Buchanan in the manufacture

134 Dwiparaswati, Measurement of…
of MYCIN. Certainty factor (CF) is a clinical parameter values given MYCIN to show how much confidence [1].
In the implementation of the di-sease diagnosis expert system will use the formula: CF(R1,R2) = CF(R1) + CF(R2) – [ (CF(R1) x CF(R2) ].
For a given value of CF is positive. The formula can then be applied to seve-ral different rules are stratified. CF value of each premise / symptom is the value given by an expert or literature that su-pport. Bayes Theorem Method
Bayes theorem is adopted from the name of the inventor Thomas Bayes around 1950. Bayes Theorem is a pro-bability theory that takes into account the condition of the probability of an event (hypothesis) depend on other events (evi-dence). Basically, the theorem says that an event occurring in the future or that has not occurred can be predicted with the requisite previous events that have occurred [2].
The probability itself can be defi-ned as a quantitative measure of the un-certainty of information or events. The probability of having an index value ranging from 0 to 1. It is also influenced by the total number of events during the experiment. If the probability of an event is 0 (zero), then the situation can be assu-red definitely will not happen. However, if the probability of an event is 1 (one), then the situation can be assured inevi-table. Meanwhile, suppose an event has a probability of 0.5, then the event has doubts that the maximum level [3].
In the Bayes theorem is often called the term conditional probability. Condi-tional probability is an event that may or may not depend on the occurrence of other events. This dependence can be written in the form of conditional pro-bability as follows: P (A | B), means that the probability that event A will occur when the incident occurred or B can be referred to as the joint probability of events A and B [3].
Bayes Theorem is a method used to deal with the uncertainty of the data and perform analysis in the decision making the best of a number of alternatives with the aim of producing optimal acquisition. Bayes theorem provides several formulas to draw conclusions based on the facts (evidence) and hypothesis [2].
Bayes Theorem evidence shape for single and single hypothesis can be seen in figure 1 below. Specification: P (H | E)= the probability of the hypothesis H happen if evidence E occurs. P (E | H)= the probability of evidence E, if the hypothesis H occur. P (H)= the proba-bility of the hypothesis H regardless of any evidence. P (E) = probability evi-dence E regardless of any.
Bayes Theorem evidence shape for single and double hypothesis can be seen in figure 2 below. Specification: P (Hi | E) = the probability of the hypothesis Hi happen if evidence E occur. P (E | Hi) = probability of evidence E, if the hypo-thesis Hi occur. P (Hi) = probability of the hypothesis Hi regardless of any evi-dence. m = number of hypotheses that occur SPSS.
Figure 1. Bayes Theorem Evidence Shape for
Single and Single Hypothesis

Jurnal Ilmiah Informatika dan Komputer Vol. 22 No. 2 Agustus 2017 135
Figure 2. Bayes Theorem Evidence Shape for Single and Double Hypothesis
SPSS is a shortening of the Statis-
tical Program for Social Science is a computer application program package for analyzing statistical data. SPSS can use almost all types of data files and use them to create reports in the form of tabu-lation, chart (graph), plot (diagram) of the various distributions, descriptive statis-tics, and complex statistical analysis.
So it can be said SPSS is a com-plete system, a comprehensive, integra-ted, and very flexible for statistical ana-lysis and data management, so that con-tinuation of SPSS was experiencing growth, which at the beginning of the release is the Statistical Package for the Social Science, but in its development turns into Statistical Product and Service Solution [5].
Paired Sample T Test Procedure Procedure paired sample t test was used to test two samples in pairs, whether having an average which are significantly different or not. To perform this proce-dure from SPSS main menu, choose Analyze → Compare Mean → Paired-Samples T Test. It will display a dialog box Paired Sample T-test. All numeric variables in your data file will be displayed in the list box va-riable [5]. (1) Move one or several pairs of variables at once to the box Paired Va-riables. To move the perform pair the fo-llowing steps: (a) Click on one of the variables, so it will be displayed as the first variable in the Current Selections box. (b) Click the other variables, as a partner, so it will be displayed as a se-cond variable in the Current Selections box. (c) To create a pair of variables aga-in. Repeat steps above. (d) Click the op-tions to determine the value of confi-
dence of 95%. (f) Click OK to get the results of the analysis. Open Decision Maker The Open Decision Maker (ODM) is designed to support a user in a decision making process. For this process ODM uses the Analytic Hierarchy Process (A-HP) method. This method is similar to the value benefit method, but it also com-pares the rating quality for all compa-risons and shows the consistency of the decisions which have been made. Use the AHP method it is also po-ssible to rate alternatives with an incon-sistency, but the inconsistency is displa-yed in the consistency ratio CR. The CR can be seen as the quality of the weigh-tings. A high CR is a sign of random/very inconsistent ratings. This additional in-formation the quality of decisions can be improved. ODM will guide the user from start to finish through the decision ma-king process step by step with a user friendly graphical interface [4].
RESEARCH METHODOLOGY
Research is the process of studying,
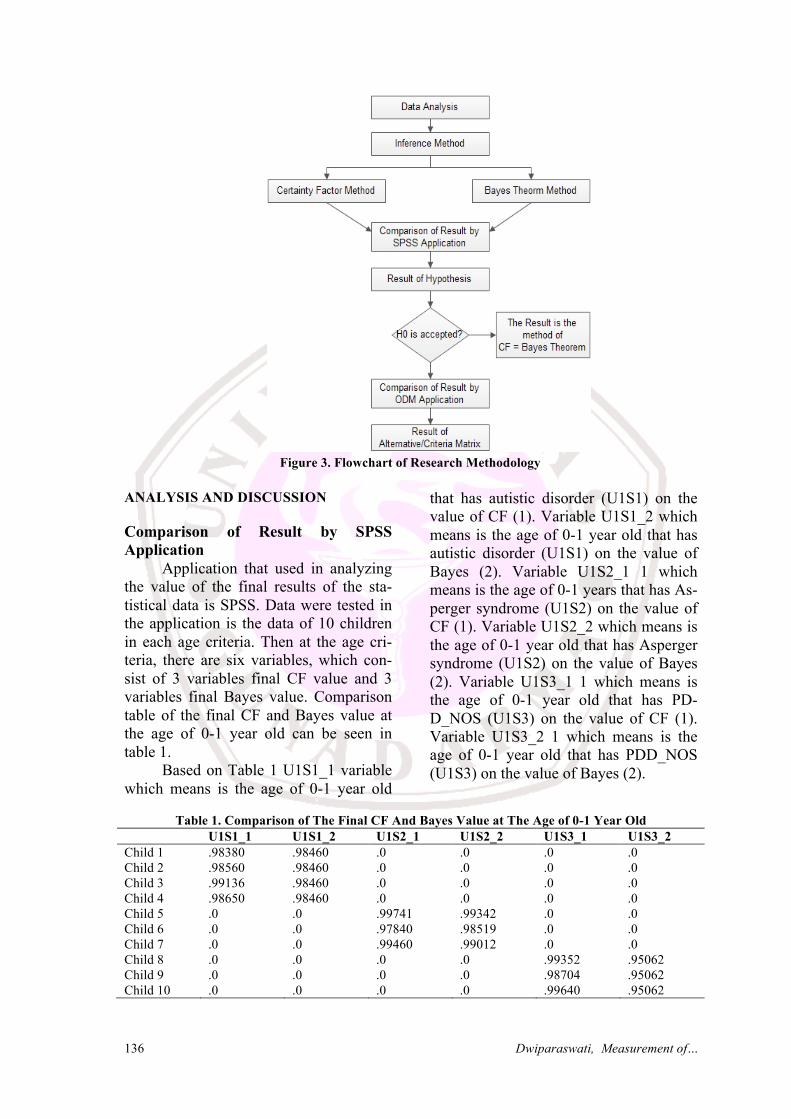
understanding, analyzing, and solving problems based on existing phenomena and also a series of long process and re-lated systematically. Good and focus re-search will lead to the good conclusion too, in order that the research goes well and targeted then research is needed a re-search methodlogy diagram that contains a description and steps that must be done in implementing application, ranging from early step is the knowledge base analysis until the final step is result of comparison. Research methodology diag-ram can be seen in figure 3.
136 Dwiparaswati, Measurement of…
Figure 3. Flowchart of Research Methodology
ANALYSIS AND DISCUSSION Comparison of Result by SPSS Application
Application that used in analyzing the value of the final results of the sta-tistical data is SPSS. Data were tested in the application is the data of 10 children in each age criteria. Then at the age cri-teria, there are six variables, which con-sist of 3 variables final CF value and 3 variables final Bayes value. Comparison table of the final CF and Bayes value at the age of 0-1 year old can be seen in table 1.
Based on Table 1 U1S1_1 variable which means is the age of 0-1 year old
that has autistic disorder (U1S1) on the value of CF (1). Variable U1S1_2 which means is the age of 0-1 year old that has autistic disorder (U1S1) on the value of Bayes (2). Variable U1S2_1 1 which means is the age of 0-1 years that has As-perger syndrome (U1S2) on the value of CF (1). Variable U1S2_2 which means is the age of 0-1 year old that has Asperger syndrome (U1S2) on the value of Bayes (2). Variable U1S3_1 1 which means is the age of 0-1 year old that has PD-D_NOS (U1S3) on the value of CF (1). Variable U1S3_2 1 which means is the age of 0-1 year old that has PDD_NOS (U1S3) on the value of Bayes (2).
Table 1. Comparison of The Final CF And Bayes Value at The Age of 0-1 Year Old
U1S1_1 U1S1_2 U1S2_1 U1S2_2 U1S3_1 U1S3_2 Child 1 .98380 .98460 .0 .0 .0 .0 Child 2 .98560 .98460 .0 .0 .0 .0 Child 3 .99136 .98460 .0 .0 .0 .0 Child 4 .98650 .98460 .0 .0 .0 .0 Child 5 .0 .0 .99741 .99342 .0 .0 Child 6 .0 .0 .97840 .98519 .0 .0 Child 7 .0 .0 .99460 .99012 .0 .0 Child 8 .0 .0 .0 .0 .99352 .95062 Child 9 .0 .0 .0 .0 .98704 .95062 Child 10 .0 .0 .0 .0 .99640 .95062

Jurnal Ilmiah Informatika dan Komputer Vol. 22 No. 2 Agustus 2017 137
Paired Sample T-Test Procedure paired sample t test was
used to test two samples in pairs, whether having an average which are significantly different or not. To perform this proce-dure from SPSS main menu, choose Ana-lyze → Compare Mean → Paired-Sam-ples T Test. It will display a dialog box Paired Sample T-test. All numeric varia-bles in your data file will be displayed in the list box variable. (1) Move one or several pairs of variables at once to the box Paired Variables. To move the per-form pair the following steps: (a) Click on one of the variables, so it will be dis-played as the first variable in the Current Selections box. (b) Click the other varia-bles, as a partner, so it will be displayed as a second variable in the Current Selec-tions box. (2) To create a pair of varia-bles again. Repeat steps above. (2) Click the options to determine the value of confidence of 95%. (3) Click OK to get the results of the analysis.
The data compared are the same of age criteria, disease, and the number of children. At the age of 0-1 year old (U1), Autistic disorder (S1) consists of 4 peo-ple, Asperger syndrome (S2) consists of 3 people, and PDD-NOS disease (S3) consists of 3 people. The number of data on each child's disease at the age of 0-1
year old is different therefore the com-parison is done one by one. Here ia a data screenshot of U1S1_1, U1S1_ 2, U1S2_1, U1S2_2, U1S3_1, and U1S3_2 Result of Hypothesis In the science of statistics, there are two possible hypotheses that happened. Two hypotheses are H0 and H1. In this case, are: H0 = There is no difference, which means CF and Bayes methods equally well in this case and H1 = There is a difference, which means there is one is better between CF and Bayes methods.
The value to be analyzed is Tcount value in the output t column on paired sample t test, to determine whether H0 is rejected or accepted, it must seek Ttable as limitations. Ttable value obtained from the t (a: df); with the a value is 5% and df (degrees of freedom) = N-1. Comparisons were done on U1S1_1 variable (at the age of 0-1 year old that has Autistic disorder by using CF method) with variable U1S1_2 (at the age of 0-1 year that has Autistic disorder by using Bayes method) with the amount is 4 people. Here is the output from SPSS at the age of 0-1 year old that has Autistic disorder.
Figure 3. Screenshot Data at The Age of 0-1 year old on SPSS Application

138 Dwiparaswati, Measurement of…
Table 2. Output U1S1 Value in CF and Bayes Methods with SPSS Application Paired Differences t df Sig.
(2-tailed
)
Mean Std. Deviation
Std. Error Mean
94% Confidence Interval of the Difference
Lower Upper Pair 1 U1S1_1-U1S1_2
0,00221500 0,00323124 0,00161562 -0, 00292662 0,00735662 1,371 3 0,264
Figure 4. The Curve of The Rejection and Reception Region U1S1 Variable
The result of the comparison tcount
U1S1_1 and U1S1_2 value is 1.371. Then count Ttable, T (a: df); with the a value is 5% and df (degrees of freedom) = N-1 = 4-1 = 3, then obtained Ttable = 3,182 because there are two sides t values range is -3182 < tcount < 3182.
Tcount results can also be described in a curve, where the curve is 95% indicate the reception region and 5% rejection region. The results of the data can be said H0 is rejected if the value of tcount in the table is not found in the reception region, as well as if H0 is accepted is if tcount on the tables con-tained in the reception area. The curve of the rejection and reception region U1S1 variable picture can be seen in figure 4.
Tcount in Table 2 is 1.371, and tcount on the reception region curve, which means is H0 is accepted. Thus the result at the age of 0-1 year old that has Autistic disorder (U1S1) states that by using both CF and Bayes method the results will be as good in determining Autistic disorder.
Comparisons also were done on U1S2_1 variables (at the age of 0-1 year old that has Asperger syndrome by using CF method) with variable U1S2_2 (at the age of 0-1 year old that has Asperger syndrome by using Bayes method) with the amount is 3 people.
The result of the comparison tcount U1S2_1 and U1S2_2 value is 0.153. Then count Ttable, T (a: df); with the a value is 5% and df (degrees of freedom) = N-1 = 3-1 = 2, then obtained Ttable = 4.303 because there are two sides t values range is -4.303 < tcount < 4.303.
The curve of the rejection and reception region U1S2 variable picture can be seen in figure 5. Tcount in Table 3 is 0.153 and tcount on the reception region curve, which means is H0 is accepted. Thus, the result at the age of 0-1 year old that has Asperger syndrome (U1S2) states that by using both CF and Bayes method the results will be as good in determining Asperger syndrome.

Jurnal Ilmiah Informatika dan Komputer Vol. 22 No. 2 Agustus 2017 139
Table 3. Output U1S2 Value in CF and Bayes Methods With SPSS Application Paired Differences t df Sig.
(2-tailed)
Mean Std. Deviation
Std. Error Mean
94% Confidence Interval of the Difference
Lower Upper Pair 1 U1S2_1-U1S2_2
0,0056133 0,00636673 0,00367583 -0, 01525450 0,1637717 0,153 2 0,893
Figure 5. The Curve of The Rejection and Reception Region U1S2 Variable
Table 4. Output U1S3 Value CF and Bayes Method with SPSS Application Paired Differences t D
f Sig. (2-
tailed)
Mean Std. Deviation
Std. Error Mean
94% Confidence Interval of the Difference
Lower Upper Pair 1 U1S3_1-U1S3_2
0,04170281 0,00479400 0,00276782 -0, 02979387
0,05361176 15,067 2 0,004
Comparisons also were done on
U1S3_1 variables (at the age of 0-1 year old that has PDD-NOS by using CF method) with variable U1S3_2 (at the age of 0-1 year old that has PDD-NOS by using Bayes method) with the amount is 3 people. Here is the output from SPSS at the age of 0-1 year old in PDD-NOS.
The result of the comparison tcount U1S3_1 and U1S3_2 value is 15.067. Then count Ttable, T (a: df); with the a va-lue is 5% and df (degrees of freedom) = N-1 = 3-1 = 2, then obtained Ttable = 4.303 because there are two sides t values range is -15.067 < tcount < 15.067. The curve of the rejection and reception re-gion U1S3 variable picture can be seen in figure 6.
Tcount in Table 4 is 15.067 and tcount on the rejection region curve, which means is H1 is accepted. Thus, the result at the age of 0-1 year old that has PDD-NOS (U1S3) states that there is one method is better between CF and Bayes methods in determining PDD-NOS.
Here is the overall results table of the compa-rison of U1S1_1 with U1S1_2, U1S2_1 with U1S2_2, U1S3_1 with U1S3_2, U2S1_1 with U2S1_2, U2S2_1 with U2S2_2, U2S3_1 with U2S3_2, U3S1_1 with U3S1_2, U3S2_1 with U3S2_2, U3S3_1 with U3S3_2, U4S1_1 with U4S1_2, U4S2_1 with U4S2_2, U4S3_1 with U4S3_2.

140 Dwiparaswati, Measurement of…
Figure 6.The Curve of The Rejection and Reception Region U1S3 Variable
Table 5. Overall Results of The Comparison Pair tcount ttable
1 U1S1_1 with U1S1_2 1.371 - 3.182 < tcount < 3.182 2 U1S2_1 with U1S2_2 0.153 - 4.303 < tcount < 4.303 3 U1S3_1 with U1S3_2 15.067 - 4.303 < tcount < 4.303 4 U2S1_1 with U2S1_2 17.995 - 4.303 < tcount < 4.303 5 U2S2_1 with U2S2_2 0.724 - 3.182 < tcount < 3.182 6 U2S3_1 with U2S3_2 0.942 - 4.303 < tcount < 4.303 7 U3S1_1 with U3S1_2 0.666 - 4.303 < tcount < 4.303 8 U3S2_1 with U3S2_2 45.241 - 4.303 < tcount < 4.303 9 U3S3_1 with U3S3_2 4.135 - 3.182 < tcount < 3.182 10 U4S1_1 with U4S1_2 1.368 - 12.71 < tcount < 12.71 11 U4S2_1 with U4S2_2 -0.006 - 3.182 < tcount < 3.182 12 U4S3_1 with U4S3_2 -0.033 - 3.182 < tcount < 3.182
Table 6. Decision Result of HO and H1
S1 S2 S3 U1 H0 H0 H1 U2 H1 H0 H0 U3 H0 H1 H1 U4 H0 H0 H0
Having obtained tcount on each
output overall comparison, then make a determination table H0 and H1 of the decision.
Based on the table 6 that there are 8 decisions stating H0 is accepted and 4 decision stating H1 is accepted. In a statement H0 is accepted, are U1S1, U1S2, U2S2, U2S3, U3S1, U4S1, U4S2, and U4S3 variables that by using both CF and Bayes method the results will be as good. In a statement H1 is accepted, are U1S3, U2S1, U3S2, and U3S3 variables, that there is one method is better between
CF and Bayes methods. H1 accepted decision will be tested again using a DSS application called Open Decision Maker. The test is only performed on 4 pieces of criteria, namely U1S3, U2S1, U3S2, and U3S3. Data were tested from the average value of each criterion is multiplied by 100%. Comparison of Result by ODM Application
The next comparison is using ODM application, to determine which method is better to use alternative and criteria in

Jurnal Ilmiah Informatika dan Komputer Vol. 22 No. 2 Agustus 2017 141
the application, after using the SPSS application that age criteria generate hypotheses H1 is accepted.
In the initial stage is to determine the alternative, alternative in this case is the method that will be compared, there are CF and Bayes. Next is to determine the criteria, the criteria in this case is the age criteria with disorder which results in hypothesis H1 is accepted. So that will be compared are some of the age criteria not the whole age criteria.
Before starting the next step, it must be calculated first each average alternative on each age criteria selected. The average score is calculated based on the final value for each child with method of CF and Bayes calculation (in the calculation of percent). It can be seen on table 7.
On table 8, the average value of the CF method at the age of 0-1 year old that has PDD-NOS (U1S3) is 99.23% and the average value of the Bayes method is 95.06%. The average value of the CF method at the age of 1 more-2 years old that has Autistic disorder (U2S1) is 99.72% and the average value of the Bayes method is 99.38%. The average value of the CF method at the age of 2 more -3 years old that has Asperger syndrome (U3S2) is 99.91% and the average value of the Bayes method is
99.50%. The average value of the CF method at the age of 2 more-3 years old that has PDD-NOS (U3S3) is 99.70% and the average value of the Bayes method is 96.72%. The next step is to determine the deviation between the average of CF and Bayes method on each criterion. It can be seen on table 8. In the table 8, deviation value of U1S3 is 4.17%, deviation value of U2S1 is 0.34%, deviation value of U3S2 is 0.41%, and deviation value of U3S3 is 2.98%. Then define the range deviation value to Weight. Weight is the result value scale of the criteria deviation or the alternative deviation, made by researcher, if there is no deviation between them (value of 0) then given a Weight of 1, which means that the CF and Bayes methods equally well. On table 9, the range value is made from the value of 0.1 to 1.99 is defined as Weight 2. The value of 2 to 2.99 is defined as Weight 3. The value of 3 to 3.99 is defined as Weight 4. The value of 4 to 4.99 is defined as Weight 5. The value of 5 to 5.99 is defined as Weight 6. The value of 6 to 6.99 is defined as Weight 7. The value of 7 to 7.99 is defined as Weight 8. The value of 8 to undefined is defined as Weight 9.
Table 7. Average Value of CF and Bayes
U1S3 U2S1 U3S2 U3S3 CF Bayes CF Bayes CF Bayes CF Bayes
1 0.9935 0.9506 0.9981 0.9943 0.9993 0.9950 0.9978 0.9758 2 0.9870 0.9506 0.9989 0.9957 0.9990 0.9950 0.9994 0.9839 3 0.9964 0.9506 0.9947 0.9915 0.9991 0.9950 0.9940 0.9456 4 - - - - - - 0.9965 0.9637
Average 0.9923 0.9506 0.9972 0.9938 0.9991 0.9950 0.9970 0.9672 Average
% 99.23% 95.06% 99.72% 99.38% 99.91% 99.50% 99.70% 96.72%
Table 8. Deviation of CF and Bayes
Criteria Average Deviation CF Bayes U1S3 99.23% 95.06% 4.17% U2S1 99.72% 99.38% 0.34% U3S2 99.91% 99.50% 0.41% U3S3 99.70% 96.72% 2.98%

142 Dwiparaswati, Measurement of…
Table 9. Weight of ODM Weight of ODM
Range Value Weight 0 1
0.1-1.99 2 2 - 2.99 3 3 - 3.99 4 4 - 4.99 5 5 - 5.99 6 6 - 6.99 7 7 - 7.99 8 8 - … 9
Table 10. Weighting Criteria
Criteria Deviation of criteria Weight Criteria Deviation
of criteria Weight
U2S1 0.34% 3.83% 4 U3S2 0.41% 0.07% 2 U1S3 4.17% U2S1 0.34% U3S2 0.41% 3.76% 4 U3S3 2.98% 2.64% 3 U1S3 4.17% U2S1 0.34% U3S3 2.98% 1.19% 2 U3S3 2.98% 2.57% 3 U1S3 4.17% U3S2 0.41%
Figure 7. Weighting Criteria: U2S1 – U1S3
Table 11. Weighting Alternative
CF Bayes Deviation of CF and Bayes Weight
U1S3 99.23% 95.06% 4.17% 5 U2S1 99.72% 99.38% 0.34% 2 U3S2 99.91% 99.50% 0.41% 2 U3S3 99.70% 96.72% 2.98% 3
Weighting criteria is to determine
Weight by calculating the deviation between the first criteria deviation to the next criteria deviation. Deviation in the first criteria derived from the deviation between the average alternative value of CF and Bayes. Below is a table of Weighting Cri-teria which shows the results of deviation calculations and Weight between the two criteria are compared. In the table 10, Weight value given is 4 to U2S1 and U1S3 criteria, as in figure 7 value criteria U1S3 greater than the U2S1. U3S2 and U1S3 criteria give Weight value is 4. U3S3 and U1S3 criteria give Weight value is 2. U3S2 and U2S1 criteria give
Weight value is 2. U3S3 and U2S1 cri-teria give Weight value is 3. And U3S3 and U3S2 criteria give Weight value is 3.
The next step is to calculate the Weighting Alternative. Weighting Alter-native is to determine Weight by calcu-lating the deviation between CF and Bayes alternative on each criterion. It can be seen table of Weighting Alternative on table 11.
In table 11 shows the Weight result on each criterion. In the criteria U1S3 shows Weight Value is 5, as in figure 8, the higher value is an alter-native value of CF. In the criteria U2S1 shows Weight Value is 2. In the criteria U3S2 shows Weight Value is 2.

Jurnal Ilmiah Informatika dan Komputer Vol. 22 No. 2 Agustus 2017 143
Result of Alternative/Criteria Matrix ODM application will produce value for each alternative. So it can be seen which one better alternative on each criterion. Criteria U3S3 shows Weight Value is 3. Based on the table 12, from the four criteria that included a ODM application states that the method of cer-tainty factor is better than Bayes theorem method at the age of 0-1 year old on PDD-NOS, at the age of 1 more - 2 years old on Autistic disorder, and at the age of 2 more - 3 years old on Asperger syn-drome and PDD-NOS. CONCLUSION
Based on the description in the previous chapter, it can be concluded that: (1) The calculation results total certainty value of ASD in children under 5 years old, can be calculated using Certainty Factor and Bayes Theorem
methods. (2) The Final value results of the CF and Bayes methods can be compared with the same of age criteria, symptoms inputted, and disorder out-putted.
The results of the comparison have diverse values at each age criteria, it is caused by a number of symptoms expe-rienced and the method of CF and Bayes values on each symptom are different. In the figure 9 shows the comparison table of the CF and Bayes method in all age criteria. (3) The final value calculation Certainty Factor and Bayes Theorem methods can determine the best method between Certainty Factor and Bayes Theorem that has the best accuracy in detecting the possibility of children affected by Autism Spectrum Disorders. Here is the decision result of each age criterion.
Figure 8. Weighting Alternative: U1S3
Table 12. Alternative/Criterion Matrix Alternative/Criteria U1S3 U2S1 U3S2 U3S3 Certainty Factor 83.33% 66.67% 66.67% 75.00% Bayes Theorem 16.67% 33.33% 33.33% 25.00%
Figure 9. Comparison of the CF and Bayes Methods

144 Dwiparaswati, Measurement of…
Table 14. Decision Result of The Best Method Autistic
Disorder Asperger Syndrome
PDD-NOS
0 – 1 year old CF = BAYES CF = BAYES CF 1 more – 2 years old CF CF = BAYES CF = BAYES 2 more – 3 years old CF = BAYES CF CF 3 more – 5 years old CF = BAYES CF = BAYES CF = BAYES
Based on Table 14, shows that Cer-
tainty Factor and Bayes methods equally well in the following cases: In children at the age of 0-1 year old who have Autistic disorder and Asperger syndrome, at the age of 1 more - 2 years old who have Asperger syndrome and PDD-NOS, at the age of 2 more - 3 years old who have Autistic disorder, and at the age of 3 - 5 years old who have Autistic disorder, Asperger syndrome, and PDD-NOS. The result of this decision is based on the application of SPSS that showed H0 is accepted.
Table 14 also shows that Certainty Factor method is the best method, that the method produces a final value best accu-racy, in the following cases: In children at the age of 0-1 year old who have PDD-NOS, at the age of 1 more - 2 years old who have Autistic disorder, at the age of 2 more - 3 years old who have Asperger syndrome and PDD-NOS. The result of this decision is based on ODM appli-cation that shows that the value of cer-tainty factor is first ranked in the amount of 77.15%. REMARKS
Suggestions for the next study is that researchers can use medical records
are more than 40 child, so that the level of confidence in a score higher, and expected to use more than one experts for knowledge base, using multiple sources of different experts will make an analysis of results clearer disease with symptoms experienced by the patient.
BIBLIOGRAPHY [1] Giorrantaro, J. & Riley, G., 2005.
Expert System: Principles and Programming, 4th Edition. Bos-ton: PWS Publishing Company.
[2] Kennet.T.Hu., 2011, Bayesan Design of Experiments for Com-plex Chemical Systems, Massa-chusetts Institute of Technology
[3] Ratnaningtyas.D.D, 2010, Aplika-si Teorema Bayes Dalam Penya-ringan Email, Makalah II2092 Probabbilitas dan Statistik-Sem. I Tahun 2010/2011.
[4] Blender, Blocherer, Rossmell, Open Decision Maker User Ma-nual. 2010
[5] Sarwono, Jonathan. 2006. Ana-lisis Data Penelitian Meng-gunakan SPSS. ANDI, Yogya-karta
![Pipette Calibration Certainty - Troemner · PDF fileImpact on Pipette Calibration Certainty[1] ... • Standard uncertainty of a measurement ... • Expanded uncertainties of measurement](https://static.fdocuments.us/doc/165x107/5aaa91c37f8b9a77188e57c7/pipette-calibration-certainty-troemner-on-pipette-calibration-certainty1-.jpg)