Measurement of Temporal Correlations of the Overhauser ...
4
Measurement of Temporal Correlations of the Overhauser Field in a Double Quantum Dot D. J. Reilly, 1, * J. M. Taylor, 2 E. A. Laird, 1 J. R. Petta, 3 C. M. Marcus, 1 M. P. Hanson, 4 and A. C. Gossard 4 1 Department of Physics, Harvard University, Cambridge, Massachusetts 02138, USA 2 Department of Physics, Massachusetts Institute of Technology, Cambridge, Massachusetts 02139, USA 3 Department of Physics, Princeton University, Princeton, New Jersey 08544, USA 4 Department of Materials, University of California, Santa Barbara, California 93106, USA (Received 24 December 2007; published 4 December 2008) In quantum dots made from materials with nonzero nuclear spins, hyperfine coupling creates a fluctuating effective Zeeman field (Overhauser field) felt by electrons, which can be a dominant source of spin qubit decoherence. We characterize the spectral properties of the fluctuating Overhauser field in a GaAs double quantum dot by measuring correlation functions and power spectra of the rate of singlet- triplet mixing of two separated electrons. Away from zero field, spectral weight is concentrated below 10 Hz, with 1=f 2 dependence on frequency f. This is consistent with a model of nuclear spin diffusion, and indicates that decoherence can be largely suppressed by echo techniques. DOI: 10.1103/PhysRevLett.101.236803 PACS numbers: 73.21.La, 03.67.Lx, 73.63.Kv Electron spins in quantum dots are an attractive candi- date for quantum bits (qubits) [1,2]. For gate-defined de- vices made using GaAs, the coupling of single electron spins to 10 6 thermally excited nuclear spins creates a fluctuating effective Zeeman field (the Overhauser field), B nuc , with rms amplitude B nuc 1–3 mT [3–7]. At experi- mentally accessible temperatures, B nuc fluctuates both as a function of position and time, with temporal correlations over a broad range of time scales, and is the dominant source of spin dephasing [8–13] and low-field spin relaxa- tion [3,4,7,14–16] in these systems. Spin manipulation schemes [10,17–19] to control spin dephasing, such as spin echo and its generalizations, depend critically on a knowledge of correlations and time scales of the fluctuat- ing nuclear environment. Previously, fluctuating Overhauser fields have been in- vestigated in atomic systems [20] using optical Faraday rotation, superconducting quantum interference devices [21], and force-detected magnetic resonance [22]. In quan- tum dots, dynamic nuclear polarization (DNP) [23–26] can drive the nuclear system beyond equilibrium to produce fluctuating currents and feedback effects in connection with Pauli spin blockade [15,27–29]. In this Letter, we report measurements of the temporal correlations and power spectral densities of the nuclear environment in a two-electron GaAs double-quantum-dot system. In contrast to previous work [15,25,26], we do not drive the nuclear system using DNP, but rather probe the statistical fluctuations of the unpolarized nuclear bath in thermal equilibrium [8,12]. Fluctuations of the Overhauser field are detected as fluctuations in the dephasing time of a two-electron spin state, making use of high-bandwidth proximal charge sensing [30]. Fluctuations are found to be broadband over the measurement bandwidth, 40 mHz– 1 kHz, and sensitive to an applied magnetic field in the range B ¼ 0–20 mT. Experimental results are shown to be consistent with a simple diffusion model of nuclear dy- namics, also presented here. The double quantum dot is formed by Ti=Au top gates on a GaAs=Al 0:3 Ga 0:7 As heterostructure with a two- dimensional electron gas (2DEG) with density 2 10 15 m 2 and mobility 20 m 2 =Vs, 100 nm below the sur- face [Fig. 1(a), inset], similar to devices reported previ- ously [9,26]. Measurements are made in a dilution refrigerator with base electron temperature of 120 mK. The conductance G QPC of a proximal radio frequency quantum point contact (rf QPC) is sensitive to the charge configuration of the double dot. G QPC controls the quality factor of a rf tank circuit, modulating the reflected power of a 220 MHz carrier. Demodulation yields a voltage V rf , proportional to G QPC , that constitutes the charge-sensing signal [30]. The applied field B is oriented perpendicular to the 2DEG. Figure 1(a) shows the relevant energy levels of the double dot in the vicinity of the (2,0)–(1,1) charge tran- sition [first (second) index is the charge in the left (right) dot]. Interdot tunneling t c and detuning from the charge degeneracy are determined by electrostatic gates. A gate- pulse [Fig. 1(b)] cycle prepares new singlets each iteration by configuring the device deep in (2,0), at point (P), where transitions to the ground state singlet ð2; 0ÞS occur rapidly [14]. Electrons are then separated to position S in (1,1) for a time ( S where precession between the initial singlet and one of the triplet states is driven by components of the difference in Overhauser fields in the left and right dots, B nuc ¼ B l nuc B r nuc [9,13]. In an applied field, the position of the separation point determines whether the (1,1) singlet (S) is nearly degener- ate with one of the (1,1) triplets, with which it can then rapidly mix. Mixing of S with T 0 (the m s ¼ 0 triplet) occurs at large negative [left (green) dashed line in Fig. 1(b)] where exchange vanishes. S-T 0 mixing is driven PRL 101, 236803 (2008) PHYSICAL REVIEW LETTERS week ending 5 DECEMBER 2008 0031-9007= 08=101(23)=236803(4) 236803-1 Ó 2008 The American Physical Society
Transcript of Measurement of Temporal Correlations of the Overhauser ...

Measurement of Temporal Correlations of the Overhauser Field in a Double Quantum Dot
D. J. Reilly,1,* J.M. Taylor,2 E. A. Laird,1 J. R. Petta,3 C.M. Marcus,1 M. P. Hanson,4 and A. C. Gossard4
1Department of Physics, Harvard University, Cambridge, Massachusetts 02138, USA2Department of Physics, Massachusetts Institute of Technology, Cambridge, Massachusetts 02139, USA
3Department of Physics, Princeton University, Princeton, New Jersey 08544, USA4Department of Materials, University of California, Santa Barbara, California 93106, USA
(Received 24 December 2007; published 4 December 2008)
In quantum dots made from materials with nonzero nuclear spins, hyperfine coupling creates a
fluctuating effective Zeeman field (Overhauser field) felt by electrons, which can be a dominant source
of spin qubit decoherence. We characterize the spectral properties of the fluctuating Overhauser field in a
GaAs double quantum dot by measuring correlation functions and power spectra of the rate of singlet-
triplet mixing of two separated electrons. Away from zero field, spectral weight is concentrated below
10 Hz, with �1=f2 dependence on frequency f. This is consistent with a model of nuclear spin diffusion,
and indicates that decoherence can be largely suppressed by echo techniques.
DOI: 10.1103/PhysRevLett.101.236803 PACS numbers: 73.21.La, 03.67.Lx, 73.63.Kv
Electron spins in quantum dots are an attractive candi-date for quantum bits (qubits) [1,2]. For gate-defined de-vices made using GaAs, the coupling of single electronspins to �106 thermally excited nuclear spins creates afluctuating effective Zeeman field (the Overhauser field),Bnuc, with rms amplitude Bnuc � 1–3 mT [3–7]. At experi-mentally accessible temperatures, Bnuc fluctuates both as afunction of position and time, with temporal correlationsover a broad range of time scales, and is the dominantsource of spin dephasing [8–13] and low-field spin relaxa-tion [3,4,7,14–16] in these systems. Spin manipulationschemes [10,17–19] to control spin dephasing, such asspin echo and its generalizations, depend critically on aknowledge of correlations and time scales of the fluctuat-ing nuclear environment.
Previously, fluctuating Overhauser fields have been in-vestigated in atomic systems [20] using optical Faradayrotation, superconducting quantum interference devices[21], and force-detected magnetic resonance [22]. In quan-tum dots, dynamic nuclear polarization (DNP) [23–26] candrive the nuclear system beyond equilibrium to producefluctuating currents and feedback effects in connectionwith Pauli spin blockade [15,27–29].
In this Letter, we report measurements of the temporalcorrelations and power spectral densities of the nuclearenvironment in a two-electron GaAs double-quantum-dotsystem. In contrast to previous work [15,25,26], we do notdrive the nuclear system using DNP, but rather probe thestatistical fluctuations of the unpolarized nuclear bath inthermal equilibrium [8,12]. Fluctuations of the Overhauserfield are detected as fluctuations in the dephasing time of atwo-electron spin state, making use of high-bandwidthproximal charge sensing [30]. Fluctuations are found tobe broadband over the measurement bandwidth, 40 mHz–1 kHz, and sensitive to an applied magnetic field in therange B ¼ 0–20 mT. Experimental results are shown to be
consistent with a simple diffusion model of nuclear dy-namics, also presented here.The double quantum dot is formed by Ti=Au top gates
on a GaAs=Al0:3Ga0:7As heterostructure with a two-dimensional electron gas (2DEG) with density 2�1015 m�2 and mobility 20 m2=Vs, 100 nm below the sur-face [Fig. 1(a), inset], similar to devices reported previ-ously [9,26]. Measurements are made in a dilutionrefrigerator with base electron temperature of �120 mK.The conductance GQPC of a proximal radio frequency
quantum point contact (rf QPC) is sensitive to the chargeconfiguration of the double dot. GQPC controls the quality
factor of a rf tank circuit, modulating the reflected power ofa 220 MHz carrier. Demodulation yields a voltage Vrf ,proportional to GQPC, that constitutes the charge-sensing
signal [30]. The applied field B is oriented perpendicular tothe 2DEG.Figure 1(a) shows the relevant energy levels of the
double dot in the vicinity of the (2,0)–(1,1) charge tran-sition [first (second) index is the charge in the left (right)dot]. Interdot tunneling tc and detuning � from the chargedegeneracy are determined by electrostatic gates. A gate-pulse [Fig. 1(b)] cycle prepares new singlets each iterationby configuring the device deep in (2,0), at point (P), wheretransitions to the ground state singlet ð2; 0ÞS occur rapidly[14]. Electrons are then separated to position S in (1,1) fora time �S where precession between the initial singlet andone of the triplet states is driven by components of thedifference in Overhauser fields in the left and right dots,�Bnuc ¼ Bl
nuc � Brnuc [9,13].
In an applied field, the position of the separation pointdetermines whether the (1,1) singlet (S) is nearly degener-ate with one of the (1,1) triplets, with which it can thenrapidly mix. Mixing of S with T0 (the ms ¼ 0 triplet)occurs at large negative � [left (green) dashed line inFig. 1(b)] where exchange vanishes. S-T0 mixing is driven
PRL 101, 236803 (2008) P HY S I CA L R EV I EW LE T T E R Sweek ending
5 DECEMBER 2008
0031-9007=08=101(23)=236803(4) 236803-1 � 2008 The American Physical Society
by components of �Bnuc along the total field (applied plusOverhauser fields). In contrast, mixing of S with Tþ (thems ¼ þ1 triplet), which occurs at a less negative, field-dependent value of � [right (red) dashed line in Fig. 1(b)]where Zeeman splitting matches exchange, is driven bycomponents of �Bnuc transverse to the total field.Measuring the evolution out of the S state following sepa-ration, by measuring the return probability to (2,0) after acertain separation time, effectively measures these compo-nents of the Overhauser field difference in the two dots.Measurement (at position M) in (2,0) is made for �M ¼5 �s, during which only S return to (2,0) with appreciableprobability. The spin state—triplet or singlet—is thereby
converted to a charge state—(1,1) or (2,0), respectively—which is detected by the rf QPC.Once calibrated, Vrf gives the probability 1� PS that a
prepared singlet evolved into a triplet during the separa-tion time �S. Inside the readout triangle [Fig. 1(c)], trip-let states remain blocked in (1,1) for a time T1 � �M [14].Similarly, inside the rectangular region indicated inFig. 1(d), the prepared singlet mixes with Tþ and becomesblocked in (1,1). Calibration of Vrf uses the signal in (2,0)outside the readout triangle, where fast, spin-independentrelaxation occurs via (1,0) or (2,1), to define PS ¼ 1, andthe region within (1,1) to define PS ¼ 0.Fitting PSð�SÞ averaged over tens of seconds with a
Gaussian [9,13] [Fig. 1(e)] gives T�2 ¼ @=ðg�BBnucÞ �
15 ns corresponding to Bnuc � 1:6 mT (N � 6� 106),where g��0:4 is the electron g factor and �B is theBohr magneton. The effect of finite T1 on the calibration
of PS can be accounted by introducing a factor C ¼ ð1�e��M=T1ÞT1=�M [14] that relates PS to the value P0
S corre-
sponding to infinite T1, 1� PS ¼ ð1� P0SÞC. The depen-
dence of PS on �M (for a fixed T1 � 16 �s and�S ¼ 50 ns) is shown in Fig. 1(f). Applying this factor toFig. 1(e) gives P0
Sð�S � T�2Þ ¼ 1=3, the expected value
[13], without normalizing the sensor output.With less averaging, PS shows fluctuations that reflect
fluctuations of Overhauser field components. Figure 2
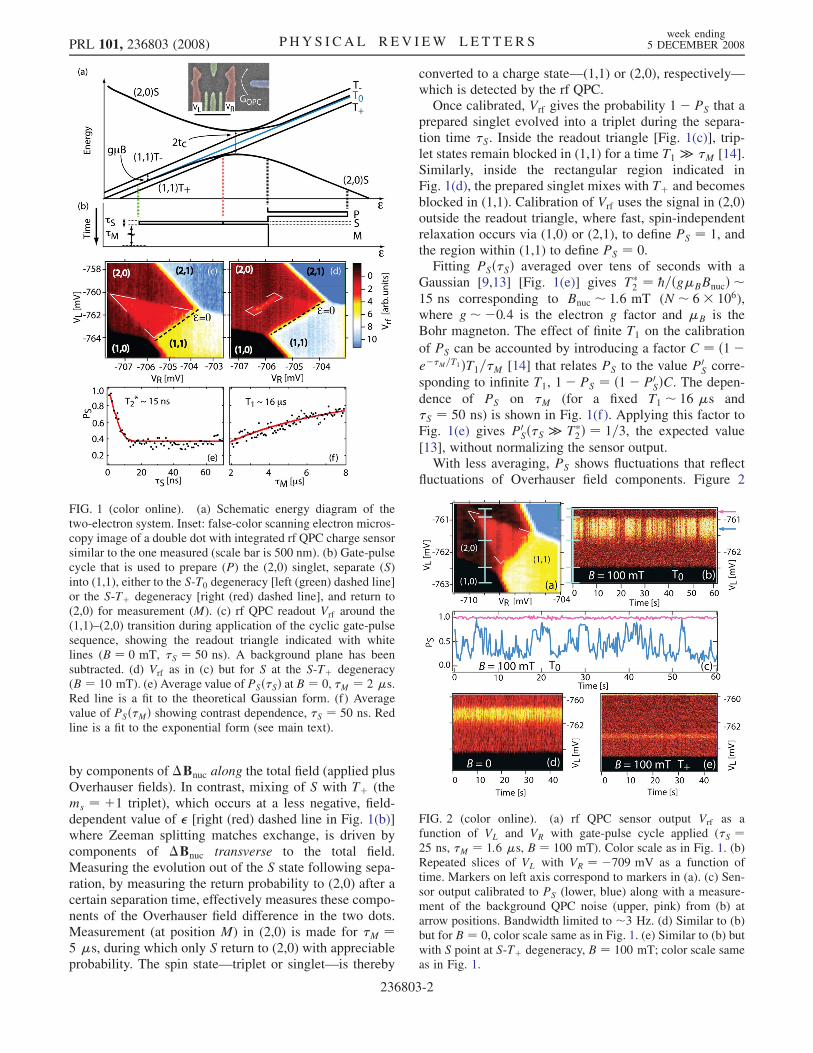
FIG. 2 (color online). (a) rf QPC sensor output Vrf as afunction of VL and VR with gate-pulse cycle applied (�S ¼25 ns, �M ¼ 1:6 �s, B ¼ 100 mT). Color scale as in Fig. 1. (b)Repeated slices of VL with VR ¼ �709 mV as a function oftime. Markers on left axis correspond to markers in (a). (c) Sen-sor output calibrated to PS (lower, blue) along with a measure-ment of the background QPC noise (upper, pink) from (b) atarrow positions. Bandwidth limited to �3 Hz. (d) Similar to (b)but for B ¼ 0, color scale same as in Fig. 1. (e) Similar to (b) butwith S point at S-Tþ degeneracy, B ¼ 100 mT; color scale sameas in Fig. 1.
FIG. 1 (color online). (a) Schematic energy diagram of thetwo-electron system. Inset: false-color scanning electron micros-copy image of a double dot with integrated rf QPC charge sensorsimilar to the one measured (scale bar is 500 nm). (b) Gate-pulsecycle that is used to prepare (P) the (2,0) singlet, separate (S)into (1,1), either to the S-T0 degeneracy [left (green) dashed line]or the S-Tþ degeneracy [right (red) dashed line], and return to(2,0) for measurement (M). (c) rf QPC readout Vrf around the(1,1)–(2,0) transition during application of the cyclic gate-pulsesequence, showing the readout triangle indicated with whitelines (B ¼ 0 mT, �S ¼ 50 ns). A background plane has beensubtracted. (d) Vrf as in (c) but for S at the S-Tþ degeneracy(B ¼ 10 mT). (e) Average value of PSð�SÞ at B ¼ 0, �M ¼ 2 �s.Red line is a fit to the theoretical Gaussian form. (f) Averagevalue of PSð�MÞ showing contrast dependence, �S ¼ 50 ns. Redline is a fit to the exponential form (see main text).
PRL 101, 236803 (2008) P HY S I CA L R EV I EW LE T T E R Sweek ending
5 DECEMBER 2008
236803-2

shows a slice through the readout triangle, obtained byrastering VL at fixed VR, with B ¼ 100 mT, �S ¼ 25 ns.At B ¼ 100 mT, fluctuations in PS have a flickering ap-pearance with broadband time dependence extending toseveral seconds. Comparing the quieter (upper, pink) tracein Fig. 2(c), for point M such that (1,1) always returns to(2,0), to the fluctuating (lower, blue) trace, where return to(2,0) requires S-T0 mixing by Overhauser fields, we seethat the amplitude of the fluctuating signal (lower, blue)is �100 times larger than the background noise of thecharge sensor. At B ¼ 0, slices across the readout triangledo not show a flickering (large, low-frequency) PS signal[Fig. 2(d)]. Figure 2(e) shows slices across the S-Tþ reso-nance [see Fig. 1(d)]. Here also, PS also does not have aflickering appearance, independent of B, reflecting rapidfluctuations of transverse components of �Bnuc. We avoidrapidly cycling through the S-Tþ transition, which canproduce DNP [26].
To investigate the spectral content of PS fluctuations,fast Fourier transforms (FFTs) of Vrf are taken with VL andVR positioned to sample the center of the readout triangle.Measurement at �S ¼ 1 ns, where PS � 1, has a 1=f formand is identical to the noise measured outside the readouttriangle, and constitutes our background of instrumentnoise. At B ¼ 0 no spectral content above the 1=f back-ground noise is seen [Fig. 3(a)]. With increasing B, anincreasing spectral content is observed below �100 Hz.For B> 20 mT, the spectra become independent of B. Thedependence of the power spectrum of PS on separationtime �S is shown in Fig. 4. We found that the largestfluctuations over the greatest frequency range occur for�S � T�
2 � 15 ns, and these fluctuations show a roughly
1=f2 spectrum. For �S < T�2 , PS remains near unity with
few fluctuations; for �S > T�2 low-frequency content is
suppressed while components in the range 1–10 Hz areenhanced.
We model fluctuations in PS as arising from the dynamicOverhauser magnetic field in thermal equilibrium. A clas-sical Langevin equation is used to describe fluctuations of�Bnuc arising from nuclear spin diffusion on distancesmuch larger than the lattice spacing and times much longerthan the time scale set by nuclear dipole-dipole interaction.For B � Bnuc, correlations of the Overhauser field can beevaluated analytically in terms of a dimensionless operator
A�z for each nuclear spin species �, where
P�x
�A�z;l �
Blnuc;z=Bnuc and similarly for the right dot, with x
75As ¼ 1,
x69Ga ¼ 0:6, x
71As ¼ 0:4. This gives hA�z ðtþ �tÞA�
z ðtÞi ¼½ð1þ �tD�=�
2zÞ1=2ð1þ�tD�=�
2?��1, at time difference
�t, where D� is the species-dependent spin diffusion
coefficient, �z is the electron wave function spatial extentperpendicular to the 2DEG (and along the external field),and �? is the wave function extent in the plane of the2DEG, assumed symmetric in the plane. Brackets h� � �idenote averaging over t and nuclear ensembles.
Statistics of PS for S-T0 mixing are found using the z
component of the Overhauser operators, �Az ¼
P�x
�ðA�z;l � A�
z;rÞ. For Gaussian fluctuations and a
species-independent diffusion constant, D, this gives a
mean hPSi ¼ 12 ½1þ e�2G2h�A2
z i� and autocorrelation
hPSðtþ �tÞPSðtÞi � hPSi2
FIG. 3 (color online). (a) Power spectra of PS at variousmagnetic fields, �S ¼ 25 ns. Spectra obtained by fast Fouriertransform (with Hamming window) of average of 8 tracessampled at 10 kHz. Background measurement noise (BG) foundby setting �S ¼ 1 ns at B ¼ 100 mT. Inset: numerical simula-tion results for corresponding magnetic fields: B ¼ 0 (pink),B ¼ 5 mT (blue), B ¼ 10 mT (green), B ¼ 100 mT (red).(b) Autocorrelation PS for �S ¼ 25 ns and B ¼ 100 mT (redcurve). Model function [Eq. (1)] (brown curve) and Monte Carloresult (black curve).
FIG. 4 (color online). Power spectra of PS at B ¼ 100 mT forseparation times �S ¼ 25 ns (red line) and �S ¼ 100 ns (blueline). Setting �S ¼ 1 ns (black line) yields background noise.Inset shows simulation results for B ¼ 100 mT, �S ¼ 25 ns(red) and �S ¼ 100 ns (blue). Note the suppression of low-frequency content and enhancement of midfrequency contentfor long �S in the experiment and simulation.
PRL 101, 236803 (2008) P HY S I CA L R EV I EW LE T T E R Sweek ending
5 DECEMBER 2008
236803-3

¼ e�4G2h�A2z i
4½coshð4G2h�Azðtþ �tÞ�AzðtÞiÞ � 1�; (1)
where G ¼ �S=T�2 is a gain coefficient. Autocorrelation at
B ¼ 100 mT [Fig. 3(b)] is obtained by Fourier transform-ing the power spectrum [31], and fit to the data, with thecontrast factor C [Fig. 1(f)], and the diffusion coefficientD, as fit parameters. Wave function widths are taken fromnumerical simulations of the device [32], �z ¼ 7:5 nm,�? ¼ 40 nm. The fit gives D� 10�13 cm2=s, consistentwith previous measurements on bulk GaAs samples usingoptical techniques [6]. For B> 20 mT, the data in Fig. 3(b)indicate an autocorrelation time of �3 s for PS corre-sponding to a time �d � 10 s for �Az to decorrelate byhalf of its initial value.
Near B ¼ 0, transverse components of the nuclear fieldlead to rapid dephasing of nuclear spins. In this regime,Monte Carlo methods are used to simulate nuclear dynam-ics [33]. Numerical and analytical approaches agree athigher fields [Fig. 3(b)], where both methods are appli-cable. Numerical power spectra for B� 0 are shown in theinset of Fig. 4.
Experiment and theory show reduced low-frequencyspectral content as B decreases toward zero. This can beunderstood as arising from the influence of the transversenuclear fields at low B, which rapidly dephase nuclearspins and suppress long time correlations in �Bnuc.Similar behavior, though independent of B, is observedin the spectra of PS at the S-Tþ resonance (not shown).Below B� 10 mT, an increased spectral content at fre-quencies between 1–10 Hz is observed in the experimentand theory. The frequency at which the spectra intersect,however, remains constant (�1 Hz) in the simulations butincreases at low B in the experimental data. We are able toapproximate this behavior in the simulation by increasingthe diffusion coefficient (D� 10�12 cm2=s at B ¼ 0), im-plying an enhancement of diffusion, beyond typical values[6], as B approaches zero. This may be due to the growinginfluence of nonsecular terms in the dipole-dipole interac-tion at low magnetic field [8,23]. Diffusion may be furtherenhanced at low B as a result of electron mediated flip-flopof nuclear spins [12,34], an effect neglected in thesimulation.
Finally, we model how the separation time for the two-electron spin state affects the power spectra. Simulatedspectra are shown in the inset of Fig. 4 for �S ¼ 1, 25,and 100 ns at B ¼ 100 mT. Good agreement with experi-ment is achieved when again accounting for the additional1=f noise and contrast reduction. We find that �S acts tofilter fluctuations in �Bnuc, so that for �S � T�
2 , low-frequency correlations in �Bnuc are suppressed in thespectra of PS [see Eq. (1)]. This filtering effect leads tothe turnover at �2 Hz evident in the spectra for �S ¼100 ns. For �S � T�
2 , little filtering occurs and the powerspectra of PS reflect the underlying intrinsic fluctuations ofthe Overhauser magnetic field.
We thank L. DiCarlo, A. C. Johnson, and M. Stopa forcontributions. This work was supported by the Departmentof Defense, ARO/IARPA, NSF-NIRT (EIA-0210736), andHarvard Center for Nanoscale Systems. Research at UCSBsupported in part by QuEST, a NSF Center.
*Present address: School of Physics, University of Sydney,
Sydney, 2006, Australia.[1] D. Loss and D. DiVincenzo, Phys. Rev. A 57, 120 (1998).[2] B. E. Kane, Nature (London) 393, 133 (1998).[3] S. I. Erlingsson, Y. V. Nazarov, and V. I. Fal’ko, Phys.
Rev. B 64, 195306 (2001).[4] I. A. Merkulov, A. L. Efros, and M. Rosen, Phys. Rev. B
65, 205309 (2002).[5] A. V. Khaetskii, D. Loss, and L. Glazman, Phys. Rev. Lett.
88, 186802 (2002).[6] D. Paget, G. Lampel, and B. Sapoval, Phys. Rev. B 15,
5780 (1977).[7] A. S. Bracker et al., Phys. Rev. Lett. 94, 047402 (2005).[8] R. de Sousa and S. Das Sarma, Phys. Rev. B 68, 115322
(2003).[9] J. R. Petta et al., Science 309, 2180 (2005).[10] W.M. Witzel and S. Das Sarma, Phys. Rev. B 74, 035322
(2006).[11] F. H. L. Koppens et al., Nature (London) 442, 766 (2006).[12] W. Yao, R.-B. Liu, and L. J. Sham, Phys. Rev. B 74,
195301 (2006).[13] J.M. Taylor et al., Phys. Rev. B 76, 035315 (2007).[14] A. C. Johnson et al., Nature (London) 435, 925 (2005).[15] F. H. L. Koppens et al., Science 309, 1346 (2005).[16] A. K. Huttel et al., Phys. Rev. B 69, 073302 (2004).[17] J.M. Taylor et al., Nature Phys. 1, 177 (2005).[18] G. Giedke et al., Phys. Rev. A 74, 032316 (2006).[19] D. Klauser, W.A. Coish, and D. Loss, Phys. Rev. B 73,
205302 (2006).[20] S. A. Crooker et al., Nature (London) 431, 49 (2004).[21] T. Sleator et al., Phys. Rev. Lett. 55, 1742 (1985).[22] C. L. Degen et al., Phys. Rev. Lett. 99, 250601 (2007).[23] A. Abragam, Principles of Nuclear Magnetism,
International Series of Monographs on Physics Vol. 32
(Oxford University, New York, 1983).[24] D. Gammon et al., Science 277, 85 (1997).[25] J. Baugh et al., Phys. Rev. Lett. 99, 096804 (2007).[26] J. R. Petta et al., Phys. Rev. Lett. 100, 067601 (2008).[27] K. Ono and S. Tarucha, Phys. Rev. Lett. 92, 256803
(2004).[28] M. S. Rudner and L. S. Levitov, Phys. Rev. Lett. 99,
036602 (2007).[29] O. N. Jouravlev and Y. Nazarov, Phys. Rev. Lett. 96,
176804 (2006).[30] D. J. Reilly et al., Appl. Phys. Lett. 91, 162101 (2007).[31] The correlation function for the experimental data be-
comes slightly negative at long times, likely as the result
of 1=f noise in the rf QPC.[32] M. Stopa (private communication).[33] J.M. Taylor (unpublished).[34] C. Deng and X. Hu, Phys. Rev. B 73, 241303(R) (2006).
PRL 101, 236803 (2008) P HY S I CA L R EV I EW LE T T E R Sweek ending
5 DECEMBER 2008
236803-4