MEASUREMENT OF NON-TECHNICAL SKILLS OF SOFTWARE ...
160
MEASUREMENT OF NON-TECHNICAL SKILLS OF SOFTWARE DEVELOPMENT TEAMS A Dissertation Submitted to the Graduate Faculty of the North Dakota State University of Agriculture and Applied Science By Lisa Louise Bender In Partial Fulfillment for the Degree of DOCTOR OF PHILOSOPHY Major Department: Computer Science December 2013 Fargo, North Dakota
Transcript of MEASUREMENT OF NON-TECHNICAL SKILLS OF SOFTWARE ...

MEASUREMENT OF NON-TECHNICAL SKILLS OF SOFTWARE DEVELOPMENT
TEAMS
A Dissertation
Submitted to the Graduate Faculty
of the
North Dakota State University
of Agriculture and Applied Science
By
Lisa Louise Bender
In Partial Fulfillment
for the Degree of
DOCTOR OF PHILOSOPHY
Major Department:
Computer Science
December 2013
Fargo, North Dakota
North Dakota State University
Graduate School
Title
MEASUREMENT OF NON-TECHNICAL SKILLS OF SOFTWARE
DEVELOPMENT TEAMS
By
Lisa Louise Bender
The Supervisory Committee certifies that this disquisition complies with North Dakota State
University’s regulations and meets the accepted standards for the degree of
DOCTOR OF PHILOSOPHY
SUPERVISORY COMMITTEE:
Dr. Kendall E. Nygard
Chair
Dr. Gursimran Singh Walia
Dr. Juan Li
Dr. Michael D. Robinson
Approved:
04/10/14 Dr. Brian M. Slator
Date Department Chair

iii
ABSTRACT
Software Development managers recognize that project team dynamics is a key
component of the success of any project. Managers can have a project with well-defined goals,
an adequate schedule, technically skilled people and all the necessary tools, but if the project
team members cannot communicate and collaborate effectively with each other and with end
users, then project success is at risk. Common problems with non-technical skills include
dysfunctional communication, negative attitudes, uncooperativeness, mistrust, avoidance, and
ineffective negotiations between team members and users. Such problems must be identified and
addressed to improve individual and team performance. There are tools available that assist in
measuring the effectiveness of the technical skills and processes that teams use to execute
projects, but there are no proven tools to effectively measure the non-technical skills of software
developers. Other industries (e.g. airline and medical) are also finding that teamwork issues are
related to non-technical skills, as well as lack of technical expertise. These industries are
beginning to use behavioral marker systems to structure individual and team assessments.
Behavioral markers are observable behaviors that impact individual or team performance. This
dissertation work explores and develops a behavioral marker system tool, adapted from model in
other industries, to assist managers in assessing the non-technical skills of project team
individuals within groups. An empirical study was also conducted to prove the validity of the
tool and the report is included in this study. We also developed and report upon empirical work
that assesses how Social Sensitivity (a non-technical skill) impacts team performance. There are
four components to this work:
Develop a useful non-technical skills taxonomy

iv
Develop a behavioral marker system for software developers and the non-
technical skills taxonomy
Validate the software developer behavioral marker system
Investigate specifically the effect of social sensitivity on team performance
The evaluation is based on data collected from experiments. The overall goal of this
work is to provide software development team managers with a methodology to evaluate and
provide feedback on the non-technical skills of software developers and to investigate if a
particular non-technical skill can positively affect team performance.

v
ACKNOWLEDGMENTS
I want to thank Dr. Kendall E. Nygard and Dr. Gursimran Singh Walia for guiding and
encouraging me through this research and in writing this dissertation. I would also like to thank
Curk Doetkott and Su Hua for their statistical guidance and help; as well as Dr. Jürgen Munch,
Fabian Fagerholm, and Max Pagels for their assistance in developing and testing the behavioral
marker system.

vi
DEDICATION
I would like to dedicate this research to my friends and family.

vii
TABLE OF CONTENTS
ABSTRACT……………………………………………………………………………………...iii
ACKNOWLEDGMENTS ……………………………………………………………………......v
DEDICATION ………….………………………………………………………………………..vi
LIST OF TABLES ………………………………………….…………………………………….x
LIST OF FIGURES …………………………………………...…………………………………xi
CHAPTER 1. INTRODUCTION …………....…………………………………………………...1
1.1. Behavioral marker and behavioral marker system.................................................4
1.1.1. Domains in which behavioral marker systems have been used……...……8
1.2. Non-technical skills……………………………………………………………...15
1.3. Social sensitivity…………………………………………………………………17
1.4. Framework for research activities………………………………………………..18
1.5. Organization……………………………………………………………………...19
CHAPTER II. RESEARCH APPROACH ….……………...…..……………………………….20
2.1. Literature review……..…………………………………………..…….……………21
2.1.1. Existing software professional non-technical skills
recommendations…………………………………………………...……21
2.1.2. Background on a recommended approach to creating a software
professional non-technical skills profile ………………………………...24
2.1.3. Methodology for development of a behavioral marker system for
software development ………………….………………………………..25
2.1.4. Validation of behavioral marker system ………………………………...28
2.1.5. Social sensitivity studies ………………………………………………...31
CHAPTER III. NON-TECHNICAL SKILLS TAXONOMY …………………………………..32
3.1. Literature review ……………………………………………………………...…….32

viii
3.2. Cluster, describe, combine, and sort non-technical skills.…………..………...…….40
3.3. Focus group …………………………………………………………………...…….42
3.3.1. Survey methodology……………………………………………......……50
3.3.2. Survey procedure ………………………………………………………..51
3.3.3. Threats to validity ……………………………………………………….66
3.3.4. Conclusion ………………………………………………………………67
CHAPTER IV. BEHAVIORAL MARKER SYSTEM ….……………...…..………….……….68
4.1. Literature review……..…………………………………………..…………….……68
CHAPTER V. EMPIRICAL VALIDATION OF THE BEHAVIORAL MARKER
SYSTEM….…………………………………………………………………….71
5.1. Team non-technical skill evaluation using behavioral marker system
tool……..…………………………………………..…………………………...……71
5.1.1. Software Factory background …………………………………………..72
5.1.2. Study design ……………………………………………………………..74
5.1.3. Data analysis and results ………………………………………………...81
5.1.4. Threat to validity ……………………………………………………...…84
5.1.5. Discussion of results …………………………………………………….85
5.1.6. Conclusion and future work ……………………………………………..86
CHAPTER VI. SOCIAL SENSITIVITY AND TEAM PROJECTS …..……………………….87
6.1. Social sensitivity and classroom team projects: an empirical investigation…...……87
6.1.1. Introduction ………………………………………….…………………..88
6.1.2. Background and related work ………………………………………..….90
6.1.3. Study design ……………………………………………………………..93
6.1.4. Data analysis and results ……………………………………………...…98
6.1.5. Threat to validity ……………………………………………………….102

ix
6.1.6. Discussion of results …………………………………………………...103
6.1.7. Conclusion and future work …………………………………………...104
6.2. Social sensitivity correlations with the effectiveness of team process
performance: an empirical study ……………………………….………………..…105
6.2.1. Introduction …………………………………………………………….106
6.2.2. Background and related work ………………………………………….108
6.2.3. Study design ……………………………………………………………114
6.2.4. Data analysis and results ……………………………………………….120
6.2.5. Threat to validity ……………………………………………………….125
6.2.6. Discussion of results …………………………………………………...126
6.2.7. Conclusion and future work …………………………………………....128
CHAPTER VII. IMPORTANCE OF RESULTS ……………………...………………………130
CHAPTER VIII. CONCLUSION …………………………………………………………..….134
8.1. Contribution to research and practice communities…………………………..……134
8.2. Summary ……...……………………..……………………….…………………....135
8.3. Publications ………………...……………………..……………………………….136
8.4. Future research directions ………………………………………………………....137
REFERENCES ………………………………………………………………………...………139

x
LIST OF TABLES
Table Page
1. University of Texas behavioral markers for airline pilots……...……………………........9
2. Behavioral markers identified for merchant marine engineering officers……………….14
3. Limitations of existing software professional competency recommendations………......24
4. Research questions and motivations………….………………………………………….33
5. Source list…………………………….………………………….………………….……35
6. Inclusion and exclusion criteria…….……………………………………………………36
7. Detailed search strings….…………….………………………………………………… 37
8. Quality assessment……….……………………………………………………………... 40
9. Data extraction form...……….………………………….……………………………….41
10. Detailed desired non-technical skills of software professionals……….………………...45
11. Essential non-technical skills ratings…………………..………………………………...53
12. Coordination behavioral marker examples…………………………………...………….69

xi
LIST OF FIGURES
Figure Page
1. The NOTECHS descriptive framework of categories, elements and behaviors………....11
2. NOTECHS elements and behaviors for Category – Cooperation …………………........11
3. ANTS system prototype………………..………………………………………………...13
4. The non-technical skills for officers of the deck (NTSOD) rating form…...…...……….15
5. The behavioral marker system development process…...……………………………….28
6. Desired non-technical skills of software professionals……………………….………….44
7. Details of the focus group survey procedure…………………………..…………...……52
8. Listening example behaviors……………….………..…………………………………..55
9. Oral communications example behaviors…..…………………………………………....56
10. Questioning example behaviors………….……………………………………………....57
11. Attitude example behaviors……………….……………………………….…………….58
12. Teamwork example behaviors………….………………………………….…………….59
13. Attention to detail example behaviors……………..…………………………………….60
14. Critical thinking example behaviors………...………….…………………….………….61
15. Problem solving example behaviors.…..…………………………………………...……62
16. Flexibility example behaviors……………………..……………………………………..63
17. Initiative/motivation to work example behaviors…………..…………………………....64
18. Integrity, honesty and ethics example behaviors…….....………………….…………….65
19. Time management example behaviors…………..…………...…………….…………….66
20. Non-technical skills assessment for software development teamwork audit tool……....70
21. Final NTSA form ……………….….……………………………………………...……78

xii
22. Aggregation of McNemer test results………………….....…..………………….……....82
23. Individual social sensitivity scores……..……………....………………….…………….99
24. Effect of social sensitivity on the team performance……...……………….…………...101
25. Team performance at different SS levels…………...…………...……………………...102
26. Individual social sensitivity scores……………..………………………………..……..120
27. Aggregation of category rank data…………..……….…………………………...….…122
28. Correlation between individual social sensitivity and team performance activities........124

1
CHAPTER I. INTRODUCTION
The software development process is a team activity and the success of a software project
depends on the effective performance of the software project team. Many software projects
require the diversity of skills and abilities that a team provides, thus almost all software
development activities are performed by teams [1]. West [2] notes that teams that are effective
can complete projects in less time, develop and deliver products more cost effectively, improve
quality management, have lower stress levels, improve team member satisfaction, and promote
innovation. He also notes that although effective teams can provide many benefits to a project,
working in a team is not automatically beneficial. It is obvious to most project managers that the
right mix of technical skills is important to the success of any software development project.
However, non-technical skills are equally if not more important for project success [3].
Researchers have found that interpersonal skills and teamwork are significant factors in the
adequacy of the design and implementation of a software system [4]. Team effectiveness can be
undermined by a variety of non-technical problems such as inadequate participation,
dysfunctional communication, poor coordination, lack of organization, negative attitudes, poor
conflict handling, and ineffective negotiations. These problems can exist between team members
or between team members and other stakeholders such as system users. These problems must be
addressed to create effective team members. Simply bringing people together does not ensure
that they will function as an effective team. Teams and team members should be developed.
The cognitive and interpersonal skills (non-technical) which underpin software professionals and
technical proficiency are recognized as requirements for a competent software developer [5].

2
The Project Management Institute recognizes the need to develop project teams. The
most recent PMBOK Guide [6] states “teamwork is a critical factor for project success, and
developing effective project teams is one of the primary responsibilities of the project manager”.
Management is responsible for improving competencies, team interaction, and the overall team
environment in order to improve project performance. PMBOK also advises that team member
performance should be tracked, feedback provided, issues resolved and changes managed in
order to optimize project performance. They acknowledge that interpersonal skills are
particularly important to team development. It is obvious that developing and managing human
resources are critical to the success of the software development process. Many authors agree
that the soft skills are critical to project success [7, 8, 9, 10, 11]. Other authors assert that soft
skills can have a larger impact than the technological aspects of software development [12, 13,
14]. One major factor that is driving the demand for non-technical skills is the requirement for
an agile workforce to support agile organizations [15]. Agile software development is a software
development methodology based on incremental and interactive development. This development
is carried out through the collaboration between self-organizing, cross-functional teams. Agile
teams depend greatly on efficient communication, taking responsibility, initiative, time
management, diplomacy, and leadership.
Although it is recognized that teamwork is a critical factor in project success, teamwork
skills are often taken for granted. Many people pay little attention to teaching these skills or
learning them; they just assume people are proficient at working in teams. The performance of
individuals is very important to creating an effective team, but how is team effectiveness
measured? Different authors have identified different criteria for assessing team effectiveness
[16, 17, 18]. These criteria generally include measurements of task performance as well as the

3
interpersonal skills of the team members, which include attitudes and behaviors. Task
performance is generally measured in terms of output quantity and quality and there is extensive
literature with respect to different ways to measure task performance (e.g., lines of code) for
software development [19]. However the non-technical team member skills also must be
measured and little research has been performed on techniques to evaluate these non-technical
skills. As a former IT manager and software project development manager, this is one of the
factors that motivated my research. How can managers objectively measure the non-technical
skills of their employees to determine if their non-technical skills are adequate or if they need
improvement? If a training program was devised to improve these non-technical skills how
would improvement be measured? How would feedback be provided to the team members so
that they could improve their performance? The research reported here is an attempt to answer
these kinds of questions.
The aviation and health care industries have already recognized the importance of non-
technical skills to the success of their teams, and have been using behavioral marker systems to
structure individual and team assessments of these non-technical skills. Aviation has been
successfully using behavioral marker systems for 17 years to improve the interpersonal
teamwork skills of flight crews. The airlines who used this behavioral marker system approach,
found a 70 percent reduction in non-conforming behaviors and an increase in overall crew
performance [20]. Inspired by this success, the Institute of Medicine has been encouraging
healthcare professionals to develop similar systems for measuring and improving teamwork [21].
Motivated by the success achieved when using the behavior marker system in varying domains, I
believe that software teams can also draw upon these models from the aviation and health care
industries. To help improve teamwork in the software development process and to assess the

4
non-technical competencies of teams and team members, I created and validated a behavioral
marker system for software development. Stated more formally, the goal of this dissertation is
to:
Develop and validate a software development behavioral marker system
for the purpose of measuring the non-technical skills
in the context of software development project team members
When properly utilized, this system can improve software professional team member
performance by providing feedback in the form of an objective and documented assessment of
the non-technical skills of the team members. Thus, the purpose of this dissertation is to identify
the non-technical skills required by effective software professionals, and to develop a behavioral
marker system for evaluating these skills.
Behavioral marker and behavioral marker systems 1.1.
The overall purpose of a behavioral marker system is to provide a method to assess team
and or individual behaviors using markers. Flin et al. [22] defines assessment as “the process of
observing, recording interpreting, and evaluating individual performance, usually against a
standard defined by a professional body, or a company”.
Behavioral markers are defined by Klampfer et al. [23] as “observable, non-technical
behaviors that contribute to superior or substandard performance within a work environment”.
They are derived by analyzing data regarding performance that contributes to successful and
unsuccessful outcomes. These markers are often structured into categories (e.g. communication,

5
situational awareness, and decision making). Klampfer et al. [23] identified five characteristics
of a good behavioral marker:
1. A behavioral marker should describe a specific and observable behavior, not an attitude
or personality trait. A software professional’s ability to delegate responsibilities is
observable and a good indicator of leadership skills. However, a software professional’s
attitude towards leadership is not observable and so would not make a good behavioral
marker.
2. A behavioral marker should have a causal relationship with a performance outcome;
however, this behavior does not have to be always present. For example, if a software
professional does not communicate effectively, this should result in poorer performance.
3. A behavioral marker should use domain specific language. A behavioral marker that was
developed for a nuclear power plant control room is unlikely to be useful in software
development.
4. When defining the behavioral marker, the organization of words and phrases should be
simple so that it will be understood by a broad range of individuals.
5. A behavioral marker should describe a clear concept. They use more simple words rather
than complex words in their definitions; the definition is appropriate and produces a
consistent mental image in observer’s minds. These definitions are more concrete so that
they are more directly observable.
Behavioral marker systems are a taxonomy or listing of non-technical skills that are
associated with effective job performance. This listing is combined with a rating scale to allow
the skills (which are demonstrated through behaviors) to be assessed by trained observers. These
behavioral marker systems are part of an observation-based method to capture and assess

6
individual and team performance on data rather than on gut feelings. Observers use this type of
tool, which is designed in the form of a structured list of skills, to rate skill and behavior
performance. This allows an individual’s or team’s skills to be rated in their real context.
Behavioral marker systems can provide feedback on performance to individual and teams as well
as supply a common language for discussing and teaching non-technical skills. Flin et al. [22]
identified seven properties of an effective behavioral marker system: baselines, reliability,
sensitivity, structure, transparency, usability, and validity:
1. Baselines refer to the appropriateness of the performance criterion for the experience
level of the software professional. More experienced professionals should be held to a
higher standard than someone who is just beginning [22].
2. Reliability refers to how stable the measure is. In other words, a particular action should
always receive the same rating.
3. Sensitivity refers to the ability of the rater to distinguish between good and bad
performance of a behavior based on the markers. If attitude were a behavioral marker, it
should be easy to determine the difference between good attitude and bad attitude.
4. Structure refers to how well the behavioral markers and marker categories are organized.
Ideally, a behavioral marker system will cover all behaviors and there would be no
overlap.
5. Transparency refers to how understandable the system is to the software professionals
that are being rated.
6. Usability refers to how easy the framework to use: it should be simple and easy to
understand. The behaviors should also be easy to observe. It is also noted that when a
behavioral marker contained more than one behavior, it is difficult to rate, thus it is

7
important that each marker be discreet as well has having wording that is concise and
simple and a verb statement that clearly describes an observable behavior [24].
7. Validity is the extent to which the behavioral markers measure the non-technical skills.
The system should measure what it claims to measure.
Behavioral marker systems also have several limitations as identified by Flin et al. [22].
One limitation is the inability of a behavioral marker system to capture every possible aspect of
performance. There are just simply too many different variables that can affect performance to
include in one system. Another limitation is that the opportunities to observe some behaviors
may be very limited. Certain behaviors maybe displayed very infrequently. The last limitation
relates to the fact that the system uses human assessors who have their own distractions,
perceptions and biases.
Even with these limitations, many domains use behavioral marker systems effectively.
Behavioral marker systems have demonstrated value for assessing non-technical skills and for
providing feedback on these non-technical skills to the individual or team being assessed. They
have also proved valuable for improving training programs for non-technical skills by providing
a common vocabulary for communication and in the use of building databases to identify norms
and prioritize training needs. Given the prevalence and success of behavioral marker systems, it
is suggested that they may be an effective method for improving non-technical skills in software
development teams. However, a behavioral marker system that has been developed for one
domain cannot simply be transferred to another domain. It is important to recognize that
behavioral marker systems need to be specific to the domain and culture. O’Conner et al. [25]
noted that the Human Factors Analysis and Classification System which was developed for
aviation was not appropriate for assessing the non-technical skills for U.S. Navy divers.

8
1.1.1. Domains in which behavioral marker systems have been used
Behavioral Marker systems were first developed for training and research purposes in the
aviation industry. The best known example was developed by the University of Texas Human
Factors Research Project. Consequently, a number of airlines have developed their own
behavioral marker systems for training and assessing flight crew skills [24]. Later, the European
aviation regulator Joint Aviation Authorities required a European behavioral marker systems and
the NOTECHS project was implemented to develop a non-technical skills marker system for
European airlines. Since then, behavioral marker systems have been generally created for
workplaces requiring high levels of individual and team performance such as the medial
industry, nuclear power plants, and the maritime industry.
1.1.1.1. Airline industry
The University of Texas (UT) Behavioral Markers was the one of the first behavioral
marker systems developed for the airline industry as part of the University of Texas Human
Factors Research Project. The University of Texas behavioral marker for airline pilots is shown
in Table 1. This project had two primary purposes: to evaluate the effectiveness of crew
resource management (CRM) by measuring observable behaviors and to aid the development of
future CRM programs [23]. A subset of the behavioral markers identified in this project is
included in the Line Operations Safety Audit (LOSA) system that is also used in aviation.
The Line Operation Safety Audit (LOSA) is a very successful behavioral marker system,
and many of the behavioral marker systems in other industries were adapted from this audit tool.
It is an audit tool that focuses on interpersonal communication, leadership, and decision making
in the cockpit. Trained observers (pilots and human factors experts) ride along in the cockpit and

9
Table 1. University of Texas behavioral markers for airline pilots [23]
SOP BRIEFING The required briefing was interactive
and operationally thorough
- Concise, not rushed and met SOP
requirements
- Bottom lines were established
P-D
PLANS STATED Operational plans and decisions were
communicated and acknowledged
- Shared understanding about plans -
“Everybody on the same page” P-D
WORKLOAD
ASSIGNMENT
Roles and responsibilities were defined
for normal and non-normal situations
- Workload assignments were
communicated and acknowledged P-D
CONTINGENCY
MANAGEMENT
Crew members developed effective
strategies to manage threats to safety
- Threats and their consequences
were anticipated
- Used all available resources to
manage threats
P-D
MONITOR /
CROSSCHECK
Crew members actively monitored and
cross-checked systems and other crew
members
- Aircraft position, settings, and crew
actions were verified P-T-D
WORKLOAD
MANAGEMENT
Operational tasks were prioritized and
properly managed to handle primary
flight duties
- Avoided task fixation
- Did not allow work overload P-T-D
VIGILANCE Crew members remained alert of the
environment and position of the aircraft
- Crew members maintained
situational awareness P-T-D
AUTOMATION
MANAGEMENT
Automation was properly managed to
balance situational and/or workload
requirements
- Automation setup was briefed to
other members
- Effective recovery techniques from
automation anomalies
P-T-D
EVALUATION
OF PLANS
Existing plans were reviewed and
modified when necessary
- Crew decisions and actions were
openly analyzed to make sure the
existing plan was the best plan
P-T
INQUIRY
Crew members asked questions to
investigate and/or clarify current plans
of action
- Crew members not afraid to express
a lack of knowledge – “Nothing
taken for granted” attitude
P-T
ASSERTIVENESS
Crew members stated critical
information and/or solutions with
appropriate persistence
- Crew members spoke up without
hesitation P-T
COMMUNICATI
ON
ENVIRONMENT
Environment for open communication
was established and maintained
- Good cross talk – flow of
information was fluid, clear, and
direct
G
LEADERSHIP Captain showed leadership and
coordinated flight deck activities
- In command, decisive, and
encouraged crew participation G
1 = Poor 2 = Marginal 3 = Good 4 = Outstanding
Observed performance
had safety
implications
Observed performance
was barely adequate
Observed performance
was effective
Observed performance
was truly noteworthy

10
observe the flight crews during normal flight operations. They score the behaviors of the crew
using LOSA. This tool has been very successful in measuring the strengths and weakness of the
flight crews’ interpersonal skills and is endorsed by the International Civil Aviation Organization
[20].
In 1996, the European Joint Aviation Requirements (JAR) required that the non-technical
skills of flight crews must be assessed in accordance with a methodology acceptable to the
Authority and published in the Operations Manual. The systems needed to be usable by airline
instructors and examiners and needed to be respectful to cultural and corporate differences. A
research committee consisting of pilot and psychologists from around Europe was created to
work on what was called the NOTECHS (Non-Technical Skills) project. The framework for this
project is shown in Figure 1 and the type of detail for a specific category is shown in Figure 2.
After a review of existing systems, a prototype behavioral marker system for rating non-technical
skills was created and based off of two principal frameworks: KLM WILSC/SHAPE systems
and the NASA UT Line/LOS Checklist system. This system has been fully validated and in use
since 2001 [26].

11
Figure 1. The NOTECHS descriptive framework of categories, elements and behaviors [27]
Figure 2. NOTECHS elements and behaviors for Category – Cooperation [27]

12
1.1.1.2. Medical industry
Reviews of closed malpractice claims consistently illustrate the important role of
communication and teamwork in reducing harm to patients. Regulatory agencies and
accreditation organizations are requiring health care organizations to train people on teamwork.
To help improve teamwork in healthcare, behavioral marker systems are being adopted. Two
predominate tools available in literature to date include the Anesthetists’ Non-Technical Skills
(ANTS) System and the Observational Teamwork Assessment of Surgery (OTAS).
ANTS, as shown in Figure 3, was developed by anesthetists and industrial psychologists
to provide a taxonomy for structured observations of anesthetists [28]. This system has proven
very useful in assessing the non-technical skills of anesthetists in simulation training and has
provided important performance feedback for the individuals. This feedback has also been used
to structure and improve training.
OTAS was developed to evaluate the technical and interpersonal skills in surgery teams
[29]. Empirical studies have shown that the underlying cause of many adverse events in surgery
were the result of poor communication, coordination, and other aspects of teamwork rather than
technical failures. OTAS has been found to be a valid measure the technical and non-technical
performance of surgical teams. With accurate diagnosis of teamwork, researchers aim to
establish a clear link between teamwork training and improvements in surgical care.

13
Figure 3. ANTS system prototype [28]
1.1.1.3. Maritime shipping
In 2005 the Warsash Maritime Center in England began conducting research into
applying behavioral marker systems in the assessment of Merchant Marine Engineering Officers
[30]. Research is being conducted by observing exercise scenarios within simulators. Although,
the research is not complete, the behavioral markers that have been identified at this time are
listed in Table 2.

14
Table 2. Behavioral markers identified for merchant marine engineering officers [30]
Behavioural Marker Characterisation
Ratio of the degree of feedback control to
the degree of predictive control.
Indication of the level of situational
awareness.
The number of alternative hypotheses and
actions communicated to team members.
An indication of teamwork and the
building of a shared mental model.
Level of satisficing exhibited. Considering only as many alternatives as
needed to discover one that satisfies.
Communicating in a way that shares ones
mental model.
Building, maintaining and refining the
accuracy of the shared mental model of
the team.
Relevance and timeliness of unsolicited
information passed between team
members.
A measure of the degree of congruence
between the mental models held by
individual team members.
Level of anticipation of other team
members needs.
Indication of the level of situational
awareness.
Level of anticipation of future actions and
task requirements.
Indication of the level of situational
awareness.
Focus is too much on the reduction of
uncertainty.
Indication of a tendency towards
analytical decision-making, and away
from naturalistic decision-making.
Tendency to focus on one system at a
time, thereby ignoring the dynamics of the
complete system.
An indication of the lack of a situation
overview.
Amount of sampling behavior exhibited. An indication of the updating of
situational awareness and mental model.
Number of unfinished sentences. A measure of uncertainty.
Delegation of work tasks. A measure of the effective use of all team
members, and the alleviation of overload.
Patterns of movement. Interpretation of patterns of movement to
determine degree of situation overview.
In 2010, a prototype behavioral marker system (shown in Figure 4) was developed for
assessing and training Officers of the Deck in the U.S. Navy [31]. The prototype Non-technical
Skills for Officers of the Deck (NTSOD) systems design is heavily influenced by the Surface
Warfare community. Although this is still in development, the first phase of validation has been

15
completed and it is suggested that the prototype behavioral marker system has implications for
improving the performance and safety on both civilian and military ships.
Figure 4. The non-technical skills for officers of the deck (NTSOD) rating form [31]
Non-technical skills 1.2.
Non-technical skills are the cognitive, social, and personal resource skills that
complement technical skills and contribute to efficient task performance [22]. Classic examples
of non-technical skills are leadership, patience, cooperation, communication, decision making,
conflict management, stress and workload management, attention to detail, empathy, and
confidence. In short, non-technical skills cover both the social and cognitive side of a person. In
1936, Dale Carnegie wrote “…even in such technical lines as engineering, about 15% of one’s
financial success is due to one’s technical knowledge and about 85% is due to skill in human

16
engineering, to personality and the ability to lead people.” In a survey released on April 10,
2013 by the Association of American Colleges and Universities, it was found that employers feel
that non-technical skills, both cognitive and interpersonal, are more important than a student’s
particular major – including STEM majors [32]. Even professional organizations such as
Engineering Council’s UK Standard for Professional Engineering Competence (UKSPEC), IEEE
Computer Society, etc. state that professional engineers have an obligation to possess effective
non-technical skills.
Non-technical skills are the social and cognitive skills which compliment software
professionals’ technical skills. Professional societies have defined Software Engineering
standards and guidelines, but these have not been accepted across all professional societies [33]
and they do not specifically identify non-technical skills. Certifications have been created by
businesses, but these are brand name certifications that do not deal with the software engineering
profession directly and deal primarily with technical skills. Certifications by professional
societies are not well utilized by industry [34]. Universities and colleges have strived to create
curriculum to prepare students to be Software Engineers. Some researchers have defined
competencies (both technical and non-technical) for Undergraduate Software Engineering
students, however these do not encompass all of the competencies, such as many necessary
interpersonal skills, needed for a Software Engineering professional [35, 36, 37]. Other
researchers have developed expert profiles (tools that communicate the technical and non-
technical competencies required in a particular profession) for engineering professionals that
include input from both academia and industry; however, they do not define specific
competencies required for a Software Engineer [38]. Educators summarize important course
knowledge and skills that the student’s should develop in course syllabi. Employers list

17
minimum requirements for new hires in job advertisements. With so many different sources and
kinds of information available, it is difficult for a student to synthesize what competencies and in
particular, non-technical competencies, are required in the software profession. One of the
purposes of this dissertation is to develop a useful non-technical skills taxonomy for software
professionals. Stated more formally, one goal of this dissertation is to:
Analyze Software Professional Non-technical Skills
For the purpose of creating a Software Professional Non-technical Skill Taxonomy
From the point of view of educators and employers
Social sensitivity 1.3.
Social Sensitivity is the ability to correctly understand the feelings and viewpoints of
people [39]. It has also been defined as “the ability to understand and manage people” [40].
Salovey and Mayer [41] view social sensitivity as an element of emotional intelligence and
identify some of the characteristics of socially intelligent people to include the ability to admit
mistakes, to accept others for who they are, to enhance other’s moods, to be social problem
solvers, to be flexible thinkers, and to have an interest in the world at large. They also recognize
that the appraisal and expression of emotion often takes place on a nonverbal level. The ability to
perceive nonverbal expression insures smoother interpersonal cooperation. By perceiving,
empathizing, and then responding appropriately, people experience greater satisfaction, more
positive emotions, and lower stress. Such positive emotions aid in creative thinking and enable
flexibility in arriving at alternatives to problems. These characteristics suggest that high levels of
social sensitivity could be a benefit for teams.
18
Every person has a certain level of social sensitivity, but there is evidence that people
who choose technical careers have less of it on average than the population at large [42]. More
specifically, Baron-Cohen et al. [42] produced evidence that suggests that engineers,
mathematicians, physicists, and computer scientists are typically less socially sensitive than their
peers in the humanities, arts, and social sciences. They suggest that people in these technical
disciplines have more difficulty decoding what others are thinking and feeling. Although this
research did not address teams specifically, it suggests to us that individuals and teams of
technical people may be challenged in the area of social sensitivity.
One purpose of my dissertation is to create a tool that aids in the measurement of non-
technical skills to aid in managing and improving software developers and software development
teams. But a second purpose is to investigate a particular non-technical skill to identify its
impact on team performance. Stated more formally, one goal of this dissertation is to:
Analyze Social Sensitivity of Software Professionals
For the purpose of evaluation
With respect to project performance
Framework for research activities 1.4.
This dissertation has four major research thrusts (as described in Sections 1.1, 1.2, and
1.3). The research activities involved in this dissertation can be classifies into four different
phases and are described as:
Develop a useful non-technical skills taxonomy
Develop a behavioral marker system for software developers and the non-technical skills
taxonomy

19
Validate the software developer behavioral marker system
Proof of Concept: Investigate the effect of social sensitivity on team performance
Organization 1.5.
The remainder of this dissertation is organized as follows. Chapter II introduces the
research approach used for solving the problems described in this chapter. Chapter III provides
the details for developing a useful non-technical skills taxonomy, including the related literature
from both industry and academic perspectives in order to identify and analyze non-technical
skills of software professionals; the process of developing the non-technical skills taxonomy; and
it presents the non-technical skills taxonomy. Chapter IV details the process of developing the
behavioral marker system for software developers, and presents the behavioral marker system for
software developers. Chapter V and Chapter VI respectively detail the experiment design, data
analysis, and results from the empirical studies conducted to validate the behavioral marker
system for software developers and to investigate the effect of social sensitivity on team
performance.

20
CHAPTER II. RESEARCH APPROACH
A systematic literature review was performed to identify and analyze the non-technical
skills of a software professional from both industry and academic perspectives. A systematic
literature review is a systematic search process that focuses on a particular research question and
provides an exhaustive summary of literature relevant to that question. By performing a
systematic review, researchers can be more confident that they have found background
information relevant to their study. The more common ad hoc approach does not provide this
same level of assurance [43].
A survey was developed using the process recommended by Davis et al. [38]. This
process includes researching non-technical skills by first surveying the literature for identifiable
non-technical skills, and then using focus groups to develop the survey. The focus groups
consisted of employers, software engineering and computer science instructors, and capstone
design course instructors. The software professional non-technical skills profile survey used the
non-technical skills information gathered from the systematic literature review and was
developed with the assistance of a focus group (i.e. capstone coordinators, industry employers).
The results of the survey were used to develop the software professional non-technical skills
taxonomy.
A review of related behavioral marker system literature was carried out in order to
develop a behavioral marker system for software developers, and an initial behavioral marker
rating tool was created and refined. Then different methods of tool validation were reviewed and

21
an empirical study was performed in order to validate the tool. Lastly, the topic of the effect of
social sensitivity on team performance was empirically investigated.
Literature review 2.1.
To provide context for the review, section 2.1.1 of this section first describes existing
Software Engineer non-technical competency recommendations by professional societies and
academic researchers, along with some of the limitations of their recommendations. These
limitations indicate that there is a need to develop a software professional non-technical skills
profile with input from both academia and industry. Section 2.1.2 of this section introduces the
process that Davis et al. [38] proposes to develop a professional profile.
2.1.1. Existing software professional non-technical skills recommendations
The Software Engineering Body of Knowledge (SWEBOK) and the Software
Engineering 2004 Curriculum Guidelines for Undergraduate Degree Programs in Software
Engineering are two widely accepted guidelines for knowledge areas and competencies within
software engineering [44]. The intent of the Software Engineering Body of Knowledge
(SWEBOK) was to help define Software Engineering as a discipline and to establish the skills,
practices and processes expected to be mastered by professional software engineers. SWEBOK
states that its intent is to only include “generally accepted knowledge” in its body of knowledge
[45]. There are well respected individuals in the computer community, such as Grady Booch,
Tom DeMarco and Cem Kaner, who find limitations (such as only including practices for certain
types of software) with SWEBOK’s definition of knowledge [46]. Other researchers state that
SWEBOK under-emphasizes the behavioral and human-related knowledge and skills required by
a professional software engineer [19]. The ACM does not believe that all needed knowledge
areas have been included in SWEBOK. This is because knowledge areas for the SWEBOK were

22
chosen primarily from textbooks and academic curriculum; thus they feel that there is a large gap
between SWEBOK’s suggested knowledge areas and actual practice [33]. Even SWEBOK itself
states that it does not cover the professional practices that are covered in the Certified Software
Development Professional (CSDP) certification [45]. The primary purpose of the Software
Engineering 2004 Curriculum Guidelines is to provide curriculum guidance to academia and
covers a broader scope of knowledge that needs to be taught to an undergraduate. It does not
cover more specific technical and non-technical knowledge that a practicing software engineer
should know [47].
Professional certification programs provide a list of the abilities and skills needed by a
professional in a particular field. Candidates generally achieve certification by passing one or
more tests. Many software companies, such as Microsoft, and professional societies, such as the
Software Engineering Institute, offer certifications on brand specific technologies or specific
topics, but these certifications only imply proficiency in the use of a certain product or specific
topic. Broader software engineering certification is available through other professional societies
such as IEEE. IEEE’s Certified Software Development Professional (CSDP) credential is
intended to certify the competencies of mid-career software professionals. Although the CSDP is
well regarded [48], it is not widely used. As of 2006, the IEEE had certified over 575
professional software engineers [36]. This is commendable; however, with the U.S. Bureau of
Labor Statistics [49] counting 801,580 practicing software engineers in 2006, this only represents
a very small percentage of professionals who find enough value in the exam to participate in it.
There is a fee to take the exam and the professional competencies are not publicly shared. One
last thing to note is that this is a list of questions, rather than a list of competencies. Although
technical and non-technical competencies can be divined from the exam, all of these factors limit

23
the value of certifications as a method to deduce software professional technical and non-
technical competencies for students, educators and employers.
Academics have also proposed technical and non-technical competencies that software
professionals should strive for based on research performed on students majoring in computer
and software fields. Rivera-Ibarra et al. [35] developed a competency framework that defines a
set of knowledge, skills, and behaviors that a software engineering professional should possess.
The defined competencies came from two different sources: 1) observing, interviewing and
questioning nine software development project groups of master’s level students over a seven
year period; and 2) from considering market needs, software engineer characteristics and
employer characteristics. Although the groups worked on projects for real clients, there are traits
typical to student groups that are not found in industry. One example is that all members on
student teams are typically equal in knowledge, experience and power which are not the case in
industry setting. Another example lays in the nature of an organizational setting (i.e., multiple
teams working together, organizational structure and climate, etc.) which are typically much
different than an educational setting. Thus, the technical and non-technical competencies
developed based on software engineering students may not be completely compatible in a real-
world setting for software professionals. Fuller et al. [50] surveyed professionals, students and
faculty on ethical and professional values and identified thirteen values computing professionals
need to care about and exhibit, in order to responsibly perform their jobs. Although these values
are important behavioral (non-technical) competencies, they do not cover a complete list of non-
technical competencies needed by a software professional. Academics have also studied
professional software engineers. Turley and Bieman devised a list of thirty eight essential
competencies of Software Engineers that they organized into four categories: Task

24
Accomplishment, Personal Attributes, Situational skills, and Interpersonal Skills [51, 52].
Although, this list may be very useful for students, educators and employers to gain some
perspective on the non-technical competencies required for a software professional, the list was
compiled over fifteen years ago and the competencies need to be examined for continued
completeness and relevancy.
Table 3. Limitations of existing software professional competency recommendations
Competency Limitations
Disputed competencies
Missing competencies
Competencies not clearly defined
Competencies that are not public, thus inaccessible
Competencies based on observing advanced degree students
that may not be directly transferrable to or required by industry
Potentially outdated list of competencies that needs verification
of continued relevancy
Table 3 summarizes the limitations of the software professional competency
recommendations described in this section. To overcome these limitations, the objective of this
review is to identify competencies of a professional software engineer from both industry and
academic perspectives; and to identify efforts that have already been made to create a profile for
Software Engineering professionals.
2.1.2. Background on a recommended approach to creating a software professional non-
technical skills profile
Davis et al. [53] proposes the use of expert profiles as a valuable resource for multiple
stakeholders to gain an understanding of the skills or behaviors that align with a professional in a
field. Expert profiles are tools that communicate the intelligence, knowledge, creativity and

25
wisdom required for expert performance in a particular profession [54]. Profiles can be used by
many stakeholders to gain a consistent understanding of the competencies expected of a
professional in the field and students can use expert profiles to help form accurate perceptions
and generate motivation to pursue a field of study [38, 55]. Davis and Beyerlein [38] suggest a
ten step process and quality criteria for developing an expert profile. The process involves a)
researching competency targets used by companies who employ software engineers and by
software engineer professional organizations; b) inventorying competency qualities; c) clustering
behaviors and characteristics into major performance areas; d) writing holistic descriptions for
each performance area; e) sorting, combining, and refining the behavior and characteristic
statements within the roles; f) filling in any gaps; g) review the information collected with a
focus group; h) prioritize the competencies; i) assess the quality of the profile; and j) iterate
between steps six and eight to improve the profile. In their development of a profile for an expert
engineer, they identified major performance areas (i.e. roles) and then grouped required
characteristics and behaviors within each role. Although Davis used this process to develop a
profile that consisted of both technical and non-technical competencies (skills), this process
should also be able to be used to focus on the non-technical skills.
2.1.3. Methodology for development of a behavioral marker system for software
development
There are four basic steps involved in the creation of a behavioral marker system for
software development. The first step consists of researching existing behavioral marker systems
and then designing my system audit tool. The second step identifies the non-technical skills that
could be applied to software professionals (see 1.3.1). This involves preforming a
comprehensive literature review, surveying academia and industry in the form of a focus group,
improving the skills taxonomy, surveying a larger sample of academia and industry professionals

26
intimate with the software development profession and then repeating until a stable (fewer than 5
percent changes) taxonomy is formed. The third step involves collecting data for testing the
validity of the system. The fourth step involves using the data gained to assess the system.
2.1.3.1. Background on current non-technical skills measurement
The Project Management Institute suggests measuring the performance of a successful
project team on both technical and non-technical factors. They recommend that project
management conduct an evaluation of the team’s overall performance and suggest that
management use observation, conversation, project performance appraisals, and interpersonal
skills to accomplish these evaluations. Although these are worthy recommendations, these
techniques are vague and do not provide management with specific, well-defined approaches that
can be employed to measure team and team member effectiveness. In particular, they do not
recommend any method that can assist management in objectively measuring the non-technical
skills of the team members.
The People Capability Maturity Model (P-CMM) is a tool designed to assist
organizations in the adoption of best practices for managing and developing an organization’s
workforce by providing a foundation for systematic improvement. They suggest that the need for
developing interpersonal skills can be identified by observation of a manager, or self or
workgroup evaluation [56]. P-CMM, also, does not recommend any method that can assist in
objectively measuring the non-technical skills of an individual. They do, however, cite examples
of other measurement practices that could be considered and recognize that this list is not
prescriptive or exhaustive [57, 58, 59, 60, 61, 62, 63, 64], but none of these methods prescribe a
framework for objectively collecting data on non-technical performance measures.

27
The Team Software Process (TSP), based on CMM and PSP, provides a framework to
produce effective teams by helping teams organize and produce large scale software projects.
TSP is intended to improve the quality and productivity of the team’s project by providing teams
with a set of disciplined operational procedures and methods for tracking progress. In
conjunction with the processes, TSP recognizes the importance of teams and team interactions.
Within TSP, a coach role has been established. The primary responsibility of the coach is to
develop teams. TSP coaches inspire TSP teams and provide leadership and guidance to these
development teams [65]. TSP provides coaches with team building guidelines, but it does not
provide a way for coaches to objectively measure the non-technical aspects of team members.
The project management and software development industries acknowledge the
importance of the non-technical skills to project success. Although there is several process
methodologies that teams can follow to improve the software development process, and training
programs can be implemented to develop and build teams, there are no methods that provide
frameworks for actually assessing the non-technical skills that are so important to project
success. If management wishes to develop teamwork and other non-technical skills, they need to
train the team members. It is essential to be able to assess these non-technical skills so that
structured feedback about performance can be provided. This feedback is necessary to allow
training effectiveness to be evaluated.
To address the problem of measuring the non-technical skills necessary in the software
development process, I propose to create a behavioral marker system that for now I will call the
Non-technical Skills Assessment for Software Development Teams (NTSA). This is a behavioral
marker system that can be used to assess the non-technical skills of software development teams
and team members. It structures the key non-technical skills and example behaviors, which

28
indicate when the skill is being demonstrated well and poorly, into a framework useful for rating
these skills. The process used to develop NTSA is modeled after the ANTS system development
process and is shown in Figure 5.
Figure 5. The behavioral marker system development process
2.1.4. Validation of behavioral marker system
Validity refers to the degree to which a tool accurately assesses the specific concept that
it is attempting to measure [66]. Construct validation for NTSA is the process used to gather,

29
document, and evaluate this new assessment tool to see how well it can be used to measure the
non-technical skills of software developers. Software development project managers need tools
that will accurately capture the interpersonal performance parameters which will allow for
objective feedback to be provided. Sevdalis et al. [29] describes three ways to assess the
construct validity of a behavioral marker system. Long describes a fourth [31] and Uebersax
[67] describes a fifth.
The first method is based on the assumption that training in teamwork and interpersonal
skills should improve NTSA scores. An intervention study could be designed which involves a
pre-test, teamwork and interpersonal skills training, and then a post-test. If there is a significant
difference in the pre and post-test, then this proves good construct validity.
The second method involves using expert and novice observers. When using NTSA, two
(or more) expert observers’ scores should be more consistent than two novice observers’ scores.
The two expert observers’ scores should also be more consistent than an expert and a novice’s
scores. According to Sevdalis et al. [29] “the underlying rationale is that if 2 experts agree as
much as an expert with a novice, then either the tool is not robust in capturing the underlying
behaviors…or it is so commonsensical that there is no need for the tool to be there in the first
place.”
The third method involves calculating and interpreting correlations of NTSA scores with
other relevant measures such as observed disruptions in the software development team meeting
or setting, technical errors, or increased team stress.
The fourth method involves conducting interviews to obtain data for testing the validity
of the system, then using this data to assess the system through inter-rater reliability testing.

30
Experienced software professionals would be interviewed and asked to relate stories about a
difficult event or series of events that occurred while working with others in the software
development process, with particular attention paid to the actions that were taken in response to
the events. Once these statements are collected, the statements are sorted into the relevant skill
and proper behavioral marker. If the system is truly effective, then each statement will be sorted
into only one skill and behavioral marker. If there is any confusion regarding which element to
which the statement belonged, the skills and/or markers would need to be reworked. Next, inter-
rater reliability testing needs to be done. This involves having two coders independently
categorize the statements and the results analyzed using Cohen’s Kappa with a goal of κ = .80,
which would indicate near perfect agreement [68].
John Uebersax suggests that construct validity can be obtained by the use of McNemar’s
test to evaluate marginal homogeneity and statistically compare the raters’ results, as well as
Cohen’s Kappa. McNemar’s test assesses how significant the difference is between two
correlated proportions, such as might be found in the case where the two proportions are based
on the same sample of subjects. It is considered a very good test for nominal data. Basically,
given two paired variables where each variable has exactly two possible outcomes (coded as 1
and 0), the McNemar test can be used to test if there is a statistically significant difference
between the probability of a (0, 1) pair and the probability of a (1, 0) pair. For example, this test
is often used in a situation where one is testing for the absence (0) or presence (1) of something.
All of these methods provide a means for validation and any of these methods could be
employed to test the construct validity of NTSA.

31
2.1.5. Social sensitivity studies
I want to determine the impact of social sensitivity on team performance, team process
activities (i.e. brainstorming, dependability, cooperation, etc.) involved in team projects, and on
team member satisfaction. To accomplish these goals, an empirical study that investigates the
effect of social sensitivity on the performance of project teams was conducted. In the study I
interrogate the effects of social sensitivity on teams that work together for longer durations
produced a complex series of deliverables during that time. I also determine if previous
research, which was not focused on students or professionals in scientific or technical fields, is
germane for people in computing disciplines.

32
CHAPTER III. NON-TECHNICAL SKILLS TAXONOMY
The first step in the process of creating a non-technical skills taxonomy to be used in the
software developer behavioral marker system is to perform a literature review to identify the
relevant non-technical skills and ultimately the behaviors that are desired and the behaviors to be
avoided. Once these were identified, they needed to be organized, clustered, have their quality
assessed and validated by experts in from both academia and industry. This section details this
work which supported the creation of my behavioral marker tool.
3.1. Literature review
The first step in the process was to perform a systematic literature review. In accordance
with systematic review guidelines [69] I took the following steps:
(1) Formulate review research question(s).
(2) Conduct the review (identify primary studies, evaluate those studies, extract data,
and synthesize data to produce a concrete result)
(3) Analyze the results.
(4) Report the results.
(5) Discuss the findings.
The review protocol specified the questions to be addressed, the databases to be searched
and the methods to be used to identify, assemble, and assess the evidence.

33
One of the goals of this dissertation is to identify the non-technical skills (competencies)
of software professionals. To properly focus the review, a set of research questions were needed.
With the underlying goal to develop a software professional non-technical skills profile,
the high-level question addressed by this review was:
“What are the non-technical skills required of a software professional performing well in
their field and how can we discover what non-technical skills are valued by employers.”
Table 4. Research questions and motivations
Research question Motivation
1. What are the non-technical skills and
observable actions of a software professional
performing well in professional practice?
1.1. What non-technical skills are viewed as
important by educators?
1.2. What non-technical skills are viewed as
important by employers?
Investigate what desirable non-technical
skills should a software professional
software strive for to meet industry
expectations.
2. What methods, efforts or tools have already
been developed to identify a professional software
engineer profile that contain non-technical skills?
2.1. Have these methods or tools been
implemented and what were the results?
3. How should the competencies, viewed as
important to educators and employers, be
combined into a software engineer profile?
Investigate what tools may have been
recommended by others and, if the tools
were implemented, what are the lessons
learned.
Create a expert software engineer profile
tool that can be used by educators,
employers, and students to gain an
understanding of what competencies are
needed by a professional software
engineer.

34
This high-level question was then decomposed into the more specific research questions
and sub-questions shown in Table 4.
The first research question attempts to identify the existing empirical studies reported on
desired competencies in software professionals. Further it will look at the non-technical skills
thought important by educators and by employers. The second research question focuses on what
type of efforts, methods or tools exist that are used to identify or can be used to identify a
comprehensive list of non-technical skills. If any of these methods or tools has been
implemented, I will analyze their level of success and what lessons were learned. The third
research question combines the results of the first two research questions in an attempt to
develop a software professional non-technical skills profile.
Prior to conducting the search, an appropriate set of databases needed to be identified to
improve the likelihood of finding an exhaustive list of relevant sources. In this review the
following criteria were used to select the source databases:
1. The databases were chosen to include journals and conference proceedings that cover:
software engineer, professional, or developer profiles, software engineer, professional, or
developer competencies, software engineer, professional, or developer skills, software
engineer, professional, or developer frameworks, and software engineer, professional, or
developer assessments;
2. The databases had to have a search engine with an advanced search mechanism so that
keyword searches could be performed;
3. Redundancy of journals and proceedings across databases was minimized by reducing the
list of databases, where possible.
35
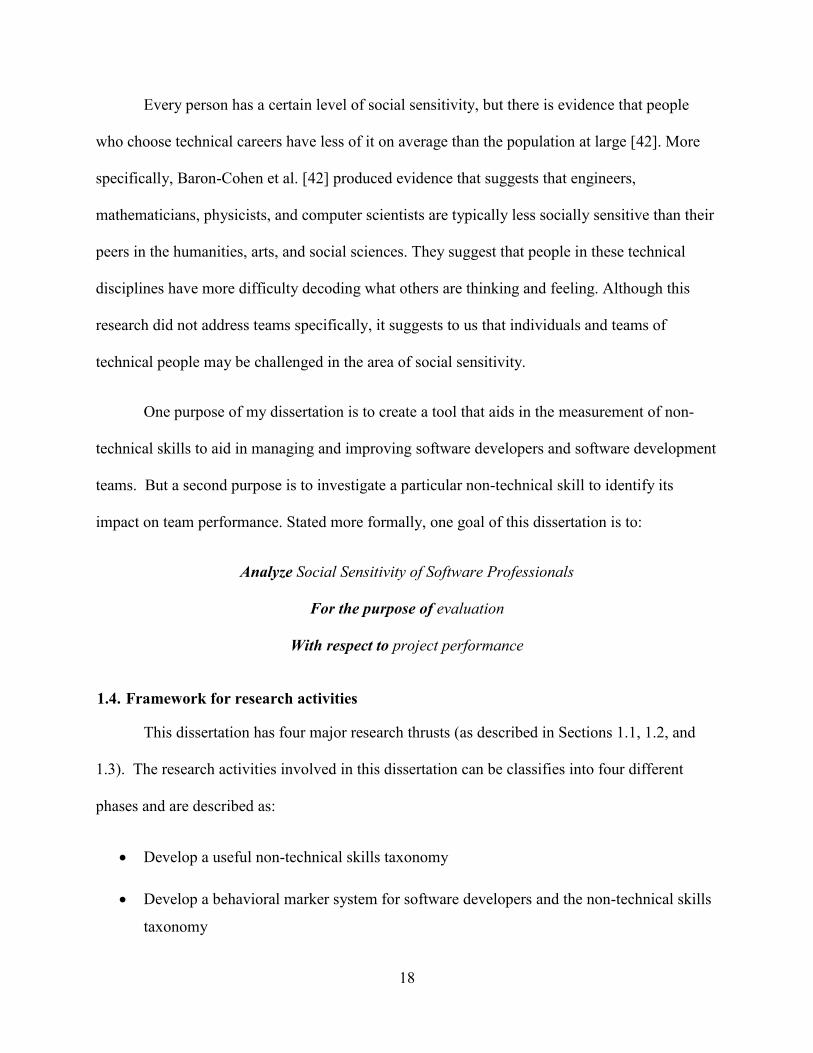
Based on the preceding criteria for selecting database sources the final source list is
shown in Table 5. To search these databases, a set of search strings was created for each research
question based on keywords extracted from the research questions and expanded with synonyms.
In developing the keyword strings to use when searching the source databases, the following
conventions were applied:
The major terms were extracted from the review questions and expanded with other terms
relevant to the research;
A list of meaningful synonyms, and alternate spellings was then generated. This list also
included additional teams from papers that were known to be relevant.
Table 5. Source list
Source Type Source(s)
Databases IEEExplore, ACM Digital Library,
EBSCO, SCIRUS (Elsevier),
Google Scholar
Other journals
and conferences
and references
from other papers
Journal of Systems & Software,
Journal of Engineering Education,
Foundations of Software
Engineering, American Society of
Engineering Education, Software
Engineering, International
Conference on Frontiers in
Education, International Conference
on Computer Science and
Education, Computer Science
Education, IEEE Automated
Software Conference for Industry
and Education, IEEE Conference on
Software Engineering Education
and Training, Reference lists from
primary studies
36
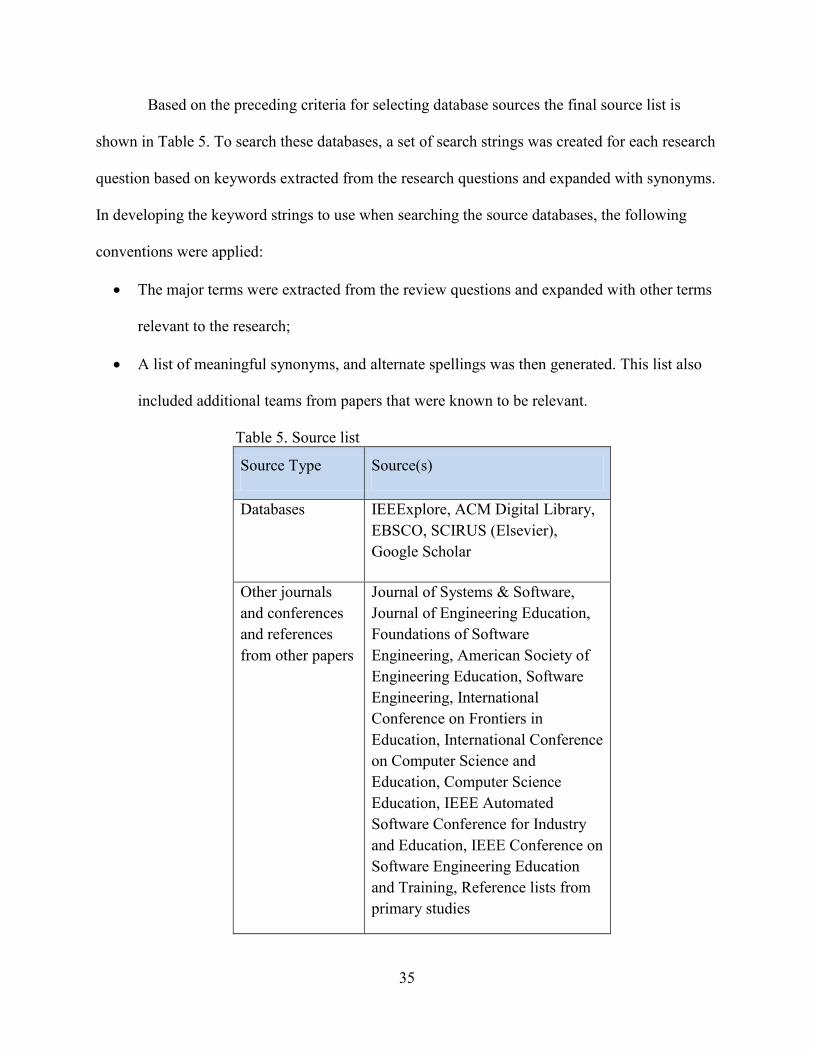
The following global search string was constructed containing all of the relevant
keywords and their synonyms:
(("software engineer") OR "software developer") AND ((((((((((((((“profile”) OR “framework”)
OR “assessment”) OR “skills”) OR “competency”) OR “competencies”) OR “behavior”) OR
“behaviour”) OR “attitude”) OR “knowledge”) OR “soft skills”) OR “non-technical skills”)
OR “non-technical skills”) OR “nontechnical skills”)
Table 6. Inclusion and exclusion criteria
Inclusion criteria Exclusion criteria
Papers that talk about
competencies or skills
related to knowledge,
abilities, and behaviors
of software engineers.
Papers that talk about
the development of
profiles, competency
assessment frameworks
for software engineers.
Papers that talk about
the development of
profiles, competency
assessment frameworks
for engineers.
Other papers that
directly address the
research questions.
Papers that assess a student
course work for the pupose of
grading.
Papers that develop peer
assessment instruments.
Papers that talk about
software engineer
assessments in other
countries.
Papers before the year 2000.
Papers that talk about
“virtual” employees.
Papers that are not in english.
Papers that are only based on
expert opinion.
Studies whose findings are
unclear or ambiguous.

37
Using this global search string, fourteen different search strings were derived and
executed on each database. The reason for the fourteen different strings is that they were easy to
execute and that method of retrieval allowed for better focus on the abstract contents. These
strings are explained in Table 7. Executing the search strings on the databases in Table 5 resulted
in a list of potential papers that could be included in the review. To ensure that only the most
relevant papers were included, a set of detailed inclusion and exclusion criteria was defined
(Table 6).
Table 7. Detailed search strings
String # High Level Search String Detailed Search String Review
Question Purpose
1
Profile approaches to create a method to collect and categorize competencies
(("software engineer") OR "software developer") AND (“profile”)
Q2
To determine if anyone has attempted to implement, design or develop a profile for software engineers or developers competencies.
2
Framework approaches to create a method to collect and categorize competencies
(("software engineer") OR "software developer") AND (“framework”)
Q2
To determine if anyone has attempted to implement, design or develop a framework for software engineers or developers competencies.
3
Assessment approaches to create a method to collect and categorize competencies
(("software engineer") OR "software developer") AND (“assessment”)
Q2
To determine if anyone has attempted to implement, design or develop an assessment tool for software engineers or developers competencies.
4 Identify software engineer or software developer skills.
(("software engineer") OR "software developer") AND (“skills”)
Q1 To identify important software engineer or software developer skills.
5 Identify soft skills of people in software
(“software”) AND (“soft skills”) Q1 To identify important soft
skills for people in software.
6 Identify non-technical of people in software
(“software”)AND(“non-technical skills”) Q1
To identify important non-technical skills for people in software

38
Table 7. Detailed search strings (continued)
String # High Level Search String Detailed Search String Review
Question Purpose
7 Identify non-technical of people in software
(“software”)AND(“non-technical skills”) Q1
To identify important non-technical skills for people in software
8 Identify non-technical of people in software
(“software”)AND(“non technical skills”) Q1
To identify important non-technical skills for people in software
9
Identify any competency a software engineer or software developer would have/use.
(("software engineer") OR "software developer") AND (“competency”)
Q1
To identify an important competency recommended or required by a software engineer or a software developer.
10
Identify software engineer or software developer competencies.
(("software engineer") OR "software developer") AND (“competencies”)
Q1
To identify important software engineer or software developer competencies.
11 Identify software engineer or software developer behaviors.
(("software engineer") OR "software developer") AND (“behavior”)
Q1
To identify important software engineer or software developer behaviors.
12 Identify software engineer or software developer behaviours.
(("software engineer") OR "software developer") AND (“behaviour”)
Q1
To identify important software engineer or software developer behaviours.
13 Identify software engineer or software developer attitudes.
(("software engineer") OR "software developer") AND (“attitude”)
Q1 To identify important software engineer or software developer attitudes.
14 Identify software engineer or software developer knowledge.
(("software engineer") OR "software developer") AND (“knowledge”)
Q1
To identify important software engineer or software developer knowledge.
Using these inclusion and exclusion criteria, the results of the database searches were
examined to arrive at the final list of papers. The process followed for narrowing down the
search results was:
Use the title to eliminate any papers clearly not related to the research focus;

39
Use the abstract and keywords to exclude additional papers not related to the
research focus;
Read the remaining papers and eliminate any paper that is not related to the
research questions.
After using the inclusion and exclusion criterion to select applicable papers and studies, a
quality assessment was performed on those studies. This quality assessment was another check
on the quality of the set of papers that resulted from the initial search.
Each accepted study, after using the inclusion and exclusion criterion and removing
duplicated studies, is assessed for its quality against a set of criteria. Some of these criteria were
informed by those proposed for the Critical Appraisal Skills Program (CASP) (in particular,
those for assessing the quality of qualitative research) and by principles of good practice for
conducting empirical research in software engineering. The CASP tool provides several
questions to assist in making sense of research. It also identifies three main issues pertaining to
quality that need to be considered when appraising the studies identified in the systematic
review:
1. Rigor: has a thorough and appropriate approach been applied to key research
methods in the study?
2. Credibility: are the findings well-presented and meaningful?
3. Relevance: how useful are the findings to the software industry and the research
community?
As a whole, these criteria provide a measure of the degree to which I could be confident
that a particular study’s findings could make a valuable contribution to the review. Each of the
criteria will be graded on a dichotomous (“yes” or “no”) scale. The quality assessment criteria

40
are shown in Table 8. In the data extraction, data was extracted from each of the primary studies
included in this systematic review according to a predefined extraction table. Table 9 enabled me
to record full details of the articles under review and to be specific about how each of them
addressed our research questions.
Table 8. Quality assessment
S. No Quality Assessment Criteria
1. Is the paper based on research or is it
merely a “lessons learned” report based on
expert opinion?
2. Is there a clear statement of the aims of
the research?
3. Is there an adequate description of the
context in which the research was carried
out?
4. Was the research design appropriate to
address the aims of the research?
5. Was the recruitment strategy appropriate
to the aims of the research?
6. Was the data collected in a way that
addressed the research issue?
7. Is there a clear statement of findings?
8. Is the study of value for research or
practice?
3.2. Cluster, describe, combine, and sort non-technical skills
After an initial list of non-technical skills was identified from the literature review, I
clustered the skills into four major categories: communication, interpersonal, problem solving,
and work ethic. These categories are shown in Figure 6 and were reviewed by three members of

41
my dissertation committee. I also had performed research to find meaningful descriptions for
each skill. In many instances, it was felt that an identified skill overlapped with another non-
technical skill, thus a list of synonyms was created to help provide clarity. This information can
be seen in Table 10.
Table 9. Data extraction form.
Attribute Description
Reference number This indicates reference number of the
paper considered for study
Authors The authors of the paper
Year The year of the publication
Title The title of the publication
Type of article Journal/conference/technical
report/online/book
Concepts The key concepts or major ideas in the
primary studies
Study aims The aims or goals of the primary study
Organizational method The type of method used to categorize the
competencies: profile, framework or
assessment
Type of competency This indicates if the competency should be
categorized as knowledge, ability or
behavior
Perspective of competency This indicates if the competencies have
been developed from an acedemic
perspective, an industry perspective or both
Study findings Major findings and conclusions from the
primary studies
Conclusions Relevance to the current research

42
3.3. Focus group
Synthesis of the literature review of software developer skills produced a draft set of 35
non-technical skills. This first draft was then incorporated into a survey that was send to a
diverse group of individuals from academia and industry that are intimate with the software
development profession and disciplines for review.
A group of 20 individuals (capstone design course instructors, software engineering
professors, and industry managers representing both publically and privately held companies
from small software development departments to large software development departments) was
asked to provide input on the non-technical skills. I employed two online surveys to assist in
gathering this input. A survey method is relatively inexpensive, can be administered from a
remote location, and is the best way to gather the non-technical skills data from a large number
of people. The focus group members who participated in these surveys are located in three
different states, thus using a survey questionnaire was an efficient way of collecting the non-
technical skills input. Both surveys used a cross-sectional survey design in which we gather
information about the non-technical skills important to a professional software developer at a
specific point in time. First, the initial list of non-technical skills was compiled and then I
created the first survey. The surveys that I created were electronic. Electronic surveys can
collect the data in the format that is exportable to a spreadsheet or database which makes further
processing convenient. I chose to email the survey links because not only is it a low cost
method, but it is very easy for participants to respond to email and to use electronic surveys.
The first survey used my initial draft of non-technical skills gathered from the literature
review as a basic guideline and then gathered non-technical skill priorities, missing non-technical
skills, description clarifications, and comments to produce a more robust non-technical skill

43
inventory. Once this survey was complete, an updated non-technical skills profile was created.
The purpose of the second survey was to gather examples of good and poor behaviors for the top
rated non-technical skills from the first survey. The details of the study are provided in the
following subsections.

44
Figure 6. Desired non-technical skills of software professionals

45
Table 10. Detailed desired non-technical skills of software professionals
Category Skill Synonyms Description
Com
munic
atio
n
Listening Listen and Understand Paying attention to and concentrating on what is being said, and
asking questions that refine points about which one is uncertain.
Oral Communications Communication; Verbal
Communication;
Communication Skills;
Presentation Skills
Presenting your ideas in a manner easily understood by your
audience, both in group meetings and person to person.
Reinforcing the message to others through gestures and facial
expressions.
Persuasion Change Agent; Salesman;
Influence; Influence and
Control; Ability to
Influence Others (sell);
Sales; Managing Power;
Managing Expectations
Promoting the system you advocate; persuading others to accept
your viewpoint.
Questioning Interviewing Asking the right questions in order to obtain the information
needed.
Written Communications Preparing written documents that accurately communicate ideas
in a manner that is easily understood by intended readers.
Inte
rper
son
al
Ability to receive
criticism
Being able to receive criticism non-defensively; taking in
constructive criticism and using it for the betterment of self.
Assertiveness Independence Insisting on a course of action or what one believes in, even
though it may be unpopular.
Attitude Disposition Demonstrating drive, passion, and enthusiasm through words and
actions.

46
Table 10. Detailed desired non-technical skills of software professionals (continued)
Culturally sensitive Cultural Awareness;
Global Perspective;
Cultural Differences;
Business Culture
Demonstrating a sensitivity and awareness to other people and
cultures. Being able to build rapport with a diverse workforce in
multicultural settings.
I
nte
rper
sonal
Diplomacy Diplomatic Being able to say “no” without being too blunt; displaying tact in
dealing with others.
Information Sharing Sharing knowledge of a subject with others either formally (i.e.
writing an article) or informally (i.e. discussing).
Interpersonal
Relationships
Customer Relations,
Interpersonal Skills;
Interpersonal;
Diplomacy; Relationship
Management; Team
Player; Relationship
Building
Builds relationships; relates to, and feels comfortable with
people at all levels and is able to make and maintain good
working relationships; inspires others to participate; mitigates
conflict with coworkers.
Leadership Team Leadership;
Leadership Skills;
Directing
Getting work done while keeping the team satisfied; maintaining
a productive climate and confidently motivating, mobilizing, and
coaching employees to meet high performance standards.
Giving instructions and communicating user requirements to
programming and support staff. Inspiring and energizing others
to carry out tasks and achieve goals by displaying a clear sense
of direction and values.
Negotiation Negotiation; Conflict
Management; Conflict
Resolution
Resolving disputes and conflicts through a willingness to work
with other people to reach solutions that everyone can live with.
Resolving conflict in a productive manner.
Patience Continually refining user requirements by requesting feedback;
tolerating lack of computer literacy and specificity.

47
Table 10. Detailed desired non-technical skills of software professionals (continued)
Inte
rper
son
al
Politics Understanding what motivates individuals; determining sources
of power and influence in an organization.
Self-Esteem Confidence; Self-
confidence
Displaying confidence in self and what they can offer to their
employer.
Social Sensitivity Empathy Being able to understand how others feel; accurately determining
what someone else thinks about an issue.
Teamwork Team Building; Group
Work; Group Dynamics;
Cooperation;
Collaboration
Working with others productively.* Working cooperatively with
others to achieve shared goals, showing diplomacy and
flexibility when there are conflicting opinions; Supporting other
people’s performance to achieve the best possible results.
Pro
ble
m-S
olv
ing
Attention to Details Quality and Accuracy Attentive to all aspects of a task or work environment. Being
precise and accurate in answering questions, making decision,
and creating document, records, or projects.
Critical thinking Demonstrating reasoned, reflective thinking by articulating
clarified goals, examining assumptions, evaluating evidence, and
assessing conclusions after action has been taken.
Judgment and Decision
Making
Selecting a course of action among several alternatives.

48
Table 10. Detailed desired non-technical skills of software professionals (continued)
Pro
ble
m S
olv
ing
Learning Lifelong learning;
Willingness to learn;
Intellectual curiosity;
Learning Ability; Ability
to Learn from Mistakes
Showing an openness to grow and learn by acquiring new, or
modifying existing knowledge, behaviors, skills, values or
preferences.
Problem
Sensitivity/Contextuality
Problem Identification;
Problem Sensitivity
Being aware of the implications of change and of design for the
user community.
Problem Solving Skills
Being able to analyze problematic situations, seeking relevant
data; diagnosing information in order to solve problems;
generalizing alternative solutions to find the best solution. Finds
solutions to problems using creativity, reasoning, and past
experiences along with the available information and resources.
Generates workable solutions and resolve complaints.
Research skills Investigative Skills;
Information Seeking;
Searching
Being able to assess a situation, seek multiple perspectives,
gather more information if necessary, and identify key issues that
need to be addressed. Demonstrating ability for identifying,
scrutinizing, improving, and streamlining complex work
processes.
Visualization Ability to Visualize;
Conceptualize; Ability to
handle ambiguity
Being able to create mental images of existing objects or objects
to be developed. The ability to create these mental images based
on text that was read or words that were heard.

49
Table 10. Detailed desired non-technical skills of software professionals (continued) W
ork
Eth
ic
Flexibility Open to new experiences;
Adaptability; See Things
from Different
Perspectives
Being able to adapt to changing conditions and work
assignments. Is open to new ideas and concepts, to working
independently or as part of a team, and to carrying out multiple
tasks or projects.
Initiative/Motivation to
work
Work Ethic; Proactive;
Persistent; Commitment;
Self-Management
The ability to work independently, with minimal supervision;
work hard until the job is done and continuously strive to
improve oneself.
Integrity/Honesty/Ethics Demonstrates that they are truthful, act honestly, avoid
deception, and treats others fairly. Complies with rules and
regulations, and fulfills all commitments.
Organized Organizational Skills;
Organizational
Management; Concern
for order
Being able to design, plan, organize, and implement projects and
tasks within an allotted timeframe.
W
ork
Eth
ic
Professionalism Acting in a responsible and fair manner in all personal and work
activities; Avoiding being petty.
Responsibility Reliability; Dependability Taking responsibility for personal actions and the potential
impact of one’s actions.
Stress Tolerance Stress Management;
Working under pressure
Working well under pressure and/or against opposition.
Time Management Multitasking Abilities Being able to plan and prioritize personal workload, and to do
several tasks at once.

50
3.3.1. Survey methodology
The following sections illustrate the survey methodology used for the study.
3.3.1.1. Research questions
These surveys intend to answer two research questions.
Research Question 1: What are the non-technical skills of a software developer performing well
in professional practice?
1.1 What non-technical skills are viewed as important by educators?
1.2 What non-technical skills are viewed as important by industry employers?
Research Question 2: What are the observable actions of the non-technical skills of a
software developer?
3.3.1.2. Representative sample population
Because cultural differences have been found to have a significant impact on individuals
[70], I decided to only seek input from educators and employers along the I-29 corridor of
Minnesota, North Dakota, and South Dakota. Three universities (Dakota State University -
DSU, North Dakota State University - NDSU, University of Minnesota Crookston - UMC),
along the I-29 corridor, were identified to have programs that would produce graduates suitable
to being employed as Software Engineers and individuals were selected from each university.
The individuals, consisting of capstone coordinators, curriculum developers, and professors, who
teach upper-division software development courses, were highly familiar with their university’s
curriculum and how their curriculum was expected to fulfill industries expectations. Industry
collaborators were also selected to participate in the focus group. Each of these industry
collaborators were selected because the companies they were associated with were located along
51
the I-29 corridor; they all employed many new graduates that work in software engineering and
software development related jobs; and they all have human resource departments that are well
developed with sufficient resources to have created comprehensive competency expectations for
their company’s employees and thus would have clearly defined expectations. The industry
collaborators included managers of software professionals from each of the companies. By
pursuing individuals and industries within these states we minimize the effects of cultural
differences.
3.3.2. Survey procedure
The survey procedure consists of five steps. Figure 7 shows the details of the survey
steps. The details are provided in the following subsections.
1) Step 1- Creating a Non-Technical Skills Inventory: Software development professional
non-technical skills were compiled from a literature review. These non-technical skills were
then clustered into major categories each non-technical skill was described. The clustering and
categories were reviewed, discussed and approved by the research dissertation committee.
2) Step 2- First Focus Group Survey: First, a letter was sent to all potential members of the
focus group explaining what was expected of them and the anticipated time commitment as well
as the benefits we hoped to achieve and then asking them to participate. All members accepted.
The focus group was emailed an electronic survey and asked to rank the importance of each non-
technical skill to software professionals. The skills were listed in the categories and in the same
order as seen in Table 10. The survey also included the descriptions listed in this table. The
ranking, that we asked the focus group to produce, provides prioritization of non-technical skills
that most reflect expert activities. The focus group was also asked to provide inputs (suggested
revisions to the non-technical skills, clarifications of the non-technical skill descriptions, missing

52
elements, assess quality, and any further comments) to the non-technical skills. The quality of
the non-technical skills was assessed per the guidelines provided by Davis and Beyerlein [38] by
asking the focus group was asked to provide feedback on the quality of the non-technical skills.
The input provided from the focus group helped create a more robust non-technical skill list.
Figure 7. Details of the focus group survey procedure
3) Step 3 – Compile High Priority List of NT Skills for Further Development: The results of
this first survey were compiled into an improved non-technical skills taxonomy. Some
competencies were re-grouped, and the competency list trimmed of competencies that did not
meet the quality standards. This more robust and non-technical skill list was then trimmed to

53
only include the most highly prioritized non-technical skills, which was intended to make it
easier for the focus group to complete the second survey. We looked at different ways to analyze
the Likert data from the first survey. One method was to look at which non-technical skills
received the highest percentage of essential ratings. In that vein, the list of the top skills and the
percentage of respondents who thought this skill was most essential (rank = 1) can be found in
Table 11.
Table 11. Essential non-technical skills ratings
Non-Technical Skill Percentage of Respondents Who Rated Skill as
Essential
Teamwork 91%
Initiative/Motivation to
work
73%
Listening 73%
Attitude 64%
Critical Thinker 64%
Oral Communications 64%
Leadership 64%
Problem Solver 64%
Attention to Detail 55%
Flexibility 55%
Integrity/Honesty/Ethics 55%
Time Management 55%
A second, and very common method considered often used in analyzing the Likert data
was to simply summarize the Likert values for each non-technical skill. Based on the
summaries, the most essential skills, in order, are teamwork, attitude, listening,
initiative/motivation to work, critical thinking, problem solving, attention to details, flexibility,
integrity/honesty/ethics, time management, interpersonal relationships, oral communications,
questioning, learning, leadership, and responsibility. These two lists were very similar; however,
after discussing these results with my advisors, it was decided that I should combined the two

54
lists to comprise the second draft of the non-technical skills that should be considered in the
second focus group survey.
4) Step 4 – Focus Group Survey #2: The second survey was also an electronic survey which
was sent to the focus group. This survey posed open-ended questions that asked the participants
to provide examples of observable actions that indicate good performance and behavior of each
non-technical skill as well as examples of observable actions that indicate poor performance and
behavior of each non-technical skill. They were asked to provide as many examples as they
wished for each skill. The skills under consideration were: teamwork, initiative/motivation to
work, listening, attitude, critical thinking, oral communications, leadership, problem solving,
attention to detail, flexibility, integrity/honesty/ethics, time management, and questioning. A
total of 408 examples of good and poor behaviors were collected.
5) Step 5 – Compile Complete Non-Technical Skills Taxonomy for the Behavioral Marker
System: These examples of good and poor behavior provided by the focus group were analyzed
using an adaption of the consensual qualitative methodology [71, 72] were reviewed and
redundant examples were eliminated. Next, the researchers then reviewed the remaining
behaviors and evaluated their clarity and how observable they were and removed those
behavioral examples, such as “being a good team player” and “body language and persona
emitting that you do not enjoy your work”, that were too ambiguous. It was also felt that the
“Leadership” skill did not have enough observable behaviors that would be able to be clearly
identified, so that non-technical skill was removed. Based on the inputs from the second survey, I
developed a behavior-based software engineer non-technical skills taxonomy to be used as the
base for the behavioral marker system. Figures 8-19 show the resultant examples of good and
poor behavior for each skill.

55
Figure 8. Listening example behaviors

56
Figure 9. Oral communications example behaviors

57
Figure 10. Questioning example behaviors

58
Figure 11. Attitude example behaviors

59
Figure 12. Teamwork example behaviors

60
Figure 13. Attention to detail example behaviors

61
Figure 14. Critical thinking example behaviors

62
Figure 15. Problem solving example behaviors

63
Figure 16. Flexibility example behaviors

64
Figure 17. Initiative/motivation to work example behaviors

65
Figure 18. Integrity, honesty and ethics example behaviors

66
Figure 19. Time management example behaviors
3.3.3. Threats to validity
In this survey study, I was able to address some threats to validity. To improve construct
validity in the competency inventory, descriptions of the non-technical skills were provided to
aid in a common understanding of each non-technical skill across all stakeholders. To avoid
sampling bias, I selected educators from several universities who would be highly familiar with
their university’s curriculum and how their curriculum is expected to fulfill industries
expectations. I also selected industries that hire many software engineering graduates and have
well defined competency expectations of their employees. However; there is still the threat that I
did not get a broad enough representation of educators and industry representatives that would
enable us to capture all required competencies. I plan on addressing this threat by performing

67
future surveys that encompass a larger sample of Midwest educators and employers. I also
realize that there is a validity threat with the survey questions and instructions in that they may
have been misunderstood. I was able to address some of the question and instruction design
threat by performing an initial survey with a specific focus group of educators and employers.
This allowed us to gain feedback the instructions and on our competency and cluster definitions
before the second survey. Lastly, there is a common method variance validity threat in creating
the initial non-technical skills taxonomy because it was compiled by the researchers. I attempted
to mitigate this error to some degree by having five researchers review the data. Also, the
surveys mitigated some of the non-technical skills listing threats by having input from many
others and gathering the data in two separate surveys.
3.3.4. Conclusion
Based on the results of the surveys, the data from the academic and non-academic
software computing professionals, a software development professional non-technical skills
taxonomy was produced and relevant examples of good and poor behavior identified. This
taxonomy provides a more complete picture of the non-technical skills needed by software
development professionals than found in current literature of IEEE, ACM, SEI or ABET and can
serve as a tool to help educational institutions with identifying needed non-technical skills for
future software development professionals and curriculum development, to motivate the students
to develop these skills, and to help employers communicate their expectations to educators.
68
CHAPTER IV. BEHAVIORAL MARKER SYSTEM
There are four basic steps involved in the creation of a behavioral marker system for
software development. The first step consists of researching existing behavioral marker systems
and designing my system. The second step identifies the non-technical skills that could be
applied to software professionals (see 3.1). The third step involves collecting data for testing the
validity of the system. The fourth step involves using the data gained to assess the system.
4.1. Literature review
The results of the literature review on existing behavioral marker systems showed that
there are no behavioral marker systems currently being used in the software industry, but did
identify existing behavioral marker systems in aviation, health care, nuclear power, rail transport
and maritime transport. Each system’s structure was examined. Each had its strengths and
weakness, but the Communication and Teamwork Skills (CATS) Assessment showed the most
potential for use in software development because it was devised to measure communication and
teamwork providers in a variety of medical environments rather than focusing on a medical
specialization. It also provided an easy to use scoring method [46]. The competency literature
review identified four categories of non-technical skills that were important to good software
development team practice. These categories of skills included communication, interpersonal,
problem solving, and work ethic. A skills taxonomy has been developed and examples of good
and poor behaviors have been collected for each skill. This process is summarized in Figure 5.
For brevity, the behavioral marker audit tool will be named the Non-Technical Skill
Assessment for Software Developers (NTSA). The NTSA is designed to be used by an observer
(i.e. manager, team leader, coach) during routine team interactions or meetings. It was intended

69
that each time a behavior is observed, a mark is placed in the appropriate column by clicking on
the column: observed and good, variation in quality or expected but not observed. Observations
can be clarified by placing explanations in the comments section. The observer can see skill
definitions and examples of good and poor behavior for a particular behavioral marker by
viewing the second page. A manager is allowed to list as many or as few skills as desired in the
behavioral marker column. The reason for this flexibility is that different organizations and
different managers may wish to focus on a certain subset of non-technical skills. The observer
will score the behaviors base on how well the behavior meets the behavioral examples and its
definition. An example of good and poor coordination behaviors from another behavioral marker
system [70] is shown in Table 12. Examples of good and poor behavior for NTSA can be viewed
in figures 8-19. The definitions and behavioral examples should be reviewed before the audit
session to help provide consistency in rating.
Table 12. Coordination behavioral marker examples
Frankel et al. [73] worked with a certified behavior analyst and a biostatistician to
develop a method for weighing the observational scores of the CATS assessment instrument.
“For each behavior, a weighted total is obtained as follows: Marks in the ‘Observed and Good’
column = 1; marks in the ‘Variation in Quality column = .5; and Marks in the ‘Expected but not
Observed’ column = 0”. Next, the number of marks for each behavior is multiplied by their
column’s score value. These intermediate totals are then added together to obtain a weighted

70
total. The weighted total is then divided by 100 to obtain the quality score for that behavior.
These quality scores can then be displayed in a graph to aid in providing feedback to the team or
individual team member. Originally, an example of what the behavioral marker system looks
like after the literature review can be viewed in Figure 20.
Figure 20. Non-technical skills assessment for software development teamwork audit tool

71
CHAPTER V. EMPIRICAL VALIDATION OF THE BEHAVIORAL MARKER
SYSTEM
Software development is an exercise in teamwork and team management. Though
software processes and best practices are adopted to ensure that software is developed in a timely
fashion and to a sufficient degree of quality [02], the success of a development project mainly
depends on the team behind it. Though technical skills are prerequisite, the interplay between
project members is equally important. A project whose team consists of individuals with sound
technical skills yet poor non-technical skills is at a greater risk of failure when compared to a
project whose development team excels in both areas [75, 76]. Although non-technical skills are
extremely relevant to the success of software development projects, there are no current methods
for measuring those skills. That is the reason for the development of the NTSA behavioral
marker tool. The goal was to create a tool that is very usable by practitioners: it requires little or
no training to use and does not require unreasonable effort to use. It is a concern of the
researcher that if the tool took a lot of training or was too difficult to use, that the potential
practitioners, such as project managers and team leads for whom the tool was meant to assist,
would not find the tool useful because of the amount of effort required.
5.1. Team non-technical skill evaluation using behavioral marker system tool
In order to evaluate this tool an empirical study was performed. This study rated video
clips of student software development teams that were working on industry projects within The
Software Factory. The Software Factory is a software development laboratory created by the
University of Helsinki Department of Computer Science. All research was performed in Finland

72
due to the requirements of international privacy laws. The University of Helsinki is consistently
ranked in the top 100 out of world's 15,000 universities, in part because the university promotes
science and research together with European's top research-intensive universities. The master’s
degree programs are taught in English in order to support the large number of international
students who study at the university.
5.1.1. Software Factory background
The Software Factory’s primary participants are students, but the businesses provide team
members who work with the students, and university faculties oversee the projects, although the
faculty involvement is kept to a minimum. Almost all project communication is in English.
Faculty involvement consists primarily of project orientation and project intervention if problems
cannot be resolved by the students, coach, and customer. The coach is generally an upper level
student with Software Factory project experience. One of the factors that contribute to the
business-like environment is the fact that the students in the team constantly work together, just
like in a real work place, for a period of seven to eight weeks on the project. Another factor is
that each project has a real business demand behind the project. This is one reason why the
project context is valid for research. Researchers are able to observe what happens in the project
due to the seven cameras that provide multiple angles of view and four microphones that record
activities in the Factory room.
The teams use the Scrum Agile software development methodology, which is an iterative,
incremental, holistic product development strategy in which the software development team
works together to reach a common goal. Its focus is on being flexible. Scrum encourages the
creation of self-organizing teams and strives to have all team members co-located. It is a
methodology for which verbal communication between all team members is critical. One of the

73
key principles of Scrum is that it recognizes and accepts that customers can change their minds
about what they want and need during the course of the project. Scrum can be implemented
through a wide range of tools, and the Software Factory’s primary tool to help build and
maintain artifacts (such as the sprint backlog and change management) is the Kanban board.
Kanban helps the team to visualize the workflow, limit WIP by assigning limits to how many
items may be in progress at a time, and aids in the ability to optimize the process in order to
make lead time as small and predictable as possible.
In Software Factory projects, the participants take on the core roles of a typical Scrum
project. The customer has company representatives that take on the role of the product owner and
represents the interests of the company (stakeholders). Although these representatives are not
co-located, they do come by the Software Factory for weekly demos, sometimes for meetings,
and are generally available via telephone and email. The students take on the role of the
development team and are required to work at the factory approximately six hours a day, five
days a week. Lastly, the coach serves in the role Scrum Master and makes sure that the Scrum
process is used correctly and helps remove roadblocks that the development team may encounter.
Although the coach is involved daily for the first week of the project, he fades out of the project
as the project progresses and the development team takes on more responsibility.
Projects at the Software Factory last for seven to eight weeks depending on the number of
holidays within the time period. Each project starts off with a project kick-off and orientation.
During the first week of the project, the Scrum Master provides coaching on the Scrum process
and how to use the Kanban board. Typically in Scrum driven projects, the sprint is the basic unit
of development. At the Software Factory, a sprint is one week long with the project deliverable
displayed to the customer representatives every Friday. The project team decides on their work

74
hours and the time of day for the daily Standup Meeting. During the first week of the project, the
Scrum Master leads the daily standups, but after that different members of the project team tend
to lead the daily standup. Other than the daily standup meetings and the customer demos there
are no other predetermined meetings other than the Retrospective that occurs at the end of the
project.
5.1.2. Study design
The study was designed to validate the new Behavioral Marker System for Software
Developers. Because there is no definitive criterion variable or “gold standard”, the accuracy of
the behavioral marker system can be assessed by comparing its results when used by different
raters [67]. This study investigates whether the behavioral marker system can be used with
consistency by different raters to capture a measurement of the non-technical skills of software
developers, thus facilitating objective feedback to software development teams and individuals.
This study used a blocked subject-project study. This type of analysis allows the
examination of several factors within the framework of one study. Each of the non-technical
skills to be studied can be applied to a set of projects by several subjects and each subject applies
each of the non-technical skills under study. In this study, raters evaluated the non-technical
skills of project teams using the NTSA tool. The project teams worked together using state-of-
the-art tools, modern processes and best practices to prototype and develop software for real
business customers in an environment that emulates industry. Video tapes of the projects were
evaluated to rate the student team’s non-technical skill performance. The details of the study are
provided in the following subsections.
75
5.1.2.1. Study goals and hypotheses
Using the Goal Question Metric (GQM) approach [77], the following goal and hypothesis
were formulated.
Goal 1: Analyze rater’s non-technical skill rating of student software development teams for
the purpose of evaluation with respect to the rater’s level of agreement.
Hypothesis 1: The raters, using the behavioral marker system tool will rate teams
consistently and be in relative agreement for all non-technical skills in the NTSA tool.
5.1.2.2. Independent and dependent variables
The experiment manipulated the following independent variable:
a) Behavioral Marker System tool and Example Behaviors: Each non-technical skill
has its own set of good and poor behavioral examples that are used by the raters to evaluate
team performance of each non-technical skill.
The following dependent variable was measured:
a) Rater’s Evaluations: The behavioral rating for each non-technical skill by each
rater. This measure includes the percent positive for each rater for each non-technical skill.
5.1.2.3. Participating subjects
The participant subjects were student software developers from two different projects.
There were two different projects that were evaluated. In each project, the students were in the
Computer Science master’s degree. One project had five team members and a coach and the
other had seven team members and a coach. The course required the students to work together,
developing a software solution to a project posed by the business customer.

76
5.1.2.4. Artifacts
Although the NTSA tool could be used to evaluate the non-technical skills of both
individuals and teams, it was decided to test for team skills first. Because we were primarily
interested in how the team member’s non-technical skills manifested when interacting with
others, it was decided that the first clips to be evaluated would be of team meetings, and so
standup meetings, impromptu team meetings, and customer demos were targeted. After
extracting all of these clips, it was determined that we would focus on standup meetings because
of the consistency and quantity of footage. Two raters used the NTSA tool to independently rate
each clip. The NTSA was in the form of a spreadsheet on a computer.
5.1.2.5. Experimental procedure
The study steps are as follows:
a) Step 1 – Project Selection: Due to the fact that I could only be in Finland for one
month, we decided to focus on two projects. We selected one project that had gone well and
one that had not gone well in the expectation of producing diverse scorings. As we started
to review the video from the first project (which was the project that had not gone well), it
was determined that the audio quality was not of a high enough quality to for someone to
accurately observe behaviors. Because of this, we selected another project, but that project
was fairly successful, although not as successful as the other project that was chosen for
review.
b) Step 2 – Video Clip Collection: Video and audio recordings of the entirety of each
project were collected. The Software Factory deployed seven video cameras to capture all
parts of the room at a variety of angles to provide a wide range of viewing possibilities.
There were also four microphones deployed to capture all speech. The cameras were situated

77
such that one could not actually view what was on the computer monitors or clearly see any
of the paper artifacts, although anything written on the white board or displayed on either of
the two projectors could be clearly viewed. These audio and video collection devices were
operational twenty four hours a day, seven days a week. Video clips were labeled with the
type of meeting along with date and start and end times so if the clip because corrupted and
needed to be re-created, the researcher would know exactly what day and time to go retrieve
the clip. A spreadsheet was used to store this information along with which cameras and
microphone were used in the clip. All clips were stored on a secure server that was only
available to the researchers while they were in the Computer Science Department on the
campus grounds. The final NTSA tool that was used by the raters is shown in Figure 21.
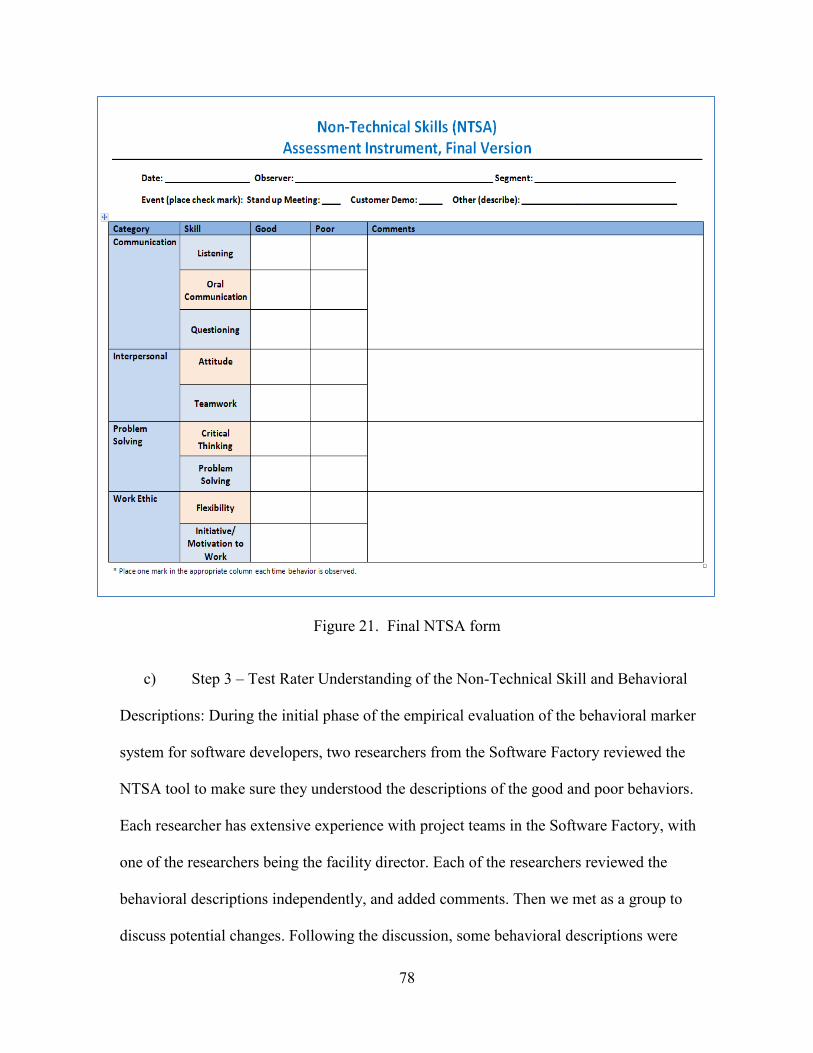
78
Figure 21. Final NTSA form
c) Step 3 – Test Rater Understanding of the Non-Technical Skill and Behavioral
Descriptions: During the initial phase of the empirical evaluation of the behavioral marker
system for software developers, two researchers from the Software Factory reviewed the
NTSA tool to make sure they understood the descriptions of the good and poor behaviors.
Each researcher has extensive experience with project teams in the Software Factory, with
one of the researchers being the facility director. Each of the researchers reviewed the
behavioral descriptions independently, and added comments. Then we met as a group to
discuss potential changes. Following the discussion, some behavioral descriptions were

79
modified, some eliminated and some added. Ultimately, the group reached a consensus on
all descriptions.
d) Step 4 – Test Usability of the Tool: The Software Factory researchers used the
initial NTSA tool to evaluate several clips to test usability. First, each researcher reviewed
the descriptions of each behavior and the good and poor behavioral examples. Then, each
researcher did independent evaluations of the clips, after which we met for discussion of the
evaluations. There was consensual agreement that fine gradations in quality were difficult to
determine and the researchers agreed that the tool would only include ratings for good and
poor behavioral observations. It was also determined that it was unrealistic to observe the
behaviors for Integrity, Honesty, and Ethics, Attention to Detail, and Time Management and
that it would be better to look at other documents and devices, such as Kanban metrics, bug
reports and customer feedback to observe and rate those non-technical skills. Unfortunately,
the Software Factory did not record bug reports for any of the projects thus far and the
Kanban metrics are in process of being produced at this time. Thus, Integrity, Honesty, and
Ethics, Attention to Detail and Time Management were also removed from the Behavioral
Marker tool. Both researchers preferred to use the electronic version of the NTSA tool as
opposed to the paper tool. The researchers also noted that it was very difficult to determine
how often to place a mark for exhibition of good and poor behavior because the meetings
were continuous. Because the raters are not classifying discreet events or statements, it was
decided that the researchers would be notified when a minute had passed, which would
prompt them to decide if the team exhibited any good behaviors or poor behaviors and to put
a mark in the appropriate column. If the researcher did not feel that any good or poor
behaviors were exhibited by the team, they did not place a check mark. If they felt that both

80
good and poor behaviors were exhibited, they put a check mark in each column. In order to
provide effective feedback on each non-technical skill, the raters only evaluated one non-
technical skill at a time while watching the video clip. Thus, each researcher watched each
video clip ten times in order to provide full feedback ratings. After the evaluation of the last
clip and post discussion, there was consensus that the tool was ready for testing.
e) Step 5 – Actualizing Rater’s Evaluations: Each rater individually rated forty five
standup meetings over the course of ten weeks. The time spread of the ratings simulates the
frequency with which a manager, team lead, or coach would use the tool. We also wanted to
eliminate the amount of fatigue that could transpire. The raters used the spreadsheet version
of the NTSA behavioral marker system tool with the one minute timer. Unlike the trial
evaluations, the raters rated all non-technical skills while viewing the video clip as opposed
to only rating one non-technical skill per viewing.
5.1.2.6. Data collection and evaluation criterion
Because we were primarily interested in how the team member’s non-technical skills
were manifested when interacting with others, and because there were a large number of
standup meetings versus impromptu meetings or customer demos, it was decided that standup
meetings would be the focus of our analysis. We were able to limit the video footage to view
based on the schedule that the development team agreed upon. Generally, the team limited their
development efforts to Monday through Friday from eight in the morning to five in the
afternoon. Thus, for a typical seven to eight week time period, this means that there were
approximately 2,205 to 2,520 hours of video footage per project available, with four different
audio choices for each hour. Based on the limitation on the software used to extract video clips,
each clip was limited to the display of four camera angles and one audio source. The researcher

81
responsible for extraction chose the cameras she believed gave the best view of all of the
meeting participants and activities. In most cases this included four camera angles, but in some
cases only two camera angles were adequate to effectively view the participants and their
activities. She also chose which microphone provided the good audio quality, which typically
corresponded to the part of the room where the activity was taking place.
We evaluated the percentage of positive ratings, and developed a binary data set to be
able to run statistical analyses. By inspecting the distributions of the raters when examining the
skills, a critical value (specific to each NT skill) was chosen to separate the 0 or 1. For example,
for the Listening non-technical skill, a critical value of 0.8 was chosen. This value was chosen
because it approximately separated the raw data evenly into two parts. Thus, if the good
percentage was greater than or equal to 0.8, the rating was assigned to 1, and the rating was
assigned to 0 if the good percentage was less than 0.8. Using this information, a 2X2 table
containing the good and bad percentages of two raters can be created. Next, a McNemar’s test
can evaluate whether or not there are significant differences between the raters. A value of p <
0.05 would tell us that there is a significant difference between the raters and p value greater
than 0.05 would signify inter-rater reliability.
We performed McNemar’s for all the other non-technical skill inter-rater reliability
evaluations.
5.1.3. Data analysis and results
This section provides analysis of the quantitative data that includes the rater’s evaluations
for good and poor behaviors observed in the standup meetings. This section is organized around
the hypotheses presented in Section 5.1.2.1. It was decided that to follow John Uebersax’s [67]
recommendation to run McNemar’s test of marginal homogeneity to calculate the inter-rater

82
reliability between two individuals. Cohen’s kappa could not be used to establish inter-rater
reliability because the sample size was not large enough so the kappa test would not be reliable.
An alpha value of 0.05 was used for all statistical analysis.
5.1.3.1. Analysis of rater agreement
This section provides the analyses of the agreement between the two raters. The analyses
were performed for each of the nine remaining non-technical skills: listening, oral
communication, questioning, attitude, teamwork, critical thinking, problem solving, flexibility,
and initiative and motivation to work. Figure 22 shows all of the McNemar test results for each
of the non-technical behaviors evaluated.
Figure 22. Aggregation of McNemar test results

83
To test this study’s hypothesis, we ran McNemar’s on the percentage positive ratings
(calculated to produce a binary data set) for each rater and for each non-technical skill to test for
rater agreement in cases where there were enough observation data points. Listening was the first
non-technical evaluated. The McNemar test produced a result of 0.7539 which indicates that
there is no significant difference between the two raters, since the p-value is greater than 0.05.
Oral Communication was another non-technical behavior evaluated. The McNemar test
produced a result of 1.0000 which indicates that there is no significant difference between the
two raters, since the p-value is greater than 0.05. We conclude, from McNemar’s test, that there
is statistical evidence that there is no difference between two raters on ‘oral communication’.
Questioning was also evaluated. The McNemar test produced a result of 0.6291 which
tells us that there is no significant difference between the two raters since the p-value is greater
than 0.05. By looking at the results from McNemar’s test, we believe there is no difference
between two raters on ‘questioning’.
Attitude was the next non-technical evaluated. The McNemar test produced a result of
0.2379 which tells us that there is no significant difference between the two raters since the p-
value is greater than 0.05. By looking at the results from McNemar’s test, we believe there is no
difference between two raters on ‘attitude’.
Teamwork was the next non-technical evaluated. The McNemar test produced a result of
0.1153 which tells us that there is no significant difference between the two raters since the p-
value is greater than 0.05. By looking at the results from McNemar’s test, we believe there is no
difference between two raters on ‘teamwork’.

84
Critical thinking was the next non-technical evaluated. The McNemar test produced a
result of 0.2266 which tells us that there is no significant difference between the two raters since
the p-value is greater than 0.05. By looking at the results from McNemar’s test, we believe there
is no difference between two raters on ‘critical thinking’.
Problem solving was the next non-technical evaluated. The McNemar test produced a
result of 0.008 which tells us that there is significant difference between the two raters since the
p-value is less than 0.05. By looking at the results from McNemar’s test, we believe there is
significant difference between two raters on ‘problem solving’.
Flexibility was the next non-technical evaluated. The McNemar test produced a result of
1.0000 which tells us that there is no significant difference between the two raters since the p-
value is greater than 0.05. By looking at the results from McNemar’s test, we believe there is no
difference between two raters on ‘flexibility’.
Initiative and motivation to work was the next non-technical evaluated. The McNemar
test produced a result of 0.2863 which tells us that there is no significant difference between the
two raters since the p-value is greater than 0.05. By looking at the results from McNemar’s test,
we believe there is no difference between two raters on ‘initiative and motivation to work’.
5.1.4. Threat to validity
Although the results of this study are encouraging, there are certain threats to validity that
exist. One such threat is that only two projects were evaluated. Like any study, the more a
subject is tested, the more empirical studies that are performed, the more one can see if the
results are repeatable. Rater agreement testing should continue to be performed on more projects.
Another threat is that both projects were rated by the same two judges. In the future, more

85
empirical studies should be performed with different raters using the NTSA tool to ensure the
robustness of the tool. One positive aspect about the raters is that each had different levels of
software development project management experience. That means that the raters do not have to
have the same level of experience or backgrounds in order to use the tool and get reliable results.
Another potential threat is that both projects were fairly successful, and thus may not have
exercised the poor behavior examples enough. Lastly, the projects were performed by student
teams and thus many not be generalizable; although this threat was mitigated by the level of
professional business-like environment that can be found in the Software Factory and by the fact
that both projects were real-world projects for real-world businesses.
5.1.5. Discussion of results
The fundamental finding is that inter-rater reliability of NTSA was found for eight of the
nine non-technical skills in the tool. The “Problem solving” non-technical skill needs further
enhancements and subsequent validation before it could be used. In fact, it is possible that
“problem solving” simply is not observable. The Non-Technical Skills Assessment for Software
Developers (NTSA) system can be used reliably by individuals responsible for the non-technical
skills of software development teams, such as educators, managers, team leads, etc. Although the
raters did practice rating several video clips with the tool, and this is equivalent to a few
meetings, it is also very interesting to note that the raters do not need to be human factors
experts, nor did it require extensive initial training for the tool to be used reliably. Although the
raters felt that it was very easy to use the tool in its spreadsheet form while working with the
form on a computer where the behavioral examples are only a click away, they also noted that
they would like to keep the electronic capability if they were rating a live event rather than a
video recorded event. The raters also noted that the tool could be customized to only include the

86
non-technical skills of interest to the rater – not all non-technical skills need to be rated at the
same time. This would make the tool even easier to work with.
5.1.6. Conclusion and future work
Our results establish that the NTSA tool can be reliably used with minimal effort. This is
valuable knowledge for managers and educators. Although we recognize that teams need
members with the correct technical skill set and knowledge, by using NTSA software
development team mangers can identify the areas in which the team’s non-technical skills could
use some improvements. Using the same tool on subsequent projects will allow one to determine
if there was any improvement in a given skill. Such as tool provides a mechanism with which to
improve a team and by extension the software they produce. The director of the Software
Factory intends to use this tool to assist in the development and improvement of the non-
technical skills of the student software development teams.
In the future, we would plan on repeating this study on other projects. I would especially
like to use the tool on an unsuccessful software development project to see if there is a
correlation between poor non-technical skills and an unsuccessful project. I would also like to
extend this research to include all of the non-technical skills deemed important to software
developers as identified in the non-technical skills taxonomy. This would give educators and
managers a rich set of non-technical skills and behaviors that could be evaluated. This tool also
needs to be tested on individual software developers within software development teams to see if
it can be effectively used to assess the non-technical skills of the individual as well as the team.
This tool should also be tested in industry to verify that it works for professional software
developer and teams, as well as student software development teams.

87
CHAPTER VI. SOCIAL SENSITIVITY AND TEAM PROJECTS
Several experiments related to social sensitivity (SS) have been completed: currently two
papers have been published. I came up with the initial idea for the social sensitivity study and did
almost all of the initial research. A team was then formed. As a team we decided on the study
design. I then created an initial pre-test, post-test, and peer evaluation instrument to be used in
the study. The team discussed and revised these instruments. Lastly, I analyzed the data and
wrote much of the first paper and almost all of the second paper. The first paper is covered in
section 6.1 and the second in section 6.2. In summary, our results establish that the performance
of teams is positively correlated with the SS of members. Our results also establish that both task
performance effectiveness and affective measures of a team are positively correlated with the SS
of members. This is valuable knowledge for managers and educators. Although we recognize
that teams need members with the correct skill set and knowledge, by using SS as an additional
input, more effective teams can be composed.
6.1. Social sensitivity and classroom team projects: an empirical investigation
Team work is the norm in major development projects and industry is continually striving
to improve team effectiveness. Researchers have established that teams with high levels of
social sensitivity tend to perform well when completing a variety of specific collaborative tasks.
Social sensitivity is the personal ability to perceive, understand, and respect the feelings and
viewpoints of others, and it is reliably measurable. However, the tasks in recent research have
been primarily short term, requiring only hours to finish, whereas major project teams work
together for longer durations and on complex tasks. Our claim is that, social sensitivity can be a
key component in predicting the performance of teams that carry out major projects. Our goal is

88
to determine if previous research, which was not focused on students or professionals in
scientific or technical fields, is germane for people in computing disciplines. Here I am reporting
the results from an empirical study that investigates whether social sensitivity is correlated with
the performance of student teams on large semester-long projects. The overall result supports our
claim that the team social sensitivity is highly correlated with successful team performance. It
suggests, therefore, that educators in computer-related disciplines, as well as computer
professionals in the workforce, should take the concept of social sensitivity seriously as an aid or
obstacle to productivity.
6.1.1. Introduction
Team work has become increasingly important in today’s world. Individual work is also
highly valued, but as the world grows more complex, projects also grow more complex. They
tend to have objectives that involve many sophisticated tasks and require the collective work of
individuals to accomplish. This is especially true for computer scientists and software engineers
who work in the area of software development. Complex projects require people to interact with
each other as well as with computing technologies. Project development processes are often
difficult due to the complexity of the technologies, as well as the complexity of social
interactions between the project team members. Previous research asserts that the ability to use
soft skills to navigate interpersonal relationships and negotiate social interactions is critical to
team success [75, 76]. With current academic standards and curricula, many students graduate
with the technical, hard skills that they need, but they often lack necessary soft skills that are
critical to team success [78]. Begel and Simon studied recent college graduates who were hired
by Microsoft and found that while the new hires generally did well, there were numerous
problems with communication and collaboration with others [36]. Soft skills are not only

89
important to teamwork, but also to education. Researchers note that interpersonal and small-
group skills are essential to positive cooperative learning [79].
One factor that can greatly influence collaborative team performance is team
composition. Much research has been done on team composition, but no single attribute stands
out as key to superior performance. Intriguing questions were raised by a recent group
intelligence study, which established that group intelligence depends less on how smart
individual group members are and more on team dynamics, including how well team members
collaborate [80]. These researchers found that social sensitivity made the largest contribution to a
group’s overall intelligence and was a primary predictor of team effectiveness in accomplishing
short-term tasks. Social sensitivity is defined as the personal ability to perceive and understand
the mind and mood of others. Our primary research goal is to determine if the connection
between social sensitivity and team performance extends to students or professionals in
computing fields who carry out longer-term tasks within major projects.
We conducted an empirical study that investigated the effect of social sensitivity on the
performance of project teams consisting of computer science and management information
system students who worked on semester-long projects. These student projects were completed
in multiple stages, each building upon previous work. The results indicate that social sensitivity
maybe key to success for these team projects, and suggest that social sensitivity would likewise
be key in the success of complex projects, such as those carried out by software development
teams.

90
6.1.2. Background and related work
The prominence of collaboration in the computing industry has created the need to study
how to form highly effective teams. West [02] notes that effective teams complete projects
quickly, develop and deliver cost-effective products, maintain high quality, have low stress
levels, have high team member satisfaction, and promote innovation. He also notes that although
effective teams can benefit a project, teamwork is not automatically beneficial. A major team-
related factor that can affect project performance is the interaction of individual personalities.
Other factors affecting the project performance include team communication, cooperation, and
coordination [81, 82]. One of the main factors contributing to poor performance is project team
composition [76]. This suggests that management needs to form teams wisely.
There are many factors to consider when forming teams, and their impact on team
composition has been widely studied. An increasing number of educators use many criteria to
form teams such as gender, race, prior class or work experience, personality, problem solving
style, and/or grade point average [83]. Within Software Engineering field, some of the factors
include the effects of personality composition [14, 84], team member abilities [85, 86], team
roles [85, 87, 88, 89], diversity [90], shared mental models [76, 91], and team member
satisfaction [76]. Chan et al. [75] suggests that soft skills are the primary factor that should be
considered for achieving good project performance. They argue that higher levels of soft skills
within the team facilitate the application development skills and domain knowledge skills
necessary to achieve good project performance. In the spirit of this study, our work has produced
new knowledge by taking a soft skill that Chan et al did not interrogate (i.e., social sensitivity)
and investigated how it affects the team performance.

91
Social Sensitivity is the ability to correctly understand the feelings and viewpoints of
people [39]. It has also been defined as “the ability to understand and manage people” [40].
Salovey and Mayer [41] view social sensitivity as an element of emotional intelligence and
identify some of the characteristics of socially intelligent people to include the ability to admit
mistakes, to accept others for who they are, to enhance other’s moods, to be social problem
solvers, to be flexible thinkers, and to have an interest in the world at large. They also recognize
that the appraisal and expression of emotion often takes place on a nonverbal level. The ability to
perceive nonverbal expression insures smoother interpersonal cooperation. By perceiving,
empathizing, and then responding appropriately, people experience greater satisfaction, more
positive emotions, and lower stress. Such positive emotions aid in creative thinking and enable
flexibility in arriving at alternatives to problems. These characteristics suggest that high levels of
social sensitivity could be a benefit for teams.
Every person has a certain level of social sensitivity, but there is evidence that people
who choose technical careers have less of it on average than the population at large [42]. More
specifically, Baron-Cohen et al. [42] produced evidence that suggests that engineers,
mathematicians, physicists, and computer scientists are typically less socially sensitive than their
peers in the humanities, arts, and social sciences. They suggest that people in these technical
disciplines have more difficulty decoding what others are thinking and feeling. Although this
research did not address teams specifically, it suggests to us that teams of technical people may
be challenged in the area of social sensitivity.
Our study is not the first to address the relationship between social sensitivity and
teamwork, but the duration and complexity of our project make it unique. A major inspiration for
our study comes from the work of Woolley et al. [80]; a recent study on social sensitivity that

92
established a correlation between social sensitivity and effective teamwork. They describe a
group general effectiveness or collective intelligence that predicts group performance and is
grounded in how well groups interact and work together. Another interesting result from this
study was that team performance was not driven by the intelligence of individuals on the teams;
group cohesion, motivation, or satisfaction. The tasks in their study were short-term contrived
tasks requiring hours, rather than months, to complete. Thus, those team members had little
opportunity to develop longer-term working patterns. Our study extends this research by
interrogating the effects of social sensitivity on teams that worked together for longer
durations—the better part of an academic semester—and produced a complex series of
deliverables during that time. In many ways our study closely approximates a real working
environment.
In order to proceed with our study, we needed an accurate test to determine an
individual’s level of social sensitivity. There are several methods for testing social sensitivity.
The one we chose to use is referred to as the “Reading the Mind in the Eyes” test which was
created and validated by Baron-Cohen et al. [92]. This test gauges the accuracy of individuals in
judging someone’s emotional state by looking at their eyes. A subject is presented with a series
of 36 photographs of the eye-area of actors. For each photograph, the subjects are asked to
choose which of four adjectives best-describes how the person in the photograph is feeling. This
test was originally developed to measure an ‘advanced theory of mind’ in adults, which is the
ability to identify mental states in oneself or another person. The test has been found to have test-
retest reliability [93]. Alternative techniques for measuring social sensitivity, such as the George
Washington Social Intelligence Test [94] and the Vineland Social Maturity Scale [77] were

93
rejected due to reported inaccuracies or the inclusion of factors irrelevant to our research [90,
95].
6.1.3. Study design
The study was designed to analyze the relationship between the social sensitivity of
student teams and the quality of work in computer science team projects. This study investigates
whether the student teams with higher average social sensitivity were positively correlated with
their actual performance on the project, as measured by grades.
This study used a randomized experimental design in which participants were tested to
determine their social sensitivity scores and were then randomly assigned to teams of three
participants each. Each team worked together to complete a major semester-long project on an
ethical issue related to current computer technology in society. The project deliverables were
evaluated to score the student team’s performance on the project. The details of the study are
provided in the following subsections.
6.1.3.1. Study goals and hypotheses
Using the Goal Question Metric (GQM) approach [77], the following goals and
hypotheses were formulated.
Goal 1: Analyze student’s social sensitivity scores for the purpose of evaluation with
respect to their team project performance.
Hypothesis 1: Student teams with higher average social sensitivity scores perform
significantly better on the project.
Goal 2: Analyze student’s social sensitivity levels for the purpose of characterizing their
effect with respect to the increase in the team project performance.
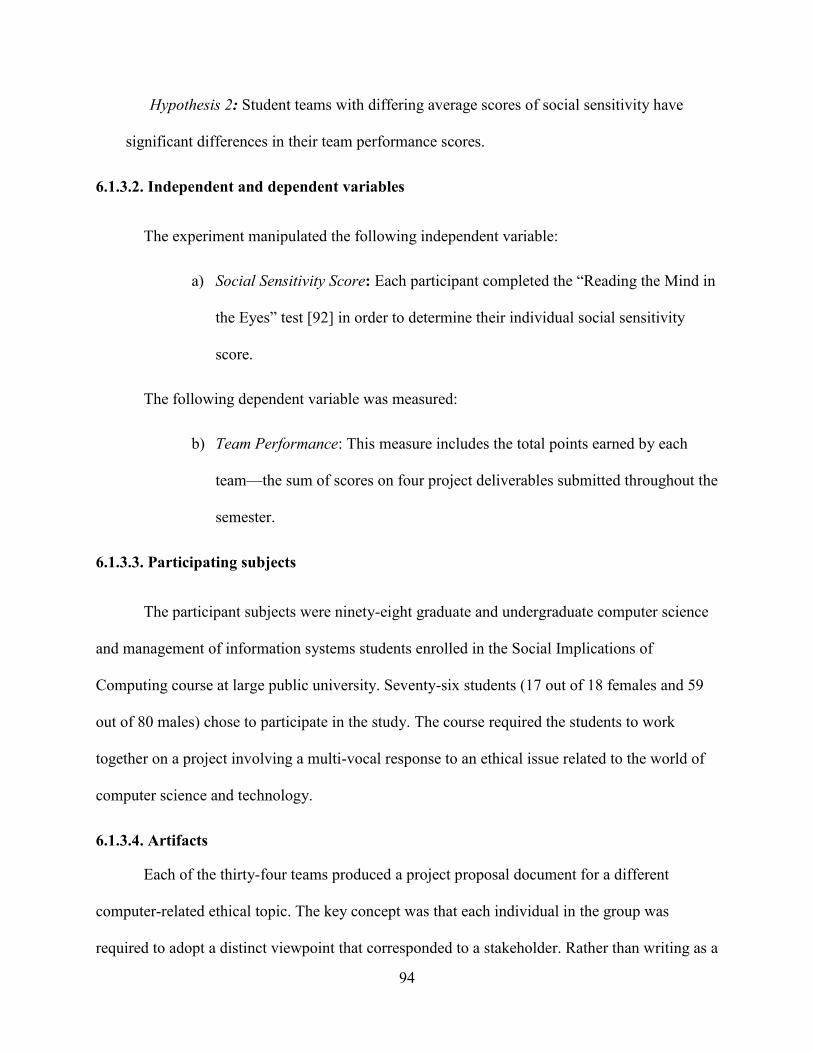
94
Hypothesis 2: Student teams with differing average scores of social sensitivity have
significant differences in their team performance scores.
6.1.3.2. Independent and dependent variables
The experiment manipulated the following independent variable:
a) Social Sensitivity Score: Each participant completed the “Reading the Mind in
the Eyes” test [92] in order to determine their individual social sensitivity
score.
The following dependent variable was measured:
b) Team Performance: This measure includes the total points earned by each
team—the sum of scores on four project deliverables submitted throughout the
semester.
6.1.3.3. Participating subjects
The participant subjects were ninety-eight graduate and undergraduate computer science
and management of information systems students enrolled in the Social Implications of
Computing course at large public university. Seventy-six students (17 out of 18 females and 59
out of 80 males) chose to participate in the study. The course required the students to work
together on a project involving a multi-vocal response to an ethical issue related to the world of
computer science and technology.
6.1.3.4. Artifacts
Each of the thirty-four teams produced a project proposal document for a different
computer-related ethical topic. The key concept was that each individual in the group was
required to adopt a distinct viewpoint that corresponded to a stakeholder. Rather than writing as a

95
single voice trying to answer the ethical question posed in the proposal, the group members
represented diverse views on their topic. The consequences of alternative actions were traced to
their logical conclusions and evaluated with regard to their impact on other stakeholders. One
goal of having the students working together as a team was to help them to understand
perspectives other than their own, and, through discussions, to produce a final presentation and
essay that contains ideas that would not have been articulated by working independently. The
students met throughout the semester to develop their instructor-approved topics and produced
an interim report, a final report, and a final project presentation.
6.1.3.5. Experimental procedure
The study steps are as follows:
a) Step 1 – Test Subjects for Social Sensitivity: The “Reading the Mind in the Eyes”
test [92] was administered at the beginning of the semester to measure each subject’s social
sensitivity. A glossary was provided that contained a definition and sample sentence for each
of the emotion word selection choices used in the test. The basis for the glossary was
provided by the work of Baron-Cohen et al. [92]. The purpose of the glossary was to ensure
that participants had a clear understanding of the definitions of words. The students were
encouraged to read through the glossary prior to the test and to refer to it as needed during
the test. The survey was administered online and the completed responses were analyzed for
correctness. Individual social sensitivity scores were based on the number of correct
responses.
b) Step 2 – Forming Student Teams: Subjects were randomly assigned to teams of
three students each. A total of 34 teams were formed. Because one student dropped the

96
course, by the end of the semester 33 teams had three students each and one team had two
students.
c) Step 3 – Actualizing Team Projects: The students worked in teams on specific
semester-long projects. Each team produced a project proposal, an interim report, a final
report, and a final presentation. Most groups chose a topic from a list of ideas provided by
the instructor, although students could pursue any topic that was approved by the instructor.
After the project was approved, the teams performed the necessary research to write a project
proposal due February 28. The proposal required them to articulate ethical questions that they
planned to investigate, justify the questions’ importance, identify major stakeholders and
ethical values, specify their research methods, and plan the project. Half way through the
semester, each team submitted an interim progress report (due April 11) that described the
project goal, objectives, and scope, employed research methods, used evidence to support
ethical viewpoints, and evaluated potential stakeholder actions. Near the semester end, each
team gave an oral presentation (due April 29-May6) on their project and submitted a final
written report (due May 6).
d) Step 4 – Evaluating Team Projects: Scores were determined for each deliverable
using detailed rubrics to structure the grading. All grading was done by the same person. All
members of a team received the same score for each assignment. The team performance (i.e.,
the total team score) was measured by summing each team’s score from all the four
deliverables.
e) Step 5 – Peer-Self Evaluations: After each deliverable, the subjects completed an
evaluation of each of their team members as well as themselves. As identified in the literature
(e.g., [90, 96]), the following ten candidate characteristics of an effective team member were

97
included: focusing on the tasks, being dependable, responsibility sharing, listening,
questioning, discussing, research and information sharing, individual performance,
brainstorming, and group teamwork. Subjects rated each of the ten attributes on a 5-point
Likert scale (4 –Excellent, 3 – Good, 2 – Average, 1 – Poor, and 0 – Fail) and provided
comments. These results were captured to help researchers better understand the results.
f) Step 6 – Post-Study Survey: A nineteen-question survey was administered to the
students at the end of the semester. The post-study survey collected data regarding the self-
perceived effectiveness of each team, including whether members felt valued; if the team
cooperated, communicated, and interacted well; if effective feedback occurred among team
members; if conflict existed and how it was resolved; and what the quality was of the team
work environment overall.
6.1.3.6. Data collection and evaluation criterion
Because this study investigates the impact of social sensitivity on team performance, only
teams that had at least two team members consenting to participate in the study were included in
our analysis; and only the consenting team member’s social sensitivity scores and team
performance scores were collected. After this elimination process, 28 out of 34 teams remained
in the study.
Individual student social sensitivity test scores for each of the 76 participating subjects
are shown in Figure 24. The social sensitivity (SS) scores range from a minimum of 9 to a
maximum of 32, with most subjects scoring in the range of 19 to 25. Interestingly, our mean
sample score of 22.59 was lower than the general population sample score of 26.2 reported by
Baron-Cohen et al [92]. Team average SS scores were also calculated. The average team SS

98
scores range from a minimum of 12 to a maximum of 29, with the most of subjects scoring in the
range of 19 to 25.
Student team performances on the four project deliverables were summed into a final
project score for use in the analysis of the impact of the team’s average SS on the final project
team scores.
6.1.4. Data analysis and results
This section provides analysis of the quantitative data that includes student’s social
sensitivity scores and their team’s project performance. This section is organized around the two
hypotheses presented in Section 2.3.1.3.1. An alpha value of 0.05 was used for all statistical
analysis and r2 value of 0.30 was used for correlations.
6.1.4.1. Analysis of the effect of social sensitivity (SS) on team’s project performance
This section analyzes the connection between the student’s SS and their performance on
the team project. Because each team consisted of two to three subjects, and the SS data from
Step 1 was individual data, the individual SS scores were combined into one team score. The SS
score of each team was calculated by averaging the individual team member’s SS scores. The
performance of each team (i.e., total team score), while developing their projects, was calculated
by combining the scores on each of the four deliverables. This analysis was performed for each
of the 28 teams.
Figure 23 plots each team’s average SS scores against their total team project score. To
test hypothesis 1, we ran a linear regression test to see whether the average SS scores of a team
were positively correlated to the team’s performance (i.e., total team score). The results show
that the team SS score had a significant positive correlation with the total team score (p =0.001;

99
Pearson’s R = 0.383; r2 = 0.16). Additional testing was also performed to determine if there were
any outliers, and the results confirmed that there were no outliers.
We also analyzed whether the team SS scores were correlated with the team performance
on each of the four deliverables. The results showed that the team SS scores had a strong and
significant positive correlation with their performance on the project proposal (p=0.004), interim
report (p=0.003), and final report (p=0.05). The result, however, did not show a significant
correlation between teams’ average SS and performance on the final presentation (p=0.382).
In order to better understand the results, the individual SS scores were also analyzed to
evaluate their relationship to the performance of the teams. The results show that individual SS
also had a significant positive correlation with the total team score (p =0.009; Pearson’s R =
0.297; r2 = 0.09). Based on these results, the teams with higher average SS performed
significantly better on their project.
Figure 23. Individual Social Sensitivity Scores.

100
6.1.4.2. Analysis of student teams with differing average levels of social sensitivity
The results reported in Section 2.3.4.1 indicate that the individual SS and the team SS
scores were positively correlated with team performance. We performed further analysis to
determine the cut-offs points in order to gain insights into the level of social sensitivity required
to produce a significantly higher level of team performance.
We determined these cutoff points by analyzing the performance of the teams at multiple
levels of team SS. Clusters of teams were set at different ranges on the SS scale. The mean team
scores for each cluster were then calculated and analyzed. The results are shown in Figure 24 and
are explained below.
As shown in Figure 24, there were only 2 teams with a SS score below 18 (the mid-point
of the SS scale), and no team had a SS score greater than 29. Therefore, we used a SS scale of
19-29. We divided teams into three different clusters, such that a roughly equal number of teams
belonged to each. Using this process, three different SS Level clusters (19-21; 22-24; and 25-29)
were formed. Next, the mean performance of the teams in each of the three SS clusters was
calculated. An independent samples-t test was then performed to determine whether there was a
significant difference in the mean performance of teams. The result shows that the teams with SS
scores ranging from 22-24 performed significantly better than the teams whose SS scores ranged
from 19-21 (p= 0.03). Similarly, the teams with SS scores ranging from 25-29 performed
significantly better than the teams with SS scores of 22-24. These results are shown in the top
section of Figure 25.

101
Figure 24. Effect of social sensitivity on the team performance
Performing further analysis of these results, we created smaller SS clusters. Using the
same analytical process, we compared the mean performance of teams in each of these SS
groups. These results are shown in the middle section of Figure 25. The independent samples t-
test showed that teams with SS scores of 23 and 24 performed significantly better than teams
with lower SS scores (p =0.01) and that the teams with SS scores of 27 and 29 were better than
teams with lower SS scores (p <0.001).
Continuing this analysis for fine-grained SS scores in this study (as shown in the bottom
section of Figure 25), we found that a SS of 27 resulted in significantly better team performance,
and that SS scores beyond 27 does not result in significantly higher team performance. We note
that there were not an equal number of teams in each of the fine-grained SS groups, and this
could have an impact on our results.

102
Figure 25. Team performance at different SS levels
6.1.5. Threat to validity
Although the results of this study are encouraging, there are certain threats to validity that
exist. One such threat is language proficiency. Approximately fifty percent of the students in the
course are international students. Even though each of these students has passed an English
proficiency exam, some could have struggled with the language. To improve construct validity in
the “Reading the Mind in the Eyes” test, a glossary was provided that contained a definition and
sample sentence for each of the word selection choices used in the test. Students were
encouraged to read through the glossary before they took the test and refer to it as necessary
during the test. However, because the students were not supervised while taking the test, we do

103
not know how extensively the glossary was used. Feedback from students suggests that some
groups struggled with language barriers as well, which could be a confounding factor that
hinders success.
6.1.6. Discussion of results
Our fundamental finding is that SS is a good predictor of team performance carrying out
major student team projects with complex tasks and multiple deliverables over long periods of
time. This extends previous research that showed that SS had high impact on teams
accomplishing well defined short-term relatively simple tasks. Task complexity is an important
factor in team performance because the difficulty of the task can impact the success of the team
[97]. Complex tasks within large projects have many opportunities for errors and they can be
hard to identify. Such projects can easily create a stressful environment for students which can
hinder team performance (e.g. impaired decision making, decreased speed and accuracy of task
performance) by adversely affecting team coordination and ability to engage in team activities.
These difficulties can ultimately discourage a team. The factor of project duration on team
performance comes into play as team members become more intertwined and interdependent, the
impact of one member’s lapse can disrupt the entire team’s performance. The longer the team
works together, the more intertwined they are likely to become.
Another interesting finding in our study is that it is supports Baron-Cohen’s assertion that
engineers, mathematicians, physicists, and computer scientists are, generally, less socially
sensitive. The participants in our survey are all majoring in scientific or technical disciplines and
their mean SS score of 22.59 was lower than the original general population sample mean SS
score of 26.2 of Baron-Cohen et al [92]. This suggests that these students find it more difficult to
perceive and understand the feelings and viewpoints of others. An awareness of this can help

104
educators better recognize reasons behind team difficulties and help students focus on techniques
for managing that social deficit.
Yet another finding is that there is a significant correlation between SS and team
performance on the first three deliverables of the project, but not on the last deliverable (i.e. the
project presentation). One possible reason for this is that a more collaborative effort was needed
to create the three written documents; whereas the presentation was based on the final report and
the team members likely partitioned the presentation and worked independently to each produce
their own portion. During the actual presentation, most groups had each member take turns
where each member spoke sequentially, one after another. The independent performance of this
task may have diminished the effect of the SS factor on the performance of this last deliverable.
6.1.7. Conclusion and future work
Our results establish that the performance of teams is positively correlated with the SS of
members. This is valuable knowledge for managers and educators. Although we recognize that
teams need members with the correct skill set and knowledge, by using SS as an additional input,
more effective teams can be composed.
Using quantitative data related to work in teams, our work demonstrates compelling
correlations between SS and performance on group projects. These correlations tempt us to assert
that high SS causes high performance. We expect that our future work with qualitative analysis
will support this connection. We have extensive qualitative data from study participants that
relates to their experiences working on the teams, and we hope that these will be useful for
teasing how SS impacted groups on practical levels. We know that some groups faced

105
interpersonal challenges, and we plan to investigate whether such challenges were better-
overcome in teams with socially-sensitive individuals.
Assuming that SS is a cause rather than simply correlated with team success, then this
type of research raises many exciting questions of interest to people across academia. How
much SS is needed for success? Can SS be learned? Authors such as Anthony Mersino have
published techniques for improving emotional intelligence [98]. If these techniques can be
effectively applied to improve SS, then team performance can also be improved. In any case, it
is our hope that a greater understanding of SS will result in better learning experiences in the
college classroom, better productivity of software engineering teams, and ultimately better
relationships between all humans.
6.2. Social sensitivity correlations with the effectiveness of team process performance: an
empirical study
Teamwork is essential in industry and a university is an excellent place to assess which
skills are important and for students to practice those skills. A positive teamwork experience can
also improve student learning outcomes. Prior research has established that teams with high
levels of social sensitivity tend to perform well when completing a variety of specific, short-
team, collaborative tasks. Social sensitivity is the personal ability to perceive and understand the
feelings and viewpoints of others, and it is reliably measurable. Our hypothesis is that, social
sensitivity can be a key component in positively mediating teamwork task activities and member
satisfaction. Our goal is to bring attention to the fact that social sensitivity is an asset to
teamwork. We report the results from an empirical study that investigates whether social
sensitivity is correlated with the effectiveness of processes involved in teamwork and team
member satisfaction in an educational setting. The results support our hypothesis that the social
sensitivity is highly correlated with team effectiveness. It suggests, therefore, that educators in

106
computer-related disciplines, as well as computer professionals in the workforce, should take the
concept of social sensitivity seriously as an aid or obstacle to team performance and the
teamwork experience.
6.2.1. Introduction
Teamwork is increasingly important in today’s world. Although, individual work is also
highly valued, software development projects are increasingly complex and tend to involve many
sophisticated tasks and require the collective work of individuals to accomplish. Thus it is
important to prepare students as future practitioners and provide them with positive teamwork
experiences. Complex projects require people to interact with each other, as well as with
computing technologies. Project development processes are often difficult due not only to the
complexity of the technologies, but also to the complexity of social interactions between the
project team members. Previous research asserts that the ability to use soft skills to navigate
interpersonal relationships and negotiate social interactions is critical to team success [75, 76].
With current academic standards and curricula, many students graduate with the technical, hard
skills that they need, but they often lack necessary soft skills that are critical to team success
[78]. Soft skills are not only important to teamwork in industry, but also in a classroom
environment. Research results show that interpersonal and small-group skills are essential to
positive cooperative learning and improved learning outcomes [79, 99]. Begel and Simon studied
recent college graduates who were hired by Microsoft and found that while the new hires
generally did well, there were numerous problems with communicating and collaborating with
others [36]. Rademacher studied students at a large university and found that a lack of soft skills
often prevented students from getting hired or caused problems once they began working in
industry [100].

107
One factor that can greatly influence collaborative team performance is team
composition. Much research has been done on team composition, but no single attribute stands
out as key to superior performance [14, 84, 86, 88, 96]. Intriguing questions were raised by a
recent study, that established that group intelligence depends less on how smart individual group
members are and more on team dynamics, including how well team members communicate and
collaborate [80]. These researchers found that social sensitivity, which is the personal ability to
perceive the mind and mood of others, made the largest contribution to a group’s overall
intelligence and was a primary predictor of team effectiveness in accomplishing short-term tasks.
Motivated by these findings, a major goal of this research is to investigate if the
connection between social sensitivity and team performance extends to students in computing
fields who carry out longer-term tasks within major projects in addition to the short-term tasks.
Another goal of this research is to determine if social sensitivity impacts team process activities
(i.e. brainstorming, dependability, etc.) involved in team projects. We wanted to see if SS had an
effect on any of these process activities to better understand how SS affected team performance.
One last goal is to investigate whether social sensitivity impacts the satisfaction of the team
members. By looking at these three measures, we hope to gain a more complete picture of the
impact of social sensitivity on the overall effectiveness of a team.
To accomplish these goals, we conducted an empirical study that investigated the effect
of social sensitivity on the performance of project teams consisting of computer science and
management information system students who worked on semester-long projects. These student
projects were completed in multiple stages, each building upon previous work. The results
indicate that social sensitivity of subjects is positively correlated with their performance on the
group projects. This suggests that social sensitivity is a key factor in the success of complex

108
projects, such as those carried out by software development teams. Our results also show that
social sensitivity is positively correlated with many of the process activities performed in team
work and with team member satisfaction.
6.2.2. Background and related work
Teamwork is essential throughout organizations in all areas of society, including industry
and education. Increasingly, the complexity of today’s problems cannot be solved by an
individual and require the resources of a team. Wuchty et al. has report that over the last 50
years, more than 99 percent of the work in scientific subfields, from biochemistry to computer
science, have experienced increased levels of teamwork and that the best research now emerges
from groups [101].
The prominence of team collaboration has created the need to study what makes teams
effective. In academia, the more effective a team is, the greater chance there is for learning and
success. The educational benefits of teamwork are well documented in the educational literature
[102]. Working in teams leads to an improvement of learning outcomes [99] and is positively
associated with students’ self-assessed quality of learning [103]. Collaborative learning, which
involves teamwork, directly engages the learner with the subject matter. This allows for better
absorption of the material [104], increases socialization and exposure to different student ideas
which can improve student retention [105], and can lead to an intense level of information
processing that encourages cognitive growth [104]. Contrary to the many benefits of positive
teamwork, student learning is hindered from participating on dysfunctional teams and they often
develop negative opinions of the value of teamwork [106].
Researchers find that measures of team effectiveness are concerned with two aspects:
task performance effectiveness and measures of team member affectiveness (e.g. satisfaction,

109
participation, and willingness to continue to work together) [42, 107]. A major team-related
factor that can affect project performance and the effectiveness of a team is the interaction of
individual personalities. Other factors affecting the project performance include team
communication, information sharing, cooperation, and coordination [81, 82]. One of the main
factors contributing to poor performance is project team composition [76]. This suggests that
careful consideration in the formation of teams is important.
Teamwork is different from project management in that it focuses on team formation as
well as team member attitudes and behaviors; not just on the successful accomplishment of the
project [108]. There are many factors to consider when forming teams, and their impact on team
composition has been widely studied. Educators use many criteria to form teams such as gender,
race, prior class or work experience, personality, problem solving style, and/or grade point
average and have developed multiple guidelines for assigning people to teams [109]. Within the
field of Software Engineering, some of the factors include the effects of personality composition
[14, 84] team member abilities [86], team roles [88], diversity [96], shared mental models [76],
and team member satisfaction [76]. Chan et al. [75] suggests that soft skills are the primary
factor that should be considered for achieving good project performance. They argue that higher
levels of soft skills within the team facilitate the application development skills and domain
knowledge skills necessary to achieve good project performance. In the spirit of this study, our
work has produced new knowledge by considering a soft skill that Chan et al did not interrogate
(social sensitivity) and investigating how it affects the team performance.
Social Sensitivity (SS) is the ability to correctly understand the feelings and viewpoints
of people [39]. Salovey and Mayer [41] view social sensitivity as an element of emotional
intelligence and identify some of the characteristics of socially intelligent people which include

110
the ability to admit mistakes, to accept others for who they are, to enhance other’s moods, to be
social problem solvers, to be flexible thinkers, and to have an interest in the world at large. They
also recognize that the appraisal and expression of emotion often takes place on a nonverbal
level. The ability to perceive nonverbal expression ensures smoother interpersonal cooperation.
By perceiving, empathizing, and then responding appropriately, people experience greater
satisfaction, more positive emotions, and lower stress. Such positive emotions aid in creative
thinking and enable flexibility in arriving at alternatives to problems. Sternberg et al., identified
additional behaviors reflecting SS: thinks before speaking and doing; displays curiosity; does not
make snap judgments; makes fair judgments; assesses well the relevance of information to the
problem at hand; and is frank and honest with self and others [95]. Kosmitzki et al., noted
important characteristics include being good at dealing with people; has extensive knowledge of
rules and norms in human relations; is good at taking the perspective of other people; adapts well
in social situations; is warm and caring; and is open to new experiences, ideas, and values [110].
These characteristics suggest that high levels of SS could be a benefit for teams.
Every person has a certain level of SS, but there is evidence that people who choose
technical careers have less of it on average than the general population [92]. More specifically,
Baron-Cohen et al. [92] provide evidence that engineers, mathematicians, physicists, and
computer scientists are typically less socially sensitive than their peers in the humanities, arts,
and social sciences. This suggests that people in these technical disciplines have more difficulty
decoding what others are thinking and feeling. Although this research did not address teams
specifically, it suggests to us that teams of technical people may be challenged in the area of
social sensitivity. Computer professionals and engineers are stereotypically viewed as introverted
independent specialists who find it exceptionally difficult to work in teams. The observation

111
made by Baron-Cohen et al. [92] may explain why computer professionals and engineers find
team skills difficult. This finding especially aroused our interest in studying SS and its effects on
team performance.
A major inspiration for our study comes from the work of Woolley et al. [80] whose
study established a correlation between SS and effective teamwork. They describe a collective
intelligence that predicts group performance and is grounded in how well groups interact and
work together. In other words, team performance was not driven by the intelligence of the
individuals on the team, but rather by collaborative groups who conversed easily and contributed
equally. In particular, groups whose members had higher levels of SS were more collectively
intelligent. They found that neither the average intelligence of the group members nor the
intelligence of the smartest member played much of a role in the team performance. Woolley
stated that the groups where the conversation was more evenly distributed were more
collectively intelligent and had better performance on the tasks. The tasks (e.g. brainstorming,
puzzle solving, negotiating, decision making, and typing) in their study were short-term
contrived tasks requiring hours, rather than months, to complete. Thus, those team members had
little opportunity to develop longer-term working patterns and problems. Our study extends this
research by interrogating the effects of SS on teams that worked together for longer durations—
the better part of an academic semester—and produced a complex series of deliverables during
that time. In many ways our study closely approximates a real working environment.
In order to proceed with our study, we needed an accurate test to determine an
individual’s level of social sensitivity. There are several methods for testing social sensitivity.
The one we chose to use is referred to as the “Reading the Mind in the Eyes” test which was
created and validated by Baron-Cohen et al. [92]. This test gauges the accuracy of individuals in

112
judging someone’s emotional state by looking at their eyes. An individual is presented with a
series of 36 photographs of the eye-area of actors. For each photograph, the individuals are asked
to choose which of four adjectives best-describes how the person in the photograph is feeling.
This test was originally developed to measure an ‘advanced theory of mind’ in adults, which is
the ability to identify mental states in oneself or another person and it has been found to have
test-retest reliability [93]. Alternative techniques for measuring social sensitivity, such as the
George Washington Social Intelligence Test [94] and the Vineland Social Maturity Scale [77]
were rejected due to reported inaccuracies or the inclusion of factors irrelevant to our research
[90, 95].
As mentioned in earlier, the researchers of this study also investigated if SS impacts
specific team process activities, and if so, which activities are impacted more than the others.
There are many team process performance activities to consider and their impact on team
effectiveness has been widely studied [111]. The activities we believe were most pertinent to our
project goals consisted of brainstorming, dependability, focusing on tasks, sharing responsibility,
performance, research and information sharing, questioning, discussing, listening, and teamwork,
and are briefly described as follows.
a) Brainstorming [112] is a technique used by groups or individuals to help identify
opportunities and challenges, solve problems, and generate ideas.
b) Being Dependable is defined as being trustworthy [113]. A dependable person shows
reliability, responsibility, and believability [114].

113
c) Focusing on Tasks refers to how well a team member stays focused on the task at hand
and gets work done. It refers to a team member who is self-directed and does not need
other team members to remind in order to get things done.
d) Sharing Responsibility refers to how good a team member is at doing their fair share of
the work. All team members must work together to maximize team performance and a
team member’s productivity can be negatively affected if they are over-burdened with
tasks.
e) Performance quality refers to the accuracy or precision of output [115]. Low quality
performance by one individual can have serious consequences on the team’s product (e.g.
causing the need for extensive rework) and team effectiveness (e.g. team member
frustration).
f) Research and Information Sharing refers to how well a team member gathers research,
shares useful ideas and defends or rethinks ideas.
g) Communication [116] is essential to effective teamwork and involves Questioning,
Discussing, and Listening. Questioning is important to clarify meanings and to
understand the rest of the team members. Discussing ideas is important to the interchange
of information. Team members also need to listen to each other in order to hear and
consider their team members ideas and develop mutual knowledge.
h) Teamwork is composed of communication, collaboration, cooperation, and compromise.
Good teamwork requires that team members cooperate with each other, consider others
feelings and needs, and offer to help each other out. Collaboration refers to working
together and sharing responsibility. Compromise is important so that team members

114
avoid unnecessary arguing over details that may cause the team to lose focus on the main
objectives.
These activities are common team processes used to achieve project objectives. In
addition to analyzing overall team performance and satisfaction, we also analyzed the level of
impact SS has on these team processes in order to better understand the impact that social
sensitivity has on team performance.
6.2.3. Study design
This study was designed to analyze the relationship between the SS of student teams and
the quality of work in computer science team projects. We investigate whether the student teams
with higher average SS were positively correlated with their actual performance on the project as
measured by grades. This study also analyzed the relationship between SS of individual students
and some of the common process activities in teamwork as measured by averaged scores given
to an individual by their teammates.
A randomized experimental design was used in the study in which participants were
tested to determine their SS scores and were then randomly assigned to teams of three
participants each. Each team worked to complete a major semester-long project on an ethical
issue related to current computer technology in society. The project consisted of four
deliverables: three written deliverables and one team presentation. Grades were collected for
each deliverable. The team members completed self and peer evaluations after each of the
written deliverables and completed a post-survey at the end of the project. The details of the
study are provided in the following subsections.

115
6.2.3.1. Study goals and hypotheses
The following hypotheses were formulated:
Hypothesis 1: Student teams with higher average social sensitivity scores perform
significantly better on the project.
Hypothesis 2: Students with higher social sensitivity scores are perceived, by their peers,
to perform better on each team process activity (e.g., brainstorming, dependability, etc.).
Hypothesis 3: Student teams with higher social sensitivity scores have significantly
higher levels of team member satisfaction.
6.2.3.2. Independent and dependent variables
The experiment manipulated the following independent variable:
a) Social Sensitivity Score: Each student participant completed the “Reading the
Mind in the Eyes” test [92] in order to determine their individual social
sensitivity score.
The following dependent variables were measured:
a) Team Performance: This measure includes the total points earned by each
team—the sum of scores on four project deliverables submitted throughout
the semester.
b) Teamwork Activities: These activities include: Brainstorming, Dependability,
Discussing, Focusing on Tasks, Listening, Performance, Questioning,
Research and Information Sharing, Sharing Responsibility, and Teamwork.
The measures include the average of the peer evaluation scores that an

116
individual received from their team members for each of the ten different
teamwork activities.
c) Team member satisfaction: This measure includes each individual’s level of
satisfaction with their team on the project at the end of project.
6.2.3.3. Participating subjects
Out of the 98 graduate and undergraduate computer science and management of
information systems students enrolled in the Social Implications of Computing course, 76
students chose to participate in the study. The goals of this course are to raise awareness of real
world ethical issues involving computing and to help the students understand different methods
used to understand, analyze and respond too many of the ethical dilemmas involving computer
technologies. The participating subjects (17 out of 18 females and 59 out of 80 males) worked
together in teams on a project involving a multi-vocal response to an ethical issue related to the
world of computer science and technology.
6.2.3.4. Artifacts
The major course project consisted of four deliverables: a project proposal, an interim
report, a final report, and a final project presentation based on computer-related ethical topics.
Each team chose a different ethical issue (such as privacy related to biometrics or social
networking) and met throughout the semester on their selected topic in order to produce these
deliverables. The main idea was to have each member of the group focus on the viewpoints of
one of the issue’s stakeholders and then, as a group, discuss the views that these diverse
stakeholders may have on the ethical question. The team was also tasked with tracing the
consequences of alternative actions to their logical conclusions and then evaluating the impact
these actions would have on the stakeholders. This was done to help the team members gain an

117
understanding of perspectives other than their own and to produce artifacts that contained ideas
that would not have been articulated by working independently.
6.2.3.5. Experimental procedure
The study steps are described as follows:
a) Step 1 – Test Subjects for Social Sensitivity: At the beginning of the semester, the
“Reading the Mind in the Eyes” test [92] was administered to measure each subject’s SS. To
ensure that the subjects had a clear understanding of the adjectives used in the test, a glossary
was provided that contained a definition and sample sentence for each of the emotional state
choices. The glossary basis was provided by the work of Baron-Cohen et al. [92]. The
students were encouraged to read through the glossary prior to the test and to refer to it as
needed during the test. The survey was administered online, the responses were analyzed for
completeness and individual SS scores were assigned.
b) Step 2 – Forming Student Teams: Thirty-four teams were formed by randomly
assigning three students to each team. At the end of the semester 33 teams still had three
students each and one team had two students, due to one student dropping the course.
c) Step 3 – Actualizing Team Projects: The students worked in teams on specific
semester-long projects where each team produced a project proposal (PP), an interim report
(IR), a final report (FR), and a final presentation (FP). Most groups chose a topic from a list
of ideas provided by the instructor, although students could pursue any topic that was
approved by the instructor. After the project was approved, the teams performed the
necessary research to write a project proposal. The proposal required them to articulate
ethical questions that they planned to investigate, justify the questions’ importance, identify
major stakeholders and ethical values, specify their research methods, and plan the project.

118
Half way through the semester, each team submitted an interim progress report that described
the project goal, objectives, and scope, research methods, evidence to support ethical
viewpoints, and potential stakeholder actions. Near the semester’s end, each team gave an
oral presentation on their project and submitted a final written report which strengthened
viewpoints from the interim report, applied ethical tests to the potential stakeholder actions,
and evaluated the feasibility of these actions.
d) Step 4 – Evaluating Team Projects: Each deliverable was scored using detailed
rubrics to structure the grading. All grading was done by the same researcher (who was not
the instructor) and all team members received the same score for each assignment. The team
performance (i.e., the total team score) was measured by summing each team’s score from
all four deliverables.
e) Step 5 – Peer-Self Evaluations: After each of the written deliverables, the student
participants completed an evaluation for themselves and for each of their team members.
These evaluations were performed by each student outside of the classroom. This allowed for
more privacy, decreasing the chances that fellow students would see how others filled out the
evaluation and allowing the students to be more honest in the assessment of their teammates.
It also allowed the students more time to fill out the evaluation and be more thoughtful and
complete in their assessments. Each participant rated the quality of each team member’s
participation (including self-participation) on 10 candidate activities of an effective team as
described in Section 2. Participants rated each of the 10 activities on a 5-point Likert scale (4
–Excellent, 3 – Good, 2 – Average, 1 – Poor, and 0 – Fail) and provided comments to justify
the ratings.

119
f) Step 6 – Post-Study Survey: At the end of the semester, a 19 question survey was
administered to the students to collect data regarding the self-perceived effectiveness of each
team including their level of satisfaction, whether members felt valued, whether effective
feedback occurred among team members among other questions.
6.2.3.6. Data collection and evaluation criterion
Because this study investigates the impact of SS on team performance, only teams that
had at least two team members consenting to participate in the study were included in our
analysis; and only the consenting team member’s SS scores, team performance scores, and peer
evaluations were collected. After this elimination process, 28 out of 34 teams remained in the
study.
Individual student SS test scores for each of the 76 participating subjects are shown in
Figure 13. Most subjects scored in the range of 19 to 25, with the SS scores ranging from a
minimum of 9 to a maximum of 32 out of a maximum score of 36 correct.
Although both self and peer evaluations were collected for each consenting participant,
only the peer evaluations were used so that we could understand how a team member is
perceived by their peers. Our reason for only using peer evaluations is that individuals are less
accurate at judging themselves as opposed to judging their peers [117]. Because evaluations were
collected after each written deliverable (PP, IR, FR), each participant had three ratings for each
teamwork activity from each team. Using the peer assessment data (not self-assessment data),
average scores (on a scale of 0 to 4) received by each participant for each of the ten activities
(e.g. brainstorming, dependability, etc.) were calculated. We then analyzed the correlation
between the individual SS scores (as shown in Figure 26) and the scores the individual received
on each activity.

120
Figure 26. Individual social sensitivity scores
6.2.4. Data analysis and results
This section provides analysis of the quantitative data that includes student’s SS scores,
their team’s project performance, and their individual peer-rating on each of the ten team
activities. This section is organized around the three hypotheses presented in Section 2.3.2.3.1.
An alpha value of 0.05 was used for all statistical analysis and r2 value of 0.30 was used for
correlations. The preliminary results on hypothesis 1 have been reported earlier [118]. This paper

121
details the results for the entire three hypotheses and combines the results across all hypotheses
to draw conclusions.
6.2.4.1. Analysis of the effect of social sensitivity (SS) on team’s project performance
This section analyzes the connection between the student’s SS and their performance on
the team project. Individual SS scores were combined into one average team SS score. The
performance of each team (i.e., total team score), was calculated by totaling the scores of the
four deliverables. This analysis was performed for each of the 28 teams.
To test hypothesis 1, we ran a linear regression test to see whether the average SS scores
of a team were positively correlated to the team’s performance. The results show that the team
SS score had a significant positive correlation with the total team score (p =0.001; Pearson’s R =
0.383; r2 = 0.16). We also analyzed the relationship between individual SS scores (shown in
Figure 1) and team performance and found a significant positive correlation (p =0.009; Pearson’s
R = 0.297; r2 = 0.09). Furthermore, we analyzed whether the team SS scores were correlated
with the team performance on each of the four deliverables. The results showed that the team SS
scores had a strong and significant positive correlation with their performance on the project
proposal (p=0.004), interim report (p=0.003), and final report (p=0.05). The result, however, did
not show a significant correlation between teams’ average SS and performance on the final
presentation (p=0.382). Therefore, based on these results, we show that teams with higher
average SS performed significantly better on their project.
6.2.4.2. Analysis of the effect of social sensitivity (SS) on performance activities
Results of the significant correlation between SS and team performance encouraged us to
look deeper into possible connections between SS and the activities that are often performed by

122
teams. This section analyzes the connection between the student’s SS score and their
performance on each of the ten team performance activities.
In order to identify the aspects of the team process that were positively affected by SS,
we analyzed the teammate’s perceptions of their other team members. As stated previously, after
each written deliverable, the participants evaluated the individual performance of each team
member on 10 common process activities that could have affected team work. The peer ratings
were averaged across all deliverables for each category (shown in Figure 27). This procedure
was performed for each of the 76 individuals participating in the study.
Figure 27. Aggregation of category rank data
To test hypothesis 2, we ran bivariate correlation analysis tests to see whether the
individual SS scores were positively correlated with each of the averaged rankings of the
individual performance of each activity.

123
Overall, the results show a significant positive correlation with eight of the ten
performance activities. The correlations between individual SS and each of the other team
performance activities are shown in Figure 28 and our major observations are summarized as
follows:
a) Of all ten process activities, performance had the most significant correlation
indicating that people with higher individual SS were perceived as producing high
quality work.
b) The other individual process activities that showed a significant positive
correlation with SS included brainstorming, dependability, discussing, focusing
on tasks, sharing responsibility, and teamwork. These results are reflected on in
Section 6.
c) The results did not show a significant correlation between individual SS and
either questioning (p =0.390; Pearson’s R = 0.588; r2 = 0.35) or listening
(p=0.346) (p =0.346; Pearson’s R = 0.674; r2 = 0.45). This means that team
members were perceived as being equally good or bad at questioning and
listening, regardless of an individual’s level of SS.

124
Figure 28. Correlation between individual social sensitivity and team performance activities
6.2.4.3. Effect of SS on team member satisfaction and viability
Although task performance effectiveness is obviously important to overall team
effectiveness, researchers also recognize the importance of team member satisfaction to team
effectiveness. We wanted to determine what type of correlation, if any, there was between a
team’s average SS and team member satisfaction with their other team members.
The students were asked to rank how satisfied they were with their team members (Step
6) on a 5-point Likert scale. To test hypothesis 3, we ran a linear regression test to see whether
the average SS scores of a team were positively correlated to the how satisfied team members
were with the other members of the team. The results showed that the team SS scores had a
strong and significant positive correlation with the satisfaction with individual team members

125
within the teams (p =0.028; Pearson’s R = 0.679; r2 = 0.46). In other words, the higher the level
of the average team SS, the more team members were satisfied with their other team members.
There was not a significant correlation between individual SS and team member satisfaction.
This implies that having a higher SS score does not mean that you are more satisfied with your
team members; however, the fact that teams with higher average SS are more satisfied means
that these teams are more likely to participate and continue to work together in the future.
6.2.5. Threat to validity
Although the results of this study are encouraging, there are certain threats to its validity.
One threat is language proficiency. Approximately fifty percent of the students in the course are
international students. Even though each of these students had passed an English proficiency
exam, some may have struggled with the language. To improve construct validity in the
“Reading the Mind in the Eyes” test, a glossary was provided that contained a definition and
sample sentence for each of the word selection choices used in the test. Students were
encouraged to read through the glossary before they took the test and refer to it as necessary
during the test. However, because the students were not supervised while taking the test, we do
not know how extensively the glossary was used. Feedback from students suggests that some
groups struggled with language barriers during the semester as well, which could be a
confounding factor and hinder success.
Another threat relates to the peer evaluations and perceived pressure for conformity.
Although the peer evaluations were performed outside of the classroom to reduce the pressure
the students may feel by possibly having their evaluations viewed by other students, some
students could have still felt the need to give favorable ratings to their team members, whether
these ratings were warranted or not.

126
6.2.6. Discussion of results
Our fundamental finding is that SS is a good predictor of team performance in carrying
out major student team projects with complex tasks and multiple deliverables over long periods
of time. This extends previous research that showed that SS had high impact on teams
accomplishing well defined, short-term, relatively simple tasks. Task complexity is an important
factor in team performance because the difficulty of tasks can impact the success of the team
[119]. Complex tasks within large projects have many opportunities for errors and they can be
hard to identify. Stressful environments can easily be created by these types of projects and can
hinder team performance (e.g. impair decision making, decrease speed and accuracy of task
performance) by adversely affecting team coordination and ability to engage in team activities.
These difficulties can ultimately discourage a team. The effects of project duration on team
performance comes into play as team members become more intertwined and interdependent, the
impact of one member’s lapse can disrupt the entire team’s performance.
Another interesting finding in our study is that the study supports Baron-Cohen’s
assertion that engineers, mathematicians, physicists, and computer scientists are, generally, less
socially sensitive. All participants in our survey are majoring in scientific or technical
disciplines and their mean SS score of 22.59 was lower than the original general population
sample mean SS score of 26.2 of Baron-Cohen et al [92]. This suggests that these students find
it more difficult to perceive and understand the feelings and viewpoints of others. An awareness
of this can help educators better recognize possible reasons behind team difficulties and help
students focus on techniques for managing that social deficit.
Not only do our findings speak to the importance of SS on the effectiveness of team
performance, we also found that SS is generally a good predictor of the effectiveness of team

127
process performance activities (e.g. brainstorming, dependability, focusing on tasks, sharing
responsibility, performance, research and information sharing, questioning, discussing, listening,
and teamwork).
Social sensitivity was positively correlated with the brainstorming activity. As described
above, it is well established [96] that a socially sensitive person’s tendency to be a flexible
thinker and their general ability to perceive, empathize, and appropriately respond to team
members may aid in brainstorming. We speculate that by creating a positive climate in which
team members experience greater satisfaction, more positive emotions, and lower stress most
likely aid in creative thinking and enable flexibility in arriving at alternatives to problems.
Socially sensitive individuals were also seen as more dependable. If a team member is
not dependable, they place a burden on the other team members to make up for the missing
production of the undependable team member which can adversely affect the team’s
effectiveness and team member satisfaction [120, 119]. We also speculate that a socially
sensitive individuals ability to admit mistakes, accept others for who they are, to think before
speaking, to make measured and fair judgments, to be frank and honest with others, being warm,
caring and good at dealing with others [96] aid in being considered trustworthy and dependable.
Peers also viewed socially sensitive individuals as very self-directed and responsible in
sharing the work load. Avery et al. [121] state that taking responsibility for one’s own work on a
team is one of the most important factors in ensuring a productive team experience.
Socially sensitive individuals were also seen as producing high quality work, were very
good at sharing ideas and information as well as discussing issues and interacting respectfully
with others, and excelled at consistently collaborating, cooperating and compromising as
necessary to meet goals. This could be because socially sensitive people can recognize and take

128
actions that demonstrate consideration for the feelings and needs of others. This sensitivity
promotes cooperation. Cooperation can enhance communication and information sharing. Also,
this ability to recognize emotions and use this as feedback may also allow them to recognize
problems before they evolve into larger problems and also use this emotional information to
improve team processes.
Researchers have found that high performing teams are interactive groups that share
information to build high levels of trust and responsibility. This is important to overall
knowledge integration and team satisfaction [122]. Social sensitivity can play a positive role in
increasing information sharing and building trust within teams.
Not only did we find that SS is a good predictor of the effectiveness of team performance
(task) effectiveness (one of the two elements of overall team effectiveness), but we also found
that SS is a good predictor of team member satisfaction (part of the other element of overall team
effectiveness. These findings provide compelling insights into the significance that SS plays in
overall team effectiveness and thus shows that SS is an asset for a team.
6.2.7. Conclusion and future work
Our results establish that both task performance effectiveness and affective measures of a
team are positively correlated with the SS of members. This is valuable knowledge for managers
and educators. Although we recognize that teams need members with the correct skill set and
knowledge, by using SS as an additional input, more effective teams can be composed.
Using quantitative data related to work in teams, our work demonstrates correlations
between SS and performance on team processes. These correlations tempt us to assert that high
SS causes high performance. We expect that our future work with qualitative analysis will
support this connection. We know that some groups faced interpersonal challenges and we plan

129
to investigate whether such challenges were better-overcome in teams with socially-sensitive
individuals.
Assuming that SS is a contributing factor rather than simply correlated with team success,
then this type of research raises many exciting questions of interest to people across academia.
How much SS is needed for success? Can just one socially sensitive team member make a
difference? Can SS be learned? Authors such as Anthony Mersino have published techniques for
improving emotional intelligence [98]. If these techniques can be effectively applied to improve
SS, then team performance can also be improved. In any case, it is our hope that a greater
understanding of SS will result in better learning experiences in the college classroom and better
productivity of software engineering teams.

130
CHAPTER VII. IMPORTANCE OF RESULTS
This chapter discusses the importance of the results provided ion Chapter III, Chapter V
and Chapter VI in terms of the overall research hypotheses. This chapter discusses the results
with respect to the goals from Section 1.
The one of the research goals of this dissertation stated in the GQM form was to:
Analyze Software Professional Non-technical Skills
For the purpose of creating a Software Professional Non-technical Skill Taxonomy
From the point of view of educators and employers
An underlying goal of this research was to develop a useful taxonomy of the non-
technical skills required for software engineers so that students, educators, and employers know
the specific non-technical skill competencies necessary to be an effective software engineer.
Non-technical skills are important to the success of projects, but a complete and relevant list
approved by both academics and industry has never been developed until now. To accomplish
this goal, this dissertation used information found during a literature review and further refined
by a focus group of experts in the field to develop a non-technical skills taxonomy that can be
used by software developers, educators, and industry to identity the non-technical skills required
by software engineers and software developers that are necessary to have in order to build high-
quality software.
131
Based on evidence gathered from the systematic literature review (Chapter III) and, using
a Delphi method for decision making, the results of two rounds of questionnaires via survey
format generated by a focus group of experts in the software industry, a Non-Technical Skills
Taxonomy for Software Professionals was created and validated.
Another of the research goals of this dissertation stated in the GQM form was to:
Develop and validate a software development behavioral marker system
for the purpose of measuring the non-technical skills
in the context of software development project team members
An underlying goal of this research was to develop a useful tool that could be easily used
by managers, team leaders, etc. responsible for the development of these skills, to objectively
and consistently measure their employee’s non-technical skills. The management of software
developer’s non-technical skills is particularly important to today’s teams because more and
more industries are using Agile methodologies which rely less on documentation and more on
people. Professional software organizations feel that these skills need to be tracked and feedback
provided so that software development team project members can improve, there are currently no
tools available to assist with this task. To accomplish this goal, this dissertation used information
found during a literature review to develop a behavioral marker system for software developers.
It also used the non-technical skills taxonomy developed in Chapter III. Based on these results,
studies were then performed to refine and NTSA tool and ultimately to validate the tool for eight
of the non-technical skills identified as most important to software developers. Now individuals
responsible for measurement and development of the non-technical skills of their software
132
development teams have a tool that can be used across projects determine areas of strength and
areas that need improvement to provide objective feedback. A tool, such as the NTSA, provides
a mechanism to not only improve a team and by extension the software that they produce.
The last of the research goals of this dissertation stated in the GQM form was to:
Analyze Social Sensitivity of Software Professionals
For the purpose of evaluation
With respect to project performance
Although social sensitivity is not one of the non-technical skills deemed most important
non-technical skills for software developers by academics and industry experts, I believe that this
is because not many individuals are aware of the potential this skill has in improving team
performance and ultimately high quality software and project success. An underlying goal of
this research was to investigate this skill and to identify its impact on team performance. To
accomplish this goal, studies were performed to analyze the relationship between social
sensitivity of student teams and the quality of their work. It also looked at whether student teams
with higher average levels of social sensitivity were positively correlated with their actual
performance on projects as well as team member satisfaction which is important to the future
productivity of teams. Lastly, it looked even deeper at impact that social sensitivity had on teams
by looking at the actual team processes such as brainstorming, dependability, focusing on tasks,
sharing responsibility, performance, research and information sharing, questioning, discussing,
listening, and teamwork.
Based on the results of the studies, it was found that social sensitivity was a good
predictor of team performance carrying out major student team projects with complex tasks and

133
multiple deliverables over long periods of time. The results also establish that both task
performance effectiveness and affective measures (team member satisfaction) were positively
correlated with the social sensitivity team members. This is valuable knowledge for managers
and educators. Although, it is recognized that teams need members with the correct skill set and
knowledge, by using social sensitivity as an additional input, more effective teams can be
composed.

134
CHAPTER VIII. CONCLUSION
This chapter discusses the contribution of this work to the software engineering research
and practice community. This chapter also provides a summary of my dissertation work.
8.1. Contribution to research and practice communities
This work brought together experts in industry and academia to create a comprehensive
taxonomy of non-technical skills that should be possessed by software professionals and
determined which of these non-technical skills are most essential to software developers. This
work has then created and evaluated a tool that can be used to rate the quality of many of these
non-technical skills. Lastly, this work investigated a non-technical skill that has not been as
highly regarded as other non-technical skills; however has a very positive impact on team and
project performance. This work will benefit researchers, educators, and industry professionals in
identifying relevant non-technical skills to research, and to provide focus on improving the non-
technical skills in software professionals that are so important to software project success.
For researchers, this work can serve as a starting point for future research into improving the
relevant non-technical skills of software professionals. They may further refine desired
behaviors and better identify the non-desired behaviors of these skills. Also researchers will be
motivated to use this taxonomy and behavioral marker system to investigate industry and student
teams in different development environments and report the results as case studies or surveys.
For educators, this work can assist them in developing the non-technical skills of students
who will be our future software professionals. First, it has never been clear which non-technical
skills are important to future software professionals – this has now been addressed and this

135
work’s taxonomy provides a complete picture so students and educators know what is priority.
Developing a student’s technical skills is often an educator’s primary focus. Technical skills are
obviously important to the student and the technical skill level of a student is easy to evaluate
through grades. However, even though non-technical skills are just as important to a software
development project, educators may not focus on the development of these skills because non-
technical skills have not been so easy to evaluate. Now educators, who expect their students to
work together in teams, have a tool to evaluate the quality of their student’s non-technical skills.
For industry, this work provides a method for managers to measure and manage the non-
technical skills of their software professionals. Industry can use the non-technical skills
taxonomy to identify the non-technical skills they feel are most relevant to their organizations.
The NTSA then provides a common language with which to understand and communicate about
non-technical skills important to software professionals. It also provides an easy and consistent
method for managers to objectively measure the non-technical skills of their employees to
determine if their non-technical skills are adequate or if they need improvement. If training
programs are devised to improve these non-technical skills, improvement can now be measured.
Feedback can be provided to the team members so that they could improve their performance.
Also, future research to expand the set of validated non-technical skills and further improve the
tools usability will benefit software project managers and software development organizations.
8.2. Summary
This dissertation work started with four goals: develop a useful non-technical skills
taxonomy; develop a behavioral marker system for software developers and the non-technical
skills taxonomy; validate the software developer behavioral marker system; and investigate
specifically the effect of social sensitivity on team performance. The literature clearly indicates

136
that effective non-technical skills are critical to software projects. The literature also is clear that
there are no current methods for software managers to measure and thus manage these non-
technical skills. The author used a combination of literature review, focus groups, and inter-rater
reliability testing to identify the nontechnical skills, develop a non-technical skills measurement
tool (NTSA), and validate said tool. More precisely, this dissertation developed a non-technical
skills taxonomy for software professional, developed a behavioral marker system for software
developers to enable the rating of software developers non-technical skills, validated this
behavioral marker system and investigate the effects of social sensitivity on team performance.
The author believes that this tool can be used to effectively evaluate the necessary non-technical
skills of software professionals which can contribute to improved software project performance.
The author also believes that the social sensitivity of individuals working on teams that develop
software artifacts should be more strongly considered as critical to improved software project
performance.
8.3. Publications
This section lists the publications that have resulted from this dissertation work:
Refereed Conferences (in reverse chronological order)
ICER’12 Bender, L., Walia, G., Kambhampaty, K., Nygard, K. E., and Nygard, T.
E. "Social Sensitivity Correlations with the Effectiveness of Team Process
Performance: An Empirical Study" Proceedings of the 8th International
Conference on Computing Educational Research. September 10-12, 2012
Auckland, New Zealand. pp. 39-46.
FECS’12 Bender, L., Walia, G., Kambhampaty, K., Nygard, K. E., and Nygard, T.
E. "Strategies for Teaching Ideation and Ethics in Computer Science
Classroom" Proceedings of the 8th International Conference on Frontiers
in Education: Computer Science and Computer Engineering. July 16-19,
2012 Nevada, USA.
SIGCSE’12 Bender, L., Walia, G., Kambhampaty, K. , Nygard, K. E., and Nygard, T.
E. “Social Sensitivity and Classroom Team Projects: An Empirical

137
Investigation,” Proceedings of the 43rd ACM Technical Symposium on
Computer Science Education. February 29 – March 3. Teaching, Learning,
and Collaborating. Raleigh, North Carolina, USA.
FECS’11 Nygard, K. E., Bender, L.*, Walia, G., Kong, J., Gagneja, K., and
LeNoue, M. "Collaboration Using Social Networks for Team Projects"
Proceedings of the 7th International Conference on Frontiers in Education:
Computer Science and Computer Engineering. July 18-21, FECS’ 2011
Nevada, USA.
8.4. Future research directions
My future research tasks include replicating the study performed at the University of
Helsinki to validate the behavioral marker system (NTSA) in a professional development
environment. This step will help me understand if the ratings of student software development
teams are consistent with the ratings of software development teams in professional
environments. I would also like to perform some empirical studies to investigate if the tool is
can be used to consistently evaluate individual skills as well as team skills. This would make the
tool more even more valuable in that managers would only have to use one tool. I would like to
perform studies to investigate if positive evaluations of non-technical skills correspond with what
aspect of software development team performance. I would like to test the tool further by
evaluating team and individual non-technical skills have training intervention has been applied.
Currently, the tool is in a spreadsheet format. I would like to improve the usability of the tool
even further by moving it to mobile devices such as a tablet or smart phone and providing
features that I believe would make the tool even easier to use. I would like to test if this tool can
be used by students as a peer project evaluation tool. This could provide an effective way to
train students on the non-technical skills they need to possess by having them systematically
learn what skills are important, gain a defined understanding of the skills by learning a definition
that applies to software professionals in the field as well as what are examples of good and bad

138
behaviors of these skills, and then using what they have learned to evaluate another – preferably
while a project is in action, which would further instill the relevancy of these skills to a project.
Then I would like to perform that same study in industry.
I would also like to expand the number of skills that can be used in the NTSA tool by
further researching examples of good and poor behavior for the other identified non-technical
skills that should be possessed by software professionals. This includes improving the
behavioral examples of problem solving (which did not pass the inter-rater reliability test). This
would further expand the value of the tool to educators and industry.
Lastly, there are many opportunities for future research on social sensitivity within the
computing community. This dissertation only studied student teams. I want to know if the same
correlations would occur in industry with computing professionals. There are also questions
such as: how much social sensitivity is needed for success; can just one socially sensitive team
member make a difference; can social sensitivity be learned and, if so, these techniques can be
effectively applied to improve social sensitivity, then team performance can also be improved. In
any case, it is my hope that a greater understanding of social sensitivity will result in better
learning experiences in the college classroom and better productivity of software engineering
teams.

139
REFERENCES
1. B.L. DosSantos, and S.T. Hawk. “Differences in analyst’s attitudes towards information
systems development: evidence and implications.” Information & Management, vol. 14, pp.
31-41, 1988.
2. M.A. West. Effective teamwork: practical lessons from organizational research. Malden,
MA: Wiley-Blackwell, 2004, pp. 9-14.
3. G. Matturro. “Soft Skills in Software Engineering: A Study of Its Demand by Software
Companies in Uruguay.” IEEE, pp. 133-136, 2013.
4. J.M. Beaver and G.A. Schiavone. “The Effects of Development Team Skill on Software
Product Quality.” ACM SIGSOFT Software Engineering Notes, vol. 31, number 3, pp. 1-5,
May 2006.
5. F. Ahmed, L.F. Capretz, S. Bouktif, and P. Campbell. “Soft Skills and Software
Development: A Reflection from Software Industry.” International Journal of Information
Processing and Management(IJIPM), vol. 4, number 3, pp. 171-191, May 2013.
6. Project Management Institute. A Guide to the Project Management Body of Knowledge
(PMBOK Guide). Newton Square, PA: Project Management Institute, 2008, pp. 215.
7. S. Acuna, N. Juristo, and A.M. Moreno. “Emphasizing Human Capabilities in Software
Development.” IEEE Software, vol. 23, pp. 94-101, 2006.
8. E. Amengual, and A. Mas. “Software Process Improvement through Teamwork
Management,” in Proceedings of the 8th International Conference on Product-Focused
Software Process Improvement, 2007, pp. 108-117.
9. S. Nambisan, and D. Wilemon. “Software Development and New Product Development:
Potentials for Cross-Domain Knowledge Sharing.” IEEE Transactions on Engineering
Management, vol. 47, pp. 211-221, May 2000.
10. R. Solingen. “From Process Improvement to People Improvement: Enabling Learning in
Software Development.” Information and Software Technology, vol. 42, pp. 965-971, 2000.
11. E. Whitworth. “Experience report: the social nature of agile teams,” in Proceedings of the
AGILE 2008 Conference, 2008, pp. 429-435.
12. A. Cockburn, and J. Highsmith. “Agile software development: The people factor.”
Computer, vol. 34, pp. 131-133, 2001.

140
13. I. Evans. Achieving Software Quality through Teamwork. Norwood, MA: Artech House, Inc.,
2004, pp. xv.
14. N. Gorla, and Y. Wah Lam. “Who Should Work With Whom?” Communications of the
ACM, vol. 47, number 6, pp. 79–82, Jun. 2004.
15. A. Abell. Information World Review; Dec 2002; 186; ABI/INFORM Complete pg. 56
16. S.G. Cohen, and D.E. Bailey. “What Makes Teams Work: Group Effectiveness Research
from the Shop Floor to the Executive Suite.” Journal of Management, vol. 23, pp. 239-290,
1997.
17. T.L. Dickonson, and R.M. McIntyre. “A conceptual framework for teamwork measurement”
in Team Performance Assessment and Measurement, eds., M.T. Brannick, E. Salas, and C.
Prince, Ed. Nahwah, NJ: Lawrence Erlbaum Associates, Inc., 1997, pp. 19-44.
18. J.J. Jiang, J. Motwani, and S.T. Margulis. “IS team projects: IS professionals rate six criteria
for assessing effectiveness.” Team Performance Management, vol. 3, pp. 236-242, 1997.
19. O. Hazzan and I. Hadar. “Why and how can human-related measures support software
development processes?” The Journal of Systems and Software, vol. 81, pp. 1248-1252,
2008.
20. J.R. Klinect, P. Murray, A. Merritt, and R. Helmreich. “Line Operations Safety Audit
(LOSA): Definition and operating characteristics,” in Proceedings of the 12th International
Symposium on Aviation Psychology, 2003, pp. 663-668.
21. E.J. Thomas, J.B. Sexton, and R.L. Helmreich. “Translating teamwork behaviours from
aviation to healthcare: development of behavioural markers for neonatal resuscitation.” Qual
Saf Health Care, vol. 13, pp. i57-i64, 2004.
22. R. Flin, P. O’Connor, and M. Crichton. Safety at the sharp end: A guide to non-technical
skills, Burlington, VT: Ashgate Publishing Company, 2008, pp. 264.
23. B. F. Klampfer, R. L. Helmreich, B. Hausler, B. Sexton, G. Fletcher, P. Field, S. Staender, K.
Lauche, P. Dieckmann, and A. Amacher. “Enhancing performance in high risk environments:
Recommendations for the use of behavioral markers.” Behavioral Markers Workshop, 2001,
pp. 10.
24. R. Flin, and L. Martin. “Behavioral Markers for Crew Resource Management: A Review of
Current Practice.” The International Journal of Aviation Psychology, vol. 11, pp. 95–118,
2009.

141
25. P. O’Connor and A. O’Dea. “The U.S. Navy’s aviation safety program: a critical review.”
International Journal of Applied Aviation Studies, vol. 7, pp. 312-328, 2007.
26. R. Flin, L. Martin, K.M. Goeters, H.J. Hormann, R. Amalberti, C. Valot, and H. Nijhuis.
“Development of the NOTECHS (non-technical skills) system for assessing pilots’ CRM
skills.” Human Factors and Aerospace Safety, vol. 3, pp.95-117, 2003.
27. J.A.G. van Avermaete. “NOTECHS: Non-technical skill evaluation in JAR-FCL”, Nationaal
Lucht-en Ruimtevaartlaboratorium, NLR-TP-98518.
28. G. Fletcher, R. Flin, P. McGeorge, R. Glavin, N. Maran and R. Patey. “Development of a
Prototype Behavioural marker System for Anaesthetists’ Non-Technical Skills (ANTS).”
Workpackage 5 Report, Version 1.1., 2003.
29. N. Sevdalis, M. Lyons, A.N. Healey, S. Undre, A. Darzi, and C.A. Vincent. “Observational
Teamwork Assessment for Surgery: Construct Validation with Expert Versus Novice
Raters.” Annals of Surgery, vol. 249, pp. 1047-1051, Jun. 2009.
30. D. Gatfield. “Using simulation to determine a framework for the objective assessment of
competence in maritime crisis management,” in Society for the Advancement of Games and
Simulations in Education and Training (SAGSET) Conference, 2005, Portsmouth, England.
31. W. M. Long. “Development of a Prototype Behavioral Marker System for Assessing and
Training Officers of the Deck,” in The American Society of Naval Engineers (ASNE) Human
Systems Integration Symposium, 2011.
32. Z. Budryk. “More Than a Major.” Internet:
http://www.insidehighered.com/news/2013/04/10/survey-finds-business-executives-arent-
focused-majors-those-they-hire, April 10, 2013 [April 14, 2013].
33. D. Notkin, M. Gorlick, and M. Shaw. “An Assessment of Software Engineering Body of
Knowledge Efforts,” Association for Computing Machinery, Internet:
http://www.acm.org/serving/se_policy/bok_assessment.pdf , May 2000, [Mar. 30, 2011].
34. IFIP.org, “2006 IEEE Computer Society Report To The IFIP General Assembly.” Internet:
http://www.ifip.org/minutes/GA2006/Tab18b-US-IEEE.pdf, 2006, [Mar. 30, 2011].
35. J.G. Rivera-Ibarra, J. Rodriguez-Jacobo, and J.A. Fernandez-Zepeda. “Competency
Framework for Software Engineers,” in 2010 23rd IEEE Conference on Software
Engineering Education and Training (CSEE&T), Mar. 2010, pp. 33-40.

142
36. A. Begel and B. Simon. “Novice software developers, all over again,” in Proceedings of the
Fourth International Workshop on Computing Education Research (ICER08), 2008, pp. 3-
14.
37. M. Devlin and C. Phillips. “Assessing Competency in Undergraduate Software Engineering
Teams,” in IEEE Engineering Education, Universidad Politecnica de Madrid, Apr. 2010, pp.
271-277.
38. D.C. Davis, S.W. Beyerlein, and I.T. Davis. “Development and use of an engineer profile”,
in Proceedings American Society for Engineering Education Conf., American Society for
Engineering Education, Jun. 2005 .
39. S. Greenspan. “Defining childhood social competence.” Advances in Special Education, vol.
3, pp. 1-39, 1981.
40. R.L.Thorndike, and S. Stein, “An Evaluation of the Attempts to Measure Social
Intelligence”, Psychological Bulletin, vol. 34, pp. 275-284, 1937.
41. P. Salovey and J.D. Mayer. “Emotional Intelligence. Imagination, Cognition, and
Personality.” Internet:
http://www.unh.edu/emotional_intelligence/EI%20Assets/Reprints...EI%20Proper/EI1990%
20Emotional%20Intelligence.pdf [Mar. 20, 2011]
42. S. Baron-Cohen, P. Bolton, S. Wheelwright, V. Scahill, L. Short, G. Mead, and A. Smith.
“Autism occurs more often in families of physicists, engineers, and mathematicians”, Autism,
vol. 2, pp. 296-301, 1998.
43. G.S. Walia and J.C.Carver. “A systematic literature review to identify and classify software
requirement errors.” Information and Software Technology, vol. 51, pp. 1087-1109, 2009.
44. H. Welch, “Teaching a Service Course in Software Engineering,” in Proceedings
ASEE/IEEE Frontiers in Education Conference, Oct. 2007.
45. Computer.org. “Guide to the Software Engineering Body of Knowledge (SWEBOK).”
Internet: http://www.computer.org/portal/web/swebok [Mar. 30, 2011]
46. F. Robert, A. Abran, and P. Bourque. “A Technical Review of the Software Construction
Knowledge Area in the SWEBOK Guide (Trial Version 1.0),” STEP 2002, pp. 9, Sep. 2002.
47. T.C. Lethbridge, R.L. LeBlanc Jr., A.E. Kelley Sobel, T.B. Hilburn, and J.L. Diaz-Herrera.
“SE2004: Recommendations for Undergraduate Software Engineering Curricula.” IEEE
Software, vol. 23, pp. 19-25, Nov. 2006.

143
48. J.F. Naveda and S.B. Seidman. “Professional Certification of Software Engineers: The
CSDP Program.” IEEE Software, vol. 22, pp.73-77, Sep. 2005.
49. BLS.gov. “Occupational Employment and Wages 2006”, Internet:
www.bls.gov/news.release/archives/ocwage_05172007.pdf , [Mar. 30, 2011]
50. U. Fuller, B. Keim, D. Fitch, J.C. Little, C. Riedesel, and S. White. “Perspectives on
Developing and Assessing Professional Values in Computing.” SIGCSE Bulletin, vol. 41, pp.
174-194, Jul. 2009.
51. R.T. Turley and J.M. Bieman. “Identifying Essential Competencies of Software Engineers,”
in Proc. Of the 22nd annual ACM computer science conference on Scaling up: meeting the
challenge of complexity in real-world computer applications, 1994, pp. 271-278.
52. R.T. Turley and J.M. Bieman. “Competencies of Exceptional and Non-exceptional Software
Engineers.” Journal of Systems and Software, vol. 28, pp. 19-38, Jan. 1995.
53. D.C. Davis and S.W. Beyerlein. Faculty Guidebook: A Comprehensive Tool for Improving
Faculty Performance, Lisle, IL: Pacific Crest, 2005.
54. R. Sternberg. Wisdom, Intelligence, and Creativity Synthesized, New York, NY: Cambridge
University Press, 2003.
55. S. Rosser. Women, Science, and Society: The Crucial Union, New York, NY: Teacher’s
College Press, 2000.
56. B. Curtis, B. Hefley, and S. Miller. People Capability Maturity Model (P-CMM) Version 2.0,
(Second Edition), [On-line]. Available: www.sei.cmu.edu [Mar. 30, 2011].
57. W.F. Cascio. Costing Human Resources: The Financial Impact of Behavior in
Organizations, (Fourth Edition). Cincinnati, OH: South-Western College Publishing, 2000.
58. W. Cascio, and J. Boudreau. Investing in People: Financial Impact of Human Resource
Initiatives. Upper Saddle River, NJ: FT Press, 2008.
59. J. Fitz-enz. How to Measure Human Resources Management. New York, NY: McGraw-Hill,
1995.
60. J. Fitz-enz. The ROI of Human Capital: Measuring the Economic Value of Employee
Performance, (Second Edition). New York, NY: ANACOM, 2000.
61. J. Holbeche. Aligning Human Resources and Business Strategy. Oxford: Butterworth-
Heinemann, 2001.

144
62. A. Mayo. The Human Value of the Enterprise: Valuing People as Assets – Monitoring,
Measuring, Managing. London: Nicholas Brealey International, 2001.
63. D. Ulrich, “Measuring Human Resources: An Overview of Practice and a Prescription for
Results”, Human Resource Management, vol. 36, pp. 303-320, 1997.
64. A.K. Young and B. Berman, “Adding Value Through Human Resources; Reorienting Human
Resource Measurement to Drive Business Performance”, Human Resource Management, vol.
36, pp. 321-335. 1997.
65. W.S. Humphrey, T.A. Chick, W. Nichols, and M. Pomeroy-Huff, “Team Software Process
(TSP) Body of Knowledge (BOK),” Technical Report, July 2010.
66. Wikipedia. “Validity (statistics).” Internet: http://en.wikipedia.org/wiki/Validity_(statistics)
[Apr. 14, 2013]
67. J. Uebersax. “Statistical Methods for Rater and Diagnostic Agreement” Internet:
http://www.john-uebersax.com/stat/agree.htm [Apr. 14, 2013]
68. J.R. Landis and G. G. Koch. “The measurement of observer agreement for categorical data.”
Biometrics, vol. 33, pp.159-174, 1977.
69. H. Kandeel, and K. Wahbe. “Competncy models for human resource development: case of
Egyptian software industry,” in Managing Information Technology in a Global Environment.
2001 Information Resources Management Association International Conference, 2001, pp.
117-121
70. G. Fletcher, R. Flin, P. McGeorge, R. Glavin, and R. Patey. “Anaesthetists’ Non-Technical
Skills (ANTS): evaluation of a behavioural marker system.” British Journal of Anesthesia,
vol. 90, pp. 580-588, 2003.
71. C.E.Hill, S. Know, B.J Thompson, and E.N. Williams. “A guide to conducting consensual
qualitative research.” The Counseling Psychologist, vol. 25, pp. 207-217, 1997.
72. C.E.Hill, S. Know, B.J Thompson, E.N. Williams, S.A. Hess and N. Landany. “Consensual
qualitative research: an update.” Journal of Counseling Psychology, vol. 52, pp. 196-205,
2005.
73. A. Frankel, R. Gardner, L Maynard, and A. Kelly. “Using the Communication and
Teamwork Skills (CATS) Assessment to Measure Health Care Team Performance.” The
Joint Commission Journal on Quality and Patient Safety, vol. 33, pp. 549-558, Sep. 2007.

145
75. C.L. Chan, J.J. Jiang, and G. Klein. “Team Task Skills as a Facilitator for Application and
Development Skills.” IEEE Transactions On Engineering Management. vol. 55, pp. 434-441,
Aug. 2008.
76. M. Ikonen and J. Kurhila. “Discovering High-Impact Success Factors in Capstone Software
Projects,” in SIGITE’09, 2009, pp. 235-244.
77. V. R. Basili, G. Caldiera, H. D. Rombach, “The Goal Question Metric Approach,”
Technical Report, Department of Computer Science, University of Maryland, 1994,
ftp://ftp.cs.umd.edu/pub/sel/papers/gqm.pdf.
78. D. Smarkusky, R. Dempsey, J. Ludka, and F. de Quillettes. 2005. “Enhancing team
knowledge: instruction vs. experience,” in Proceedings of the 36th
SIGCSE technical
symposium on Computer science education SIGCSE ’05, 2005, pp. 460-464.
79. D. R. Bacon, K.A. Stewart, and W.S. Silver. “Lessons from the Best and Worst Student
Team Experiences: How a Teacher Can Make the Difference.” Journal of Management
Education, vol. 23, pp. 467-488, 1999.
80. A. W. Woolley, C.F. Chabris, A. Pentland, N. Hashmi, and T.W. Malone. “Evidence for a
Collective Intelligence Factor in the Performance of Human Groups.” Science 2010. [On-
line]. vol. 330, pp. 686-688. Available: http://www.chabris.com/Woolley2010a.pdf [Jan 12,
2011].
81. J.H. Bradley and F.J. Hebert. “The effect of personality type on team performance.” Journal
of Management Development. vol. 16, pp. 337-353, 1997
82. S. Faraj and L. Sproull. “Coordinating expertise in software development teams.”
Management Science. vol. 46, pp. 1554-1568, 2000.
83. T.S. Lewis and W.J. Smith. “Creating High Performing Software Engineering Teams: The
Impact of Problem Solving Style Dominance On Group Conflict and Performance.” Journal
of Computing Sciences in Colleges, vol. 24, pp. 121-129, 2008.
84. S. Shen, S.D. Prior, A.S. White, and M. Karamanoglu. “Using Personality Type Differences
to Form Engineering Design Teams.” Engineering Education, vol. 2, pp. 54-66, 2007.
85. M.R. Barrick, G.L. Stewart, M.J. Neubert, and M.K. Mount. “Relating Member Ability and
Personality to Work-Team Processes and Team Effectiveness”, Journal of Applied
Pshchology, vol. 83, pp. 377-391, 1998.
86. R. Felder and R. Brent. “Effective strategies for cooperative learning.” Journal of
Cooperation & Collaboration in College Teaching, vol. 10, pp. 69-75, 2001.

146
87. M. Belbin, Team Roles at Work, Butterworth-Heinemann, Oxford, 1993.
88. G. Beranek, W. Zuser, and T. Grechenig. “Functional Group Roles in Software Engineering
Teams,” in HSSE’05 Proceedings of the 2005 workshop on Human and social factors of
software engineering, 2005, pp. 1-7.
89. Y. Dubinsky, and O. Hazzan, “Using Roles Scheme to Derive Software Project Metrics”,
Journal of Systems Architecture, vol. 52, pp. 693-699, 2006.
90. D. T. Pedrini and B.C. Pedrini. “Vineland Social Maturity Scale Profile.” Internet:
http://www.eric.ed.gov/PDFS/ED079342.pdf, [August 18, 2011]
91. J.E. Mathieu, T.S. Heffner, G.F. Goodwin, E. Salas, and J.A. Cannon-Bowers. “The
Influence of Shared Mental Models on Team Process and Performance.” Journal of Applied
Psychology, vol. 85, pp. 273-283, 2000.
92. S. Baron-Cohen, S. Wheelwright, J. Hill, Y. Raste, and I. Plumb. “The ‘Reading the Mind
in the Eyes’ Test Revised Version: A Study with Normal Adults, and Adults with Asperger
Syndrome or High-functioning Autism.” Child Journal of Psychology and Psychiatry, vol.
42, pp. 241-251, 2001.
93. M.U. Hallerback, T. Lugnegard, F. Hjarthag, and C. Gillberg. “The reading the mind in the
eyes test: test-retest reliability of a Swedish version.” Cognitive neuropsychiatry, vol. 14, pp.
127-143, 2009.
94. R. Strang, “Measures of Social Intelligence.” American Journal of Sociology, vol. 36, pp.
263-269, 1930.
95. R.J. Sternberg. Handbook of intelligence. (2nd edition). Cambridge, U.K.: Cambridge
University Press, 2000, pp. 259-379.
96. V. Pieterse, D. Kourie, and I. Sonnekus. ” Software Engineering Team Diversity and
Performance,” in Proceedings of annual research conference of the South African institute of
computer scientists and information technologists on IT research in developing countries,
2006, pp. 180-186.
97. J. Langan-Fox, C.L. Cooper, and R.J. Klimoski. Research Companion to the Dysfunctional
Workplace: Management Challenges and Symptoms (New Horizons in Management).
Edward Elgar Publishing. Camberly, UK, 2007.
98. A. Mersino. Emotional Intelligence for Project Managers. New York, NY: American
Management Association, 2007.

147
99. C.M. Hsiung. “An experimental investigation into the efficiency of cooperative learning with
consideration of multiple grouping criteria.” European Journal of Engineering Education,
vol. 35, pp. 670-692, 2010.
100. A. Rademacher. “Evaluating the Gap Between the Skills and Abilities of Graduating
Computer Science Students and the Expectation of Industry.” M.S. thesis, North Dakota
State University, Fargo, North Dakota USA, 2012.
101. S. Wuchty, B.F. Jones, and B. Uzzi. “The Increasing Dominance of Teams in Production of
Knowledge.” Science, vol. 316, pp. 1036-1039, 2007.
102. C. Wells. “Teaching teamwork in information systems,” in E. Cohen (Ed.), Challenges of
IT education in the 21st century, Hershey, PA: Idea Publishing Group, 2002, pp.1-24.
103. B.A. Oakley, D.M. Hanna, Z. Kuzmyn, and R.M. Felder. “Best Practices Involving
Teamwork in the Classroom: Results From a Survey of 6435 Engineering Student
Respondents.” IEEE Transactions On Education, vol. 50, pp.266-272, Aug. 2007.
104. L. Springer, M.E. Stanne, and S.S. Donovan. “Effects of small-group learning on
undergraduates in science, mathematics, engineering, and technology.” Review of
Educational Research, vol. 69, pp. 21-51, 1999.
105. R.M. Felder, G.N. Felder, and E.J. Dietz. “A logitudinal study of engineering student
performance and retention v. comparisons with traditionally-taught students.” Journal of
Engineering Education, vol. 87, pp. 469-480, 1998.
106. B.R. Swan, C.S. Magleby, and R. Todd. “A Preliminary Analysis of Factors Affecting
Engineering Design Team Performance,” in Proceedings of the ASEE 1994 Annual Meeting,
1994.
107. J.R. Hackman. “A Normative Model of Work Team Effectiveness.” Technical Report #2,
Research Program on Group Effectiveness, Yale School of Organization and Management,
November, 1983
108. K.A. Smith, and P.K. Imbrie. Teamwork and project management (3rd Ed.). New York,
NY: McGraw-Hill. BEST Series, 2004.
109. C.R. Haller, V.J. Gallagher, T.L. Weldon, and R.M. Felder. “Dynamics of peer education in
cooperative learning workgroups.” Journal of Engineering Education, vol. 89. pp. 285-293,
2000.
110. C. Kosmitzki and O.P. John. “The implicit use of explicit conceptions of social
intelligence.” Personality & Individual Differences, vol. 15, pp. 11-23, 1993.

148
111. J.R. Mesmer-Magnus and L.A. DeChurch. “Information Sharing and Team Performance: A
Meta-Analysis.” Journal of Applied Psychology, vol. 94, pp. 535-546, 2009.
112. A.F. Osborn. Applied Imagination: Principles and Procedures of Creative Problem-solving,
2nd ed. New York, NY: Scribner, 1957.
113. American Heritage Dictionary, Retrieved December 27, 2011 from http://ahdictionary.com/
114. J.C. Maxwell. The 17 Essential Qualities of a Team Player: Becoming the Kind of Person
Every Team Wants. Nashville, TN: Thomas Nelson Inc., 2002.
115. G.D. Jenkins, A. Mitra, N. Gupta, and J.D. Shaw. “Are financial incentives related to
performance? A meta-analytic review of empirical research.” Journal of Applied Psychology,
83, pp. 777-787, 1998.
116. J. Katzenbach. “The myth of top management teams.” Harvard Business Review, vol. 75,
pp. 82-92, 1997.
117. O.P. John and R.W. Robins. “Accuracy and Bias in Self-Perception: Individual Differences
in Self-Enhancement and the Role of Narcissism.” Journal of Personality and Social
Psychology, vol 66, no. 1, pp. 206-219, 1994.
118. L. Bender, G. Walia, K. Kambhampaty, K.E. Nygard, and T.E. Nygard. “Social Sensitivity
and Classroom Team Projects: An Empirical Investigation,” in Proceedings of the 43rd
ACM Technical Symposium on Computer Science Education - SIGCSE 2012: Teaching,
Learning, and Collaborating, 2010.
119. D.E. Conlon, C.J. Meyer and J.M. Nowakowski. “How does organizational justice affect
performance, withdrawal, and couterproductive behavior?” in Handbook of organizational
justice J. Greenberg & J. Colquitt (Eds.), Mahwah, NJ: Erlbaum, 2005, pp. 301-327.
120. A.C. Costa, R.A. Roe, and T. Taillieu. “Trust within teams: The relation with performance
effectiveness.” European Journal of Work and Organization, vol.10, pp. 225-244, 2010.
121. C.M. Avery, M.A. Walker and E.O. Murphy. Teamwork Is An Individual Skill: Getting
Your Work Done When Sharing Responsibility. San Francisco, CA: Berrett-Koehler, 2001.
122. K. Blanchard, A. Randolph, and P. Grazier. Go Team!: Take Your Team to the Next Level,
San Francisco, CA: Berrett-Koehler Publishers, 2005.