Levels of Measurement. The Levels of Measurement l Nominal l Ordinal l Interval l Ratio.
Turkish J Eng Env Sci
(2014) 38: 113 – 125
c⃝ TUBITAK
doi:10.3906/muh-1303-8
Turkish Journal of Engineering & Environmental Sciences
http :// journa l s . tub i tak .gov . t r/eng ineer ing/
Research Article
Measurement of activity concentration levels of radionuclides in soil samples
collected from Bethlehem Province, West Bank, Palestine
Mohammed Mahmud ABU SAMREH1,2, Khalil Mohammed THABAYNEH3,∗,Fatima Waleed KHRAIS4
1Faculty of Science and Technology, Al-Quds University, Jerusalem, Abu-Deis, Palestine2Faculty of Arts and Science, Arab American University of Jenin, Jenin, Palestine
3Faculty of Sciences and Technology, Hebron University, Hebron, Palestine4Ministry of Education, Directorate of Education, Dura, West Bank, Palestine
Received: 13.03.2013 • Accepted/Published Online: 02.09.2014 • Printed: 30.06.2015
Abstract: In this study, we report on the activity concentrations of 238U, 232Th, 40K, and 137Cs in 50 soil samples of
Bethlehem Province, West Bank, Palestine. Gamma-ray spectroscopy was employed to perform the measurements using
an HPGe detector. On one hand, the activity concentrations of natural radionuclides were found to vary from 12.7 to
122.3 Bq kg−1 with an average value of 41.4 Bq kg−1 for 238U, from 2.0 to 32.2 Bq kg−1 with an average value of 19.5
Bq kg−1 for 232Th, and from 12.0 to 183.8 Bq kg−1 with an average value of 113.3 Bq kg−1 for 40K. On the other
hand, the activity concentrations of the artificial 137Cs radionuclide were found between 1.0 and 12.2 Bq kg−1 , with an
average value of 2.8 Bq kg−1 . The variations of the assessed radiological hazard parameters indices Raeq , Dr , Hex ,
and Iγ of natural radionuclides were found to be as follows: 16–148, 7–65, 0.04–0.4, and 0.11–1.00, respectively. The
results were found to be comparable to or lower than similar reported data worldwide. Accordingly, the investigated soil
zones can be considered to have normal levels of natural background radiation.
Key words: Natural radioactivity, activity concentration, hazardous indices, Bethlehem Province
1. Introduction
Gamma radiations emitted from naturally occurring radioactive materials (NORMs) such as uranium-238
(238U), thorium-232 (232Th), and potassium-40 (40K) are generally known as terrestrial background radiation,
the main external source of irradiation of the human body [1]. However, humankind can be exposed to radiation
originating from artificially radioactive sources such as cesium-137 (137Cs) present in the earth’s environment
as a result of nuclear weapon testing or nuclear fallout from nuclear technology [2].
High terrestrial background radiations zones were generally attributed to local geology, location, altitude,
and geochemical effects [2–4]. Thus, the activity concentrations of radionuclides in granite locations were found
to be higher than those of clay, sand stones, and limestone soils [5,6]. Normally, the presence of NORMs in soil
generally originates from the disintegrating rocks that are carried to soil by rain and flows [1–3]. The assessment
of radionuclide activity levels in the environment provides us with essential information about the abundance
of radionuclides in the local environment [7].
Over the past half century, it has been recognized that the presence of NORMs in the environment with
∗Correspondence: [email protected]
113

ABU SAMREH et al./Turkish J Eng Env Sci
activity concentrations higher than the radiological reference levels assigned by the United Nations Scientific
Committee on the Effects of Atomic Radiation (UNSCEAR) is hazardous to living organisms [1]. The de-
termination of uranium and other radionuclide concentrations in geological samples is very important in the
exploration of the natural resources of these element [8]. Tremendous investigations have been made worldwide
to assess activity concentrations of NORMs in soil. This is of great importance for assessing the dose to the
population, which plays a vital rule in exploring the health risks due to radioactivity and paving the road to a
baseline for future changes in environmental radioactivity due to human activities [9].
In Palestine, a few investigations have been performed in the southern part of the West Bank [10–12].
As far as we know, an investigation of radionuclide activity levels and radionuclide distributions in the soil
of Bethlehem Province has not been performed yet. Thus, this study is devoted to reporting the activity
concentration levels of both natural radionuclides (238U, 232Th, 40K) and artificial radionuclides (137Cs) in
soil samples collected from different sites of Bethlehem Province. Such data are essential in establishing baseline
values of radionuclides in the soil of Palestinian territories. Furthermore, the study is aimed at estimating a
group of health hazard indices such as the radium equivalent activity (Raeq), the absorbed dose rate (Dr),
the annual effective dose equivalent (AEDE ), the external radiation hazard index (Hex), the radioactivity level
index (Iγ), and the excess lifetime cancer risk (ELCR).
This type of measurement is of great importance in providing us with a clear picture about the radiation
health hazards due to the presence of radionuclides in Palestinian soils.
2. Experimental
In this study, the gamma-ray spectrometry technique has been employed to determine the activity concentrations
of 238U, 232Th, 40K, and 137Cs radionuclides and the associated radiation hazard levels in 50 soil samples
collected randomly from a total of 24 different sites and locations in Bethlehem Province in West Bank, Palestine,
as shown in the Figure. The site names where samples were collected are marked by ovals.
Figure. On the left, West Bank map including Bethlehem Province (http://looklex.com/e.o/map westbank.htm), and
on the right, map of Bethlehem Province where the investigated soil sites are marked by ovals
(http://vprofile.arij.org/Bethlehem).
114

ABU SAMREH et al./Turkish J Eng Env Sci
2.1. Sample collection and sample processing
The samples were collected randomly during the spring season of 2011. The collection procedures were as follows:
for each sample, the soil position was determined and the ground was cleared of stones, pebbles, vegetation,
and roots. A total of 1.5–2.0 kg of soil material was then collected from a soil position 10 cm below the soil
surface. The collected soil material was placed in a coded polythene bag and sent to the laboratory for activity
measurements. In the laboratory, the samples were first dried in air and then ground into a fine powder of 200
µm in size. After removing foreign materials, the samples were weighed, mixed well, and dried in an oven at 110◦C to ensure material homogeneity [12,13]. The prepared samples were then sealed in 1000-mL dry-weighed
Marinelli beakers and stored for a period of 30 days to assure radioactive secular equilibrium between 226Ra
and 232Th with their daughters [14]. The activity concentration for each sample was measured using an HPGe
gamma spectrometer connected to a coaxial high-purity germanium detector [11].
2.2. Calibration and energy lines
The activity concentrations of 238U, 232Th, 40K, and 137Cs radionuclides in the samples were determined by
well-known standard gamma-ray spectrometry using an HPGe detector (Ortec). The detector has a relative
efficiency of 15% and a resolution of 1.85 keV for the 1332.5 keV 60Co gamma lines and MCA with 8000 channel.
The detector is shielded using three inner concentric shells of lead, cadmium, and copper on all sides to reduce
the background level of the system.
Energy calibration in the energy range of 59.5–1836 keV was attained using standard reference mixed
material 60Co (1173.5 and 1332.5 keV), 241Am (59.5 keV), 226Ra (186.2, 242.0, 295.2, 351.9, and 609.3
keV), 137Cs (661.3 keV), and 88Y (898 and 1836 keV). Beyond 1850 keV, the calibration efficiency curve
was constructed by using different energy peaks of 226Ra in order to cover the energy range from 60 to 2500
keV [11]. The background radiation and the samples were counted between 5 × 10⁴ and 7 × 10⁴ s.
The activity concentrations for 238U were calculated from the mean value of six γ -ray lines obtained
from the photopeaks of 226Ra (186.2 keV), 214Pb (295.2 and 351.9 keV), and 214Bi (609.3, 1120.3, and 1764.8
keV), while the 232Th activity concentrations were calculated from the mean value of four γ -ray lines obtained
from the photopeaks of 212Pb (238.6 keV), 228Ac (338.5 and 911.1 keV), and 208Tl (583.1 keV). The 40K
and 137Cs activity concentrations were measured from their own γ -ray energies of 1461.8 keV and 661.6 keV,
respectively [12–15]. The net count rates under the most prominent photopeaks of radionuclides’ daughter
peaks were calculated by subtracting the respective count rate from the background spectrum obtained for the
same counting time. The activity of the radionuclide was then calculated from the background subtracted area
prominent gamma ray energies [9].
3. Radiometric analysis and assessment
3.1. Activity concentration results
The activity concentration of a certain radionuclide, C , in the soil samples was calculated using the following
equation [11,16].
C(Bqkg−1) =Ca
ε× Ieff ×Ms(1)
115

ABU SAMREH et al./Turkish J Eng Env Sci
HereCa is the net gamma counting rate (counts per second) for a peak at energy E, ε is the detected efficiency
of a specific γ -ray, Ieff is the intensity of the γ -line in radionuclides, andMs is the mass of the soil sample
under consideration measured in kilograms.
3.2. Radiation hazards
3.2.1. Radium equivalent activity
The radium equivalent activity, Raeq , measured in Bq kg−1 , was introduced to identify the uniformity to
radiation exposure. The calculated values of Raeq are generally used to compare the specific activity of
materials containing different amounts of 238U, 232Th, and 40K. Besides, Raeq data can be used to assess
the health hazard effects produced from the activity concentrations of 238U, 232Th, and 40K radionuclides in
soil. The measured values of Raeq were obtained by making use of the following equation [15,17].
Raeq
(Bqkg−1) = AU + 1.43×ATh+ 0.077×Ak (2)
HereAU , ATh , andAK are the average activity concentrations of 238U, 232Th, and 40K, respectively. In
calculating Raeq values, the average activity concentrations of 370 Bq kg−1 , 259 Bq kg−1 , and 4810 Bq kg−1
used for 238U, 232Th, and 40K radionuclides, respectively, were assumed to produce the same gamma dose rate
[18].
3.2.2. Absorbed dose rate in air
The effects of gamma radiation originating from radioactive sources in the environment are generally expressed
in terms of the total gamma radiation absorbed dose rate in air, Dr . The values of Dr in air and 1 m above the
ground level are calculated from the measured activity concentrations of 238U, 232Th, and 40K radionuclides
using the following semiempirical formula [19,20].
Dr(nGyh−1) = 0.427×AU + 0.662×ATh + 0.043×AK (3)
Eq. (3) was modified to include the contributions of artificial radionuclides of cesium, 137Cs, as well as cosmic
radiation via the following equation [19].
Dγ(nGyh−1) = 0.427×AU + 0.662×ATh + 0.043×AK + 0.03×ACs + 34 (4)
Here 0.427, 0.662, and 0.043 are the dose rate conversion factors to convert the activity concentrations of 238U,232Th, and 40K and 137Cs radionuclides into absorbed dose rates as proposed by UNSCEAR [4]. Basically,
these factors are representative of the absorbed dose rates in air per unit activity per unit of soil mass, in units
of nGy h−1 per Bq kg−1 .
3.2.3. Annual effective dose equivalent
The annual effective dose equivalent (AEDE ) received by individuals was calculated from the calculated values
of Dr by applying the dose rate conversion factor of 0.7 Sv Gy−1 and the occupancy factors of 0.2 (5/24) and
0.8 (19/24) for outdoors and indoors, respectively [4]. The annual effective outdoor doses, Dout ; the annual
116
ABU SAMREH et al./Turkish J Eng Env Sci
effective indoor doses, Din ; and total annual effective doses, Dtot , were calculated according to the following
equations [21].
Dout(mSvy−1) = Dr(mGyh−1)× 24h× 365.25d× 0.2× 0.7SvGy−1 × 10⁻⁶ (5)
Din (mSvy−1) = D r(mGyh −1)× 24h× 365.25d× 1.4× 0.8× 0.7SvGy−1 × 10⁻⁶ (6)
Dtot (m Sv y−1) = Dout + Din (7)
3.2.4. External and internal radiation hazard indices
Hex =AU
370Bqkg−1+
ATh
259Bqkg−1+
AK
4810Bqkg−1(8)
The external radiation hazard index, Hex , corresponding to 238U, 232Th, and 40K natural radionuclides,
was calculated using the following equation [22].
The results of Hex should be less than or equal to unity, i.e.Hex ≤ 1. Normally, the maximum value of
Hex (Hex = 1) corresponds to the upper limit of Raeq (370 Bq kg−1). In order to keep the radiation hazard
insignificant, the values of Hex should be lower than 1 [15,18].
The hazard levels from the inhalation of alpha particles emitted from the radon short-lived radionuclides
such as 222Rn, the daughter product of 226Ra, and 220Rn, the daughter product of 224Ra, can be quantified by
the internal hazard index, Hin . This index can be calculated using the following semiempirical formula [22,23].
Hin =AU
185 Bqkg−1 +ATh
259 Bqkg−1 +AK
4810 Bqkg−1 (9)
The measured values of Hin should also be less than or equal to unity, i.e. Hin ≤ 1. This of great
importance to keep the concentration levels of radon and its short-lived daughters low enough for the respiratory
organs of humans living in the dwellings, comparable to or even lower than the assigned international levels of
40 Bq m−3 [1].
3.2.5. Radioactivity level index
The radioactivity level index, Iγ , is generally used to assess the hazardous level of radionuclides in the human
body when exposed to an amount of external (indoor or outdoor) annual effective doses of γ -radiations decayed
from radioactive nuclides in soils. This index is very important for quality control of γ -radiation annual
effective doses and in monitoring radiation inside human body, to ensure that such radiation does not exceed
the worldwide permissible high dose values [24]. Values of Iγ can be calculated according to the following
semiempirical formula [11,22].
Iγ =AU
150Bqkg−1+
ATh
100Bqkg−1+
AK
1500Bqkg−1(10)
The assessed values of Iγ must be less than or equal to 1 to make sure the soil environment is generally safe or
hazard-free.
117
ABU SAMREH et al./Turkish J Eng Env Sci
3.3. Excess lifetime cancer risk
The excess lifetime cancer risk (ELCR) values are calculated using the below equation [2].
ELCR = Dtot ×DL ×RF (11)
Here DL is the duration of life (approximately 70 years), and RF is the risk factor (Sv−1), which reflects the
fatal cancer risk per sievert. For stochastic effects, ICRP 60 uses values of 0.05 for the public [3].
4. Results and discussion
4.1. Activity concentration results
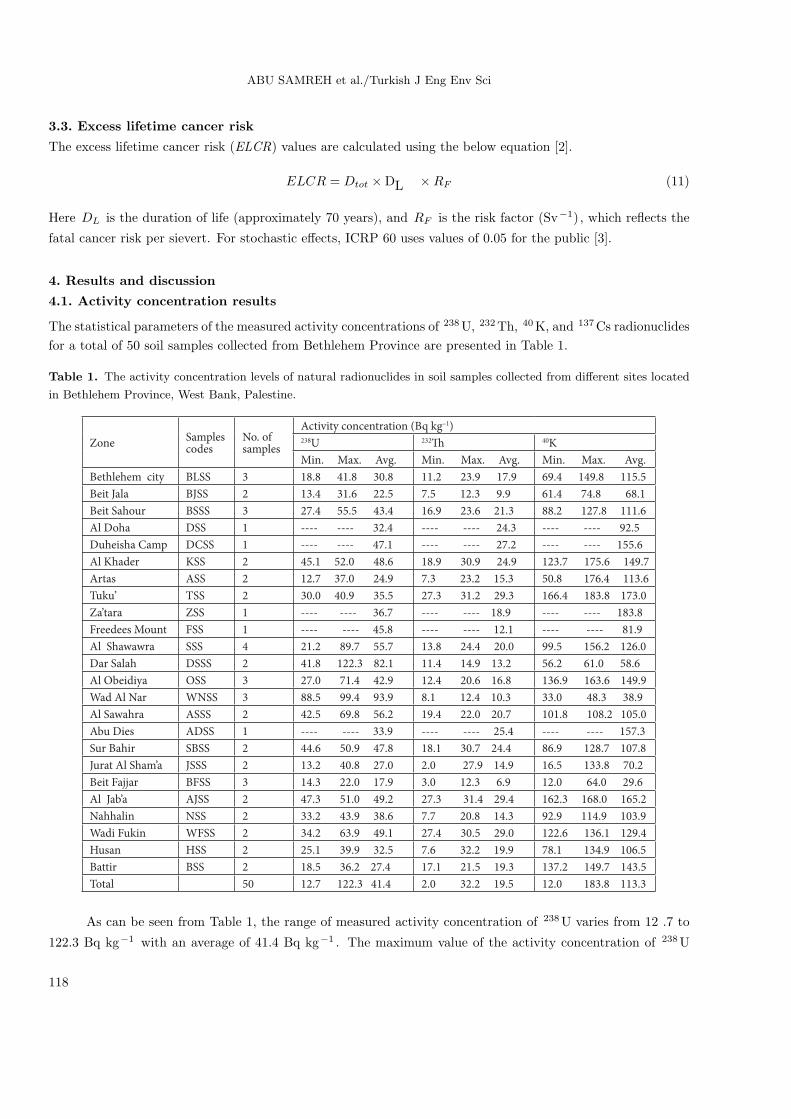
The statistical parameters of the measured activity concentrations of 238U, 232Th, 40K, and 137Cs radionuclides
for a total of 50 soil samples collected from Bethlehem Province are presented in Table 1.
Table 1. The activity concentration levels of natural radionuclides in soil samples collected from different sites located
in Bethlehem Province, West Bank, Palestine.
Activity concentration (Bq kg–1)No. of samples
Samples codes
Zone 40K232238U
Min. Max. Avg.Min. Max. Avg.Min. Max. Avg.
69.4 149.8 115.511.2 23.9 17.918.8 41.8 30.83BLSSBethlehem city
61.4 74.8 68.17.5 12.3 9.913.4 31.6 22.52BJSSBeit Jala
88.2 127.8 111.616.9 23.6 21.327.4 55.5 43.43BSSSBeit Sahour
---- ---- 92.5---- ---- 24.3---- ---- 32.41DSSAl Doha
---- ---- 155.6---- ---- 27.2---- ---- 47.11DCSSDuheisha Camp
123.7 175.6 149.718.9 30.9 24.945.1 52.0 48.62KSSAl Khader
50.8 176.4 113.67.3 23.2 15.312.7 37.0 24.92ASSArtas
166.4 183.8 173.027.3 31.2 29.330.0 40.9 35.52TSSTuku’
---- ---- 183.8---- ---- 18.9---- ---- 36.71ZSSZa’tara
---- ---- 81.9---- ---- 12.1---- ---- 45.81FSSFreedees Mount
99.5 156.2 126.013.8 24.4 20.021.2 89.7 55.74SSSAl Shawawra
56.2 61.0 58.611.4 14.9 13.241.8 122.3 82.12DSSSDar Salah
136.9 163.6 149.912.4 20.6 16.827.0 71.4 42.93OSSAl Obeidiya
33.0 48.3 38.98.1 12.4 10.388.5 99.4 93.93WNSSWad Al Nar
101.8 108.2 105.019.4 22.0 20.742.5 69.8 56.22ASSSAl Sawahra
---- ---- 157.3---- ---- 25.4---- ---- 33.91ADSSAbu Dies
86.9 128.7 107.818.1 30.7 24.444.6 50.9 47.82SBSSSur Bahir
16.5 133.8 70.22.0 27.9 14.913.2 40.8 27.02JSSSJurat Al Sham’a
12.0 64.0 29.63.0 12.3 6.914.3 22.0 17.93BFSSBeit Fajjar
162.3 168.0 165.227.3 31.4 29.447.3 51.0 49.22AJSSAl Jab’a
92.9 114.9 103.97.7 20.8 14.333.2 43.9 38.62NSSNahhalin
122.6 136.1 129.427.4 30.5 29.034.2 63.9 49.12WFSSWadi Fukin
78.1 134.9 106.57.6 32.2 19.925.1 39.9 32.52HSSHusan
137.2 149.7 143.517.1 21.5 19.318.5 36.2 27.42BSSBattir
12.0 183.8 113.32.0 32.2 19.512.7 122.3 41.450Total
As can be seen from Table 1, the range of measured activity concentration of 238U varies from 12 .7 to
122.3 Bq kg−1 with an average of 41.4 Bq kg−1 . The maximum value of the activity concentration of 238U
118

ABU SAMREH et al./Turkish J Eng Env Sci
radionuclide has been reported in some soil samples collected from Dar Salah village, whereas the minimum
concentration value was measured in a soil sample collected from Artas village. This noticeable difference may
be attributed to the geochemical composition and origin of soil types in such particular areas [11,12].
The measured activity concentrations of 232Th were found to range from 2.0 to 32.2 Bq kg−1 with an
average of 19.5 Bq kg−1 . Moreover, the range of activity concentration of 40K was found to vary from 12.0 to
183.8 Bq kg−1 , with an average value of 113.3 Bq kg−1 . The reported differences were also attributable to the
differences in soil type.
Clearly, the results show that the activity concentration of 238U is higher than that of 232Th in all
samples. The average activity levels of 238U are about 1.5 times higher than that of 232Th in the soil of this
particular region of the world. Another observation revealed that the measured activity concentration of 40K
significantly exceeds the measured activity concentration values of both 238U and 232Th. This is an indication
that 40K is a more abundant radioactive element than the other elements in the soils under consideration [12].
All of the obtained average values are within the attainable worldwide ranges except the activity con-
centration average value of 238U, which was found to be higher than the reported international radioactivity
levels of 238U in UNSCEAR reports [1,4]. The reported high values of the activity concentration belong to soil
samples collected from sites near radioactive-rich granite, phosphate, sandstone, and quartzite [1,4].
4.2. Assessment of radiation hazards
The calculated data for Raeq , Hex , and Iγ of the collected soil samples are shown in Table 2.
As can be observed from Table 2, the calculated values of Raeq for the same soil samples were found
to vary from 16.3 Bq kg−1 to 147.9 Bq kg−1 , with an average value of 77.6 Bq kg−1 . For most inspected
soil samples, Raeq values are comparable to or lower than the assigned international allowed limit of 370 Bq
kg−1 [1,4].
The calculated values ofHex were found to vary from 0.04 to 0.40, with an overall average value of 0.21.
These values are much less than unity (Hex < 1) and below the measured values in other countries. The values
of Hin were found to range between 0.08 and 0.73 with an average value of 0.32. The obtained values of Hin
are less than 1, as recommended for construction materials [11].
The calculated values of Iγ were found to range from 0.11 to 1.00 with an average of 0.55. In most soil
samples, the calculated values of Iγ were found to be lower than 1, corresponding to an annual effective dose
of generally less than 0.3 mSv year−1 [12].
The activity concentrations of the artificial radionuclide 137Cs were measured for all collected soil samples
in order to assess the amount of fallout radionuclide in such locations; they are given in Table 3.
The obtained activity concentration values of 137Cs in all collected soil samples were found to range from
1.0 Bq kg−1 to 12.2 Bq kg−1 with an average value of 2.8 Bq kg−1 . The minimum activity concentration value
of 137Cs was obtained for a soil sample collected from Jurat Al Sham’a village, whereas the maximum value was
measured in a soil sample collected from Al Jab’a village. Thus, the impact of the artificial radionuclide and the
corresponding additional external radiation exposure to the population were almost negligible. Consequently,
the measured activities of 137Cs confirmed no hazard effects due to 137Cs radionuclides to the people living in
the vicinity of the sites where soil samples were collected.
The calculated values of Dr were found to vary from 7.1 to 64.5 nGy h−1 , with an average value of
119
ABU SAMREH et al./Turkish J Eng Env Sci
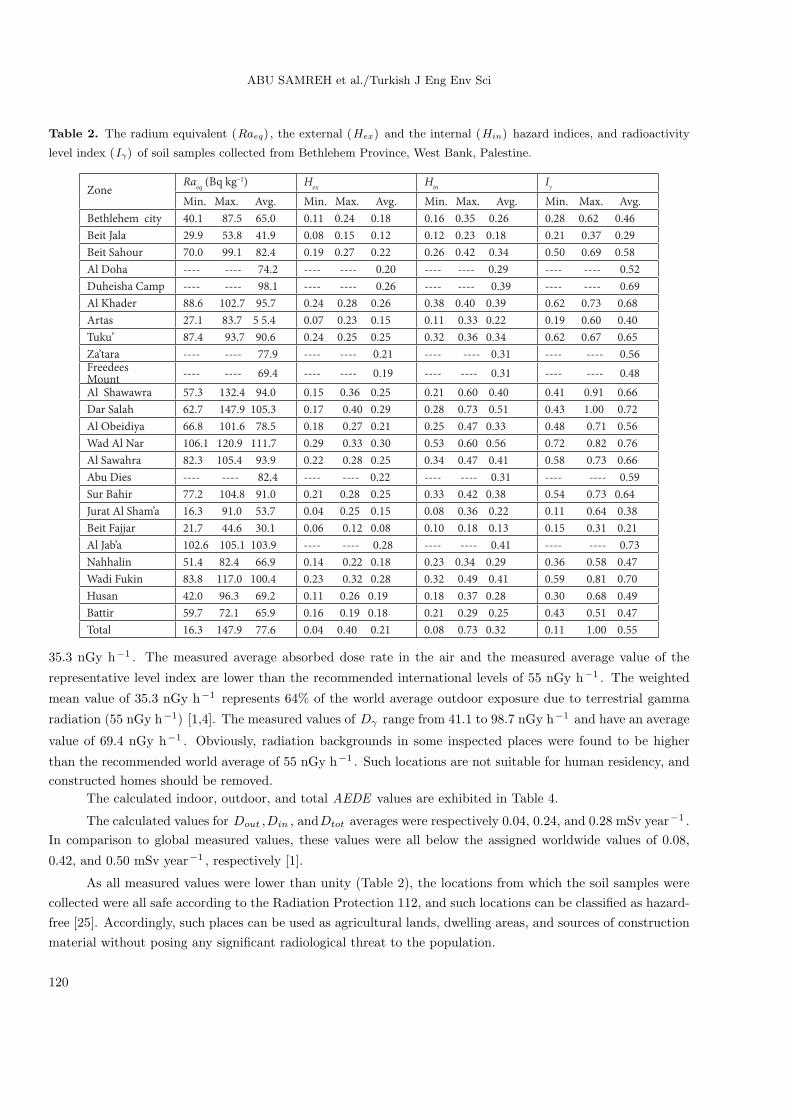
Table 2. The radium equivalent (Raeq) , the external (Hex) and the internal (Hin) hazard indices, and radioactivity
level index (Iγ) of soil samples collected from Bethlehem Province, West Bank, Palestine.
Iγ
Hin
Hex
Raeq
(Bq kg–1)Zone
Min. Max. Avg.Min. Max. Avg.Min. Max. Avg.Min. Max. Avg.
0.28 0.62 0.460.16 0.35 0.260.11 0.24 0.1840.1 87.5 65.0Bethlehem city
0.21 0.37 0.290.12 0.23 0.180.08 0.15 0.1229.9 53.8 41.9Beit Jala
0.50 0.69 0.580.26 0.42 0.340.19 0.27 0.2270.0 99.1 82.4Beit Sahour
---- ---- 0.52---- ---- 0.29---- ---- 0.20---- ---- 74.2Al Doha
---- ---- 0.69---- ---- 0.39---- ---- 0.26---- ---- 98.1Duheisha Camp
0.62 0.73 0.680.38 0.40 0.390.24 0.28 0.2688.6 102.7 95.7Al Khader
0.19 0.60 0.400.11 0.33 0.220.07 0.23 0.1527.1 83.7 5 5.4Artas
0.62 0.67 0.650.32 0.36 0.340.24 0.25 0.2587.4 93.7 90.6Tuku’
---- ---- 0.56---- ---- 0.31---- ---- 0.21---- ---- 77.9Za’tara
---- ---- 0.48---- ---- 0.31---- ---- 0.19---- ---- 69.4Freedees Mount
0.41 0.91 0.660.21 0.60 0.400.15 0.36 0.2557.3 132.4 94.0Al Shawawra
0.43 1.00 0.720.28 0.73 0.510.17 0.40 0.2962.7 147.9 105.3Dar Salah
0.48 0.71 0.560.25 0.47 0.330.18 0.27 0.2166.8 101.6 78.5Al Obeidiya
0.72 0.82 0.760.53 0.60 0.560.29 0.33 0.30106.1 120.9 111.7Wad Al Nar
0.58 0.73 0.660.34 0.47 0.410.22 0.28 0.2582.3 105.4 93.9Al Sawahra
---- ---- 0.59---- ---- 0.31---- ---- 0.22---- ---- 82.4Abu Dies
0.54 0.73 0.640.33 0.42 0.380.21 0.28 0.2577.2 104.8 91.0Sur Bahir
0.11 0.64 0.380.08 0.36 0.220.04 0.25 0.1516.3 91.0 53.7Jurat Al Sham’a
0.15 0.31 0.210.10 0.18 0.130.06 0.12 0.0821.7 44.6 30.1Beit Fajjar
---- ---- 0.73---- ---- 0.41---- ---- 0.28102.6 105.1 103.9Al Jab’a
0.36 0.58 0.470.23 0.34 0.290.14 0.22 0.1851.4 82.4 66.9Nahhalin
0.59 0.81 0.700.32 0.49 0.410.23 0.32 0.2883.8 117.0 100.4Wadi Fukin
0.30 0.68 0.490.18 0.37 0.280.11 0.26 0.1942.0 96.3 69.2Husan
0.43 0.51 0.470.21 0.29 0.250.16 0.19 0.1859.7 72.1 65.9Battir
0.11 1.00 0.550.08 0.73 0.320.04 0.40 0.2116.3 147.9 77.6Total
35.3 nGy h−1 . The measured average absorbed dose rate in the air and the measured average value of the
representative level index are lower than the recommended international levels of 55 nGy h−1 . The weighted
mean value of 35.3 nGy h−1 represents 64% of the world average outdoor exposure due to terrestrial gamma
radiation (55 nGy h−1) [1,4]. The measured values of Dγ range from 41.1 to 98.7 nGy h−1 and have an average
value of 69.4 nGy h−1 . Obviously, radiation backgrounds in some inspected places were found to be higher
than the recommended world average of 55 nGy h−1 . Such locations are not suitable for human residency, and
constructed homes should be removed.
The calculated indoor, outdoor, and total AEDE values are exhibited in Table 4.
The calculated values for Dout ,Din , andDtot averages were respectively 0.04, 0.24, and 0.28 mSv year−1 .
In comparison to global measured values, these values were all below the assigned worldwide values of 0.08,
0.42, and 0.50 mSv year−1 , respectively [1].
As all measured values were lower than unity (Table 2), the locations from which the soil samples were
collected were all safe according to the Radiation Protection 112, and such locations can be classified as hazard-
free [25]. Accordingly, such places can be used as agricultural lands, dwelling areas, and sources of construction
material without posing any significant radiological threat to the population.
120
ABU SAMREH et al./Turkish J Eng Env Sci
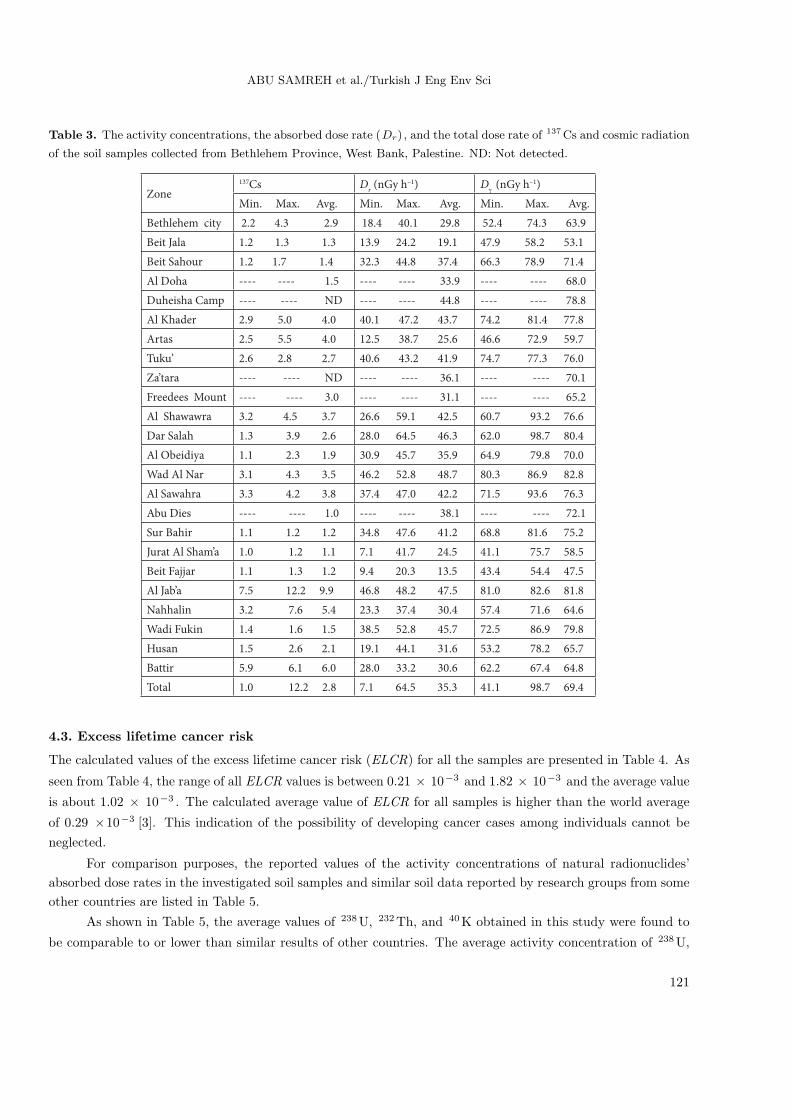
Table 3. The activity concentrations, the absorbed dose rate (Dr) , and the total dose rate of 137Cs and cosmic radiation
of the soil samples collected from Bethlehem Province, West Bank, Palestine. ND: Not detected.
Dγ (nGy h–1)D
r (nGy h–1)137Cs
ZoneMin. Max. Avg.Min. Max. Avg.Min. Max. Avg.
52.4 74.3 63.918.4 40.1 29.82.2 4.3 2.9Bethlehem city
47.9 58.2 53.113.9 24.2 19.11.2 1.3 1.3Beit Jala
66.3 78.9 71.432.3 44.8 37.41.2 1.7 1.4Beit Sahour
---- ---- 68.0---- ---- 33.9---- ---- 1.5Al Doha
---- ---- 78.8---- ---- 44.8---- ---- NDDuheisha Camp
74.2 81.4 77.840.1 47.2 43.72.9 5.0 4.0Al Khader
46.6 72.9 59.712.5 38.7 25.62.5 5.5 4.0Artas
74.7 77.3 76.040.6 43.2 41.92.6 2.8 2.7Tuku’
---- ---- 70.1---- ---- 36.1---- ---- NDZa’tara
---- ---- 65.2---- ---- 31.1---- ---- 3.0Freedees Mount
60.7 93.2 76.626.6 59.1 42.53.2 4.5 3.7Al Shawawra
62.0 98.7 80.428.0 64.5 46.31.3 3.9 2.6Dar Salah
64.9 79.8 70.030.9 45.7 35.91.1 2.3 1.9Al Obeidiya
80.3 86.9 82.846.2 52.8 48.73.1 4.3 3.5Wad Al Nar
71.5 93.6 76.337.4 47.0 42.23.3 4.2 3.8Al Sawahra
---- ---- 72.1---- ---- 38.1---- ---- 1.0Abu Dies
68.8 81.6 75.234.8 47.6 41.21.1 1.2 1.2Sur Bahir
41.1 75.7 58.57.1 41.7 24.51.0 1.2 1.1Jurat Al Sham’a
43.4 54.4 47.59.4 20.3 13.51.1 1.3 1.2Beit Fajjar
81.0 82.6 81.846.8 48.2 47.57.5 12.2 9.9Al Jab’a
57.4 71.6 64.623.3 37.4 30.43.2 7.6 5.4Nahhalin
72.5 86.9 79.838.5 52.8 45.71.4 1.6 1.5Wadi Fukin
53.2 78.2 65.719.1 44.1 31.61.5 2.6 2.1Husan
62.2 67.4 64.828.0 33.2 30.65.9 6.1 6.0Battir
41.1 98.7 69.47.1 64.5 35.31.0 12.2 2.8Total
4.3. Excess lifetime cancer risk
The calculated values of the excess lifetime cancer risk (ELCR) for all the samples are presented in Table 4. As
seen from Table 4, the range of all ELCR values is between 0.21 × 10⁻³ and 1.82 × 10⁻³ and the average value
is about 1.02 × 10⁻³ . The calculated average value of ELCR for all samples is higher than the world average
of 0.29 ×10⁻³ [3]. This indication of the possibility of developing cancer cases among individuals cannot be
neglected.
For comparison purposes, the reported values of the activity concentrations of natural radionuclides’
absorbed dose rates in the investigated soil samples and similar soil data reported by research groups from some
other countries are listed in Table 5.
As shown in Table 5, the average values of 238U, 232Th, and 40K obtained in this study were found to
be comparable to or lower than similar results of other countries. The average activity concentration of 238U,
121

ABU SAMREH et al./Turkish J Eng Env Sci
Table 4. The outdoor (Doutdoor) , indoor (Dindoor) , and total annual effective dose equivalent (Dtotal) and excess
lifetime cancer risk (ELCR) of the soil samples collected from Bethlehem Province, West Bank, Palestine.
ELCR (×10–3)Dtotal
(mSv year–1)Dindoor
(mSv year–1)Doutdoor
(mSv year–1)Zone
Min. Max. Avg.Min. Max. Avg.Min. Max. Avg.Min. Max. Avg.
0.53 1.16 0.840.15 0.33 0.240.13 0.28 0.200.02 0.05 0.04Bethlehem city
0.42 0.70 0.530.12 0.20 0.150.10 0.17 0.130.02 0.03 0.02Beit Jala
0.91 1.26 1.090.26 0.36 0.310.22 0.31 0.260.04 0.05 0.05Beit Sahour
---- ---- 0.95---- ---- 0.27---- ---- 0.23---- ---- 0.04Al Doha
---- ---- 1.26---- ---- 0.36---- ---- 0.31---- ---- 0.05DuheishaCamp
1.16 1.33 1.230.33 0.38 0.350.28 0.32 0.300.05 0.06 0.05Al Khader
0.39 1.12 0.740.11 0.32 0.210.09 0.27 0.180.02 0.05 0.03Artas
1.16 1.23 1.190.32 0.35 0.340.28 0.30 0.290.04 0.05 0.05Tuku’
---- ---- 1.02---- ---- 0.29---- ---- 0.25---- ---- 0.04Za’tara
---- ---- 0.88---- ---- 0.25---- ---- 0.21---- ---- 0.04Freedees Mount
0.74 1.68 1.190.21 0.48 0.340.18 0.41 0.290.03 0.07 0.05Al Shawawra
0.77 1.82 1.330.22 0.52 0.380.19 0.44 0.320.03 0.08 0.06Dar Salah
0.88 1.30 1.020.25 0.37 0.290.21 0.31 0.250.04 0.06 0.04Al Obeidiya
1.33 1.47 1.370.37 0.42 0.390.32 0.36 0.330.05 0.06 0.06Wad Al Nar
1.09 1.33 1.190.31 0.38 0.340.26 0.32 0.290.05 0.06 0.05Al Sawahra
---- ---- 1.09---- ---- 0.31---- ---- 0.26---- ---- 0.05Abu Dies
0.98 1.37 1.160.28 0.39 0.330.24 0.33 0.280.04 0.06 0.05Sur Bahir
0.21 1.19 0.700.06 0.34 0.200.05 0.29 0.170.01 0.05 0.03Jurat Al Sham’a
0.25 0.56 0.390.07 0.16 0.110.06 0.14 0.090.01 0.02 0.02Beit Fajjar
1.33 1.37 1.350.37 0.40 0.390.32 0.33 0.330.05 0.07 0.06Al Jab’a
0.67 1.09 0.880.19 0.31 0.250.16 0.26 0.210.03 0.05 0.04Nahhalin
1.09 1.47 1.300.31 0.42 0.370.26 0.36 0.310.05 0.06 0.06Wadi Fukin
0.53 1.23 0.910.15 0.35 0.260.13 0.30 0.220.02 0.05 0.04Husan
0.77 0.95 0.880.22 0.27 0.250.19 0.23 0.210.03 0.04 0.04Battir
0.21 1.82 1.020.06 0.52 0.280.05 0.44 0.240.01 0.08 0.04Total
232Th, and 40K in the Bethlehem region represents, respectively, 60%, 40%, and 20% of the average activity
concentrations obtained for radionuclides in soil samples collected from Hebron Province south to Bethlehem
Province [11,12].
5. Conclusions
The measured average activity concentrations in Bq kg−1 for 238U, 232Th, 40K, and 137Cs are respectively
41.4, 19.5, 113.3, and 2.8. On one hand, the average activity concentrations of 232Th and 40K are found to
be lower than the world averages of 30 Bq kg−1 and 400 Bq kg−1 . On the other hand, the average activity
concentration of 238U is found to be higher than the corresponding world average of 35 Bq kg−1 .
The measured average absorbed dose rate in the air and the measured average value of the representative
level index are found to be lower than the recommended international levels. The estimated average of total
122
ABU SAMREH et al./Turkish J Eng Env Sci
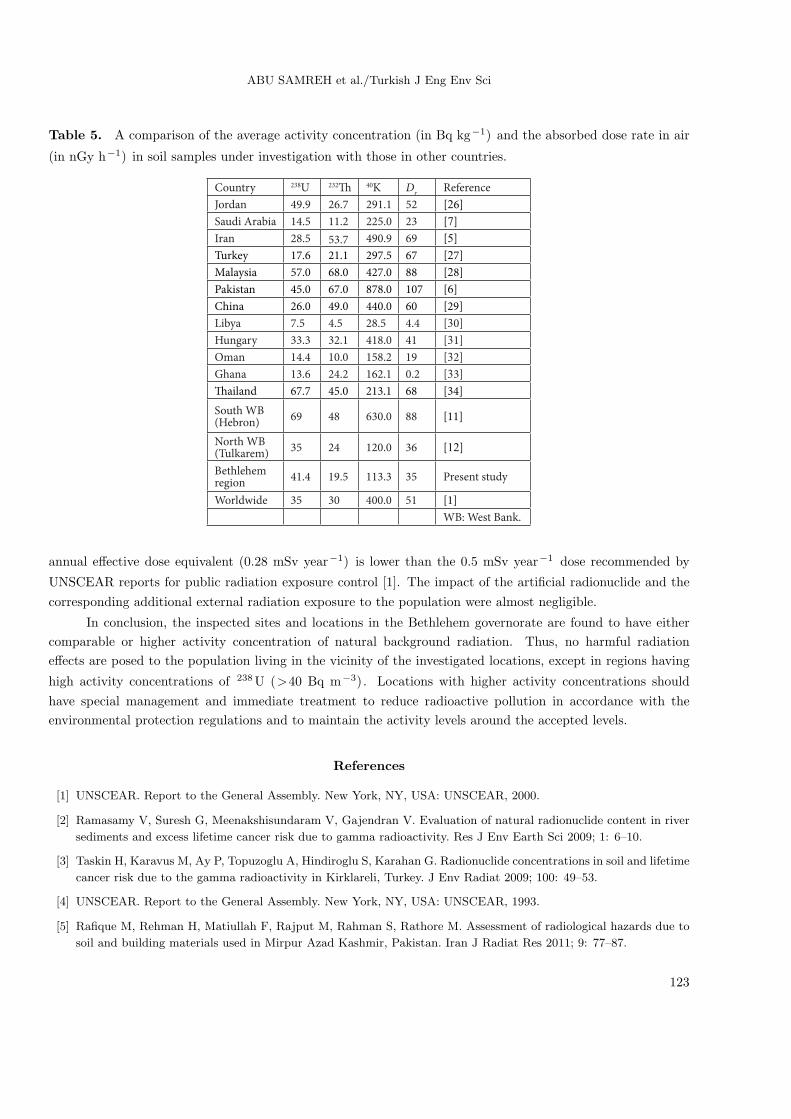
Table 5. A comparison of the average activity concentration (in Bq kg−1) and the absorbed dose rate in air
(in nGy h−1) in soil samples under investigation with those in other countries.
ReferenceDr
40K232238UCountry
[26]52291.126.749.9Jordan
[7]23225.011.214.5Saudi Arabia
[5]69490.953.728.5Iran
[27]67297.521.117.6Turkey
[28]88427.068.057.0Malaysia
[6]107878.067.045.0Pakistan
[29]60440.049.026.0China
[30]4.428.54.57.5Libya
[31]41418.032.133.3Hungary
[32]19158.210.014.4Oman
[33]0.2162.124.213.6Ghana
[34]68213.145.067.7
[11]88630.04869South WB (Hebron)
[12]36120.02435North WB (Tulkarem)
Present study35113.319.541.4Bethlehem region
[1]51400.03035Worldwide
WB: West Bank.
annual effective dose equivalent (0.28 mSv year−1) is lower than the 0.5 mSv year−1 dose recommended by
UNSCEAR reports for public radiation exposure control [1]. The impact of the artificial radionuclide and the
corresponding additional external radiation exposure to the population were almost negligible.
In conclusion, the inspected sites and locations in the Bethlehem governorate are found to have either
comparable or higher activity concentration of natural background radiation. Thus, no harmful radiation
effects are posed to the population living in the vicinity of the investigated locations, except in regions having
high activity concentrations of 238U (>40 Bq m−3). Locations with higher activity concentrations should
have special management and immediate treatment to reduce radioactive pollution in accordance with the
environmental protection regulations and to maintain the activity levels around the accepted levels.
References
[1] UNSCEAR. Report to the General Assembly. New York, NY, USA: UNSCEAR, 2000.
[2] Ramasamy V, Suresh G, Meenakshisundaram V, Gajendran V. Evaluation of natural radionuclide content in river
sediments and excess lifetime cancer risk due to gamma radioactivity. Res J Env Earth Sci 2009; 1: 6–10.
[3] Taskin H, Karavus M, Ay P, Topuzoglu A, Hindiroglu S, Karahan G. Radionuclide concentrations in soil and lifetime
cancer risk due to the gamma radioactivity in Kirklareli, Turkey. J Env Radiat 2009; 100: 49–53.
[4] UNSCEAR. Report to the General Assembly. New York, NY, USA: UNSCEAR, 1993.
[5] Rafique M, Rehman H, Matiullah F, Rajput M, Rahman S, Rathore M. Assessment of radiological hazards due to
soil and building materials used in Mirpur Azad Kashmir, Pakistan. Iran J Radiat Res 2011; 9: 77–87.
123

ABU SAMREH et al./Turkish J Eng Env Sci
[6] Khan H, Ismail M, Zia M, Khan K. Measurement of radionuclide’s and absorbed dose rates in soil samples of
Peshawar, Pakistan, using gamma ray spectrometry. Isot Env Heal Stud 2012; 48: 295–301.
[7] Alaamer A. Assessment of human exposures to natural sources of radiation in soil of Riyadh, Saudi Arabia. Turkish
J Eng Env Sci 2008; 32: 229–234.
[8] Bakac M, Kumru MN. Uranium, radium and field measurements in the water of Gediz River. Turkish J Eng Env
Sci 2000; 24 : 229–236.
[9] Mehra R, Kumar S, Sonkawade R, Singh N, Badhan K. Analysis of terrestrial naturally occurring radionuclides in
soil samples from some areas of Sirsa district of Haryana, India using gamma ray spectrometry. Env Earth Sci 2009;
59: 1159–1164.
[10] Abu-Samreh M. Gamma radiation measurement and dose rates of naturally occurring radioactive samples from
Hebron Province geological rocks. Abhath Al-Yarmouk 2006; 15: 1–9.
[11] Dabayneh K, Mashal L, Hasan F. Radioactivity concentration in soil samples in the southern part of the West
Bank, Palestine. Radiat Prot Dos 2008; 131: 265–271.
[12] Thabayneh K, Jazzar M. Natural radioactivity levels and estimation of radiation exposure in environmental soil
samples from Tulkarem Province –Palestine. Open J Soil Sci 2012; 2: 7–16.
[13] Faweya E, Babalola A. Radiological safety assessment and occurrence of heavy metals in soil from designated waste
dumpsites used for building and composting in Southwestern Nigeria. Arab J Sci Eng 2010; 35: 220.
[14] Meyerhof WE. Elements of Nuclear Physics. New York, NY, USA: McGraw-Hill, 1967.
[15] Huy N, Luyen T. Study on external exposure doses from terrestrial radioactivity in Southern Vietnam. Radiat Prot
Dos 2005; 118: 331–336.
[16] Abdel-Ghany H. Natural activities of 238U, 232Th and 40K in manganese ore. Am Env Sci 2010; 6: 90–94.
[17] Alharbi W, AlZahrani J, Abbady A. Assessment of radiation hazard indices from granite rocks of the South-Eastern
Arabian Shield, Kingdom of Saudi Arabia. Austr J Basic Appl Sci 2011; 5: 672–682.
[18] Mahur A, Kumar R, Mishra M, Ali S, Sonkawade R, Singh B, Bhardwaj V, Prasad R. Study of radon exhalation
rate and natural radioactivity in soil samples collected from east Singhbhum Shear zone in Jaduguda U-Mines Area,
Jharkhand, India and its radiological implications. Ind J Pure Appl Phys 2010; 48: 486–492.
[19] El-Shershaby A, El-Bahi S, Walley El-Din N, Dabayneh K. Assessment of natural and man-made radioactivity
levels of the plant leaves samples as bio-indicators of pollution in Hebron district-Palestine. Arab J Nucl Sci Appl
2006; 39: 232–242.
[20] Fatima I, Zaidi J, Arif M, Daud M, Ahmad S, Tahir S. Measurement of natural radioactivity and dose rate assessment
of terrestrial gamma radiation in the soil of southern Punjab, Pakistan. Radiat Prot Dosim 2008; 128: 206–212.
[21] Veiga R, Sanches N, Anjos RM, Macario K, Bastos J, Iguatemy M, Aguiar JG, Santos AM, Mosquera B, Carvalho
C et al. Measurement of natural radioactivity in Brazilian beach sands. Rad Meas 2006; 41: 189–196.
[22] Shams I, Mohamed U, Reda E. Gamma radioactivity measurements in Nile River sediment samples. Turkish J Eng
Env Sci 2013; 37: 109–122.
[23] Beretka J, Mathew P. Natural radioactivity in Australian building materials, industrial waste and by-products.
Health Phys 1985; 1: 87–95.
[24] Al-Saleh F, Al-Berzan B. Measurements of natural radioactivity in some kinds of marble and granite used in Riyadh
Region. J Nuclear Rad Phys 2007; 2: 25–36.
[25] European Commission. Radiological Protection Principles Concerning the Natural Radioactivity of Building Mate-
rials. Directorate General Environment, Nuclear Safety and Civil Protection. Brussels, Belgium: European Com-
mission, 1999.
[26] Al-Hamarneh I, Awadallah M. Soil radioactivity levels and radiation hazard assessment in highlands of Northern
Jordan. Rad Meas 2009; 44: 102–110.
124
ABU SAMREH et al./Turkish J Eng Env Sci
[27] Degerlier M, Karahan G, Ozger G. Radioactivity concentrations and dose assessment for soil samples around Adana,
Turkey. J Envi Radioact 2008; 99: 1018–1025.
[28] Almayahi B, Tajuddin A, Jaafar M. Radiation hazard indices of soil and water samples in Northern Malaysian
Peninsula. Appl Radia Isot 2012; 70: 2652–2660.
[29] Wang Z, He J, Du Y, He Y, Li Z, Chen Z, Yang C. Natural and artificial radionuclide measurements and radioactivity
assessment of soil samples in eastern Sichuan province (China). Rad Prot Dosim 2012; 150: 391–397.
[30] El-Kameesy SU, Abdel-Ghany S, El-Minyawi SM, Miligy Z, El-Mabrouk EM. Natural radioactivity of beach sand
samples in the Tripoli Region, Northwest Libya. Turkish J Eng Env Sci 2008; 32: 245–251.
[31] Papp Z. Natural radioactivity in the soils of some eastern counties of Hungary. Rad Prot Dos 2010; 141: 56–63.
[32] Saleh IH. Radioactivity of 238U, 232Th, 40K, and 137Cs and assessment of depleted uranium in soil of the Musandam
Peninsula, Sultanate of Oman. Turkish J Eng Env Sci 2013; 36: 236–248.
[33] Faanu A, Darko E, Ephraim J. Determination of natural radioactivity and hazard in soil and rock samples in
Amining area in Ghana. West Afr J Appl Ecol 2011; 19: 68–77.
[34] Kessaratikoon P, Awaekechi S. Natural radioactivity measurement in soil samples collected from Municipal Area of
Hat Yai district in Songkhla Province. Thai Sci J 2008; 8: 52–58.
125