
MEASUREMENT CHALLENGES, OBSTACLES, AND … Proceedings/BFPUG-2012/Schofield... · In the first...
28
MEASUREMENT CHALLENGES, OBSTACLES, AND VICTORIES 29 DE NOVEMBRO DE 2012 MÉTRICAS 2012 SÃO PAULO, BRAZIL Joe Schofield [email protected]
Transcript of MEASUREMENT CHALLENGES, OBSTACLES, AND … Proceedings/BFPUG-2012/Schofield... · In the first...

MEASUREMENT CHALLENGES, OBSTACLES, AND VICTORIES 29 DE NOVEMBRO DE 2012
MÉTRICAS 2012
SÃO PAULO, BRAZIL
Joe Schofield [email protected]

Joe Schofield: 2012
1. On average, how far is the sun from Neptune when compared to the distance
of the sun to Earth? (or distance from Earth to sun)
2. How many tenths of an inch (centimeters) do fingernails grow within a year?
3. What is the flight distance in kilometers from New York City to Mumbai India?
4. How many feet (meters) above sea level is Mt. Kilimanjaro?
5. How long is the song “Hey Jude”, originally recorded by the Beatles in 1968?
6. The Oasis of the Seas is listed as the world’s largest cruise ship (circa 2011).
What is the maximum passenger capacity listed for this vessel?
7. If it’s 80 degrees Fahrenheit, what’s the temperature in Celsius?
8. What is the estimated maximum number of military deaths that resulted from
WWII expressed in millions?
9. What is the number of gallons (liters) in a US barrel of oil?
10. The gestation period of an elephant is how many months?
2
Test Questions – Last Year’s Conference

Joe Schofield: 2012
Test Results Last Year – how many?
3
Question V1 > V2 V2 > V1 Tied
1 52% 33% 19%
2 52% 33% 19%
3 67% 29% 10%
4 24% 57% 24%
5 43% 48% 14%
6 48% 43% 14%
7 14% 52% 38%
8 43% 43% 19%
9 52% 48% 5%
10 14% 57% 33%
Results from Sao Paulo Brazil – 2nd Measurement and Analysis Conference – 11/11/2011
• First, thank you to everyone who contributed to the study in Brazil • Our best score with the smallest total variation was from Guilherme Simões at 3087
• The largest variance was 12,488,098 (name not published) • 38 answer sheets were discarded because they did not contain a value in each of the four columns
for each of the 10 questions; thus, did not introduce another source of variation in the results. • “Under pressure to compete” the group did WORSE on questions related to Kilimanjaro, “Hey
Jude”, Fahrenheit to Celsius, and gestation. Please note that as a whole, the “number of military deaths from World War II” (#8) was the same under pressure and not under pressure.

Joe Schofield: 2012
Test Results Last Year – how close?
4
The distribution by percent around the correct answer looked like:
0
5
10
15
20
25
30
35
1 2 3 4 5 6 7 8 9 10
Plus or minus 25%
Plus or minus 26 - 50%
Plus or minus 51 - 75%
> 75%
On 7 questions, the “mode” variation results were in excess of 75 percent. “When they were bad, they were very bad.” Or another – “there’s a lot more money in not being stupid than there is in being smart”!
Joe Schofield: 2012
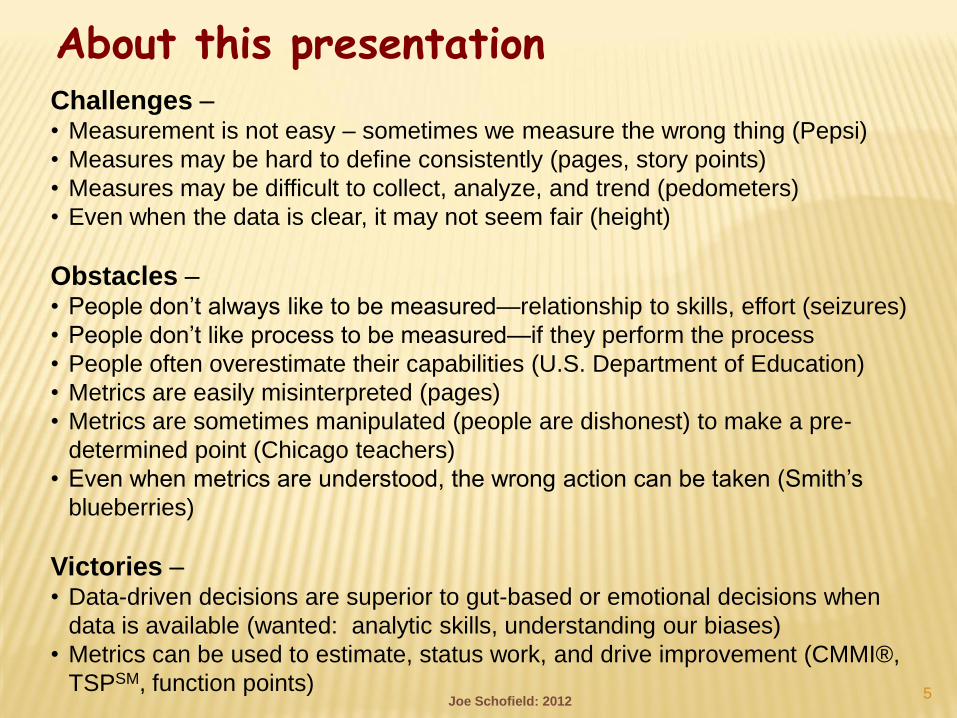
About this presentation Challenges – • Measurement is not easy – sometimes we measure the wrong thing (Pepsi)
• Measures may be hard to define consistently (pages, story points)
• Measures may be difficult to collect, analyze, and trend (pedometers)
• Even when the data is clear, it may not seem fair (height)
Obstacles – • People don’t always like to be measured—relationship to skills, effort (seizures)
• People don’t like process to be measured—if they perform the process
• People often overestimate their capabilities (U.S. Department of Education)
• Metrics are easily misinterpreted (pages)
• Metrics are sometimes manipulated (people are dishonest) to make a pre-
determined point (Chicago teachers)
• Even when metrics are understood, the wrong action can be taken (Smith’s
blueberries)
Victories – • Data-driven decisions are superior to gut-based or emotional decisions when
data is available (wanted: analytic skills, understanding our biases)
• Metrics can be used to estimate, status work, and drive improvement (CMMI®,
TSPSM, function points) 5

Joe Schofield: 2012
The data says one thing, or does it?
About the Pepsi challenge and why it’s meaningless
• Coke’s initial reaction to the Pepsi Challenge was to dispute its
findings. But they found the same thing – 57 percent – preferred
Pepsi.
• In September of 1984, Coca-Cola tested what would end up as the
final version of New Coke. New Coke beat Pepsi by 6 to 8 … the
company’s CEO, Roberto C. Goizueta, called the new product “the
surest move the company’s ever made…”
• Sometimes a sip tastes good and a whole bottle doesn’t. That’s
why home-use tests give you the best information.
• “If you only test in a sip test, consumers will like the sweeter
product…”
• Pepsi is sweeter than Coke, so right away it had a big advantage in
a sip test…Pepsi is a drink built to shine in a sip test.
Blink – the power of Thinking without Thinking;
Malcolm Gladwell
6

Joe Schofield: 2012
As in software, as in life . . .
About size—it does matter
• (In the U.S.), about 14.5 percent of all men are six feet or taller. Among
CEOs of Fortune 500 companies, that number is 58 percent.
• 3.9 percent of adult men are six foot two or taller.
• Most of us…associate leadership ability with imposing physical stature. We
have a sense of what a leader is supposed to look like, and that stereotype
is so powerful that when someone fits it, we simply become blind to other
considerations.
• Four large studies…calculated that…an inch of height is worth $789 a year
in salary.
• “Over the course of a 30-year career and compound it, a tall person enjoys
literally hundreds of thousands of dollars of earnings advantage.”
• Six thousand dollars more per year is you’re six feet tall versus the 5’6” co-
worker (Landsburg).
Blink – the power of Thinking without Thinking;
Malcolm Gladwell
7
Joe Schofield: 2012
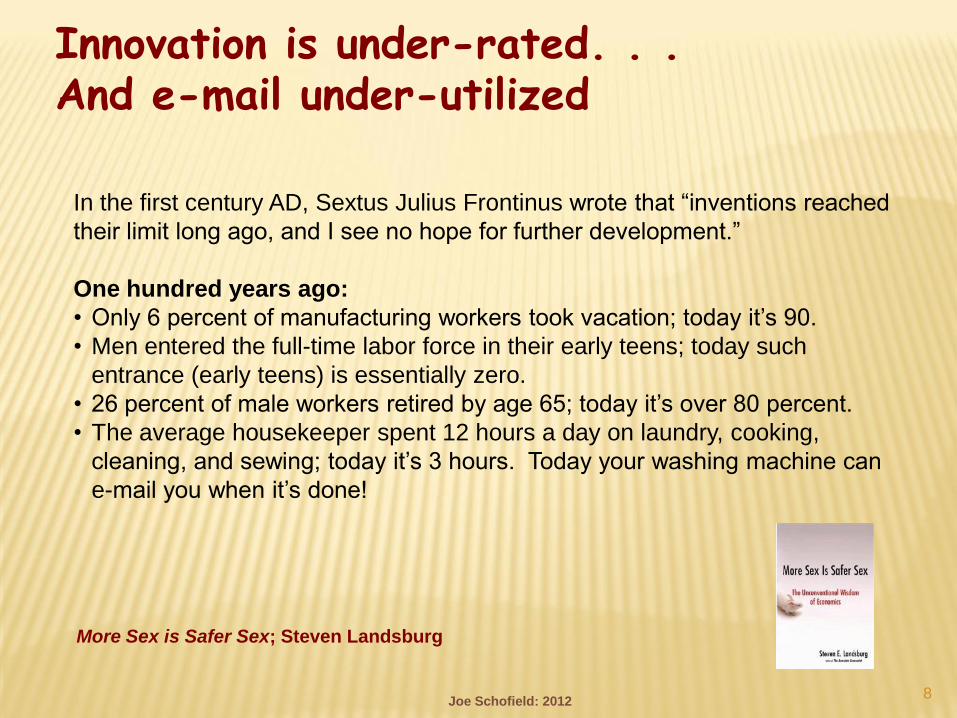
Innovation is under-rated. . . And e-mail under-utilized
In the first century AD, Sextus Julius Frontinus wrote that “inventions reached
their limit long ago, and I see no hope for further development.”
One hundred years ago:
• Only 6 percent of manufacturing workers took vacation; today it’s 90.
• Men entered the full-time labor force in their early teens; today such
entrance (early teens) is essentially zero.
• 26 percent of male workers retired by age 65; today it’s over 80 percent.
• The average housekeeper spent 12 hours a day on laundry, cooking,
cleaning, and sewing; today it’s 3 hours. Today your washing machine can
e-mail you when it’s done!
More Sex is Safer Sex; Steven Landsburg
8

Joe Schofield: 2012
Incentives must be substantial to alter behavior in a desired direction . . .
Changing a flat for a friend, free or the offer of $3. Since the $3 offer is
insulting, it’s not worth offering and would likely deter someone from helping
you.
• If you’re going to pay people to perform, you have to pay them a meaningful
amount. If someone’s baseline rewards aren’t adequate or equitable, focus
will be on the unfairness of the situation and the accompanying anxiety.
• The best use of money as a motivator is to pay people enough to take the
issue of money off the table.
Predictably Irrational; Dan Ariely
Drive; Pink
9

Joe Schofield: 2012
Individual and team decision-making . . .
In an experiment, when a person (faking) a seizure with just one person next
door listening, the second person came to the aid of the first 85 percent of the
time. But when four persons overheard the seizure, they came to the rescue
only 31 percent of the time.
In a similar experiment, folks who were by themselves and saw smoke
coming out of a room responded 75 percent of the time, but only 38 percent
of the time when in a group.
Tipping Point; Malcolm Gladwell
10

Joe Schofield: 2012
We ain’t what we think (sometimes). . .
(U.S.) Department of Education:
• Roughly 90 million (US) Americans over age 16—almost half that
category’s total population—are, as far as most workplaces are concerned,
basically unfit (not trained, not capable, not motivated) for employment; yet,
• In addition, 71 percent of these felt like they read well or very well.
The Oz Principle; Connors, Smith, Hickman
11

Joe Schofield: 2012
Unintended consequences . . .
In an attempt to raise test scores in Chicago schools, teachers updated
(erased and changed) answers on their students’ achievement tests.
Oops, they changed the same question answers such that every student had
the right (and sometimes) the wrong answer in a series of questions where
that was virtually impossible.
Younger less qualified teachers made up the bulk of the 5 percent suspected
of cheating. A small number of these were fired.
The World is Flat; Thomas Friedman
Keynote ISMA Cinco!; Ricardo Valerdi
12

13
Margins Font
Font
Size Spacing Bolding
Char.
Per page
%
Content
Loss
Initial
settings
.3 top &
bottom;
.4 sides
Times
New
Roman
10 Single none 7584 0
1” 5450 28
Verdana 5686 25
12 5177 32
Double 4353 43
ON 7185 5
Initial
settings
1” Verdana 12 Double ON 1403 83
Read “% Content Loss” (last column) as variation!
Cumulative difference of one page to almost six
Consider still larger font, font size, spacing, charts, diagrams,
pictures, etc.
Impact on PMC SP1.1 – Monitor actual values of project
planning parameters against the project plan.
Page Size variations. . .
Joe Schofield: 2012

Joe Schofield: 2012
Making problems worse . . . (in the pursuit of quality and “fixes”)
• Pedometers – intended to improve health; misused
to increase steps; defective thru QA
• Countdown for hypersonic glide vehicle halted at
Kauai Hawaii launch facility with seven seconds
remaining due to software script “error” – delay of
30 minutes
Note: Watts Humphrey’s work and likelihood of a
new defect injected – 40 times greater.
Sandia Lab News; May 17, 2012
Photo: http://www.sandia.gov/locations/ktf/
14
Joe Schofield: 2012
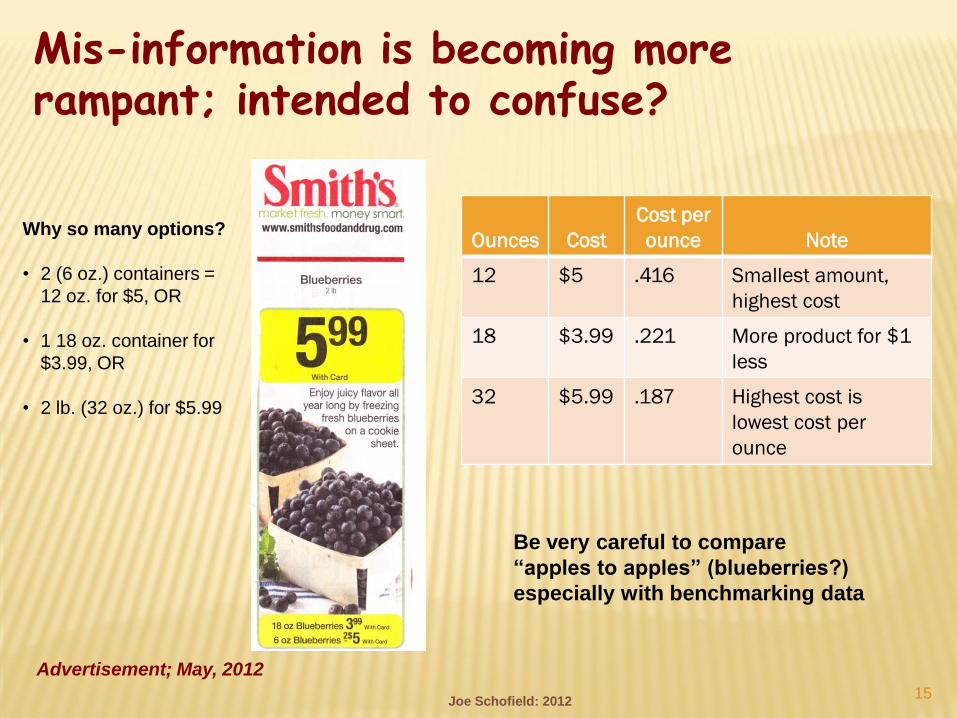
Mis-information is becoming more rampant; intended to confuse?
Advertisement; May, 2012
15
Why so many options?
• 2 (6 oz.) containers =
12 oz. for $5, OR
• 1 18 oz. container for
$3.99, OR
• 2 lb. (32 oz.) for $5.99
Ounces Cost
Cost per
ounce Note
12 $5 .416 Smallest amount,
highest cost
18 $3.99 .221 More product for $1
less
32 $5.99 .187 Highest cost is
lowest cost per
ounce
Be very careful to compare
“apples to apples” (blueberries?)
especially with benchmarking data

Joe Schofield: 2012
Sources of variation from our thinking (and estimates) – (last year)
When people make interventions to a system they expect the
effects to be nearly instantaneous. Unfortunately, in most of the
cases the intervention intended to improve the process actually
causes outcomes to get worse before they get better, if they get
better at all.
Underestimation in the “When It Gets Worse Before it
Gets Better” Phenomenon in Process Improvement
Advanced Concurrent Engineering, 2011, Part 1, 3-10,
DOI: 10.1007/978-0-85729-799-0_1
Ricardo Valerdi and Braulio Fernandes
16

17
Characteristic Function Points Use Case Points Story Points
Useful at the project
level for estimating or
planning
With historical FP data With historical UCP
data With historical SP data
ISO / Standards based ISO 20926 no no
Captures customer
view Expected Expected Definitely
Useful for
benchmarking outside
the company
Could be Could be Less so
Easy to calculate Less so More so Yes
Easy to validate for
repeatability /
consistency
More so More so Less so
Objectivity More so More so Less so (team / team
member variability)
Technologically
independent Yes Yes Maybe
Functional
measurement to
customer
Yes Yes
Not exclusively (may
include refactoring,
design, and other work)
Function Points, Use Case Points, Story Points: Observations from a Case Study; Schofield,
Armentrout, Trujillo; awaiting publication by CrossTalk; accepted March, 2012
Use case points, story points, function points . . . What’s the point?
Joe Schofield: 2012

“I used to be better
when I wasn’t very
good at all (or I
didn’t know how
bad it was).”
When people make interventions . . . in most of the cases the intervention
intended to improve the process actually causes outcomes to get worse before
they get better, if they get better at all. Underestimation in the “When It Gets Worse Before it Gets Better” Phenomenon in Process Improvement;
Advanced Concurrent Engineering, 2011, Part 1, 3-10, DOI: 10.1007/978-0-85729-799-0_1
Ricardo Valerdi and Braulio Fernandes
The cognitive approach has identified a number of erroneous beliefs held by
gamblers, which cause them to over-estimate their chances of winning. Decision-making during gambling: an integration of cognitive and psychobiological approaches; Luke Clark
Research has shown that the confidence individuals express in their
judgments generally exceeds the accuracy of those judgments on difficult
tasks. ORGANIZATIONAL BEHAVIOR AND HUMAN DECISION PROCESSES 48, 100-130 (1991); Influences on
the Appropriateness of Confidence in Judgment: Practice, Effort, Information, and Decision-Making; PAUL
W. PAESE, University of Missouri-St. Louis; JANET A. SNIEZEK
Software and measurement professionals have demonstrated that estimation
results—which weren’t very close originally—often grow worse when
subjected to competition and pressure to succeed. Measurements, Biases, Judgments: Understanding Variations for Reliable Estimates; Keynote Address -
Sao Paulo, Brazil; Brazilian Software Measurement & Analysis Conference; November 11, 2011; Joe
Schofield
Wait, it could get worse . . .
Joe Schofield: 2012 18

19
Our biases impair our judgment . . .
Confirmation bias: Focus (overweigh) information that confirms our
beliefs
Over-commitment: Pursuing a failing course for ego or credibility
(CEO and prestigious consultant group)
Optimistic over-confidence: Underestimating the difficulty with a
preferred course of action
The First 90 Days; Watkins
Joe Schofield: 2012

In Albuquerque NM, (US) garbage truck drivers were put on an
incentive pay plan; more than $4M was paid to 180 union driver over
six years
20
15 of 24 drivers with the most incentive pay went to the landfill with trucks over
weight limits and had more preventable accidents
Incentives can drive the wrong behavior
Joe Schofield: 2012
Joe Schofield: 2012
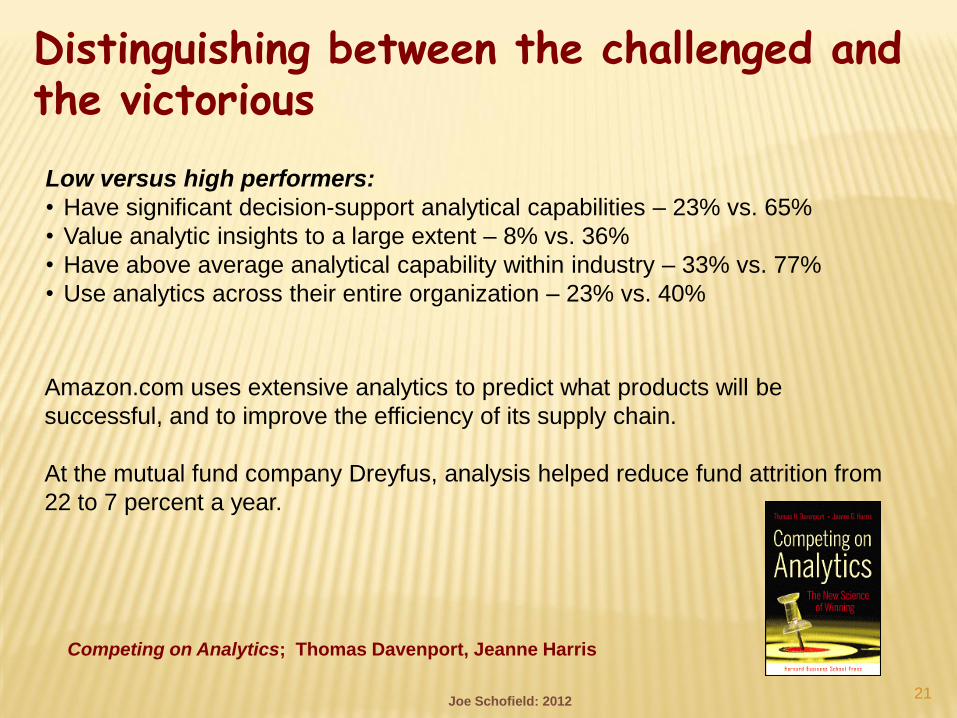
Distinguishing between the challenged and the victorious
Low versus high performers:
• Have significant decision-support analytical capabilities – 23% vs. 65%
• Value analytic insights to a large extent – 8% vs. 36%
• Have above average analytical capability within industry – 33% vs. 77%
• Use analytics across their entire organization – 23% vs. 40%
Competing on Analytics; Thomas Davenport, Jeanne Harris
21
Amazon.com uses extensive analytics to predict what products will be
successful, and to improve the efficiency of its supply chain.
At the mutual fund company Dreyfus, analysis helped reduce fund attrition from
22 to 7 percent a year.

Joe Schofield: 2012
Structured models and frameworks bring hope . . .
From the CMMI-DEV
CMMI for Development; Chrissis, Konrad, Shrum; 2011
22
Related Process Areas:
• M & A
• OPD
• PP
• PMC
• OPP
• OPM
• QPM
PSPSM
TSPSM
CMMI® Organization
Project 1
Person 1 Person 2
Project n
Person n

23
Measurement Repository
Educate
Approximate
Estimate Actuate
Calibrate
At first sign of
requirements
or scope
determination
When requirements are
firm and team is assigned;
when requirements
change beyond volatility
threshold
Throughout the life of the
project – this is monitoring
and controlling; actual vs.
estimated over the phase or
iteration of the project
Upon (release)
completion; actual
vs. estimated
analysis over the
life of the project
Before planning begins,
establish organizational
capability, intent, and
decision needs
Glossary
Estimation and
performance
models
Measurement Lifecycle
Joe Schofield: 2012
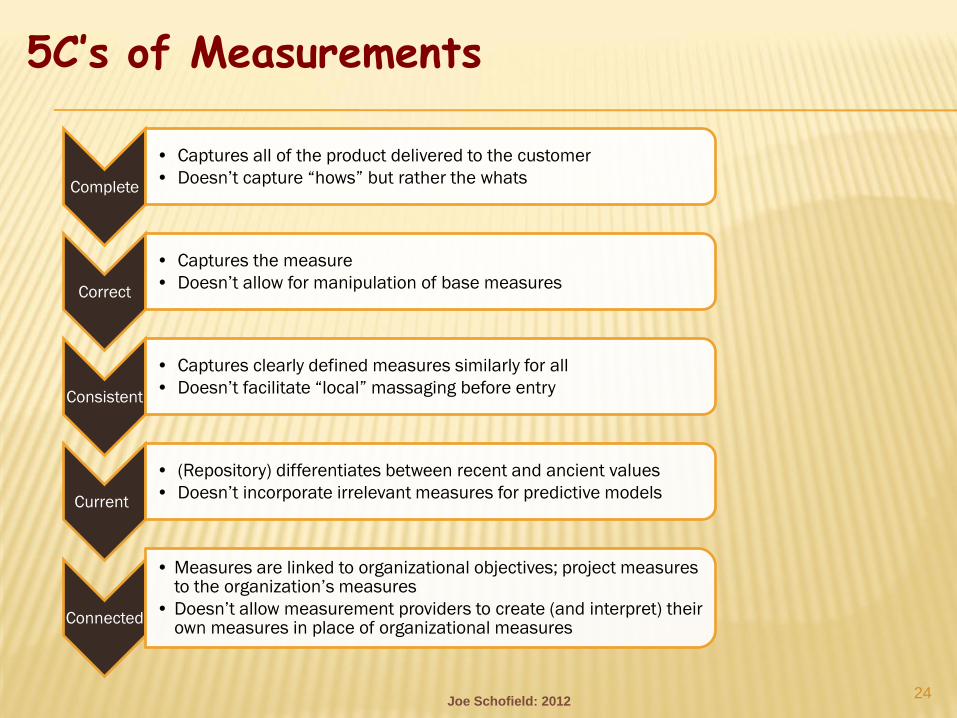
24
Complete
• Captures all of the product delivered to the customer
• Doesn’t capture “hows” but rather the whats
Correct
• Captures the measure
• Doesn’t allow for manipulation of base measures
Consistent
• Captures clearly defined measures similarly for all
• Doesn’t facilitate “local” massaging before entry
Current
• (Repository) differentiates between recent and ancient values
• Doesn’t incorporate irrelevant measures for predictive models
Connected
• Measures are linked to organizational objectives; project measures to the organization’s measures
• Doesn’t allow measurement providers to create (and interpret) their own measures in place of organizational measures
5C’s of Measurements
Joe Schofield: 2012
Joe Schofield: 2012
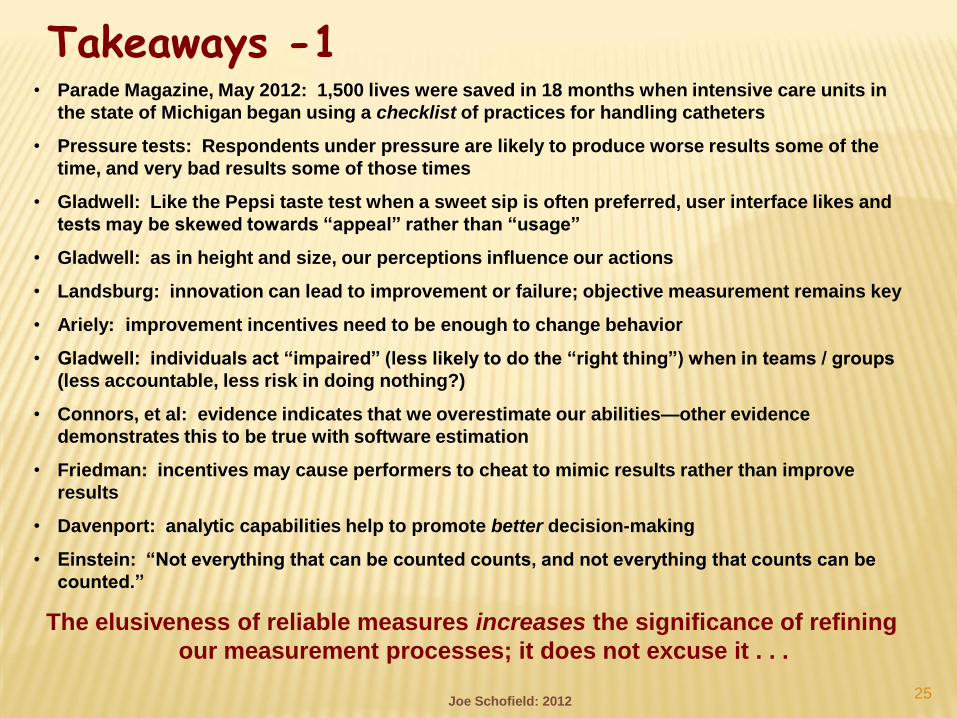
Takeaways -1 • Parade Magazine, May 2012: 1,500 lives were saved in 18 months when intensive care units in
the state of Michigan began using a checklist of practices for handling catheters
• Pressure tests: Respondents under pressure are likely to produce worse results some of the
time, and very bad results some of those times
• Gladwell: Like the Pepsi taste test when a sweet sip is often preferred, user interface likes and
tests may be skewed towards “appeal” rather than “usage”
• Gladwell: as in height and size, our perceptions influence our actions
• Landsburg: innovation can lead to improvement or failure; objective measurement remains key
• Ariely: improvement incentives need to be enough to change behavior
• Gladwell: individuals act “impaired” (less likely to do the “right thing”) when in teams / groups
(less accountable, less risk in doing nothing?)
• Connors, et al: evidence indicates that we overestimate our abilities—other evidence
demonstrates this to be true with software estimation
• Friedman: incentives may cause performers to cheat to mimic results rather than improve
results
• Davenport: analytic capabilities help to promote better decision-making
• Einstein: “Not everything that can be counted counts, and not everything that counts can be
counted.”
The elusiveness of reliable measures increases the significance of refining
our measurement processes; it does not excuse it . . .
25

Joe Schofield: 2012
Obrigado!
(easy) Questions please . . .
26
Thank you to . . .
• Jeni Turgeon, Principle Member of the Technical Staff, Sandia
National Laboratories, for her technical review and comments
• Conference planners for inviting me to spend time here with you
Joe Schofield: 2012 27
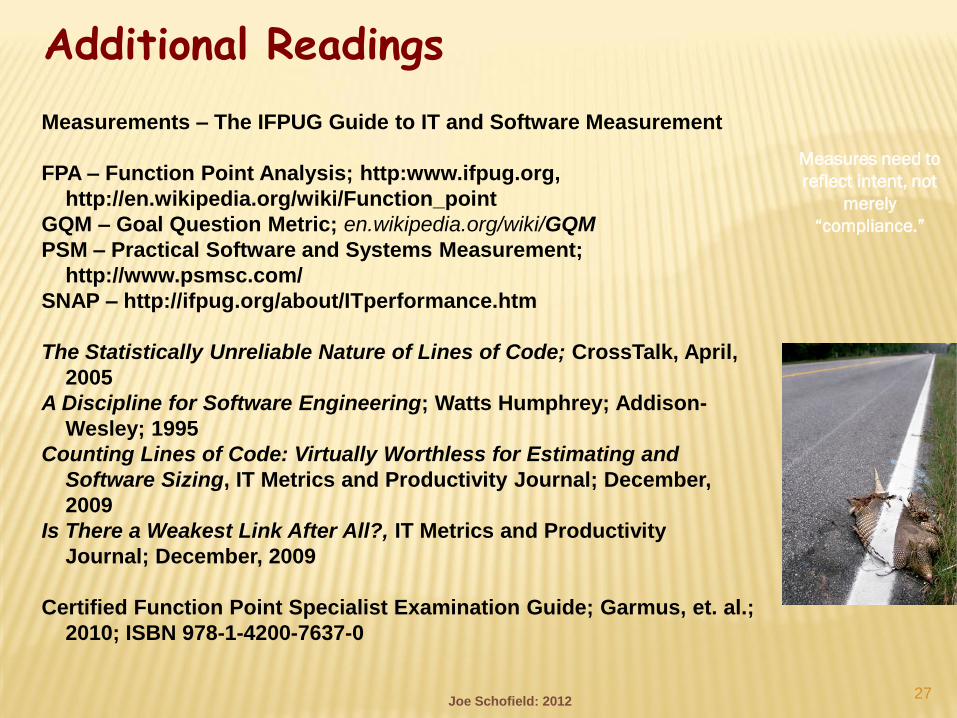
Measurements – The IFPUG Guide to IT and Software Measurement
FPA – Function Point Analysis; http:www.ifpug.org,
http://en.wikipedia.org/wiki/Function_point
GQM – Goal Question Metric; en.wikipedia.org/wiki/GQM
PSM – Practical Software and Systems Measurement;
http://www.psmsc.com/
SNAP – http://ifpug.org/about/ITperformance.htm
The Statistically Unreliable Nature of Lines of Code; CrossTalk, April,
2005
A Discipline for Software Engineering; Watts Humphrey; Addison-
Wesley; 1995
Counting Lines of Code: Virtually Worthless for Estimating and
Software Sizing, IT Metrics and Productivity Journal; December,
2009
Is There a Weakest Link After All?, IT Metrics and Productivity
Journal; December, 2009
Certified Function Point Specialist Examination Guide; Garmus, et. al.;
2010; ISBN 978-1-4200-7637-0
Measures need to
reflect intent, not
merely
“compliance.”
Additional Readings

Joe Schofield: 2012
Selected potential sources of variation in measuring - 2
Notes:
“Forcing” expectations on data
At some point, weight may not reflect activity; perhaps it’s body fat or something else –
expecting to see something that isn’t there isn’t using the data!
Saturday Morning Weigh-ins
28
0
20
40
60
80
100
120
140
160
180
200
1 2 3 4 5 6 7 8 9 10 11 12 13 14 15 16 17 18 19
Weight
Miles


![[Frontinus, R.H. Rodgers (Ed.)] Frontinus de Aqua](https://static.fdocuments.us/doc/165x107/577cdb191a28ab9e78a75160/frontinus-rh-rodgers-ed-frontinus-de-aqua.jpg)

