Measurement-Based Study of the Performance of IEEE … · Measurement-Based Study of the...
6
Measurement-Based Study of the Performance of IEEE 802.11ac in an Indoor Environment Mihaela-Diana Dianu, Janne Riihij¨ arvi, Marina Petrova Institute for Networked Systems, RWTH Aachen University Kackertstrasse 9, D-52072 Aachen, Germany email: [email protected] Abstract—We present results from a measurement-based study of the performance of the emerging IEEE 802.11ac Wi-Fi standard in an indoor environment. The measurements were conducted in a typical office building, and show that for small distances IEEE 802.11ac offers significantly improved perfor- mance compared to IEEE 802.11n. However, these performance improvements were also found to be quite sensitive to channel conditions, with the achieved data rates rapidly declining as the distance between the transmitter and the receiver is increased. We also studied the coexistence properties of IEEE 802.11ac through measurements, observing that adjacent channel interference from legacy Wi-Fi devices can have a severe performance impact. For co-channel interference, the medium access control mechanism of IEEE 802.11ac allows it to share the channel effectively with other Wi-Fi devices. I. I NTRODUCTION The rapid increase in data traffic is imposing ever higher efficiency requirements not only for mobile networks, but for Wi-Fi access points and terminals as well. The rela- tively simple spread spectrum design combined with basic CSMA/CA MAC in IEEE 802.11b has largely been replaced by the OFDM based IEEE 802.11a/g devices over the last decade to accommodate for this increase. The introduction of MIMO in IEEE 802.11n together with further MAC and PHY enhancements have enabled further increases in Wi-Fi system capacities. The work is currently ongoing in the IEEE 802.11ac task group to further improve the efficiency of Wi- Fi networks by incorporating support for multi-user MIMO as well as higher order modulation and coding schemes combined with further MAC layer enhancements [1], [2]. While the work on the IEEE 802.11ac standard amendment is still ongoing, first products based on version 2.0 of the draft standard have already become available in the market. However, despite the availability of IEEE 802.11ac devices, performance evaluation studies for this emerging standard have until now focused almost exclusively on simulations [3]–[8]. In this paper we provide first results from an extensive measurement-based performance evaluation of IEEE 802.11ac access points in a typical office environment. Our main objective is to study whether the extremely high theoretical maximum throughputs are actually achievable in practice, and how severely interference from legacy Wi-Fi systems and other ISM band transmitters degrades the performance of IEEE 802.11ac networks. As was observed already for IEEE 802.11n in several measurement studies (see, for example, [9]–[12]) the large gains from use of MIMO are expected to be heavily dependent on the actual propagation environment, and it is not clear if the high predicted throughputs are achievable even in the absence of interference. The rest of this paper is structured as follows. In Section II we provide a concise overview of the PHY and MAC layer enhancements currently envisioned for IEEE 802.11ac com- pared to the earlier generation Wi-Fi standards. In Section III we describe the measurement setup used, including descrip- tions of the relevant equipment and software as well as the measurement environments. We then present and discuss the results from our measurement campaign in Section IV. We finally conclude the paper in Section V. II. OVERVIEW OF THE IEEE 802.11AC AMENDMENT As currently envisaged, IEEE 802.11ac mainly introduces physical layer changes compared to IEEE 802.11n. Support for 80 MHz channel bandwidths is now mandatory, with options introduced to support 160 MHz bandwidth in either contiguous or discontiguous manner. This also implies that IEEE 802.11ac is supported only on the 5 GHz ISM band, since the maximum available bandwidth in the 2.4 GHz band is insufficient even for the 80 MHz channels (dual band IEEE 802.11ac access points typically operate as IEEE 802.11n devices on the 2.4 GHz band). The highest order modulation type is changed from 64-QAM to 256-QAM, with maximum optional coding rate of 8/9, whereas the mandatory coding rate remains at 5/6. The use of MIMO is also enhanced by increasing the maximum number of supported spatial streams from four to eight, and adding support for multi-user MIMO together with standardized approach to beamforming. In fact the latter was already in place for many IEEE 802.11n devices, but vendor- specific implementations severely hampered interoperability. The combined effect of these changes vastly increased the theoretical maximum throughput compared to IEEE 802.11n. With 256-QAM, coding rate of 5/6 and short guard interval being used, physical layer bitrate of 867 Mbps per spatial stream is achievable. Given the maximum of eight spatial stream supported by IEEE 802.11ac access points, this could result in aggregate physical layer bitrate of 6.7 Gbps in an individual hotspot. Of course, the actual capacity is expected to be much lower, both due to non-idealities in MIMO operation as well as smaller number of antennas expected in typical
Transcript of Measurement-Based Study of the Performance of IEEE … · Measurement-Based Study of the...
Measurement-Based Study of the Performance ofIEEE 802.11ac in an Indoor Environment
Mihaela-Diana Dianu, Janne Riihijarvi, Marina PetrovaInstitute for Networked Systems, RWTH Aachen University
Kackertstrasse 9, D-52072 Aachen, Germanyemail: [email protected]
Abstract—We present results from a measurement-based studyof the performance of the emerging IEEE 802.11ac Wi-Fistandard in an indoor environment. The measurements wereconducted in a typical office building, and show that for smalldistances IEEE 802.11ac offers significantly improved perfor-mance compared to IEEE 802.11n. However, these performanceimprovements were also found to be quite sensitive to channelconditions, with the achieved data rates rapidly declining as thedistance between the transmitter and the receiver is increased. Wealso studied the coexistence properties of IEEE 802.11ac throughmeasurements, observing that adjacent channel interference fromlegacy Wi-Fi devices can have a severe performance impact. Forco-channel interference, the medium access control mechanismof IEEE 802.11ac allows it to share the channel effectively withother Wi-Fi devices.
I. INTRODUCTION
The rapid increase in data traffic is imposing ever higherefficiency requirements not only for mobile networks, butfor Wi-Fi access points and terminals as well. The rela-tively simple spread spectrum design combined with basicCSMA/CA MAC in IEEE 802.11b has largely been replacedby the OFDM based IEEE 802.11a/g devices over the lastdecade to accommodate for this increase. The introductionof MIMO in IEEE 802.11n together with further MAC andPHY enhancements have enabled further increases in Wi-Fisystem capacities. The work is currently ongoing in the IEEE802.11ac task group to further improve the efficiency of Wi-Fi networks by incorporating support for multi-user MIMO aswell as higher order modulation and coding schemes combinedwith further MAC layer enhancements [1], [2]. While the workon the IEEE 802.11ac standard amendment is still ongoing,first products based on version 2.0 of the draft standard havealready become available in the market. However, despite theavailability of IEEE 802.11ac devices, performance evaluationstudies for this emerging standard have until now focusedalmost exclusively on simulations [3]–[8].
In this paper we provide first results from an extensivemeasurement-based performance evaluation of IEEE 802.11acaccess points in a typical office environment. Our mainobjective is to study whether the extremely high theoreticalmaximum throughputs are actually achievable in practice, andhow severely interference from legacy Wi-Fi systems and otherISM band transmitters degrades the performance of IEEE802.11ac networks. As was observed already for IEEE 802.11nin several measurement studies (see, for example, [9]–[12])
the large gains from use of MIMO are expected to be heavilydependent on the actual propagation environment, and it is notclear if the high predicted throughputs are achievable even inthe absence of interference.
The rest of this paper is structured as follows. In Section IIwe provide a concise overview of the PHY and MAC layerenhancements currently envisioned for IEEE 802.11ac com-pared to the earlier generation Wi-Fi standards. In Section IIIwe describe the measurement setup used, including descrip-tions of the relevant equipment and software as well as themeasurement environments. We then present and discuss theresults from our measurement campaign in Section IV. Wefinally conclude the paper in Section V.
II. OVERVIEW OF THE IEEE 802.11AC AMENDMENT
As currently envisaged, IEEE 802.11ac mainly introducesphysical layer changes compared to IEEE 802.11n. Support for80 MHz channel bandwidths is now mandatory, with optionsintroduced to support 160 MHz bandwidth in either contiguousor discontiguous manner. This also implies that IEEE 802.11acis supported only on the 5 GHz ISM band, since the maximumavailable bandwidth in the 2.4 GHz band is insufficient evenfor the 80 MHz channels (dual band IEEE 802.11ac accesspoints typically operate as IEEE 802.11n devices on the2.4 GHz band). The highest order modulation type is changedfrom 64-QAM to 256-QAM, with maximum optional codingrate of 8/9, whereas the mandatory coding rate remains at5/6. The use of MIMO is also enhanced by increasing themaximum number of supported spatial streams from four toeight, and adding support for multi-user MIMO together withstandardized approach to beamforming. In fact the latter wasalready in place for many IEEE 802.11n devices, but vendor-specific implementations severely hampered interoperability.
The combined effect of these changes vastly increased thetheoretical maximum throughput compared to IEEE 802.11n.With 256-QAM, coding rate of 5/6 and short guard intervalbeing used, physical layer bitrate of 867 Mbps per spatialstream is achievable. Given the maximum of eight spatialstream supported by IEEE 802.11ac access points, this couldresult in aggregate physical layer bitrate of 6.7 Gbps in anindividual hotspot. Of course, the actual capacity is expected tobe much lower, both due to non-idealities in MIMO operationas well as smaller number of antennas expected in typical
access points and terminals compared to the numbers neededto support eight spatial streams.
III. MEASUREMENT SETUP
We shall now introduce our measurement setup in detail,first describing the equipment and software used in the mea-surements, followed by the detailed description of the mea-surement environment and layout of measurement locationstherein.
A. Equipment and Software Used
For our tests two Asus RT-AC66U wireless routers wereused. We chose to use two routers, one functioning as anaccess point and another one as a wireless bridge towards acomputer due to the lack of availability of IEEE 802.11accompliant terminals1. The devices are based on BroadcomBCM4360 chipset offering simultaneous three-stream opera-tion based on draft 2.0 of the IEEE 802.11ac amendment. The5 GHz radio comes equipped with a Skyworks SE50003 23dBm power amplifier with power detector.
The Asus RT-AC66U offers the support for all the manda-tory IEEE 802.11ac features, such as the possibility to useup to 80 MHz channel bandwidth, 256-QAM and 802.11accompliant transmit and receive beamforming. It also imple-ments LDPC codes and short guard intervals from the optionalfeatures, and offers up to 1.3 Gbps theoretical aggregatethroughput using three spatial streams. These are supportedby three RP-SMA detachable antennas with a 9 dBi gain. Thedevices can be used in three operating modes. When set up asa wireless router, the device connects directly to the Internetand provides internet network access to connecting clients. Inaccess point mode, the device can connect to a wireless routerthrough an Ethernet cable in order to extend the wireless signalcoverage. Finally, a Media Bridge operating mode can be setup, giving multiple entertainment devices the opportunity touse the fast 802.11ac Wi-Fi connection. In our tests, we usedone Asus device set up as a wireless router and acting as thetransmitter, whereas the second device was set up in mediabridge mode and was acting as a client.
Traffic in our network was generated using Iperf [13], anopen-source traffic generation software running on multipleplatforms. It is a commonly used tool for network testing thatcan create both TCP and UDP data streams and measuresthe end-to-end achievable throughput together with delaystatistics. When used in UDP mode, Iperf allows the userto specify the datagram size and provides the results fordatagram throughput and packet error rate, whereas whenrunning in TCP mode, Iperf measures the throughput for thegiven payload size. In our tests, we mainly used the UDPmode. As TCP uses end-to-end congestion control mechanismsfor managing the sending rate, the results presented heretherefore give upper bounds on the expected TCP performanceover IEEE 802.11ac links, but actually achieved throughput
1Only at the time of writing smart phones supporting the emerging standardare becoming available, together with the first laptops
can remain significantly lower with details heavily dependingon the channel conditions and the TCP version used.
In order to capture the packets sent between the two802.11ac devices, we used Wireshark [14], an open-sourcepacket analyzer used for network troubleshooting and analysis.Wireshark enables detailed logging of network traffic, and forour tests we were particularly interested in the packet number,time stamp information, identification flag of the IP packet andthe fragment offset. This information allowed us to keep trackof the sent and received packets, enabling us to calculate thethroughout and packet error rate and see the behavior of erroroccurrence in the IEEE 802.11ac network.
To monitor the 5 GHz ISM band and to ensure there wasno unwanted source of interference at the time or our mea-surements, we used the WiSpy DBx, a portable USB spectrumanalyzer. In order to generate interference we used two differ-ent approaches. First, an AirHorn dual-band signal generatorwas used to generate interference on various channels of the5 GHz band. The AirHorn operates on 20 MHz wide channels,has a transmit power of 17 dBm, and is capable to work inthree transmission modes, generating traffic either on a singlechannel, all channels in the frequency band sequentially, ortransmit pulses at regular intervals. Second test scenario wasthen focused on the impact of legacy devices on the IEEE802.11ac network performance. For this purpose we set up anetwork using IEEE 802.11n capable devices and generatedtraffic at different data link rates using Iperf. We chose anAsus RT-N56U wireless router as the transmitter connected toa PC, and the client was another PC equipped with an AsusUSB N53 Dual-Band WLAN Adapter. The control channel ofthe IEEE 802.11n network was set to channel 44, same as thecontrol channel of the IEEE 802.11ac network. The bandwidthof the IEEE 802.11n network was set to 40 MHz.
B. Measurement Environment and Configuration Summary
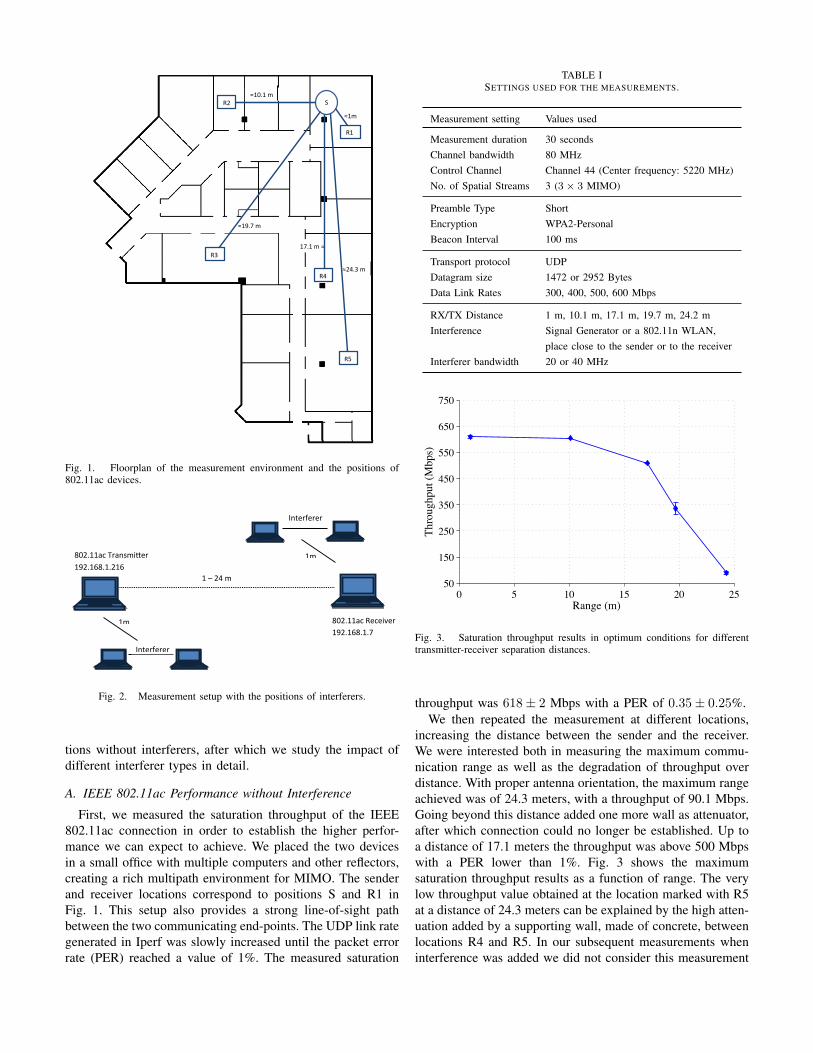
The measurements were conducted in a typical office build-ing of the RWTH Aachen University, with individual officescombined with lecture rooms and computer laboratory rooms,all separated by a mixture of soft partitions and supportingwalls. The measurement setup and the positions of the Asusrouters are shown in Fig. 1. In the figure “S” denotes theposition of the wireless router acting as the sender, whereas thepoints denoted by “R” represent the different positions chosenfor the receiver. In order to maintain a uniform configurationbetween different test scenarios, the same locations and ori-entations in a given receiver position were used throughoutall measurements. For measurements with interference, theinterfering devices were placed either close to the 802.11actransmitter or receiver, respectively, at a distance of 1m. Theoverall test setup with interferers is shown in Fig. 2. Themeasurement configurations used are summarized in Table I.
IV. RESULTS
In this section we present the results from our measurementcampaign. We first focus on achievable performance in condi-
4.4. MEASUREMENT SETUP AND TOOLS 47
17.1 m у
у24.3 m
у19.7 m
у10.1 m
у1m
S
R1
R2
R3
R4
R5
Figure 4.3: Floorplan of the office environment and the positions of 802.11ac devices.
both TCP and UDP data streams and measures the end-to-end achievable throughput.Iperf approximates the end-to-end achievable throughput to the cumulative band-width, i.e. the total data transferred between the end devices taken over the totaltransmission time. When it uses UDP transmission, Iperf allows the user to spec-ify the datagram size and provides the results for datagram throughput and packeterror rate, whereas when running in TCP mode, Iperf measures the throughput ofthe payload. In our tests, we decided to generate traffic using UDP over IP. TCPuses end-to-end control mechanisms establishing a bi-directional link for traffic, thusproducing complex results. UDP on the other hand is able to send datagrams fromone communicating end point to the other without the need for prior communicationset up. It uses a simple transmission model with a minimum protocol mechanism andprovides lower overhead because processing of error check or correction is not neededat the network interface level.
In order to capture the packets sent between the two 802.11ac devices, we usedWireshark, an open-source packet analyzer used for network troubleshooting and anal-
Fig. 1. Floorplan of the measurement environment and the positions of802.11ac devices.
4.4. MEASUREMENT SETUP AND TOOLS 49
ference at the time or our measurements, we used the WiSpy DBx, a portable USBspectrum analyzer and the Chanalyzer software.
In order to generate interference we used two different test scenarios. In our firstscenario an AirHorn Dual-Band Signal Generator was used to generate interferenceon various channels of the 5 Ghz band. The AirHorn operates on 20 Mhz wide chan-nels. It has a transmit power of 17 dBm and is capable to work in three transmissionmodes, generating traffic either on a single channel, all channels in the frequency bandsequentially or transmit pulses at regular intervals. The pulse intervals, as well as thechannels to generate traffic on and the operating mode can be set up in the device’suser interface.
Different test scenarios were implemented. The Signal Generator’s transmissionchannel was switch between channels 36, 44 and 52. Also the duration of the interfer-ence was varied for 5 s, 10 s and 30 s, respectively.
Our second test scenario was focused on the impact legacy devices have on the802.11ac network performance. For this purpose we set up a network using IEEE802.11n capable devices and generated traffic at different data link rates using Iperf.We chose an Asus RT-N56U wireless router as the transmitter connected to a PC withan Atheros L1 Gigabit Ethernet adapter and the client was another PC equipped withan Asus USB N53 Dual-Band WLAN Adapter. The control channel of the 802.11nnetwork was set up to be channel 44, same as the control channel of the 802.11acnetwork. The bandwidth was set to 40 Mhz and the interference duration was set upto be as long as the 802.11ac transmission.
In both cases we tested the impact of interference when the interfering devices areplaced either close to the 802.11ac transmitter or receiver, respectively, at a distance of1m. The test setup is showed in Figure 4.5.
1m
1m
802.11ac TransmŝƩer 192.168.1.216
802.11ac Receiver 192.168.1.7
Interferer
Interferer
1 – 24 m
Figure 4.5: Measurement setup with positions of interference and IP addresses usedin the 802.11ac WLAN.
4.4.1 Further Notes on Test Implementation
Most of the measurements have been done during a normal working day when therewas a lot of movement in the office. Sometimes measurements had to be retaken to
Fig. 2. Measurement setup with the positions of interferers.
tions without interferers, after which we study the impact ofdifferent interferer types in detail.
A. IEEE 802.11ac Performance without Interference
First, we measured the saturation throughput of the IEEE802.11ac connection in order to establish the higher perfor-mance we can expect to achieve. We placed the two devicesin a small office with multiple computers and other reflectors,creating a rich multipath environment for MIMO. The senderand receiver locations correspond to positions S and R1 inFig. 1. This setup also provides a strong line-of-sight pathbetween the two communicating end-points. The UDP link rategenerated in Iperf was slowly increased until the packet errorrate (PER) reached a value of 1%. The measured saturation
TABLE ISETTINGS USED FOR THE MEASUREMENTS.
Measurement setting Values used
Measurement duration 30 secondsChannel bandwidth 80 MHzControl Channel Channel 44 (Center frequency: 5220 MHz)No. of Spatial Streams 3 (3× 3 MIMO)
Preamble Type ShortEncryption WPA2-PersonalBeacon Interval 100 ms
Transport protocol UDPDatagram size 1472 or 2952 BytesData Link Rates 300, 400, 500, 600 Mbps
RX/TX Distance 1 m, 10.1 m, 17.1 m, 19.7 m, 24.2 mInterference Signal Generator or a 802.11n WLAN,
place close to the sender or to the receiverInterferer bandwidth 20 or 40 MHz
5.1. OPTIMUM CONDITIONS AND
SATURATION THROUGHPUT MEASUREMENTS 53
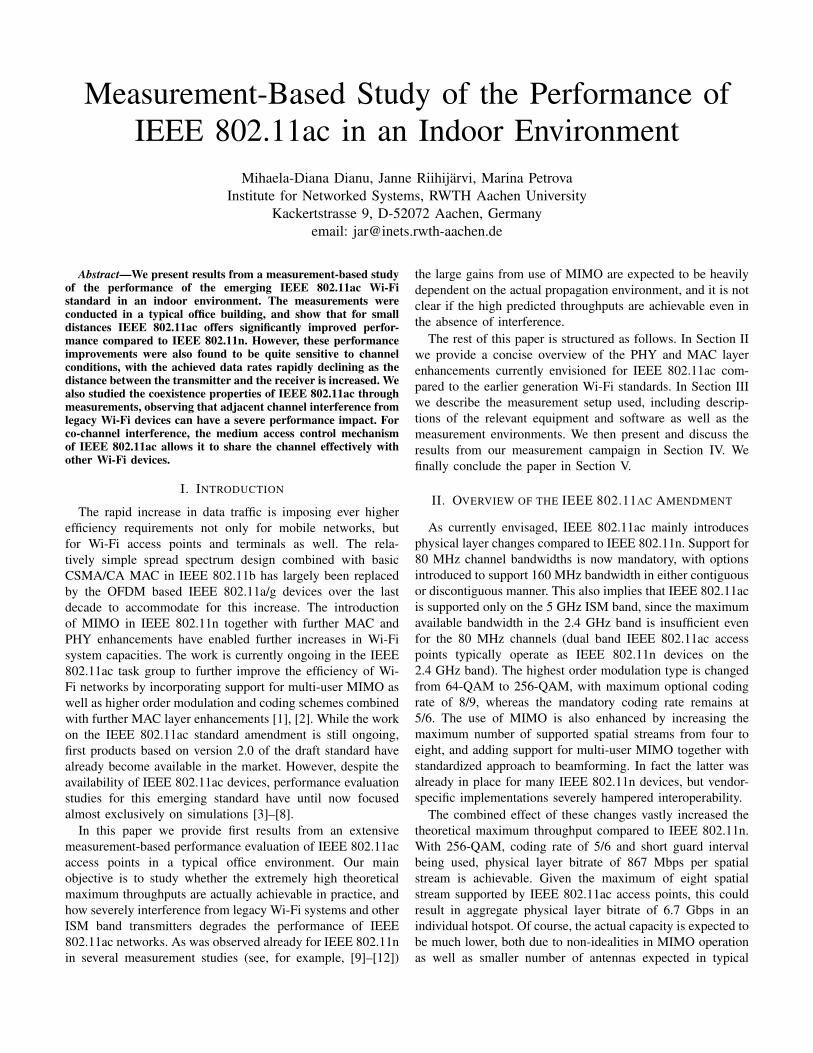
ment. We were interested in measuring the maximum communication range and alsothe maximum range that guarantees a very high throughput. With proper antennaorientation, the maximum range achieved was of 24.3 meters, with a throughput of90.1 Mbps. Up to a distance of 17.1 meters the throughput was above 500 Mbpswith a PER lower than 1%. Figure 5.1 shows the maximum saturation throughputresults as a function of range. The very low throughput value obtained at the locationmarked with R5 (Figure 4.3) at a distance of 24.3 meters can be explained by thehigh attenuation added by the separation wall (made of concrete) between locationsR4 and R5. In our subsequent measurements when interference was added we didnot consider this measurement location further, since the communication link wascompletely lost when other interference sources were present in the 5 Ghz band.
0 5 10 15 20 2550
150
250
350
450
550
650
750
Range (m)
Thro
ughp
ut (M
bps)
Figure 5.1: Saturation throughput results in Optimum Conditions. No externalinterference. Packet Error Rate lower than 1%.
Based on these measurements we can draw conclusions regarding the optimaldata link rates that amount for the highest throughput and the minimum packet lossdepending on the distance between client and access point. Up to a distance of 10meters a link rate of 600 Mbps can be used resulting in a packet loss of less then 1%,whereas at a distance of 17 meters the optimum data link rate drops to 500 Mbpsand to 400 Mbps at 19.7 meters, respectively. Results obtained for transmissions withdifferent link rates and at various locations are summarized in Table A.1.
Unlike our measurement setup, in a real WLAN deployment, multiple access points(APs) serving multiple clients at the same time in a given area exist. Using our resultsfrom Figure 5.1, system capacity can be calculated for an entire WLAN system com-prised of multiple cells. The average cell throughput represents the average value thata mobile client will achieve at any location inside the cell. According to our results,the average cell throughput for an 802.11ac cell with the radius of 19.7 meters is 502.3
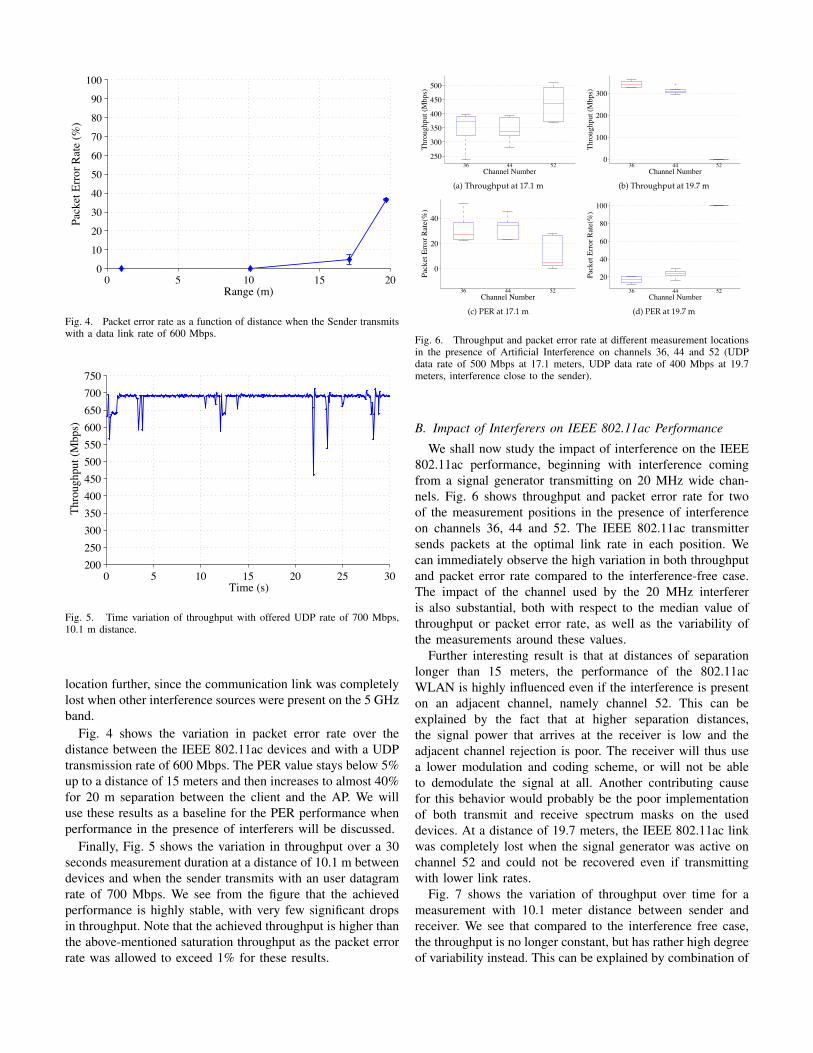
Fig. 3. Saturation throughput results in optimum conditions for differenttransmitter-receiver separation distances.
throughput was 618± 2 Mbps with a PER of 0.35± 0.25%.We then repeated the measurement at different locations,
increasing the distance between the sender and the receiver.We were interested both in measuring the maximum commu-nication range as well as the degradation of throughput overdistance. With proper antenna orientation, the maximum rangeachieved was of 24.3 meters, with a throughput of 90.1 Mbps.Going beyond this distance added one more wall as attenuator,after which connection could no longer be established. Up toa distance of 17.1 meters the throughput was above 500 Mbpswith a PER lower than 1%. Fig. 3 shows the maximumsaturation throughput results as a function of range. The verylow throughput value obtained at the location marked with R5at a distance of 24.3 meters can be explained by the high atten-uation added by a supporting wall, made of concrete, betweenlocations R4 and R5. In our subsequent measurements wheninterference was added we did not consider this measurement
5.1. OPTIMUM CONDITIONS AND
SATURATION THROUGHPUT MEASUREMENTS 54
0 5 10 15 200
10
20
30
40
50
60
70
80
90
100
Range (m)
Pack
et E
rror
Rat
e (%
)
Figure 5.2: Packet Error Rate as a function of distance when the Sender transmits witha data link rate of 600 Mbps. No external interference.
Mbps. For a cell radius of 24.3 meters, the average cell throughput would be 354.07Mbps.
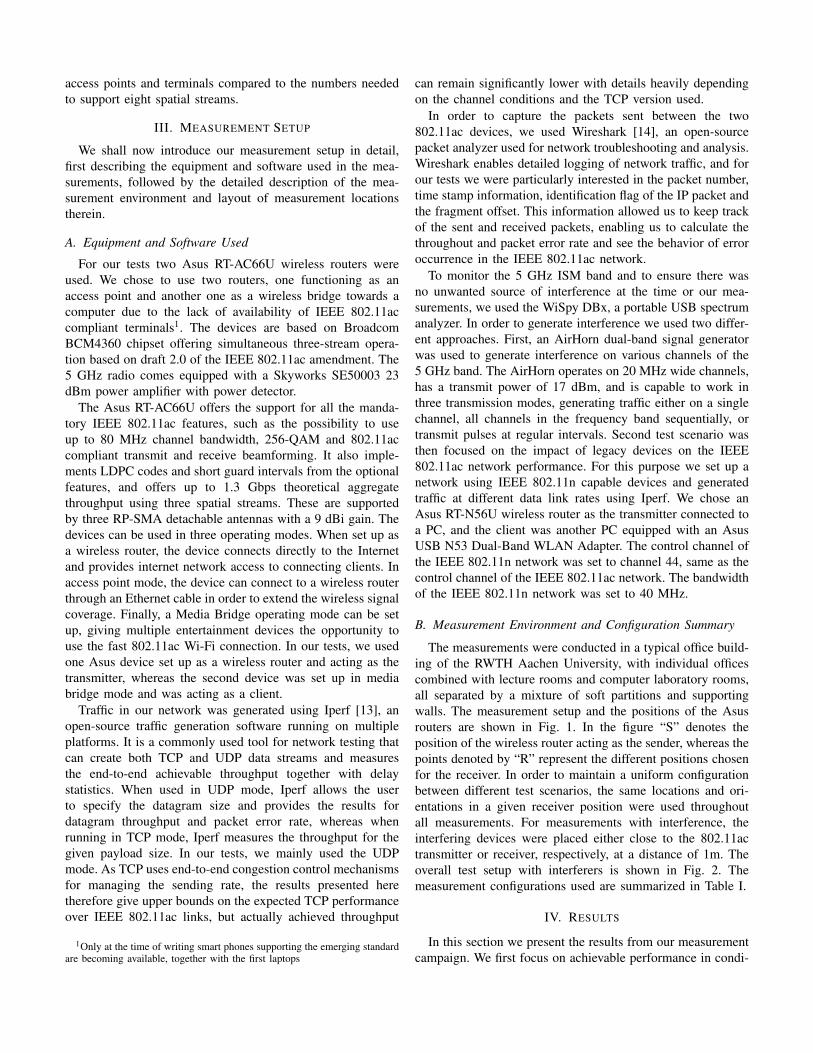
Figure 5.2 represents the variation in packet error rate with increased range be-tween the 802.11ac devices and with a transmission UDP transmission rate of 600Mbps. The PER value stays below 5% up to a distance of 15 meters and increasesto almost 40% at 20 meters separation between the client and AP. We will use it as abaseline for the PER performance when results in the presence of interference will bediscussed.
Figure 5.3 displays the variations of throughput and packet error rate over a 30seconds measurement duration at a distance of 1 meter between devices and whenthe sender transmits with an user datagram rate of 700 Mbps. The behavior of packetreception and error occurrence over the measurement time, as well as the probabilitydistribution of packet error rate and burst error length are shown. Similar results arepresented in Figure 5.4 and Figure 5.5 for 10 and 19 meters distances, respectively.
It can be seen that in the lack of any exterior interference the 802.11ac WLAN hasa high performance compared to networks based on earlier IEEE 802.11 standards. Inwireless networks, errors occur most of the time in bursts. at short distance, the meanburst error length is 40 packets and the median value of correctly received packetsbetween each error occurrence is 900. At increased distance, the error burst lengthincreases and the burst length of correctly received packets has a higher variation.Starting from a distance of 19.7 meters, a noticeable performance degradation of the802.11ac network can be seen. The optimum data link rate drops at 400 Mbps and thethroughput value varies between 300 and 400 Mbps, respectively. The median valueof correctly received packets is halved.
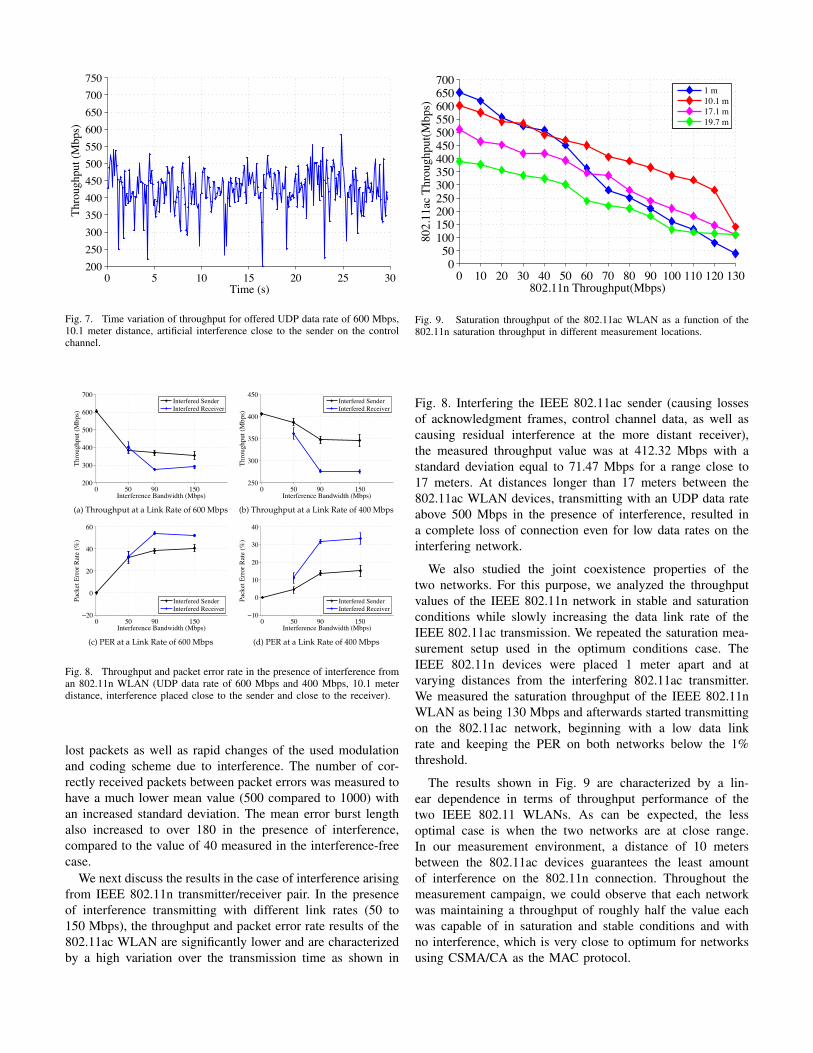
Fig. 4. Packet error rate as a function of distance when the Sender transmitswith a data link rate of 600 Mbps.
5.1. OPTIMUM CONDITIONS AND
SATURATION THROUGHPUT MEASUREMENTS 56
0 5 10 15 20 25 30200250300350400450500550600650700750
Time (s)
Thro
ughp
ut (M
bps)
(a) Throughput
0 5 10 15 20 25 300
102030405060708090
100
Time (s)
Pack
et E
rror
Rat
io (%
)
(b) Packet Error Rate
0 5 10 15 20 25 3015001000500
0500
100015002000250030003500
Num
ber o
f Rec
eive
d/Lo
st P
acke
ts
Time (s)
ReceivedLost
(c) Packet Loss Occurrence
0 20 40 60 80 1000
50
100
150
200
250
PER (%)
Prob
abili
ty D
ensi
ty
(d) PER Probability Distribution
0 90 180 270 360 4500
1200
2400
3600
4800
6000
Prob
abili
ty D
ensi
ty
Error Burst Length
(e) Error Burst Length PDF
Figure 5.4: Time variation of Throughput and Packet Error Rate; Behavior of packetreception and packet loss in time; Probability density function of the PER and errorburst length (UDP rate of 700 Mbps, 10.1 m distance, no interference).
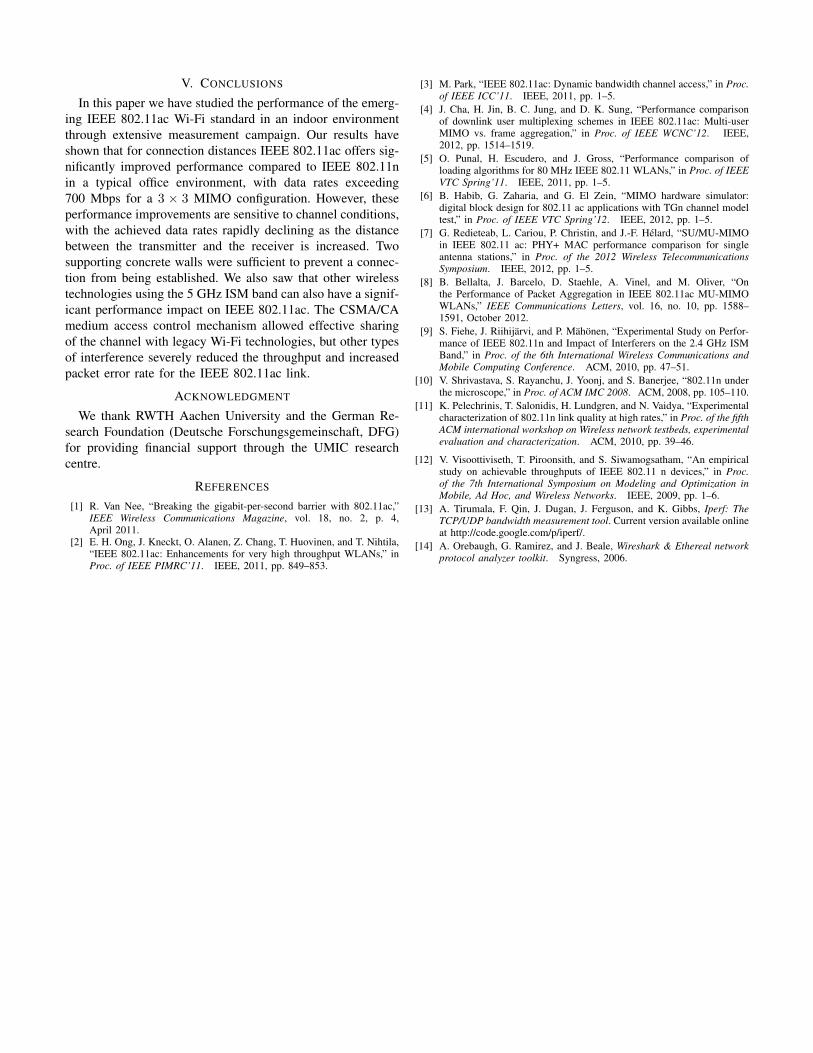
Fig. 5. Time variation of throughput with offered UDP rate of 700 Mbps,10.1 m distance.
location further, since the communication link was completelylost when other interference sources were present on the 5 GHzband.
Fig. 4 shows the variation in packet error rate over thedistance between the IEEE 802.11ac devices and with a UDPtransmission rate of 600 Mbps. The PER value stays below 5%up to a distance of 15 meters and then increases to almost 40%for 20 m separation between the client and the AP. We willuse these results as a baseline for the PER performance whenperformance in the presence of interferers will be discussed.
Finally, Fig. 5 shows the variation in throughput over a 30seconds measurement duration at a distance of 10.1 m betweendevices and when the sender transmits with an user datagramrate of 700 Mbps. We see from the figure that the achievedperformance is highly stable, with very few significant dropsin throughput. Note that the achieved throughput is higher thanthe above-mentioned saturation throughput as the packet errorrate was allowed to exceed 1% for these results.
5.2. EFFECTS OF INTERFERENCE 60
250
300
350
400
450
500
36 44 52Channel Number
Thro
ughp
ut (M
bps)
(a) Throughput at 17.1 m
0
100
200
300
36 44 52Channel Number
Thro
ughp
ut (M
bps)
(b) Throughput at 19.7 m
0
20
40
36 44 52Channel Number
Pack
et E
rror
Rat
e(%
)
(c) PER at 17.1 m
20
40
60
80
100
36 44 52Channel Number
Pack
et E
rror
Rat
e(%
)
(d) PER at 19.7 m
Figure 5.8: Throughput and Packet Error Rate at different measurement locations inthe presence of Artificial Interference on channels 36, 44 and 52 (UDP data rate of 500Mbps at 17.1 meters, UDP data rate of 400 Mbps at 19.7 meters, interference close tothe sender, interference interval equal to the 802.11ac transmission duration).
use a lower modulation and coding scheme, or will even be unable to demodulate thesignal at all. Another motivation for this behavior could be the poor implementationof both transmit and receive spectrum masks on the used devices. This could beseen at measurement points placed more than 17 meters away from the transmitterand when the interference time is equal to the 802.11ac transmission (see Table B.2).At a distance of 19.7 meters, the 802.11ac link was lost completely lost when thesignal generator was active on channel 52 throughout the whole 802.11ac 30 secondtransmission (Figure 5.8b) and could not be recovered even if transmitting with lowerlink rates.
We were also interested to measure the impact of various interference intervals.For this purpose we programmed the signal generator to continuously transmit for5, 10 and 30 seconds, respectively. 30 seconds was also the duration the 802.11actransmission.
Table 5.1 summarizes the results obtained in all measurement locations when the802.11ac sender transmits at the optimum link rate calculated in the interference-free scenario and when interference of different duration is present on the controlchannel. Results in the case when the interferer transmits on the other two channelscan be found in Table B.1 and Table B.2, respectively. In the presence of short term
Fig. 6. Throughput and packet error rate at different measurement locationsin the presence of Artificial Interference on channels 36, 44 and 52 (UDPdata rate of 500 Mbps at 17.1 meters, UDP data rate of 400 Mbps at 19.7meters, interference close to the sender).
B. Impact of Interferers on IEEE 802.11ac Performance
We shall now study the impact of interference on the IEEE802.11ac performance, beginning with interference comingfrom a signal generator transmitting on 20 MHz wide chan-nels. Fig. 6 shows throughput and packet error rate for twoof the measurement positions in the presence of interferenceon channels 36, 44 and 52. The IEEE 802.11ac transmittersends packets at the optimal link rate in each position. Wecan immediately observe the high variation in both throughputand packet error rate compared to the interference-free case.The impact of the channel used by the 20 MHz interfereris also substantial, both with respect to the median value ofthroughput or packet error rate, as well as the variability ofthe measurements around these values.
Further interesting result is that at distances of separationlonger than 15 meters, the performance of the 802.11acWLAN is highly influenced even if the interference is presenton an adjacent channel, namely channel 52. This can beexplained by the fact that at higher separation distances,the signal power that arrives at the receiver is low and theadjacent channel rejection is poor. The receiver will thus usea lower modulation and coding scheme, or will not be ableto demodulate the signal at all. Another contributing causefor this behavior would probably be the poor implementationof both transmit and receive spectrum masks on the useddevices. At a distance of 19.7 meters, the IEEE 802.11ac linkwas completely lost when the signal generator was active onchannel 52 and could not be recovered even if transmittingwith lower link rates.
Fig. 7 shows the variation of throughput over time for ameasurement with 10.1 meter distance between sender andreceiver. We see that compared to the interference free case,the throughput is no longer constant, but has rather high degreeof variability instead. This can be explained by combination of
5.2. EFFECTS OF INTERFERENCE 63
0 5 10 15 20 25 30200250300350400450500550600650700750
Time (s)
Thro
ughp
ut (M
bps)
(a) Throughput
0 5 10 15 20 25 300
102030405060708090
100
Time (s)
Pack
et E
rror
Rat
io (%
)
(b) Packet Error Rate
0 5 10 15 20 25 3015001000
5000
500100015002000250030003500
Num
ber o
f Rec
eive
d/Lo
st P
acke
ts
Time (s)
ReceivedLost
(c) Packet Loss Occurrence
0 20 40 60 80 1000
20
40
60
80
100
PER (%)
Prob
abili
ty D
ensi
ty
(d) PER Probability Distribution
0 90 180 270 360 4500
1400
2800
4200
5600
7000
Prob
abili
ty D
ensi
ty
Error Burst Length
(e) Error Burst Length PDF
Figure 5.10: Time variation of Throughput and Packet Error Rate; Behavior of packetreception and packet loss in time; Probability density function of the PER and errorburst length (UDP data rate of 600 Mbps, 10.1 meter distance, artificial interferenceclose to the sender on the control channel, interference duration 30 seconds).
Fig. 7. Time variation of throughput for offered UDP data rate of 600 Mbps,10.1 meter distance, artificial interference close to the sender on the controlchannel.
5.2. EFFECTS OF INTERFERENCE 65
0 50 90 150200
300
400
500
600
700
Interference Bandwidth (Mbps)
Thro
ughp
ut (M
bps)
Interfered SenderInterfered Receiver
(a) Throughput at a Link Rate of 600 Mbps
0 50 90 150250
300
350
400
450
Interference Bandwidth (Mbps)
Thro
ughp
ut (M
bps)
Interfered SenderInterfered Receiver
(b) Throughput at a Link Rate of 400 Mbps
0 50 90 150−20
0
20
40
60
Interference Bandwidth (Mbps)
Pack
et E
rror
Rat
e (%
)
Interfered SenderInterfered Receiver
(c) PER at a Link Rate of 600 Mbps
0 50 90 150−10
0
10
20
30
40
Interference Bandwidth (Mbps)
Pack
et E
rror
Rat
e (%
)
Interfered SenderInterfered Receiver
(d) PER at a Link Rate of 400 Mbps
Figure 5.12: Throughput and Packet Error Rate in the presence of interference froman 802.11n WLAN (UDP Data Rate of 600 Mbps and 400 Mbps, 10.1 meter distance,interference placed close to the sender and close to the receiver).
distances longer than 17 meters between the 802.11ac WLAN devices, transmittingwith an UDP data rate above 500 Mbps in the presence of interference, results ina complete loss of connection even for low data rates on the interfering network.This was solved by decreasing the transmission link rate as in the case of artificialinterference.
Even at short distances between the 802.11ac communicating devices, the mini-mum packet error rate value was 10%. Increasing the distance and also the amountof interference will result in even higher packet error rates. The lowest performanceof interfering the 802.11ac sender was obtained when the client was 19.7 meters away.The PER value in this location was of 50% with an achievable throughput of 250 Mbpsand a standard deviation of almost 30 Mbps.
One first conclusion can be in terms of the compromise between the link rateof the transmitter and the resulting performance. In the presence of interferencecoming from legacy devices, the achieved throughput was below 500 Mbps even atclose range and at low interfering values. Transmitting thus with a lower data ratewould result in a lower packet loss ratio. From the user point of view, this can ofcourse be less desirable, but it ensures a stable connection for applications requiring
Fig. 8. Throughput and packet error rate in the presence of interference froman 802.11n WLAN (UDP data rate of 600 Mbps and 400 Mbps, 10.1 meterdistance, interference placed close to the sender and close to the receiver).
lost packets as well as rapid changes of the used modulationand coding scheme due to interference. The number of cor-rectly received packets between packet errors was measured tohave a much lower mean value (500 compared to 1000) withan increased standard deviation. The mean error burst lengthalso increased to over 180 in the presence of interference,compared to the value of 40 measured in the interference-freecase.
We next discuss the results in the case of interference arisingfrom IEEE 802.11n transmitter/receiver pair. In the presenceof interference transmitting with different link rates (50 to150 Mbps), the throughput and packet error rate results of the802.11ac WLAN are significantly lower and are characterizedby a high variation over the transmission time as shown in
5.2. EFFECTS OF INTERFERENCE 67
pattern is more random. The number of correctly received packets during error oc-currence does rarely jump the threshold of 500 packets, whereas the error burst lengthis often higher than 400 packets when distance is increased.
One bottom line conclusion we can draw from the real case interference mea-surements is that the 802.11ac network’s performance is significantly impacted bysharing the medium with legacy Wi-Fi certified devices. The measured throughputvalues are much lower than the theoretical throughput values specified by the IEEE802.11ac amendment. Despite of that and considering the less than ideal measurementenvironment and interference, the overall achieved throughput performance is stillmuch higher than the performance of current Wi-Fis.
5.2.3 IEEE 802.11ac Impact on Legacy IEEE 802.11 Devices
Considering all the performance results discussed so far, an interesting idea to analyzefurther would be in terms of the impact the new IEEE 802.11ac WLAN had on existinglegacy Wi-Fi devices performance. For this purpose, we analyzed the throughput val-ues of the 802.11n network in stable and saturation conditions while slowly increasingthe data link rate of the 802.11ac transmission.
We repeated the saturation measurement setup used in the optimum conditionscase. The 802.11n devices were placed 1 meter apart and at a distance of 1 meter fromthe interfering 802.11ac transmitter. We measured the saturation throughput of the802.11n WLAN as being 130 Mbps and afterwards started transmitting on the 802.11acnetwork, beginning with a low data link rate and keeping the PER on both networksbelow the 1% threshold.
The results are characterized by a linear dependence in terms of throughput per-formance of the two 802.11 WLANs. As it can be expected, the less optimal case iswhen the two 802.11 networks are at close range. In our measurement environment,a distance of 10 meters between the 802.11ac devices guarantees the least amount ofinterference on the 802.11n connection. Throughout the measurement campaign, wecould observe that each network was maintaining a throughput of half the value eachwas capable of in saturation and stable conditions and with no interference.
0 10 20 30 40 50 60 70 80 90 100 110 120 1300
50100150200250300350400450500550600650700
802.11n Throughput(Mbps)
802.
11ac
Thr
ough
put(M
bps)
1 m10.1 m17.1 m19.7 m
Figure 5.14: Saturation Throughput of the 802.11ac WLAN as a function of the 802.11nSaturation Throughput in different measurement locations
Fig. 9. Saturation throughput of the 802.11ac WLAN as a function of the802.11n saturation throughput in different measurement locations.
Fig. 8. Interfering the IEEE 802.11ac sender (causing lossesof acknowledgment frames, control channel data, as well ascausing residual interference at the more distant receiver),the measured throughput value was at 412.32 Mbps with astandard deviation equal to 71.47 Mbps for a range close to17 meters. At distances longer than 17 meters between the802.11ac WLAN devices, transmitting with an UDP data rateabove 500 Mbps in the presence of interference, resulted ina complete loss of connection even for low data rates on theinterfering network.
We also studied the joint coexistence properties of thetwo networks. For this purpose, we analyzed the throughputvalues of the IEEE 802.11n network in stable and saturationconditions while slowly increasing the data link rate of theIEEE 802.11ac transmission. We repeated the saturation mea-surement setup used in the optimum conditions case. TheIEEE 802.11n devices were placed 1 meter apart and atvarying distances from the interfering 802.11ac transmitter.We measured the saturation throughput of the IEEE 802.11nWLAN as being 130 Mbps and afterwards started transmittingon the 802.11ac network, beginning with a low data linkrate and keeping the PER on both networks below the 1%threshold.
The results shown in Fig. 9 are characterized by a lin-ear dependence in terms of throughput performance of thetwo IEEE 802.11 WLANs. As can be expected, the lessoptimal case is when the two networks are at close range.In our measurement environment, a distance of 10 metersbetween the 802.11ac devices guarantees the least amountof interference on the 802.11n connection. Throughout themeasurement campaign, we could observe that each networkwas maintaining a throughput of roughly half the value eachwas capable of in saturation and stable conditions and withno interference, which is very close to optimum for networksusing CSMA/CA as the MAC protocol.
V. CONCLUSIONS
In this paper we have studied the performance of the emerg-ing IEEE 802.11ac Wi-Fi standard in an indoor environmentthrough extensive measurement campaign. Our results haveshown that for connection distances IEEE 802.11ac offers sig-nificantly improved performance compared to IEEE 802.11nin a typical office environment, with data rates exceeding700 Mbps for a 3 × 3 MIMO configuration. However, theseperformance improvements are sensitive to channel conditions,with the achieved data rates rapidly declining as the distancebetween the transmitter and the receiver is increased. Twosupporting concrete walls were sufficient to prevent a connec-tion from being established. We also saw that other wirelesstechnologies using the 5 GHz ISM band can also have a signif-icant performance impact on IEEE 802.11ac. The CSMA/CAmedium access control mechanism allowed effective sharingof the channel with legacy Wi-Fi technologies, but other typesof interference severely reduced the throughput and increasedpacket error rate for the IEEE 802.11ac link.
ACKNOWLEDGMENT
We thank RWTH Aachen University and the German Re-search Foundation (Deutsche Forschungsgemeinschaft, DFG)for providing financial support through the UMIC researchcentre.
REFERENCES
[1] R. Van Nee, “Breaking the gigabit-per-second barrier with 802.11ac,”IEEE Wireless Communications Magazine, vol. 18, no. 2, p. 4,April 2011.
[2] E. H. Ong, J. Kneckt, O. Alanen, Z. Chang, T. Huovinen, and T. Nihtila,“IEEE 802.11ac: Enhancements for very high throughput WLANs,” inProc. of IEEE PIMRC’11. IEEE, 2011, pp. 849–853.
[3] M. Park, “IEEE 802.11ac: Dynamic bandwidth channel access,” in Proc.of IEEE ICC’11. IEEE, 2011, pp. 1–5.
[4] J. Cha, H. Jin, B. C. Jung, and D. K. Sung, “Performance comparisonof downlink user multiplexing schemes in IEEE 802.11ac: Multi-userMIMO vs. frame aggregation,” in Proc. of IEEE WCNC’12. IEEE,2012, pp. 1514–1519.
[5] O. Punal, H. Escudero, and J. Gross, “Performance comparison ofloading algorithms for 80 MHz IEEE 802.11 WLANs,” in Proc. of IEEEVTC Spring’11. IEEE, 2011, pp. 1–5.
[6] B. Habib, G. Zaharia, and G. El Zein, “MIMO hardware simulator:digital block design for 802.11 ac applications with TGn channel modeltest,” in Proc. of IEEE VTC Spring’12. IEEE, 2012, pp. 1–5.
[7] G. Redieteab, L. Cariou, P. Christin, and J.-F. Helard, “SU/MU-MIMOin IEEE 802.11 ac: PHY+ MAC performance comparison for singleantenna stations,” in Proc. of the 2012 Wireless TelecommunicationsSymposium. IEEE, 2012, pp. 1–5.
[8] B. Bellalta, J. Barcelo, D. Staehle, A. Vinel, and M. Oliver, “Onthe Performance of Packet Aggregation in IEEE 802.11ac MU-MIMOWLANs,” IEEE Communications Letters, vol. 16, no. 10, pp. 1588–1591, October 2012.
[9] S. Fiehe, J. Riihijarvi, and P. Mahonen, “Experimental Study on Perfor-mance of IEEE 802.11n and Impact of Interferers on the 2.4 GHz ISMBand,” in Proc. of the 6th International Wireless Communications andMobile Computing Conference. ACM, 2010, pp. 47–51.
[10] V. Shrivastava, S. Rayanchu, J. Yoonj, and S. Banerjee, “802.11n underthe microscope,” in Proc. of ACM IMC 2008. ACM, 2008, pp. 105–110.
[11] K. Pelechrinis, T. Salonidis, H. Lundgren, and N. Vaidya, “Experimentalcharacterization of 802.11n link quality at high rates,” in Proc. of the fifthACM international workshop on Wireless network testbeds, experimentalevaluation and characterization. ACM, 2010, pp. 39–46.
[12] V. Visoottiviseth, T. Piroonsith, and S. Siwamogsatham, “An empiricalstudy on achievable throughputs of IEEE 802.11 n devices,” in Proc.of the 7th International Symposium on Modeling and Optimization inMobile, Ad Hoc, and Wireless Networks. IEEE, 2009, pp. 1–6.
[13] A. Tirumala, F. Qin, J. Dugan, J. Ferguson, and K. Gibbs, Iperf: TheTCP/UDP bandwidth measurement tool. Current version available onlineat http://code.google.com/p/iperf/.
[14] A. Orebaugh, G. Ramirez, and J. Beale, Wireshark & Ethereal networkprotocol analyzer toolkit. Syngress, 2006.