Martin, Jessica E . (2015) Humane mechanical methods for ...
Upload
metropolitan-area-planning-councilCategory
view
135download
1


-$80,000
$20,000
$120,000
$220,000
$320,000
$420,000
20002013
WAG E A N D I N C O M E D I V I D E H A S D E E P E N E D

Less than $10,000
$10,000 to $24,999
$25,000 to $49,999
$50,000 to $74,999
$75,000 to $99,999
$100,000 to $149,999
$150,000 or more
BO S T O N ’ S H O U S E H O L D S H AV E B E C O M E M O R E P O L A R I Z E D S I N C E 2 0 0 8

C A N A C I T Y E X T E N D T H E B E N E F I T S O F
E C O N O M I C S U C C E S S T O A L L O F I T S
R E S I D E N T S & N E I G H B O R H O O D S ?

C A N I T R E TA I N A V I B R A N T M I X O F I N C O M E , E T H N I C & A G E D I V E R S I T Y
E V E N A S I T AT T R A C T S H I G H E R I N C O M E R E S I D E N T S ?

C A N I T C R E AT E P AT H W AY S T O E D U C AT I O N A L & E C O N O M I C S U C C E S S
F O R A L L I T S Y O U N G P E O P L E ?

2000 2013
Population Growth Rates
2000 to 2013

Persistent Segregation
Census Tracts with a Racial/Ethnic Majority

College Completion RatesClasses of 2000 - 2007
2000 2007

1990
20002013
Persistent Attainment Disparities
BA or Higher by Race/Ethnicity
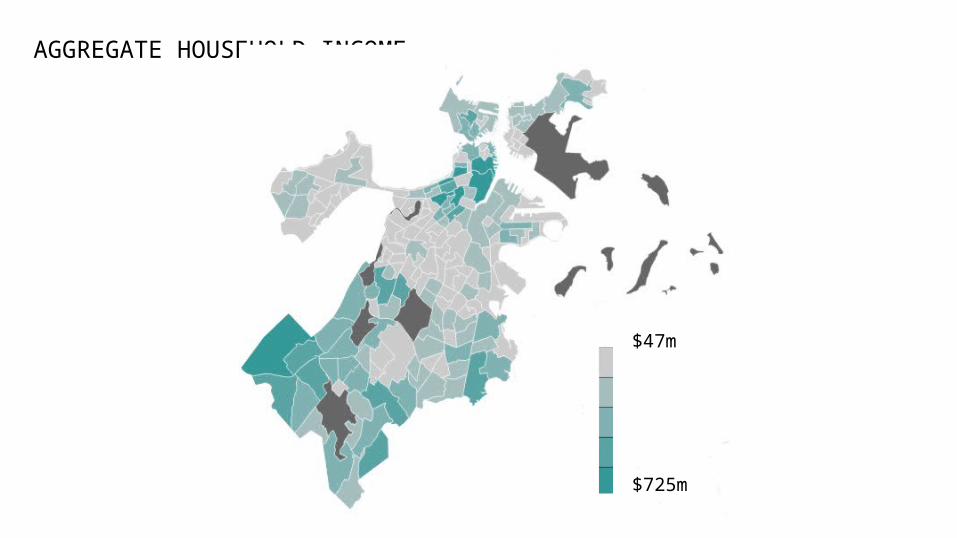
AGGREGATE HOUSEHOLD INCOME
$47m
$725m

EDUCATIONAL ATTAINMENT
Less than 20%
Greater than 80%

CHILD POVERTY
Less than 5%
Greater than 40%


O P P O R T U N I T Y

O P P O R T U N I T Y
P R O S P E R I T Y
O P P O R T U N I T Y
P R O S P E R I T Y
W E L L - B E I N G

O P P O R T U N I T Y
P R O S P E R I T Y
W E L L - B E I N G
S O C I A L & E C O N O M I C M O B I L I T Y

INTRA-GENERATIONAL
INTER-GENERATIONAL
S O C I A L & E C O N O M I C M O B I L I T Y

INTRA-GENERATIONAL
Change in one’s social/economic
positioning within a lifetime
Birth
Adulthood
Adulthood
INTER-GENERATIONAL
S O C I A L & E C O N O M I C M O B I L I T Y

INTER-GENERATIONAL
A person’s social/economic
standing compared to their parents’
standing at the same ageParents
Adult Child
INTRA-GENERATIONAL
S O C I A L & E C O N O M I C M O B I L I T Y

Parents
Adult Child
ABSOLUTE
Actual movement in lifetime, across
generations
S O C I A L & E C O N O M I C M O B I L I T Y

RELATIVE
Individual’s position compared to peers
with similar experience
S O C I A L & E C O N O M I C M O B I L I T Y

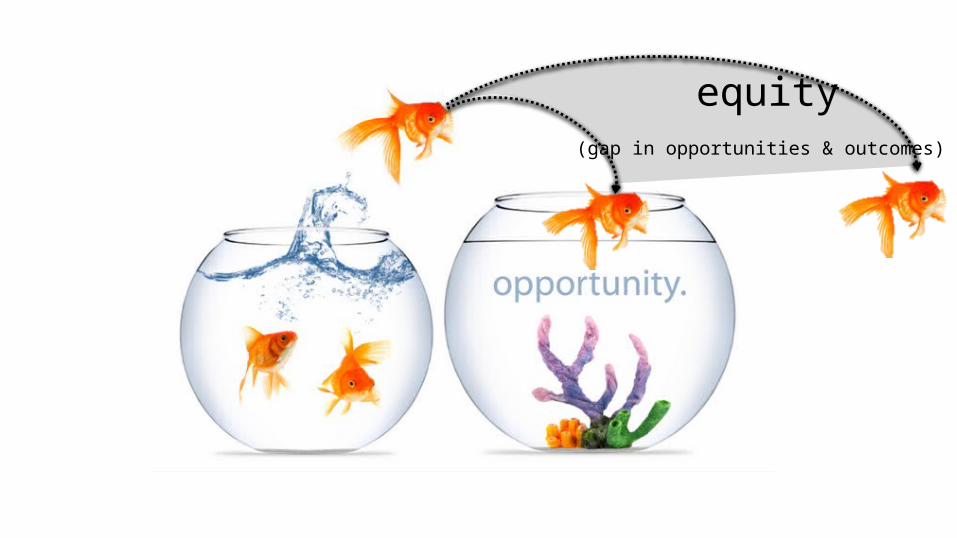
equity(gap in opportunities & outcomes)


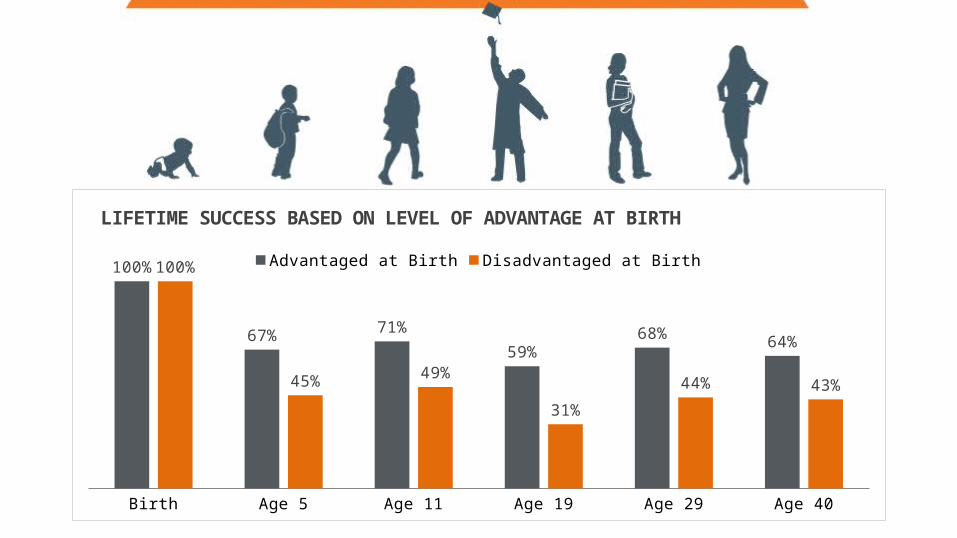
Birth Age 5 Age 11 Age 19 Age 29 Age 40
100%
67% 71%
59%68% 64%
100%
45% 49%
31%
44% 43%
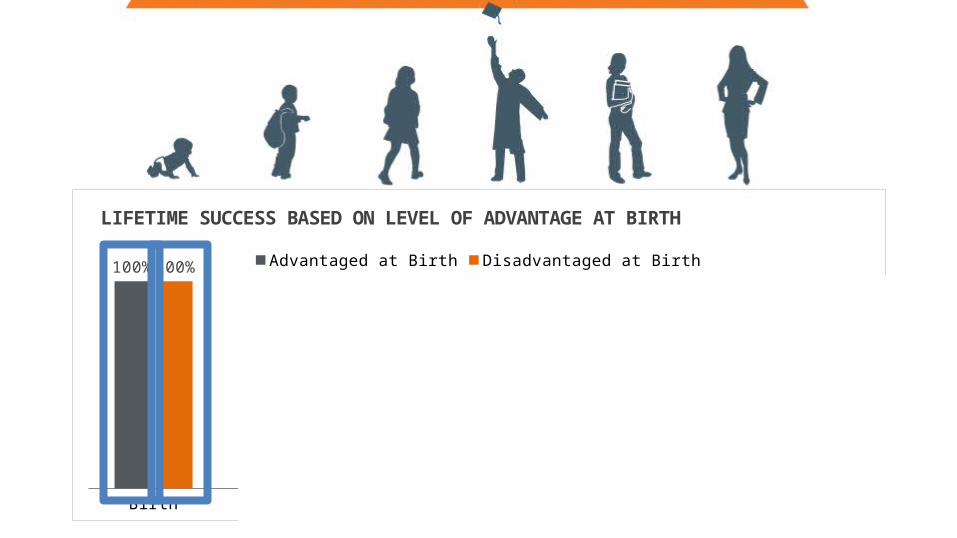
LIFETIME SUCCESS BASED ON LEVEL OF ADVANTAGE AT BIRTH
Advantaged at Birth Disadvantaged at Birth
Birth Age 5 Age 11 Age 19 Age 29 Age 40
100%
67% 71%
59%68% 64%
100%
45% 49%
31%
44% 43%
LIFETIME SUCCESS BASED ON LEVEL OF ADVANTAGE AT BIRTH
Advantaged at Birth Disadvantaged at Birth

Birth Age 5 Age 11 Age 19 Age 29 Age 40
100%
67% 71%
59%68% 64%
100%
69% 67%
37%
59% 58%
SUCCESS GAP AFTER PROVEN INTERVENTIONS
Advantaged at Birth Disadvantaged at Birth

SAN JOSE: 12.9%
SAN FRANCISCO: 12.2%
WASHINGTON DC: 11%
SALT LAKE CITY: 10.8%
SEATTLE: 10.9%
NEW YORK CITY: 10.5%
BOSTON: 10.5%
GREATERMOBILITY
LESS MOBILITY

Racial Segregation
Isolated Poverty
Commute Times
Proximity to High Quality Schools
Teen Labor Force Participation
Social Capital
Density of Single Parent Households

Suffolk County:-0.31% every year
Middlesex County:+0.39% every year
Causal Exposure Effects on Future EarningsFor every year spent living in a place, how does that impact future earnings?

2015 A BABY IS BORN IN BOSTON

2020 TURNS FIVE YEARS OLD
2027 ENTERS 7 T H GRADE

2033 GRADUATES HIGH SCHOOL
2038 COMPLETES COLLEGE
2039 STARTS A CAREER PATH

2055 ACHIEVES THE AMERICAN DREAM
2048 HAS A CHILD

WHAT DO WE
NEED TO KNOW
ALONG THE WAY?
Quickly
Clearly
Appropriate depth6
indicators


classroom successstandardized test scoreshigh school graduation
employabilityearning potential
lifetime wealth creation
% of 3 & 4 Year Olds Enrolled in School59.3%
% of Pop. with an Associate’s Degree or Higher49.7%
(early opportunity) (educational attainment)

Median Income$53,583
Unemployment Rate4.7%
inequalitypurchasing power
povertyhousingnutrition
GINI Index .53
accessible & equitable city
(employment) (income & wealth) (neighborhood strength)

TBF.ORG/OPPORTUNITY