Measles-Rubella Microarray Patch Vaccines: A Business Case ...
32
Measles-Rubella Microarray Patch Vaccines: A Business Case Analysis March 2021
Transcript of Measles-Rubella Microarray Patch Vaccines: A Business Case ...
Measles-Rubella Microarray
Patch Vaccines:
A Business Case Analysis
March 2021

i
Please send any comments or feedback on this document to [email protected].
Mailing Address
PO Box 900922
Seattle, WA 98109 USA
Street Address
2201 Westlake Avenue
Suite 200
Seattle, WA 98121 USA
www.path.org
© 2021 PATH. All rights reserved.
PATH Microarray Patch Center of Excellence, Linksbridge SPC. Measles-Rubella Microarray Patch
Vaccines: A Business Case Analysis. Seattle: PATH; 2021.
Cover photo: PATH
This project was funded with UK aid from the UK government.

ii
Contents
FIGURES ....................................................................................................................................................... I
TABLES ........................................................................................................................................................ II
ACKNOWLEDGMENTS .............................................................................................................................. III
ABBREVIATIONS ....................................................................................................................................... IV
EXECUTIVE SUMMARY .............................................................................................................................. V
BACKGROUND ............................................................................................................................................ 1
Measles and rubella disease burden ............................................................................................................ 1
Challenges with the current presentation ...................................................................................................... 1
The need for a measles-rubella microarray patch ........................................................................................ 1
OBJECTIVE .................................................................................................................................................. 3
The business case for an MR MAP .............................................................................................................. 3
APPROACH .................................................................................................................................................. 4
Estimating global MR MAP demand ............................................................................................................. 4
MR MAP demand estimate inputs MAP ........................................................................................................ 4
Usage .................................................................................................................................................. 4
Displacement/switching ....................................................................................................................... 5
Adoption .............................................................................................................................................. 5
Production launch timeline .................................................................................................................. 5
Supply and procurement constraints................................................................................................... 5
Estimating the financial returns of an MR MAP ............................................................................................ 6
Technology and transfer ..................................................................................................................... 6
Development and production .............................................................................................................. 6
Vaccine price ....................................................................................................................................... 6
RESULTS...................................................................................................................................................... 8
The case for MR MAP investment ................................................................................................................ 8
Cash flow by year and market for the MR MAP usage scenarios (base case) ............................................ 9
Targeting hard-to-reach populations ................................................................................................... 9
RI and SIA delivery in six M&RI priority countries ............................................................................. 10
SIAs and outbreak response immunization ...................................................................................... 11
RI delivery in 12 selected countries with the largest unimmunized MCV1 populations and the
largest populations that are forecasted to use MR in 2030 .............................................................. 12

iii
Sensitivity analysis ...................................................................................................................................... 13
CHALLENGES AND OPPORTUNITIES .................................................................................................... 15
Reducing the risk of targeting resource-limited markets ................................................................... 15
Mitigating R&D, regulatory, and licensing risks ................................................................................. 15
Innovative solutions ..................................................................................................................................... 16
Adding an additional antigen to enhance the commercialization opportunity ................................... 16
Addressing inconsistent demand and optimizing the manufacturing process through modular
techniques ......................................................................................................................................... 17
Partnering with CDMOs to lower overhead costs ............................................................................. 18
CONCLUSION ............................................................................................................................................ 19
APPENDIX .................................................................................................................................................. 20
MR MAP demand heatmap (by usage scenario and demand case) .......................................................... 20
MR MAP revenue heatmap (by usage scenario and demand case) .......................................................... 21
MR MAP NPV heatmap by discount rate, usage scenario, and demand case .......................................... 22
REFERENCES ............................................................................................................................................ 23
i
Figures
Figure 1. Cash flow by year and market for targeting hard-to-reach populations. ........................................ 9
Figure 2. Cash flow by year and market for RI and SIAs in six M&RI priority countries. ............................ 10
Figure 3. Cash flow by year and market for SIAs and outbreak response immunization. .......................... 11
Figure 4. Cash flow by year and market for RI in 12 selected countries with the largest unimmunized
MCV1 populations and the largest populations that are forecasted to use MR between 2030
and 2040. .................................................................................................................................... 12
Figure 5. NPV by price scenario for hard-to-reach, 6 priority, SIA, and 12 selected countries. ................. 13
Figure 6. NPV by price and by proportionally increasing COGS scenario for hard-to-reach, 6 priority, SIA,
and 12 selected countries. .......................................................................................................... 14
Figure 7. Cash flow by year and price tier for the MMR MAP in needle-phobic populations in high-income
countries. .................................................................................................................................... 17
ii
Tables
Table 1. MR MAP usage scenarios and country scope. ............................................................................... 4
Table 2. Low, base, and high market demand scenario inputs. ................................................................... 6
Table 3. MR MAP price assumptions by price tier. ....................................................................................... 7
Table 4. MMR MAP price assumptions by price tier. .................................................................................. 16

iii
Acknowledgments
The PATH Center of Excellence for Microarray Patch (MAP) Technology would like to thank the many
individuals involved in the development of this draft business case for an MR MAP. These individuals
represent a broad range of backgrounds and expertise, including vaccine development, MAP technology,
and manufacturing. The business case was developed through conducting background research on
measles and rubella epidemiology, vaccines against measles and rubella, as well as MAP development.
Specific model input was then refined through consultation with key stakeholders.
PATH and Linksbridge SPC staff that contributed to the drafting and review of this document include
George Durham, Collrane Frivold, Courtney Jarrahian, Adnan Hajizada, Scott Knackstedt, Mercy
Mvundura, Yvonne Teng, Darin Zehrung, and KJ Zunigha.
We would like to thank the following individuals for providing feedback on the model inputs and
assumptions: Akhilesh Bhambhani (Merck & Co., Inc.), Jeff Blue (Merck & Co., Inc.), Kristen Earle (Gates
Foundation), Angus Forster (Vaxxas), Birgitte Giersing (World Health Organization), Mark Prausnitz
(Georgia Institute of Technology), Brian Meyer (Merck & Co., Inc.), and Kim Thompson (KID RISK, Inc).
We would also like the following individuals who provided comments on the preliminary results from this
analysis: Kristen Earle (Gates Foundation), Birgitte Giersing (World Health Organization), Mateusz
Hasso-Agopsowicz (World Health Organization), Ravi Menon (Serum Institute of India Private Limited),
Marion Menozzi-Arnaud (Gavi, the Vaccine Alliance), and Tiziana Scarna (Gavi, the Vaccine Alliance).
iv
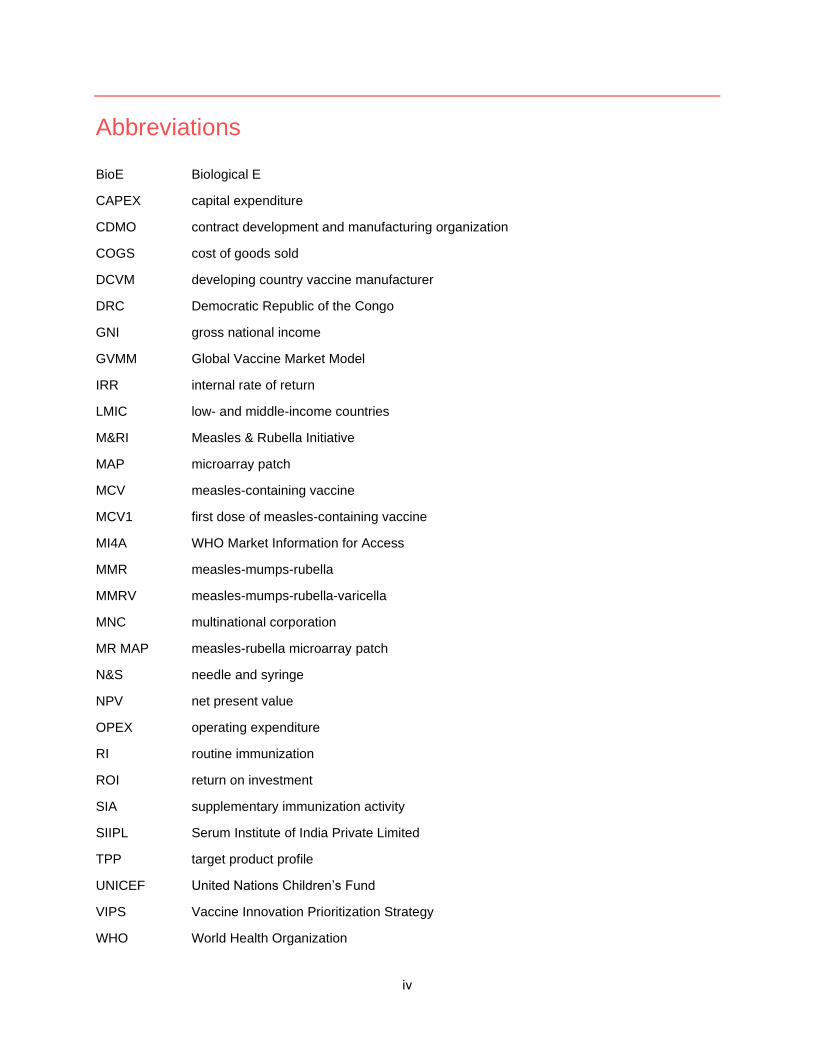
Abbreviations
BioE Biological E
CAPEX capital expenditure
CDMO contract development and manufacturing organization
COGS cost of goods sold
DCVM developing country vaccine manufacturer
DRC Democratic Republic of the Congo
GNI gross national income
GVMM Global Vaccine Market Model
IRR internal rate of return
LMIC low- and middle-income countries
M&RI Measles & Rubella Initiative
MAP microarray patch
MCV measles-containing vaccine
MCV1 first dose of measles-containing vaccine
MI4A WHO Market Information for Access
MMR measles-mumps-rubella
MMRV measles-mumps-rubella-varicella
MNC multinational corporation
MR MAP measles-rubella microarray patch
N&S needle and syringe
NPV net present value
OPEX operating expenditure
RI routine immunization
ROI return on investment
SIA supplementary immunization activity
SIIPL Serum Institute of India Private Limited
TPP target product profile
UNICEF United Nations Children’s Fund
VIPS Vaccine Innovation Prioritization Strategy
WHO World Health Organization

v
Executive summary
Despite the availability of a safe, effective, and affordable vaccine, the percentage of children globally
receiving at least one dose of measles-containing vaccine (MCV) has stalled at around 85%, having
increased only by 5% in the past decade. A microarray patch (MAP) for the delivery of measles-rubella
(MR) vaccine has emerged as a promising alternative to the lyophilized injection currently in use. MR
MAPs have the potential to increase immunization coverage in underserved populations while reducing
the waste and safety risks inherent in the lyophilized formulation.
The eventual transfer of MAP technology to an established developing country vaccine manufacturer
(DCVM) with the capacity to product MAPs at commercial scale is expected to accelerate market entry
and increase the likelihood of affordability and sufficient supply in low- and middle-income countries
(LMICs). However, to date the potential financial risks and rewards for investment in MR MAPs from the
perspective of a manufacturing partner have not yet been evaluated as part of a publicly available
analysis.
The objective of this business case is, therefore, to define the market opportunity of MR MAPs and
evaluate incentives for commercialization partners and global health stakeholders (e.g., donors,
procurers) to invest in bringing MR MAPs to licensure for LMIC use.
Recognizing that MR MAPs may be deployed in different usage strategies to achieve coverage goals, we
analyzed four different usage scenarios and modeled low, base, and high results:
• Targeting hard-to-reach populations in all countries currently using MR or expected to adopt MR
by 2030.1
• Routine and supplementary immunization activities (SIAs) in six Measles & Rubella Initiative
(M&RI) priority countries.
• SIAs and outbreak response immunization in all countries currently using MR or expected to
adopt MR by 2030.1
• Routine immunization (RI) in 12 selected countries with the largest populations lacking an MCV
first dose (unimmunized MCV1 populations) and the largest populations that are forecasted to
use MR in 2030.
We estimated the potential return on investment to an Indian manufacturer (as an assumption since both
manufacturers of WHO-prequalified MR vaccines are based in India), weighing all the upfront and yearly
developmental and production costs against the expected cash inflows from product sales. The analysis
found suboptimal returns on the investment. Our base results—with a net present value (NPV) ranging
from a $3 million loss to a $3.2 million gain from 2023 to 2040 among the four usage cases—suggest an
investment unlikely to attract manufacturers. Nonetheless, this business case may provide a starting point
for donors, manufacturers, and other key stakeholders to identify key factors influencing the commercial
viability of MR MAPs. Its methodology and conclusions may help stakeholders develop new strategies to
address the risks of producing a novel MR MAP vaccine presentation for low- and middle-income markets
and strengthen the commercial value proposition.
1 Excludes supplementary immunization activities in Egypt and Libya due to lack of forecast data.

March 2021
1
Background
Measles and rubella disease burden
Measles is a highly infectious disease caused by the measles virus. It is a seasonal disease in endemic
areas and also causes outbreaks.1 Rubella is an acute, usually mild, viral disease, typically affecting
susceptible children and occurring in a seasonal pattern, with epidemics every five to nine years. Rubella
infection just before conception and during early pregnancy may result in miscarriage, fetal death, or
congenital defects known as congenital rubella syndrome (CRS). Vaccination and maintaining high
population-level immunity against measles and rubella are key strategies to reduce measles deaths and
prevent CRS.2
The World Health Organization (WHO) recommends that all children receive two doses of measles-
containing vaccine. In countries with ongoing transmission and where measles mortality remains high,
WHO advises a first dose at 9 months and a second dose at 15 to 18 months.1
Challenges with the current presentation
Despite the availability of a safe, effective, and affordable vaccine, the percentage of children globally
receiving at least one dose of MCV has stalled at around 85%. Ten countries account for 60% of
unprotected children (Angola, Brazil, Democratic Republic of the Congo, Ethiopia, India, Indonesia,
Nigeria, Pakistan, Philippines, Vietnam).3 The lowest rates of coverage remain among children in the
poorest communities and most difficult-to-reach populations.
The current vaccine presentation is a lyophilized multidose vial which needs to be reconstituted before
administration. Once a vial is opened and reconstituted, the vaccine must be used within six hours and
any unused portion discarded. As a result, one of the reasons for the immunization gap is the reluctance
to open a multidose vial when only a few children are present for vaccination; the fear of vaccine wastage
can contribute to missed vaccination opportunities. A single-dose presentation could reduce these missed
opportunities.
There are also potential safety risks for the current lyophilized presentation, including contamination
through the reuse of reconstitution syringes and mismatching dry vaccine and diluent. The dry vaccine
and diluent are often shipped and stored separately, with the vaccine in the cold chain and the diluent at
ambient temperature, which increases logistical complexity and risk of use of the incorrect diluent. For
example, in Syria in 2014, 15 children died after a muscle relaxant was accidentally administered instead
of the proper diluent. In 2017, another 15 children died in Syria after receiving vaccine that was
contaminated during reconstitution. In 2018, two children in Samoa died after receiving vaccine
incorrectly reconstituted with expired muscle relaxant. These recent reports demonstrate that vaccine
handling and preparation errors pose a significant safety risk. Vaccine product innovations that eliminate
these risks could have a major impact on improving the safety of immunization programs in LMICs.4
The need for a measles-rubella microarray patch
A microarray patch (MAP) for the delivery of measles-rubella vaccine has emerged as a promising
alternative—one with the potential to increase immunization coverage and strengthen safe practices in
underserved populations. A novel, investigational drug delivery platform, MAPs are under development
March 2021
2
for a variety of health indications, including immunization, sustained-release drug delivery, and
contraception.
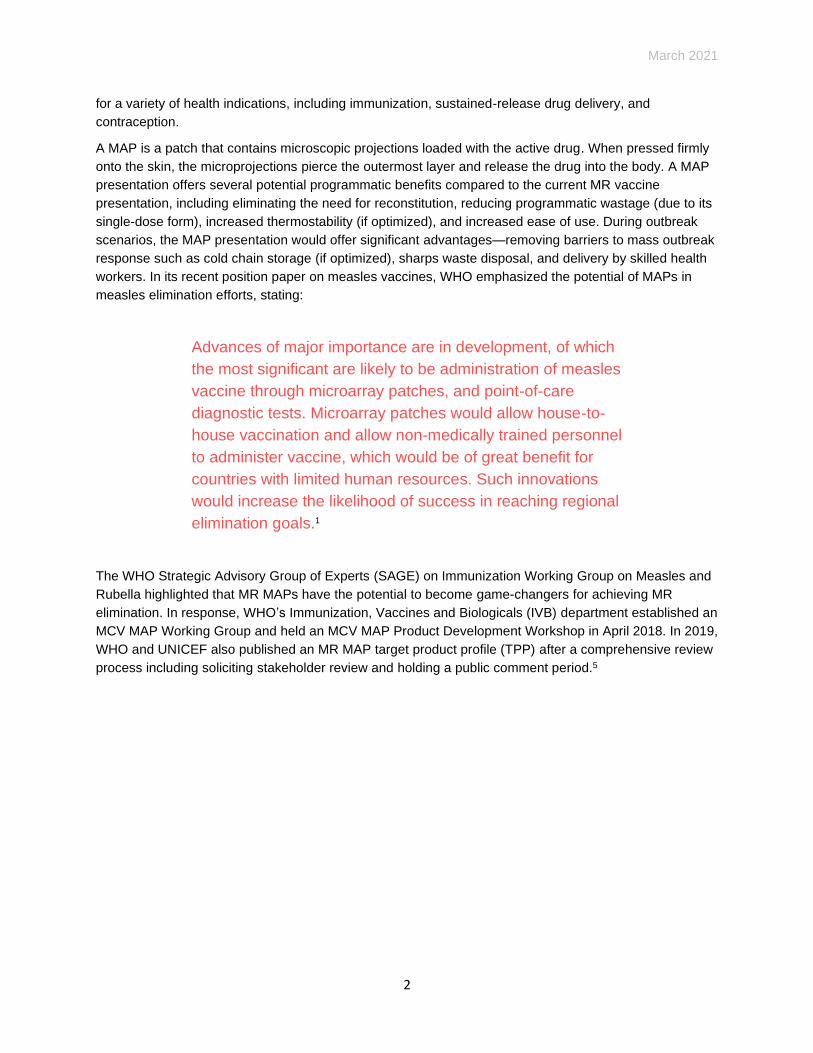
A MAP is a patch that contains microscopic projections loaded with the active drug. When pressed firmly
onto the skin, the microprojections pierce the outermost layer and release the drug into the body. A MAP
presentation offers several potential programmatic benefits compared to the current MR vaccine
presentation, including eliminating the need for reconstitution, reducing programmatic wastage (due to its
single-dose form), increased thermostability (if optimized), and increased ease of use. During outbreak
scenarios, the MAP presentation would offer significant advantages—removing barriers to mass outbreak
response such as cold chain storage (if optimized), sharps waste disposal, and delivery by skilled health
workers. In its recent position paper on measles vaccines, WHO emphasized the potential of MAPs in
measles elimination efforts, stating:
Advances of major importance are in development, of which
the most significant are likely to be administration of measles
vaccine through microarray patches, and point-of-care
diagnostic tests. Microarray patches would allow house-to-
house vaccination and allow non-medically trained personnel
to administer vaccine, which would be of great benefit for
countries with limited human resources. Such innovations
would increase the likelihood of success in reaching regional
elimination goals.1
The WHO Strategic Advisory Group of Experts (SAGE) on Immunization Working Group on Measles and
Rubella highlighted that MR MAPs have the potential to become game-changers for achieving MR
elimination. In response, WHO’s Immunization, Vaccines and Biologicals (IVB) department established an
MCV MAP Working Group and held an MCV MAP Product Development Workshop in April 2018. In 2019,
WHO and UNICEF also published an MR MAP target product profile (TPP) after a comprehensive review
process including soliciting stakeholder review and holding a public comment period.5
March 2021
3
Objective
The business case for an MR MAP
A substantial and concerted investment will be required to move an MR MAP candidate through clinical
development, regulatory approval, manufacturing scale-up, and eventual program introduction. Two
developers (Micron Biomedical and Vaxxas) are currently advancing MR MAPs and are expected to
initiate Phase 1 clinical studies in early 2021 with support from the Bill & Melinda Gates Foundation.
Transferring technology and know-how to DCVMs has been identified as a key factor in bringing
affordable vaccines to market rapidly.6 Therefore, transferring the MAP development technology to an
established DCVM should accelerate market entry and increase the likelihood of an affordable, sufficient
supply in LMICs.
Potential DCVMs for a technology transfer include vaccine manufacturers who currently have a lyophilized
MR product such as Serum Institute of India (SIIPL), Biological E (BioE), and Brazil’s Bio-Manguinhos
(BioM). SIIPL has commanded the UNICEF MR vaccine supply for 10 years and currently provides the MR
antigen for MR MAP development. BioE’s MR vaccine was WHO prequalified in 2019, providing another
affordable option for UNICEF procurement beginning in 2021. BioM is another potential partner, with an
MR vaccine candidate currently in Phase 3. Some of these manufacturers have entered MR MAP
development discussions, but at the time of writing this report none have been willing to invest in advancing
a candidate for commercialization.
Coupled with the inherent risks of bringing a new combination product to market, uncertain demand
prospects and an unclear path to revenue generation have been key barriers to identifying a commercial
partner for an MR MAP.7 Vaccine manufacturers seem to see insufficient financial incentive (margins) to
invest in the new facilities and late-stage clinical trials required to compete for market share in an already
well-established market. Moreover, while country governments have commissioned preliminary analyses
to study the potential delivery cost savings of using MR MAPs in their immunization programs, the
potential risks and rewards for investment in MR MAPs from the perspective of a manufacturing partner
have not yet been evaluated.8
Therefore, this business case aims to define the market opportunity of MR MAPs and evaluate incentives
for commercialization partners and global health stakeholders to invest in bringing MR MAPs to licensure
for LMIC use. This analysis quantifies the upfront investment and manufacturing costs (and possible
risks) of an MR MAP investment and helps articulate the potential returns for a DCVM—with the aim to
inform investment decisions and also act as a starting point for necessary dialogues between global
actors and manufacturers.
March 2021
4
Approach
Estimating global MR MAP demand
To develop an estimate of the potential market size for an MR MAP, we generated a set of assumptions
on adoption, timing, and usage scenarios by consulting with internal and external stakeholders and
experts.
The demand model is based on Linksbridge’s Global Vaccine Market Model (GVMM)—where annual
vaccine demand is forecasted by country based on target population, immunization schedule, an analog
for coverage/uptake, and programmatic wastage. We also included future MR adoption assumptions
generated by WHO’s Market Information for Access (MI4A) initiative.b The full demand results, in doses,
are presented in the appendix.
As MR MAP development is still in its early stages, we inferred product characteristics based on WHO’s
MR MAP target product profile to assume a product non-inferior to the lyophilized MR vaccine
presentation delivered by needle and syringe (N&S) in efficacy and superior in wastage and
thermostability. This was an underlying assumption when making the demand estimates.
MR MAP demand estimate inputs MAP
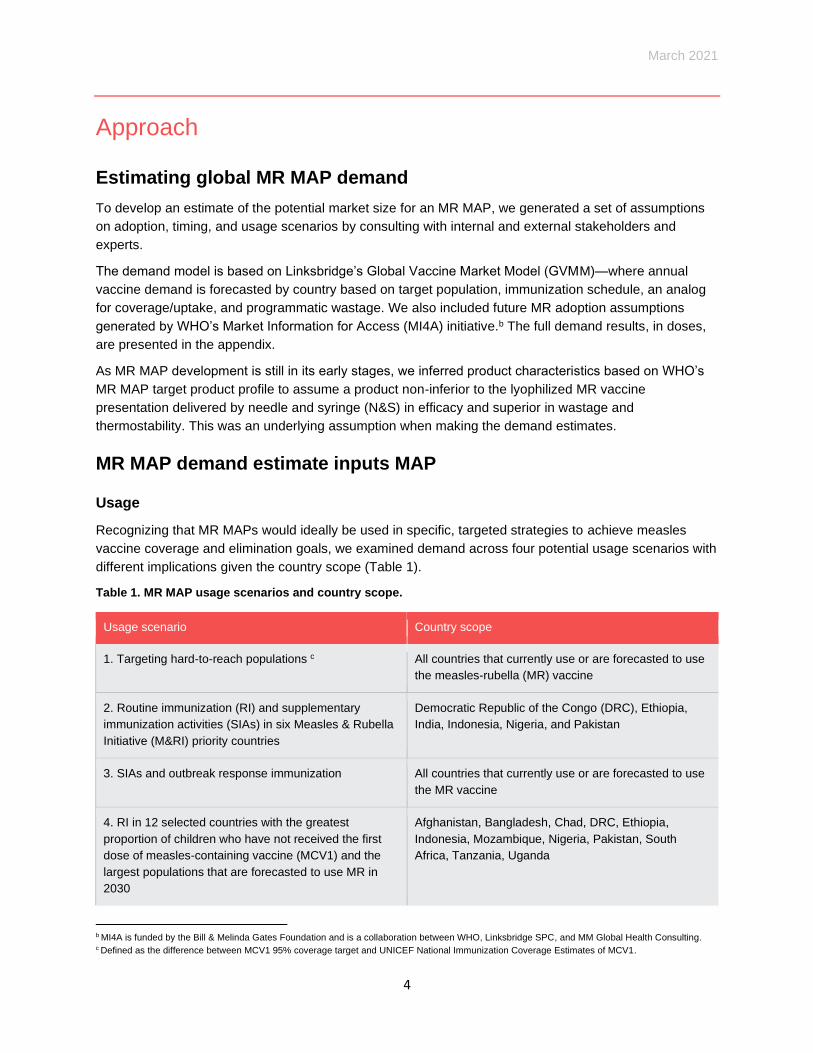
Usage
Recognizing that MR MAPs would ideally be used in specific, targeted strategies to achieve measles
vaccine coverage and elimination goals, we examined demand across four potential usage scenarios with
different implications given the country scope (Table 1).
Table 1. MR MAP usage scenarios and country scope.
Usage scenario Country scope
1. Targeting hard-to-reach populations c All countries that currently use or are forecasted to use
the measles-rubella (MR) vaccine
2. Routine immunization (RI) and supplementary
immunization activities (SIAs) in six Measles & Rubella
Initiative (M&RI) priority countries
Democratic Republic of the Congo (DRC), Ethiopia,
India, Indonesia, Nigeria, and Pakistan
3. SIAs and outbreak response immunization All countries that currently use or are forecasted to use
the MR vaccine
4. RI in 12 selected countries with the greatest
proportion of children who have not received the first
dose of measles-containing vaccine (MCV1) and the
largest populations that are forecasted to use MR in
2030
Afghanistan, Bangladesh, Chad, DRC, Ethiopia,
Indonesia, Mozambique, Nigeria, Pakistan, South
Africa, Tanzania, Uganda
b MI4A is funded by the Bill & Melinda Gates Foundation and is a collaboration between WHO, Linksbridge SPC, and MM Global Health Consulting. c Defined as the difference between MCV1 95% coverage target and UNICEF National Immunization Coverage Estimates of MCV1.
March 2021
5
Displacement/switching
Assuming that MR MAPs would be considered a preferred product for campaigns, and in light of the
complexity of stocking and providing multiple presentations of the same vaccine in a country (i.e., mixed
presentations), we assume full displacement of N&S vaccines by MR MAPs for each of the usage
scenarios indicated in Table 1.
Adoption
Assuming that private market users in LMICs are more likely to purchase products with additional
antigens like measles-mumps-rubella (MMR) or measles-mumps-rubella-varicella (MMRV) vaccines, we
excluded private market use of MR MAPs as part of our initial analysis. For more information on the
potential opportunity of MMR MAPs, see the ‘Opportunities and Challenges’ section below. Since Gavi
currently supports MR RI and SIA vaccination in all Gavi-eligible countries, whether Gavi would financially
support the MR MAP is a key driver to forecasting demand. We modeled two different scenarios in this
analysis: one with no Gavi support and one with Gavi support; the first scenario limits its demand forecast
to Gavi-graduated and non-Gavi countries.
Gavi’s current support policy dictates that when a country’s gross national income (GNI) per capita is
below the World Bank’s low-income-country threshold, the government’s contribution is a flat amount of
$0.20 per dose for any vaccine it receives from Gavi. After a country’s GNI per capita has surpassed the
low-income-country threshold, the government’s contribution increases by 15% per year until it graduates
from Gavi support. To simplify the analysis, we assumed that all countries eligible for Gavi support would
switch to the MR MAP presentation for all usage scenarios. However, in practice, the decision to switch
from the N&S lyophilized vaccine to the MAP would be initiated by countries.
Although Gavi has expressed interest in MR MAPs, and the Vaccine Innovation Prioritization Strategy
(VIPS,9 an Alliance-wide effort led by Gavi, the Gates Foundation, PATH, UNICEF, and WHO) has
prioritized the MAP technology platform, Gavi has not clearly signaled whether it would support the MR
MAP or what that support could look like. This analysis assumes the organization’s current level of
support for the lyophilized MR presentation would be applicable to MAP presentation.
Production launch timeline
Our analysis assumes that the MR MAP technology would complete Phase 2 trials in 2022, and
technology transfer to a DCVM would begin in 2023. Based on expert opinion and historical vaccine
development timelines, we assume that it would take seven years for the DCVM to develop, test, and
eventually launch the product in 2030, although there are potential opportunities to accelerate the product
development timeline such as scaling up MAP manufacturing at-risk. For this analysis, we assume the
product would be available in the market starting in 2030 and therefore present demand forecasts for the
period 2030 to 2040. However, the recent COVID-19 vaccine development has demonstrated that the
typical vaccine development timeline can be truncated with an existing manufacturing infrastructure.
Supply and procurement constraints
We modeled low, base, and high demand scenarios with different supply constraints (Table 2). When
supply is limited (demand > supply), the prioritization of allocation of the MR MAP is assumed to be based
on country MCV coverage, from low to high. Unconstrained demand results are presented in the
appendix for reference, which illustrate the demand potential based solely on market demand if no supply
constraints existed.

March 2021
6
Table 2. Low, base, and high market demand scenario inputs.
Level of Gavi support Supply constraints
Low demand
scenario
No Gavi support Start: 5M, increase by 1M each year to reach
15M annual supply production in 2040
Base demand
scenario
Gavi support Start: 10M, increase by 3M each year to
reach 40M annual supply production in 2040
High demand
scenario
Gavi support Start: 20M, increase by 5M each year to
reach 70M annual supply production in 2040
Estimating the financial returns of an MR MAP
To determine the return on investment for a manufacturer that invests in the MR MAP, we generated
assumptions on price, development costs, and other necessary costs for commercialization. For our
analysis, we assumed that one India-based DCVM with existing MR production infrastructure would
receive the technology transfer and produce the MR MAP. Currently, both manufacturers of WHO-
prequalified MR vaccines (SIIPL and BioE) are based in India.
Technology and transfer
Based on industry consultations, we estimated that a manufacturer would begin the adoption of MAP
technology in 2023—incurring approximately $15 million in total R&D costs, including technology transfer
fees (including both patents and trade secrets), late-stage clinical trials, and licensing and regulatory fees
over seven years. Since license fees vary widely depending on the type of deal, we have excluded
potential license and milestone fees from the current analysis.
Development and production
We assume that the DCVM would co-locate its MAP and N&S vaccine production by adding MAP-specific
equipment to its existing MR vaccine facility, eliminating the need to build a new manufacturing site for
the product. To simplify the analysis, however, we have excluded the potential opportunity costs from
same-facility production in these results. Capital expenditure (CAPEX) and operating expenditure (OPEX)
assumptions were based on internal analyses of the necessary costs for cleanroom construction,
machinery, and overhead. We estimated cost of goods sold (COGS) for the MR MAP based on the cost
of the antigen and developer input using existing COGS information, arriving at an estimated COGS
ranging from ~$0.70 to $1.11 per dose, assuming an annual volume of 20 million doses per year. These
estimates were also informed by previous MAP COGS assessments conducted by PATH and McKinsey
& Company.
Vaccine price
Because the MR MAP is a novel combination product, its price per dose would likely be more than the
price of the current injectable vaccine. This price increase aligns with the WHO/UNICEF MR MAP TPP,
which states that a MAP can be more expensive if it offers sufficient additional programmatic benefits.5

March 2021
7
Based on this assumption, we derived a set of differential pricing within MR-using market tiers (Table 3)
from GVMM-forecasted N&S MR vaccine price values.
We assume one vaccine manufacturer will have 100% of the MR MAP market share without competition
for the duration of the modeling period. The model assumes fixed pricing in each market segment and
has not made any adjustments for inflation or other price increases during the analysis period.
Table 3. MR MAP price assumptions by price tier.
Price tier Price per dose
India $0.85
UNICEF $1.06
Lower-middle income $1.80
Upper-middle income $2.56
High income $4.341
1Although an MR MAP price was estimated for high-income markets, MR MAP doses
were not allocated to this market in our analysis based on the model assumptions.
March 2021
8
Results
The case for MR MAP investment
We estimated the potential return on investment (ROI) to an Indian DCVM by weighing all the upfront and
yearly developmental and production costs against the expected cash inflows from product sales. The
estimates do not include any assumptions of potential external funding. For our analysis, we use the
concept of net present value (NPV)d to translate future cash flows into present-day terms. We applied a
discount ratee of 10% to account for the time value and risk of annual future cash flows in our NPV
calculations. Although manufacturers do not share detailed information regarding their internal decision-
making process, previous analyses have shown that a typical discount rate for vaccine manufacturers
falls in the 10% to 20% range. We assume that DCVMs producing MR MAPs may adopt this typical range
of discount rates since they would be entering into a vaccine market already established for the
lyophilized MR vaccine. Availability of donor funding could also influence the discount rate selected by a
vaccine manufacturer as they assess the risk profile of investment in MR MAPs. We also assessed the
internal rate of return (IRR),f or hurdle rate, required for a manufacturer to break even on an NPV basis.
NPV is typically used by vaccine manufacturers to make capital budgeting decisions; only projects that
meet a certain level of return are considered further. A positive NPV indicates that the projected earnings
from an investment exceed the anticipated costs (and hence that an investment would generate value for
the company). However, as resources are often limited, with multiple opportunities on the horizon, the
threshold for what constitutes sufficient NPV for prioritizing an investment may vary by manufacturer. The
decision to go ahead with a project should therefore also involve other criteria such as strategic benefits,
which are not captured in the NPV analysis.
As the analysis currently stands, the ROI for an MR MAP is suboptimal. Our base results—with a net
present value ranging from a $3 million loss to a $3.2 million gain from 2023 to 2040 among the four
usage cases—suggest an investment unlikely to attract DCVMs.
The low commercial viability suggested by the business case analysis was not unexpected based on
preliminary MR MAP demand forecasting previously conducted by the US Centers for Disease Control
and Prevention (CDC) and UNICEF suggesting uncertain market demand. Moreover, manufacturers in
early MAP discussions have raised doubts about returns.
Below we present detailed base case results for four usage scenarios, as well as a summary of the low,
base, and high NPV results.
d Net present value (NPV) is the current value of a series of future projected cash flows. NPV is often used in capital budgeting and investment
planning to analyze the profitability of projected investments or projects. e A discount rate is the rate of return used to discount future cash flows back to their present value, which describes the rate of return needed to see a
return on an investment. f Internal rate of return (IRR) is the expected compound annual rate of return that will be earned on a project or investment. When calculating IRR,
expected cash flows for a project or investment are given and the NPV equals zero.
March 2021
9
Cash flow by year and market for the MR MAP usage scenarios (base
case)
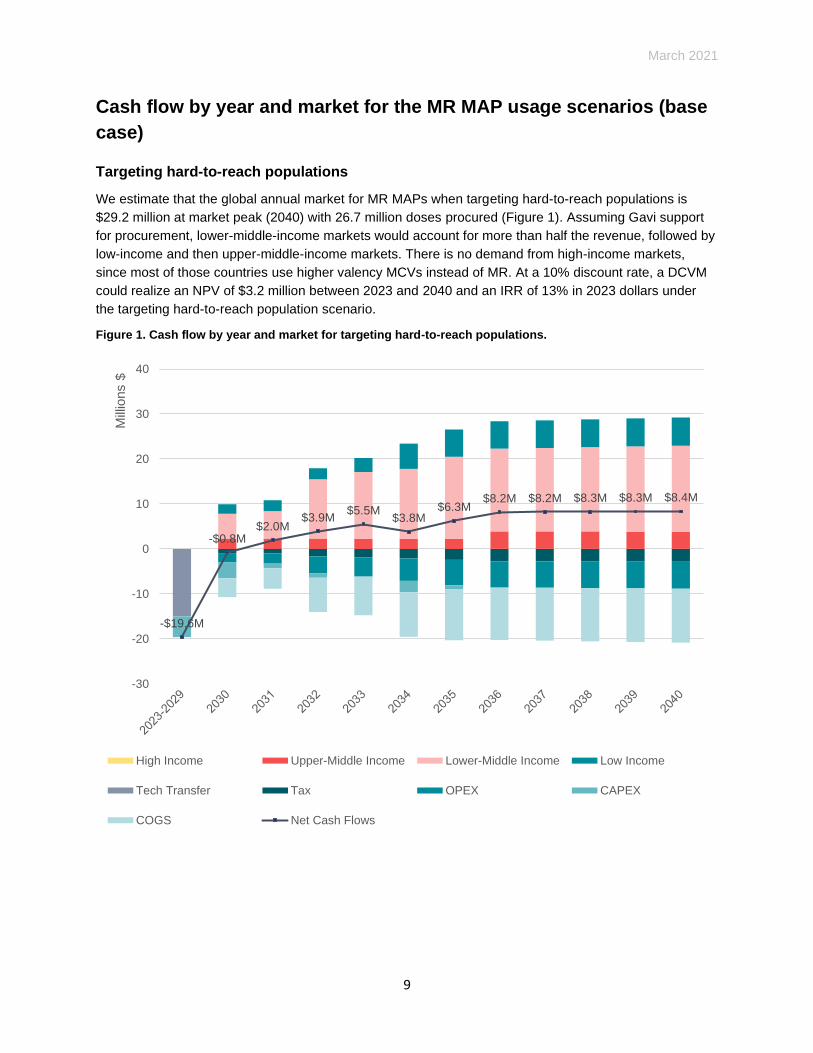
Targeting hard-to-reach populations
We estimate that the global annual market for MR MAPs when targeting hard-to-reach populations is
$29.2 million at market peak (2040) with 26.7 million doses procured (Figure 1). Assuming Gavi support
for procurement, lower-middle-income markets would account for more than half the revenue, followed by
low-income and then upper-middle-income markets. There is no demand from high-income markets,
since most of those countries use higher valency MCVs instead of MR. At a 10% discount rate, a DCVM
could realize an NPV of $3.2 million between 2023 and 2040 and an IRR of 13% in 2023 dollars under
the targeting hard-to-reach population scenario.
Figure 1. Cash flow by year and market for targeting hard-to-reach populations.
-$19.6M
-$0.8M$2.0M
$3.9M$5.5M
$3.8M$6.3M
$8.2M $8.2M $8.3M $8.3M $8.4M
-30
-20
-10
0
10
20
30
40
Mill
ions $
High Income Upper-Middle Income Lower-Middle Income Low Income
Tech Transfer Tax OPEX CAPEX
COGS Net Cash Flows
March 2021
10
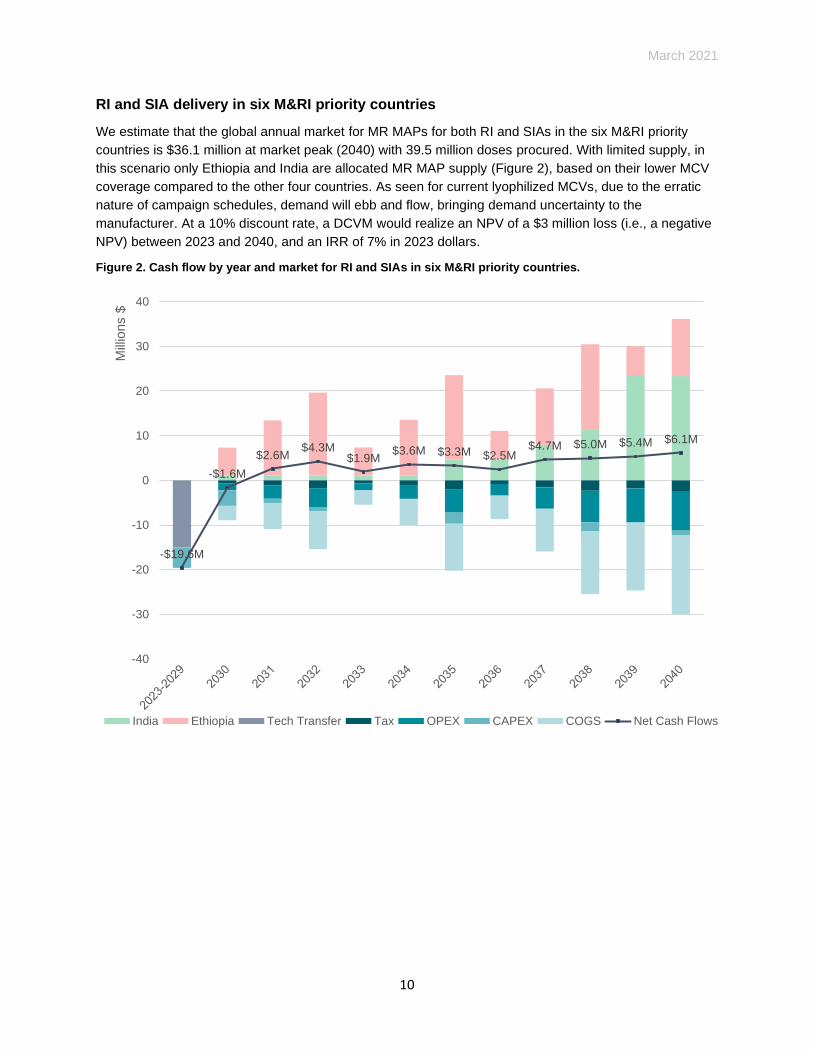
RI and SIA delivery in six M&RI priority countries
We estimate that the global annual market for MR MAPs for both RI and SIAs in the six M&RI priority
countries is $36.1 million at market peak (2040) with 39.5 million doses procured. With limited supply, in
this scenario only Ethiopia and India are allocated MR MAP supply (Figure 2), based on their lower MCV
coverage compared to the other four countries. As seen for current lyophilized MCVs, due to the erratic
nature of campaign schedules, demand will ebb and flow, bringing demand uncertainty to the
manufacturer. At a 10% discount rate, a DCVM would realize an NPV of a $3 million loss (i.e., a negative
NPV) between 2023 and 2040, and an IRR of 7% in 2023 dollars.
Figure 2. Cash flow by year and market for RI and SIAs in six M&RI priority countries.
-$19.6M
-$1.6M
$2.6M$4.3M
$1.9M$3.6M $3.3M $2.5M
$4.7M $5.0M $5.4M $6.1M
-40
-30
-20
-10
0
10
20
30
40
Mill
ions
$
India Ethiopia Tech Transfer Tax OPEX CAPEX COGS Net Cash Flows
March 2021
11
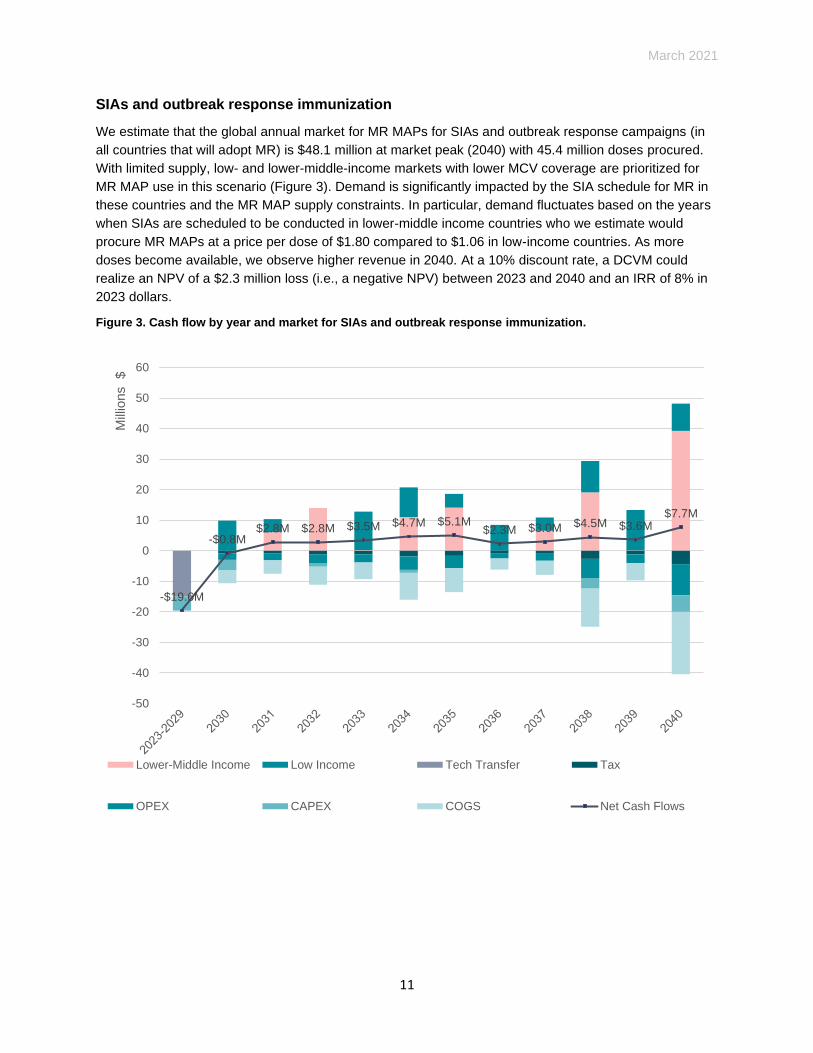
SIAs and outbreak response immunization
We estimate that the global annual market for MR MAPs for SIAs and outbreak response campaigns (in
all countries that will adopt MR) is $48.1 million at market peak (2040) with 45.4 million doses procured.
With limited supply, low- and lower-middle-income markets with lower MCV coverage are prioritized for
MR MAP use in this scenario (Figure 3). Demand is significantly impacted by the SIA schedule for MR in
these countries and the MR MAP supply constraints. In particular, demand fluctuates based on the years
when SIAs are scheduled to be conducted in lower-middle income countries who we estimate would
procure MR MAPs at a price per dose of $1.80 compared to $1.06 in low-income countries. As more
doses become available, we observe higher revenue in 2040. At a 10% discount rate, a DCVM could
realize an NPV of a $2.3 million loss (i.e., a negative NPV) between 2023 and 2040 and an IRR of 8% in
2023 dollars.
Figure 3. Cash flow by year and market for SIAs and outbreak response immunization.
-$19.6M
-$0.8M$2.8M $2.8M $3.5M $4.7M $5.1M
$2.3M $3.0M $4.5M $3.6M$7.7M
-50
-40
-30
-20
-10
0
10
20
30
40
50
60
Mill
ions
$
Lower-Middle Income Low Income Tech Transfer Tax
OPEX CAPEX COGS Net Cash Flows
March 2021
12
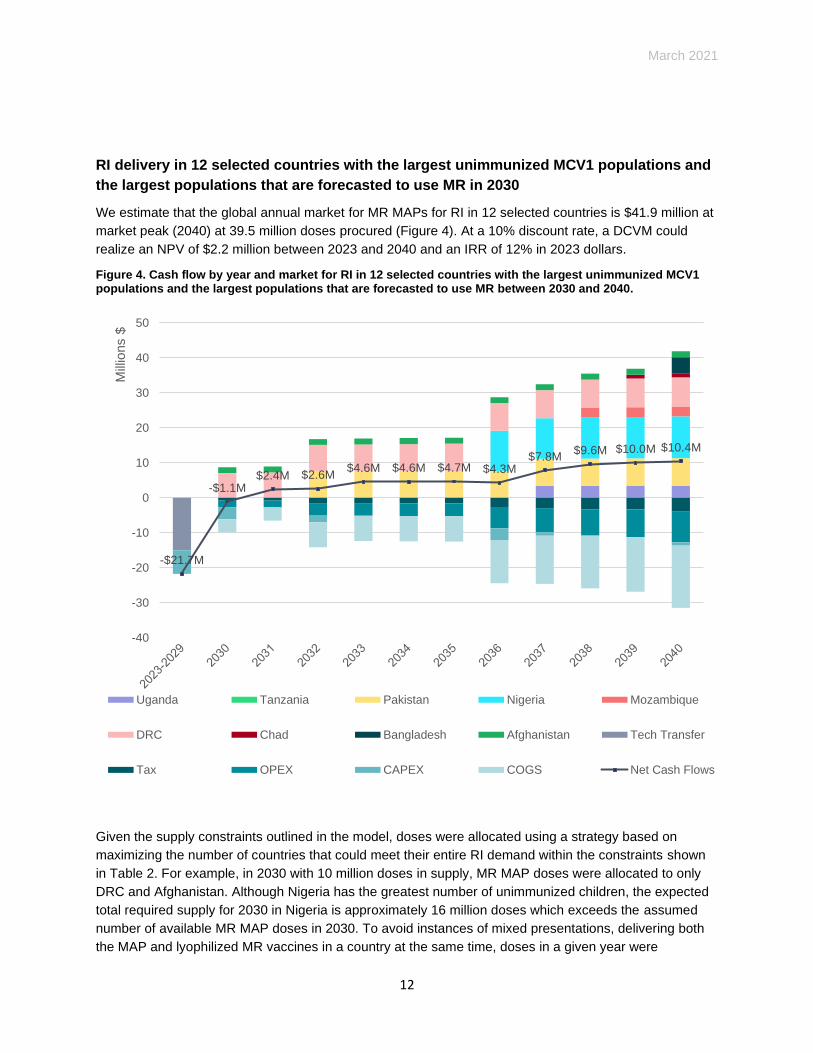
RI delivery in 12 selected countries with the largest unimmunized MCV1 populations and
the largest populations that are forecasted to use MR in 2030
We estimate that the global annual market for MR MAPs for RI in 12 selected countries is $41.9 million at
market peak (2040) at 39.5 million doses procured (Figure 4). At a 10% discount rate, a DCVM could
realize an NPV of $2.2 million between 2023 and 2040 and an IRR of 12% in 2023 dollars.
Figure 4. Cash flow by year and market for RI in 12 selected countries with the largest unimmunized MCV1 populations and the largest populations that are forecasted to use MR between 2030 and 2040.
Given the supply constraints outlined in the model, doses were allocated using a strategy based on
maximizing the number of countries that could meet their entire RI demand within the constraints shown
in Table 2. For example, in 2030 with 10 million doses in supply, MR MAP doses were allocated to only
DRC and Afghanistan. Although Nigeria has the greatest number of unimmunized children, the expected
total required supply for 2030 in Nigeria is approximately 16 million doses which exceeds the assumed
number of available MR MAP doses in 2030. To avoid instances of mixed presentations, delivering both
the MAP and lyophilized MR vaccines in a country at the same time, doses in a given year were
-$21.7M
-$1.1M$2.4M $2.6M
$4.6M $4.6M $4.7M $4.3M$7.8M
$9.6M $10.0M $10.4M
-40
-30
-20
-10
0
10
20
30
40
50
Mill
ions
$
Uganda Tanzania Pakistan Nigeria Mozambique
DRC Chad Bangladesh Afghanistan Tech Transfer
Tax OPEX CAPEX COGS Net Cash Flows
March 2021
13
prioritized to countries where the total RI demand could be met with the MR MAP presentation. As a
result of the supply constraints, only 9 of the 12 priority countries were allocated doses of MR MAP
between 2030-2040 in this use scenario; Ethiopia, Indonesia, and South Africa were excluded from the
base case analysis. See the appendix for unconstrained scenarios without supply constraints.
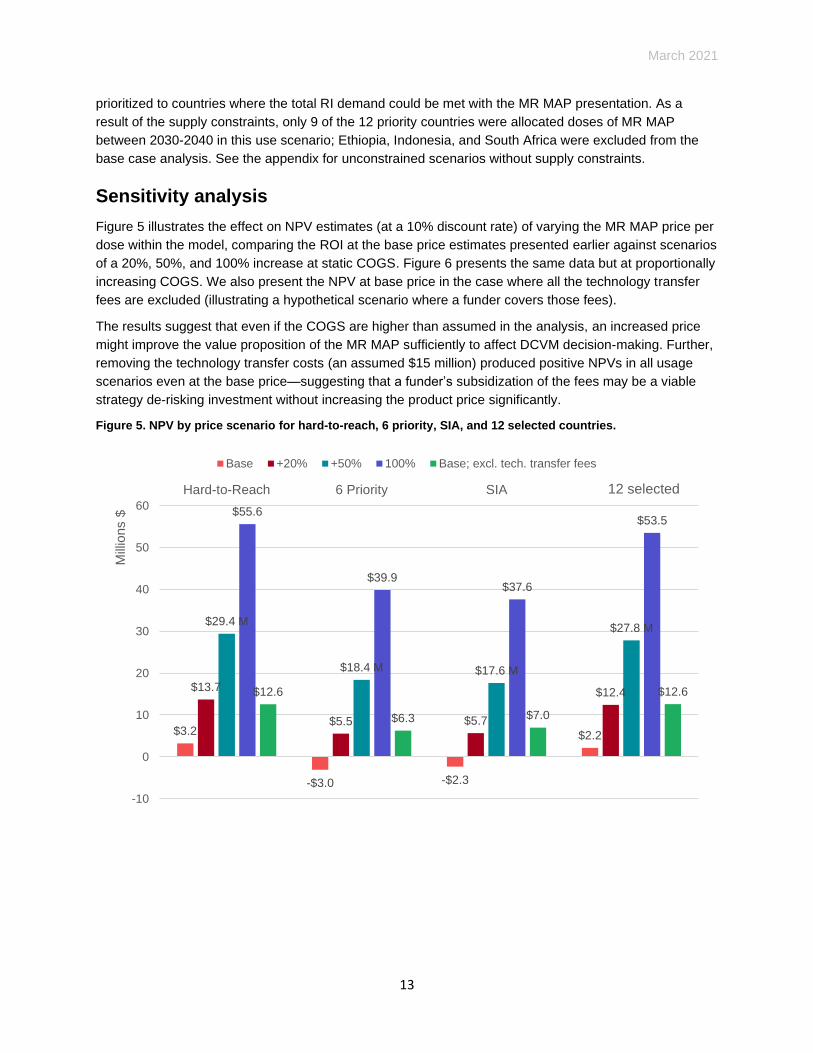
Sensitivity analysis
Figure 5 illustrates the effect on NPV estimates (at a 10% discount rate) of varying the MR MAP price per
dose within the model, comparing the ROI at the base price estimates presented earlier against scenarios
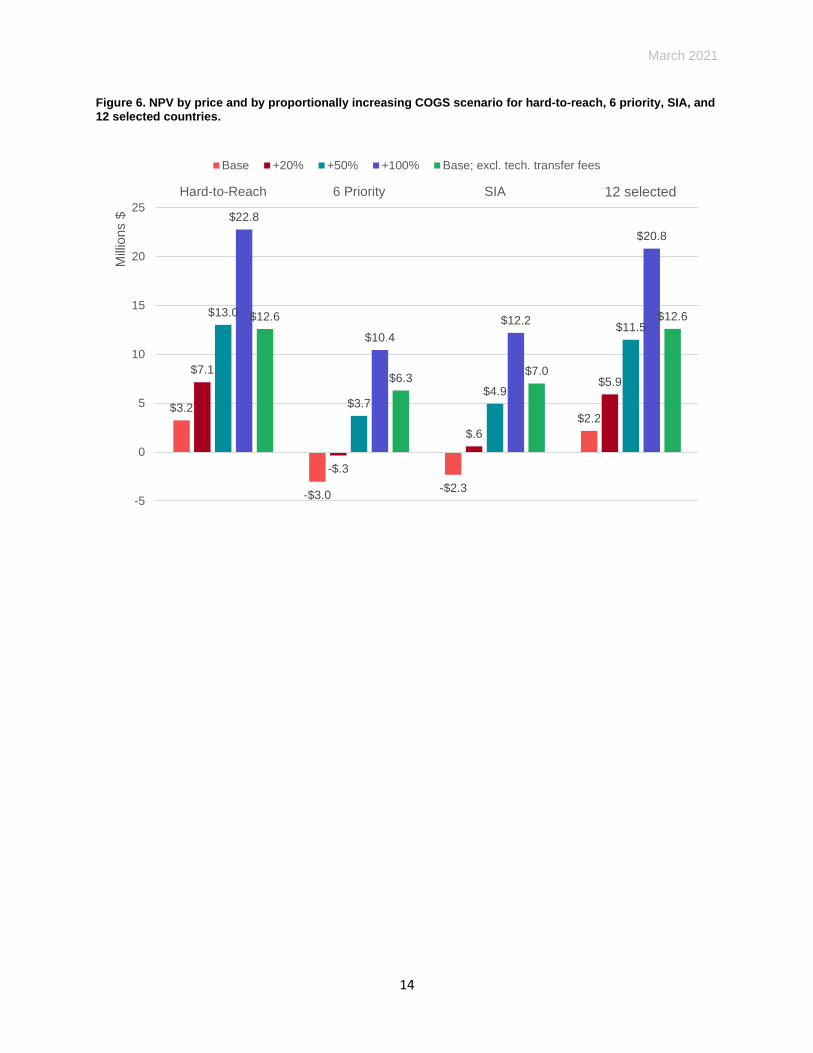
of a 20%, 50%, and 100% increase at static COGS. Figure 6 presents the same data but at proportionally
increasing COGS. We also present the NPV at base price in the case where all the technology transfer
fees are excluded (illustrating a hypothetical scenario where a funder covers those fees).
The results suggest that even if the COGS are higher than assumed in the analysis, an increased price
might improve the value proposition of the MR MAP sufficiently to affect DCVM decision-making. Further,
removing the technology transfer costs (an assumed $15 million) produced positive NPVs in all usage
scenarios even at the base price—suggesting that a funder’s subsidization of the fees may be a viable
strategy de-risking investment without increasing the product price significantly.
Figure 5. NPV by price scenario for hard-to-reach, 6 priority, SIA, and 12 selected countries.
$3.2
-$3.0 -$2.3
$2.2
$13.7
$5.5 $5.7
$12.4
$29.4 M
$18.4 M $17.6 M
$27.8 M
$55.6
$39.9$37.6
$53.5
$12.6
$6.3 $7.0
$12.6
-10
0
10
20
30
40
50
60
Hard-to-Reach 6 Priority SIA 12 Priority
Mill
ions $
Base +20% +50% 100% Base; excl. tech. transfer fees
12 selected
March 2021
14
Figure 6. NPV by price and by proportionally increasing COGS scenario for hard-to-reach, 6 priority, SIA, and 12 selected countries.
$3.2
-$3.0-$2.3
$2.2
$7.1
-$.3
$.6
$5.9
$13.0
$3.7$4.9
$11.5
$22.8
$10.4
$12.2
$20.8
$12.6
$6.3$7.0
$12.6
-5
0
5
10
15
20
25
Hard-to-Reach 6 Priority SIA 12 Priority
Mill
ions $
Base +20% +50% +100% Base; excl. tech. transfer fees
12 selected
March 2021
15
Challenges and opportunities
Based on the analysis results and interviews with experts, we outline below some factors that may impact
the MR MAP value proposition for DCVMs and suggest potential solutions.
Reducing the risk of targeting resource-limited markets
Gavi currently provides financial support to LMICs to use the N&S MR vaccine in routine immunization
and campaigns. Without similar assistance for the MR MAP, the countries with the lowest MCV coverage
may not be able to adopt the new product. The perceived lack of clarity for vaccine manufacturers on
future Gavi assistance (and resulting lack of clarity on potential demand) is a risk for manufacturer
investments in MR MAPs. Increased clarity on Gavi’s position on MR MAP support is expected as a
component of the upcoming VIPS 5-year Action Plan for vaccine MAPs.9
The MR MAP has the potential to improve coverage and equity. However, a low-cost MR vaccine already
exists—making it unlikely that countries would be willing to pay much more for a new presentation. Based
on lessons from the introduction of vaccines using the Uniject™ injection system,g the price per dose
plays a major role in the adoption of vaccine product innovations for LMIC markets.
De-risking the endeavor through advanced purchase agreements—–which might be warranted given the
potential benefits of an MR MAP—could reduce economic uncertainty for manufacturers and improve
their confidence for expected returns. A higher price premium than N&S vaccines would also boost
potential revenue. As shown in the sensitivity analysis results, increasing the price of the product would
improve the NPV of the investment in all usage scenarios.
Mitigating R&D, regulatory, and licensing risks
MR MAP candidates are still in early clinical development and have not yet demonstrated capabilities for
mass production. Although we have used plausible assumptions for the cost estimates, our analysis did
not account for failure rates and technical challenges that may arise from the process of adopting a
complicated new technology at an industrial scale.
The necessary regulatory costs for MR MAPs are also unknown. Because MR vaccines were licensed
many years ago, the costs and risks of reopening safety profiles or changing production processes to
meet current regulatory requirements may exceed our estimates. Further, supporting data from bridging
studies demonstrating immunological non-inferiority may be needed for regulatory approval of MAPs in
general for existing vaccines.7 Additionally, because MAPs represent a new technology in the vaccine
world, manufacturers will need guidance to develop good manufacturing practices and quality control
methods for production and characterization.10
One strategy to mitigate the risk is to subsidize early technology adoption costs. The sensitivity analysis
results demonstrate that excluding technology transfer costs resulted in positive NPVs across all usage
scenarios. Reducing the overall development and regulatory timeline may also have a significant impact
on the valuation metrics (since future cash flows are discounted in the NPV calculation). Options for
accelerating the regulatory process include obtaining support and recommendations from Gavi and WHO
g Uniject is a trademark of BD.
March 2021
16
and initiating dialogue with regulatory authorities on the potential implementation of expedited approval
processes for adapting MAPs to existing vaccines.
Innovative solutions
In addition to the opportunities outlined above, we also generated some potential ‘creative’ solutions—
beyond the scope of our analysis—that could improve the investment value proposition.
Adding an additional antigen to enhance the commercialization opportunity
Most upper-middle- and high-income countries employ costlier measles-mumps-rubella (MMR) or
measles-mumps-rubella-varicella (MMRV) combination vaccines in their immunization programs.
Although currently not in the MAP development pipeline, a MAP-based MMR or MMRV vaccine could
open markets in upper-middle- and high-income countries and present a more attractive investment for
both DCVM and multinational corporation (MNC) manufacturers. Based on interviews with experts, it is
technically feasible for a manufacturer to simultaneously produce MR and MMR/MMRV MAPs in the
same facility—enabling a dual-market opportunity where the manufacturer could subsidize MR MAP
delivery to LMICs using profits generated from the MMR/MMRV MAP in high-income markets.
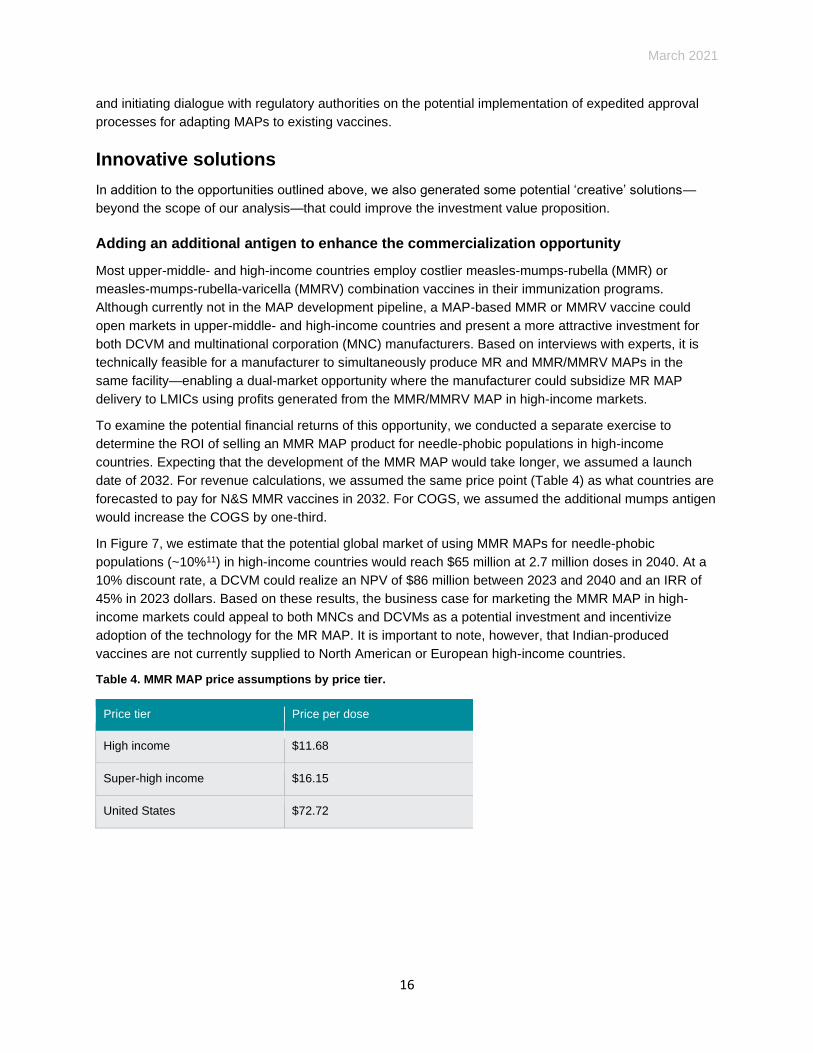
To examine the potential financial returns of this opportunity, we conducted a separate exercise to
determine the ROI of selling an MMR MAP product for needle-phobic populations in high-income
countries. Expecting that the development of the MMR MAP would take longer, we assumed a launch
date of 2032. For revenue calculations, we assumed the same price point (Table 4) as what countries are
forecasted to pay for N&S MMR vaccines in 2032. For COGS, we assumed the additional mumps antigen
would increase the COGS by one-third.
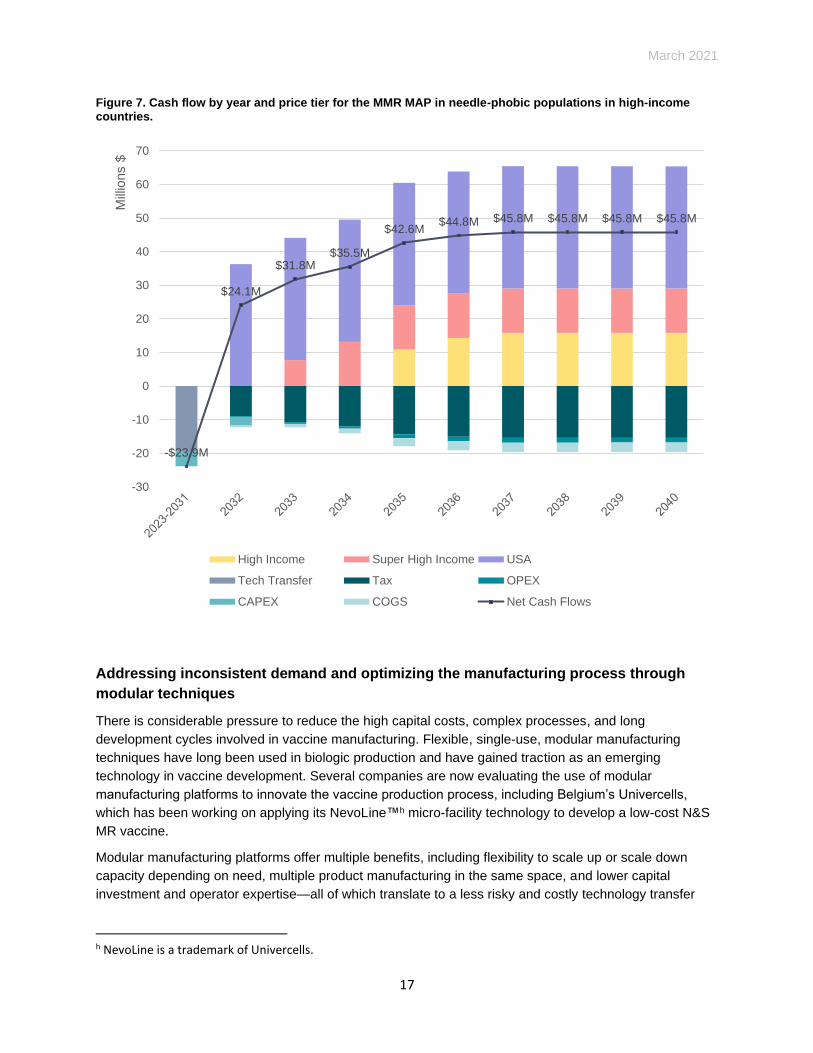
In Figure 7, we estimate that the potential global market of using MMR MAPs for needle-phobic
populations (~10%11) in high-income countries would reach $65 million at 2.7 million doses in 2040. At a
10% discount rate, a DCVM could realize an NPV of $86 million between 2023 and 2040 and an IRR of
45% in 2023 dollars. Based on these results, the business case for marketing the MMR MAP in high-
income markets could appeal to both MNCs and DCVMs as a potential investment and incentivize
adoption of the technology for the MR MAP. It is important to note, however, that Indian-produced
vaccines are not currently supplied to North American or European high-income countries.
Table 4. MMR MAP price assumptions by price tier.
Price tier Price per dose
High income $11.68
Super-high income $16.15
United States $72.72
March 2021
17
Figure 7. Cash flow by year and price tier for the MMR MAP in needle-phobic populations in high-income countries.
Addressing inconsistent demand and optimizing the manufacturing process through
modular techniques
There is considerable pressure to reduce the high capital costs, complex processes, and long
development cycles involved in vaccine manufacturing. Flexible, single-use, modular manufacturing
techniques have long been used in biologic production and have gained traction as an emerging
technology in vaccine development. Several companies are now evaluating the use of modular
manufacturing platforms to innovate the vaccine production process, including Belgium’s Univercells,
which has been working on applying its NevoLine™h micro-facility technology to develop a low-cost N&S
MR vaccine.
Modular manufacturing platforms offer multiple benefits, including flexibility to scale up or scale down
capacity depending on need, multiple product manufacturing in the same space, and lower capital
investment and operator expertise—all of which translate to a less risky and costly technology transfer
h NevoLine is a trademark of Univercells.
-$23.9M
$24.1M
$31.8M$35.5M
$42.6M$44.8M $45.8M $45.8M $45.8M $45.8M
-30
-20
-10
0
10
20
30
40
50
60
70
Mill
ions $
High Income Super High Income USA
Tech Transfer Tax OPEX
CAPEX COGS Net Cash Flows
March 2021
18
process. The ability to respond to rapid deployment needs and unpredictable demand could address
manufacturers’ concerns about providing vaccines for campaigns and outbreak response.
Moreover, typical facilities can take years to build and the capital commitment must be made when the
product is still in early trial stages—increasing the financial risk. Pursuing a modular facility concept may
allow a manufacturer to hold off on committing the capital until the risk profile of the product is
substantially lower.
Although the use of modular manufacturing technologies for MAP production has not been explored,
coupling both technologies may help address several MR MAP production risks faced in traditional
vaccine manufacturing—which is complex, manual, and based on decades-old technology that has not
been updated because of regulatory implications for licensed vaccines. Modular manufacturing may also
address manufacturer concerns about high upfront costs and inconsistent annual demand due to the
nature of campaign schedules and outbreaks and may lower COGS in the long run; it may also
streamline the complicated antigen processing steps required to formulate MR MAPs.
Partnering with CDMOs to lower overhead costs
Another potential opportunity is to transfer the MAP technology to a contract development and
manufacturing organization (CDMO). CDMOs have emerged in recent years as preferred partners for
vaccine development and scale-up, offering potential capability and cost advantages over in-house
manufacturing for pharmaceutical and biotechnology companies. CDMOs have greater flexibility around
which technological assets they invest in and may see the long-term value of MAP technology, which also
has applications outside of vaccines. CDMOs for vaccine MAPs currently do not exist.

March 2021
19
Conclusion
Our analysis shows that a strategy of targeting hard-to-reach populations would generate the highest MR
MAP return on investment at $3.2 million in net present value (base case): a scarcely adequate return
from the perspective of DCVMs. The findings underscore the critical need to bridge public health
expectations with production requirements to ensure that the market assumptions related to any new
innovation are informed by the technical and timeline realities inherent in the product development
process. A combination of strategies (including demand guarantees, price premiums, and direct financial
support for the manufacturing and development process) may be necessary to further boost revenues
and improve the attractiveness of the investment.
Overall, the financial models demonstrate that MR MAPs do not currently represent a strong and
financially compelling investment opportunity for DCVMs, and this business case provides a starting point
to reconsider strategies and promote dialogue on ways to address the risks of producing a novel vaccine
presentation for low-resource markets. Highlighted below are some recommended next steps that may
help to enhance the MR MAP business case and bring the product to markets in need.
• One of the most compelling public health benefits of MR MAPs is their potential ability to increase
measles vaccination coverage rates and address stalled progress to meet measles elimination targets.
To accelerate the development process and boost partner engagement, Gavi should clarify their
position on MR MAP support to vaccine manufacturers and propose activities to further clarify the
business case, which is expected as part of the upcoming VIPS 5-year Action Plan for vaccine MAPs.
• Building on the initial assumptions and methods used in this analysis, donors should actively work with
potential manufacturers to iterate and clarify the financial return scenarios based on individual
manufacturer assumptions—which can vary significantly depending on location, existing facilities,
expertise, etc.—to identify the support and incentives that manufacturing partners would require to de-
risk the endeavor and pursue MR MAP development for LMICs.
• Further analysis is needed to clarify the regulatory pathway and determine the studies and costs
necessary to bring the MR MAP to market and through WHO prequalification. Conversations with MR
MAP developers about technology transfer and future licensing costs must be quantified as well.
• Stakeholders should explore the potential solutions highlighted above, including a potential MMR or
MMRV MAP, using modular manufacturing platforms, and partnering with CDMOs as additional
options for investment.
Finally, it is important to note that the technology is still in its early stages and many technological and
market uncertainties remain that this analysis could not capture. As the MAP technology matures, MR
MAP clinical data are generated, and the benefits of the MAP platform are demonstrated with other
vaccines and essential medicines, the business case and incentives for investment may improve.
20
Appendix
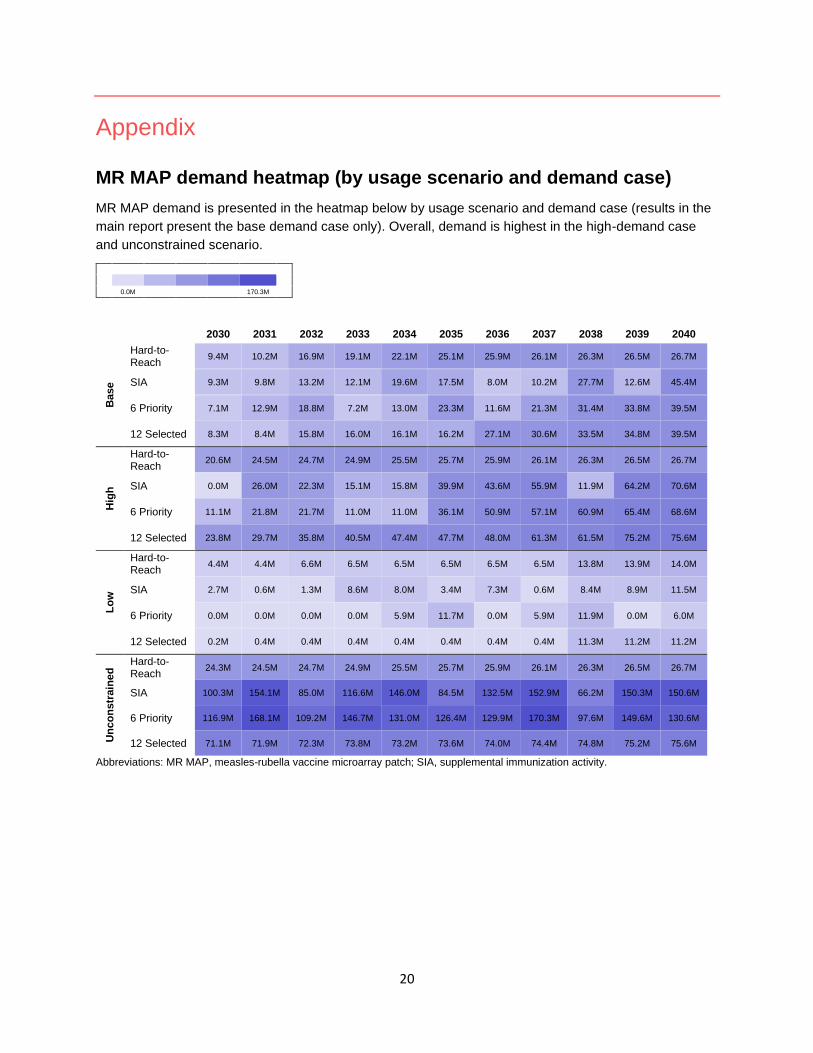
MR MAP demand heatmap (by usage scenario and demand case)
MR MAP demand is presented in the heatmap below by usage scenario and demand case (results in the
main report present the base demand case only). Overall, demand is highest in the high-demand case
and unconstrained scenario.
0.0M 170.3M
2030 2031 2032 2033 2034 2035 2036 2037 2038 2039 2040
Base
Hard-to-Reach
9.4M 10.2M 16.9M 19.1M 22.1M 25.1M 25.9M 26.1M 26.3M 26.5M 26.7M
SIA 9.3M 9.8M 13.2M 12.1M 19.6M 17.5M 8.0M 10.2M 27.7M 12.6M 45.4M
6 Priority 7.1M 12.9M 18.8M 7.2M 13.0M 23.3M 11.6M 21.3M 31.4M 33.8M 39.5M
12 Selected 8.3M 8.4M 15.8M 16.0M 16.1M 16.2M 27.1M 30.6M 33.5M 34.8M 39.5M
Hig
h
Hard-to-Reach
20.6M 24.5M 24.7M 24.9M 25.5M 25.7M 25.9M 26.1M 26.3M 26.5M 26.7M
SIA 0.0M 26.0M 22.3M 15.1M 15.8M 39.9M 43.6M 55.9M 11.9M 64.2M 70.6M
6 Priority 11.1M 21.8M 21.7M 11.0M 11.0M 36.1M 50.9M 57.1M 60.9M 65.4M 68.6M
12 Selected 23.8M 29.7M 35.8M 40.5M 47.4M 47.7M 48.0M 61.3M 61.5M 75.2M 75.6M
Lo
w
Hard-to-Reach
4.4M 4.4M 6.6M 6.5M 6.5M 6.5M 6.5M 6.5M 13.8M 13.9M 14.0M
SIA 2.7M 0.6M 1.3M 8.6M 8.0M 3.4M 7.3M 0.6M 8.4M 8.9M 11.5M
6 Priority 0.0M 0.0M 0.0M 0.0M 5.9M 11.7M 0.0M 5.9M 11.9M 0.0M 6.0M
12 Selected 0.2M 0.4M 0.4M 0.4M 0.4M 0.4M 0.4M 0.4M 11.3M 11.2M 11.2M
Un
co
nstr
ain
ed
Hard-to-Reach
24.3M 24.5M 24.7M 24.9M 25.5M 25.7M 25.9M 26.1M 26.3M 26.5M 26.7M
SIA 100.3M 154.1M 85.0M 116.6M 146.0M 84.5M 132.5M 152.9M 66.2M 150.3M 150.6M
6 Priority 116.9M 168.1M 109.2M 146.7M 131.0M 126.4M 129.9M 170.3M 97.6M 149.6M 130.6M
12 Selected 71.1M 71.9M 72.3M 73.8M 73.2M 73.6M 74.0M 74.4M 74.8M 75.2M 75.6M
Abbreviations: MR MAP, measles-rubella vaccine microarray patch; SIA, supplemental immunization activity.
21
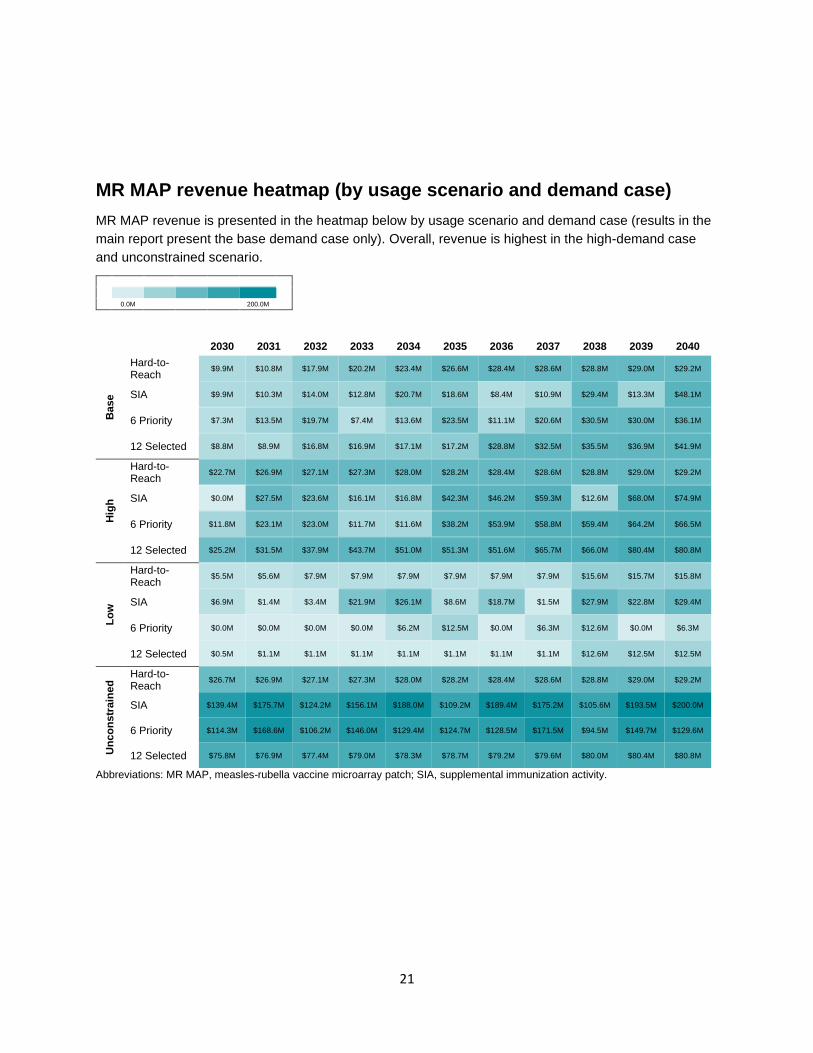
MR MAP revenue heatmap (by usage scenario and demand case)
MR MAP revenue is presented in the heatmap below by usage scenario and demand case (results in the
main report present the base demand case only). Overall, revenue is highest in the high-demand case
and unconstrained scenario.
0.0M 200.0M
2030 2031 2032 2033 2034 2035 2036 2037 2038 2039 2040
Base
Hard-to-Reach
$9.9M $10.8M $17.9M $20.2M $23.4M $26.6M $28.4M $28.6M $28.8M $29.0M $29.2M
SIA $9.9M $10.3M $14.0M $12.8M $20.7M $18.6M $8.4M $10.9M $29.4M $13.3M $48.1M
6 Priority $7.3M $13.5M $19.7M $7.4M $13.6M $23.5M $11.1M $20.6M $30.5M $30.0M $36.1M
12 Selected $8.8M $8.9M $16.8M $16.9M $17.1M $17.2M $28.8M $32.5M $35.5M $36.9M $41.9M
Hig
h
Hard-to-Reach
$22.7M $26.9M $27.1M $27.3M $28.0M $28.2M $28.4M $28.6M $28.8M $29.0M $29.2M
SIA $0.0M $27.5M $23.6M $16.1M $16.8M $42.3M $46.2M $59.3M $12.6M $68.0M $74.9M
6 Priority $11.8M $23.1M $23.0M $11.7M $11.6M $38.2M $53.9M $58.8M $59.4M $64.2M $66.5M
12 Selected $25.2M $31.5M $37.9M $43.7M $51.0M $51.3M $51.6M $65.7M $66.0M $80.4M $80.8M
Lo
w
Hard-to-Reach
$5.5M $5.6M $7.9M $7.9M $7.9M $7.9M $7.9M $7.9M $15.6M $15.7M $15.8M
SIA $6.9M $1.4M $3.4M $21.9M $26.1M $8.6M $18.7M $1.5M $27.9M $22.8M $29.4M
6 Priority $0.0M $0.0M $0.0M $0.0M $6.2M $12.5M $0.0M $6.3M $12.6M $0.0M $6.3M
12 Selected $0.5M $1.1M $1.1M $1.1M $1.1M $1.1M $1.1M $1.1M $12.6M $12.5M $12.5M
Un
co
nstr
ain
ed
Hard-to-Reach
$26.7M $26.9M $27.1M $27.3M $28.0M $28.2M $28.4M $28.6M $28.8M $29.0M $29.2M
SIA $139.4M $175.7M $124.2M $156.1M $188.0M $109.2M $189.4M $175.2M $105.6M $193.5M $200.0M
6 Priority $114.3M $168.6M $106.2M $146.0M $129.4M $124.7M $128.5M $171.5M $94.5M $149.7M $129.6M
12 Selected $75.8M $76.9M $77.4M $79.0M $78.3M $78.7M $79.2M $79.6M $80.0M $80.4M $80.8M
Abbreviations: MR MAP, measles-rubella vaccine microarray patch; SIA, supplemental immunization activity.

22
MR MAP NPV heatmap by discount rate, usage scenario, and demand
case
MR MAP NPV at both 10% and 25% discount rates are presented in the heatmap below by usage
scenario (results in the main report present the base demand case only). The NPV is highest in the
unconstrained SIA scenario at a discount rate of 10%. The lowest NPV is in the low demand case in both
the 6 priority countries (RI and campaigns) and 12 selected countries (RI only).
-11.2M 157.4M
Low Base High Unconstrained
NP
V (
10%
)
Hard-to-Reach
-$5.2M $3.2M $9.4M $9.9M
SIA $10.8M -$2.3M $7.9M $157.4M
6 Priority -$11.2M -$3.0M $11.6M $71.2M
12 Selected -$10.7M $2.2M $17.8M $39.8M
NP
V (
25%
)
Hard-to-Reach
-$6.4M -$4.9M -$3.2M -$3.1M
SIA -$3.4M -$5.7M -$4.3M $28.2M
6 Priority -$7.5M -$6.0M -$3.5M $9.0M
12 Selected -$7.6M -$5.2M -$2.0M $3.3M
Abbreviations: MR MAP, measles-rubella vaccine microarray patch; NPV, net present value; SIA, supplemental immunization
activity.
23
References
1. World Health Organization (WHO). Measles vaccines: WHO position paper – April 2017. Weekly
Epidemiological Record. 2017;92(17):205–228.
www.who.int/immunization/policy/position_papers/measles/en/.
2. World Health Organization (WHO). Rubella vaccines: WHO position paper – July 2020. Weekly
Epidemiological Record. 2020;95(27):306–324.
www.who.int/immunization/policy/position_papers/rubella/en/.
3. World Health Organization website. Provisional monthly measles and rubella data page.
https://www.who.int/teams/immunization-vaccines-and-biologicals/immunization-analysis-and-
insights/surveillance/monitoring/provisional-monthly-measles-and-rubella-data. Accessed January 26,
2021
4. Hampton LM. Vaccine handling and administration errors should be addressed to improve vaccine
program safety. Vaccine. 2020;38(32):4933–4934. doi:10.1016/j.vaccine.2020.05.092.
5. World Health Organization (WHO), United Nations Children's Fund. Measles-Rubella Microarray
Patch (MR–MAP) Target Product Profile. Geneva: WHO; 2020.
https://apps.who.int/iris/handle/10665/330394.
6. Crager SE. Improving global access to new vaccines: Intellectual property, technology transfer, and
regulatory pathways. American Journal of Public Health. 2018;108(S6):S414–S420.
doi:10.2105/ajph.2014.302236r.
7. Peyraud N, Zehrung D, Jarrahian C, Frivold C, Orubu T, Giersing B. Potential use of microarray
patches for vaccine delivery in low- and middle-income countries. Vaccine. 2019;37(32):4427–4434.
doi:10.1016/j.vaccine.2019.03.035.
8. Adhikari BB, Goodson JL, Chu SY, Rota PA, Meltzer MI. Assessing the potential cost-effectiveness of
microneedle patches in childhood measles vaccination programs: The case for further research and
development. Drugs in R&D. 2016;16(4):327–338. doi:10.1007/s40268-016-0144-x.
9. Gavi, the Vaccine Alliance, website. The Vaccine Innovation Prioritisation Strategy (VIPS) page.
www.gavi.org/our-alliance/market-shaping/vaccine-innovation-prioritisation-strategy. Accessed
January 26, 2021.
10. Rodgers AM, Cordeiro AS, Donnelly RF. Technology update: Dissolvable microneedle patches for
vaccine delivery. Medical Devices: Evidence and Research. 2019;12:379–398.
doi:10.2147/mder.s198220.
11. Orenius T, Säilä H, Mikola K, Ristolainen L. Fear of injections and needle phobia among children and
adolescents: An overview of psychological, behavioral, and contextual factors. SAGE Open Nursing.
2018;4:1–8. doi:10.1177/2377960818759442.