MEAS URIN G THE GREEN TR ANSFORMATION OF THE ECO NOMY
117
TR This draft d Eastern Par and Ukrain European U Comments (mikaela.ra RANS Gu document wa rtnership (Ea ne) to move t Union and is on this draft ambali@oecd MEAS FORM uide for E as developed aP) countries towards a gre implemente t should be s d.org) by end SURIN MATIO EU East M Draft d as part of th s (Armenia, A een economy d by the OEC ubmitted to M d of July 201 NG TH ON OF tern Par March 2016 t for comm he European Azerbaijan, B y. The EaP G CD in partne Mikaela Ram 16. HE GR F THE rtnership 6 ments Union’s EaP Belarus, Geo GREEN is fun ership with U mbali, OECD REEN E ECO p countr P GREEN Pr orgia, Republ nded princip UNEP, UNID D Secretariat ONOM ies roject which lic of Moldo pally by the DO and UNE t MY: helps ova ECE.
Transcript of MEAS URIN G THE GREEN TR ANSFORMATION OF THE ECO NOMY

TR
This draft dEastern Parand UkrainEuropean U Comments (mikaela.ra
RANS
Gu
document wartnership (Ea
ne) to move tUnion and is
on this draftambali@oecd
MEASFORM
uide for E
as developedaP) countriestowards a greimplemente
ft should be sd.org) by end
SURINMATIO
EU East
M
Draft
d as part of ths (Armenia, Aeen economyd by the OEC
ubmitted to Md of July 201
NG THON OF
tern Par
March 2016
ft for comm
he European Azerbaijan, By. The EaP GCD in partne
Mikaela Ram16.
HE GRF THE
rtnership
6
ments
Union’s EaPBelarus, Geo
GREEN is funership with U
mbali, OECD
REENE ECO
p countr
P GREEN Prorgia, Republnded princip
UNEP, UNID
D Secretariat
ONOM
ries
roject which lic of Moldo
pally by the DO and UNE
t
MY:
helps ova
ECE.

2
TABLE OF CONTENTS
LIST OF ABBREVIATIONS ......................................................................................................................... 6
EXECUTIVE SUMMARY ............................................................................................................................. 8
A framework to measure the green transformation of the economy ............................................................ 8 Lessons learned from the application of the green growth measurement framework ................................. 9 Compiling and testing a national green growth measurement framework .................................................. 9
INTRODUCTION ......................................................................................................................................... 11
Background ................................................................................................................................................ 11 Structure of the document .......................................................................................................................... 12 Authors and development process ............................................................................................................. 12
CHAPTER 1: A FRAMEWORK FOR DEVELOPING AND APPLYING GREEN GROWTH INDICATORS ............................................................................................................................................... 13
1.1 Green growth policies –fostering economic performance and preserving natural capital ................... 13 1.2 The OECD green growth measurement framework and its indicators ................................................ 15
1.2.1 The OECD conceptual framework ................................................................................................ 15 1.2.2 Rationale behind and structure of the OECD set of green growth indicators ............................... 17
1.3 Other OECD work on measuring progress in environment and well-being ........................................ 22 1.3.1 OECD Environment indicators ..................................................................................................... 22 1.3.2 Wealth accounting approaches ...................................................................................................... 22
1.4 Towards measuring the green transformation of the economy in EU Eastern Partnership countries .. 24
CHAPTER 2: GREEN GROWTH INDICATORS – DETAILED DESCRIPTION .................................... 26
2.1 The socio-economic context ................................................................................................................ 26 2.1.1 Economic growth, productivity and competitiveness ................................................................... 27 2.1.2 Labour market, education and health ............................................................................................ 30
2.2 The environmental and resource productivity of the economy ............................................................ 32 2.2.1 Carbon productivity ....................................................................................................................... 34 2.2.2 Energy productivity ....................................................................................................................... 37 2.2.3 Resource productivity – materials ................................................................................................. 41 2.2.4 Resource productivity - waste ....................................................................................................... 43 2.2.5 Resource productivity - nutrients .................................................................................................. 45 2.2.6 Resource productivity – water productivity .................................................................................. 47
2.3 The natural asset base .......................................................................................................................... 48 2.3.1 Renewable stocks - freshwater resources ...................................................................................... 49 2.3.2 Renewable stocks – forest resources ............................................................................................. 53 2.3.3 Renewable stocks – fish resources ................................................................................................ 56 2.3.4 Biodiversity and ecosystems – land resources .............................................................................. 57 2.3.5 Biodiversity and ecosystems – wildlife resources ......................................................................... 61
2.4 The environmental quality of life ........................................................................................................ 64 2.4.1 Environmental health and risks – air quality ................................................................................. 65 2.4.2 Environmental services and amenities - access to sewage treatment and drinking water ............. 69
2.5 Economic opportunities and policy responses ..................................................................................... 72 2.5.1 Technology and innovation ........................................................................................................... 74 2.5.2 Environmental goods and services ................................................................................................ 77 2.5.3 Prices and transfers ........................................................................................................................ 78

3
CHAPTER 3: GREEN GROWTH INDICATORS IN PRACTICE ............................................................. 82
3.1 Application by the OECD .................................................................................................................... 82 3.2 Application in the OECD countries ..................................................................................................... 83
3.2.1 The Netherlands ............................................................................................................................ 83 3.2.2 The Czech Republic ...................................................................................................................... 88 3.2.3 Germany ........................................................................................................................................ 90 3.2.4 Denmark ........................................................................................................................................ 92 3.2.5 Slovenia ......................................................................................................................................... 94 3.2.6 Slovak Republic ............................................................................................................................ 95 3.2.7 Republic of Korea ......................................................................................................................... 96 3.2.8 Mexico ........................................................................................................................................... 97
3.3 Application in Latin America and the Caribbean ................................................................................ 97 3.4 Application in East Asia ...................................................................................................................... 98 3.5 International cooperation on monitoring progress towards green growth ........................................... 99 3.6 Key findings from the analysis of GGIs application in practice ........................................................ 101
CHAPTER 4: DEVISING NATIONAL SETS OF GREEN GROWTH INDICATORS ........................... 102
4.1 Overall approach ................................................................................................................................ 102 4.2 Identifying awareness and demand .................................................................................................... 103 4.3 Setting a schedule for a pilot testing .................................................................................................. 104 4.4 Identifying stakeholders ..................................................................................................................... 105 4.5 Expert analysis: Development of a national measurement framework .............................................. 106
4.5.1 Identifying indicators for the national measurement framework ................................................ 106 4.5.2 Identifying data sources and providers ........................................................................................ 108 4.5.3 Structuring the measurement framework .................................................................................... 108 4.5.4 Identifying headline indicators .................................................................................................... 108 4.5.4 Analysing steps towards a regular measurement practice ........................................................... 109
4.6 Stakeholder consultations .................................................................................................................. 109 4.7 Finalisation of the expert paper .......................................................................................................... 109 4.8 Finalisation of the data-based publication on the application of GGIs .............................................. 109 4.9 Dissemination of the results and implementation of follow up action ............................................... 110
REFERENCES ............................................................................................................................................ 111
ANNEX: THE OECD SET OF GREEN GROWTH INDICATORS - OVERVIEW BY GROUP AND BY THEME ....................................................................................................................................................... 115
Tables
Table 1. OECD green growth measurement framework - indicator groups and topics covered ......... 20 Table 2. Overview of selected indicator types and relevant SEEA accounts ...................................... 21 Table 3. The socio-economic context - proposed indicators ............................................................... 26 Table 4. The environmental and resource productivity of the economy - proposed indicators ........... 33 Table 5. Mapping of UNECE and OECD dataflows on energy .......................................................... 39 Table 6. Mapping of UNECE and OECD dataflows of waste ............................................................. 44 Table 7. Mappingo f UNECE and OECD dataflows on water productivity ........................................ 47 Table 8. The natural asset base - proposed indicators ......................................................................... 49 Table 9. Mapping of UNECE and OECD dataflows on water ............................................................ 51 Table 10. Mapping of UNECE and OECD dataflows on forest resources ............................................ 54 Table 11. Mapping of UNECE and OECD dataflows on land resources .............................................. 59

4
Table 12. Mapping of UNECE and OECD dataflows on wildlife resources ......................................... 62 Table 13. The environmental qualitiy of life - proposed indicators ...................................................... 65 Table 14. Mapping of UNECE and OECD dataflows on air pollution and ozone depletion ................ 67 Table 15. Mapping of UNECE and OECD dataflows on sewage treatment and drinking water .......... 70 Table 16. Economic opportunities and policy responses - proposed indicators .................................... 73 Table 17. Comparative analysis of GGIs application ............................................................................ 83 Table 18. Position of the Netherlands in the OECD and internationally in terms of green growth indicators 87
Figures
Figure 1. OECD's conceptual measurement framework for green growth ........................................... 16 Figure 2. Input-output model of green growth ...................................................................................... 17 Figure 3. OECD Green growth indicators - the foundations and the overall indicator architecture ..... 19 Figure 4. OECD framework for measuring well-being and progress ................................................... 24 Figure 5. Labour and multifactor productivity ...................................................................................... 29 Figure 6. Competitiveness index ........................................................................................................... 29 Figure 7. Income inequality .................................................................................................................. 32 Figure 8. CO2 productivity ................................................................................................................... 36 Figure 9. Energy productivity ............................................................................................................... 40 Figure 10. Total final energy consumption by sector ......................................................................... 40 Figure 11. Domestic material consumption (DMC) ........................................................................... 43 Figure 12. Decoupling trends: agricultural nutrient balances and agricultural production ................. 46 Figure 13. Freshwater stocks and abstraction intensities in OECD countries .................................... 52 Figure 14. Forest land and growing stock ........................................................................................... 55 Figure 15. Global trends in the state of world marine stocks .............................................................. 57 Figure 16. Land-use changes .............................................................................................................. 60 Figure 17. Threatened species ............................................................................................................. 63 Figure 18. Population exposed to air pollution by fine particulates (PM2.5), by WHO thresholds ... 67 Figure 19. Population exposed to air pollution by ozone .................................................................... 68 Figure 20. Population of OECD countries connected to a wastewater treatment plant ...................... 71 Figure 21. Government R&D budget related to energy and environment .......................................... 76 Figure 22. The environmental goods and services sector in the European Union .............................. 78 Figure 23. Environmentally related tax revenue ................................................................................. 80 Figure 24. Top sectors and green growth indicators in the Netherlands ............................................. 84 Figure 25. Share of renewable energy in gross final energy consumption ......................................... 88 Figure 26. Energy productivity and primary energy supply in the Czech Republic ........................... 90 Figure 27. Greenhouse gas productivity in Germany (domestic concept) .......................................... 91 Figure 28. Added value from green production .................................................................................. 93 Figure 29. Added value per full-time employee from green production, Denmark ............................ 94 Figure 30. Emission productivity, Slovenia ........................................................................................ 95 Figure 31. Number of exceedances of daily limit value for PM10 ..................................................... 96 Figure 32. Testing a national measurement framework for green growth: stakeholders, actions and products 103
Boxes
Box 1. Key elements of green growth ....................................................................................................... 13

5
Box 2. The System of Environmental-Economic Accounting (SEEA) ..................................................... 21 Box 3. The Shared Environmental Information System (SEIS) and green growth ................................... 25 Box 4. Trends in productivity and trade in OECD countries ..................................................................... 29 Box 5. Rising income inequality poses social and economic challenges .................................................. 32 Box 6. Understanding the notion of productivity ...................................................................................... 33 Box 7. Calculating consumption and production-based CO2 emissions ................................................... 35 Box 8. Trends in CO2 productivity ............................................................................................................ 36 Box 9. Calculating energy-related GGIs based on SEIS dataflows ........................................................... 39 Box 10. Trends in energy productivity in OECD countries ....................................................................... 40 Box 11. Trends in domestic material productivity in OECD countries ..................................................... 42 Box 12. Calculating GGI “Waste generation intensity and recovery ratios” based on SEIS dataflows .... 44 Box 13. Trends in agricultural nutrient balances and agricultural production in OECD countries ........... 46 Box 14. Calculating GGI “Water productivity” based on SEIS dataflows ................................................ 47 Box 15. Calculating GGI “Freshwater resources” based on SEIS dataflows ............................................ 50 Box 16. Trends in freshwater stocks and abstraction intensities in OECD countries ................................ 52 Box 17. Calculating GGI “Forest resources” based on SEIS dataflows .................................................... 54 Box 18. Trends in forest land and volume of forest resource stocks in OECD countries .......................... 55 Box 19. Trends in the state of world marine stocks ................................................................................... 56 Box 20. Calculating GGI “Land resources” based on SEIS dataflows ...................................................... 59 Box 21. Trends in land use in OECD countries ......................................................................................... 60 Box 22. Calculating GGI “Wildlife resources” based on SEIS dataflows ................................................. 61 Box 23. Threatened species in OECD countries ........................................................................................ 63 Box 24. Calculating GGI “Population exposure to air pollution” based on SEIS dataflows ..................... 66 Box 25. Trends in air quality in OECD countries ...................................................................................... 67 Box 26. The Sustainable Development Goals ........................................................................................... 69 Box 27. Calculating GGI “Access to sewage treatment and drinking water” based on SEIS dataflows ... 70 Box 28. Trends in access to sewage treatment in OECD countries ........................................................... 71 Box 29. Trends in research and development (R&D) expenditure in OECD countries ............................ 76 Box 30. Trends in the environmental goods and services sector in the European Union .......................... 78 Box 31. Trends in environmentally related tax revenue in OECD countries ............................................. 80 Box 32. The sectoral perspective ............................................................................................................... 84 Box 33. The international perspective ....................................................................................................... 86 Box 34. Energy productivity in the Czech Republic ................................................................................. 89 Box 35. CO2 and GHG emissions and productivity in Germany .............................................................. 91 Box 36. Green business areas defined for Denmark .................................................................................. 92 Box 37. Added value from green production in Denmark ......................................................................... 93 Box 38. Emission productivity in Slovenia ............................................................................................... 94 Box 39. Exposition of the public to air pollution by particulate matter (PM10) in the Slovak Republic .. 96 Box 40. Applying the OECD green growth measurement framework in LAC countries ......................... 97 Box 41. Key messages towards green growth in Southeast Asia .............................................................. 99 Box 42. Towards measuring the green transformation of the economy in the Kyrgyz Republic ............ 105

6
LIST OF ABBREVIATIONS
ASEAN Association of Southeast Asian Nations BRIICS Brazil, Russian Federation, India, Indonesia, People’s Republic of China and South Africa CAF Latin American Development Bank CBD Convention on Biological Diversity CDM Clean Development Mechanism CEPA Classification of environmental protection activities CPIs Consumer price indices CREMA Classification of resource management activities CRS Creditor Reporting System DAC Development Assistance Committee DEU Domestic extraction used DIs Diagnostics Indicators DMC Domestic material productivity EaP GREEN Greening Economies in the EU's Eastern Neighbourhood EaP EU Eastern Partnership ECLA European Classification System EEA European Environmental Agency EFTA European Free Trade Association EGS Environmental goods and services EI Environmental indicators EPR Environmental Performance Reviews ETS Emission Trading Scheme EU European Union FAOSTAT Food and agriculture organisation corporate statistical database FRA Forest Resource Assessments GALI Global Activity Limitation Indicator GBAORD Government budget appropriations or outlays for R&D GBD Global Burden of Disease GDP Gross Domestic Product GGGI Global Green Growth Institute GGI Green Growth Indicators GGKP Green Growth Knowledge Platform GHG Greenhouse gas GNI Gross national income HLY Healthy Life Years ICES International Council for the Exploration of the Sea ICT Information and communications technology IDHP International Human Dimensions Programme IEA International Energy Agency IHME Institute for Health Metrics and Evaluation ILO International Labour Office INEGI National statistical and geographical institute IPC International Patent Classification ISIC International Standard Industrial Classification of All Economic Activities IUCN International Union for the Conservation of Nature IWI Inclusive Wealth Index JMP Joint Monitoring Programme

7
MDB Multilateral development banks MDG Millennium Development Goal MEIs Monitoring and Evaluation Indicators MFA Material flow accounting and analysis MFP Multifactor productivity MRIO Multi-regional input-output NGO Non-governmental Organisation NNI Net national income ODA Official development assistance OECD Organisation for Economic Co-operation and Development PCT Patent Cooperation Treaty PEI Poverty and Environment Initiative PIs Planning Indicators PPP Purchasing power parities PSE Producer support estimates PSR model Pressure-state-response model PV Photovoltaic R&D Research and development SDG Sustainable Development Goals SEEA System of integrated environmental and economic accounting SEIS Shared Environmental Information System SELA Latin American and Caribbean Economic System SME Small and medium-sized enterprises SNA System of national accounts TPES Total primary energy supply ULC Unit labour cost UNCED United Nations Conference on Environment and Development UNECE United Nations Economic Commission for Europe UNEP United Nations Environment Programme UNESCO United Nations Educational, Scientific and Cultural Organization UNFCCC United Nations Framework Convention on Climate Change UNICEF United Nations Children’s Fund UNIDO United Nations Industrial Development Organization UNSD United Nations Statistics Division UNU-IHDP United Nations University International Human Dimensions Programme on Global
Environmental Change UNW-DPC United Nations Water Decade Programme on Capacity Development USD US-Dollar VOC Volatile organic compounds WAVES Wealth Accounting and Valuation of Ecosystem Services WGEMA UNECE Working Group on Environmental Monitoring and Assessment WHO World Health Organisation WIPO World Intellectual Property Organization WSSD World Summit on Sustainable Development

8
EXECUTIVE SUMMARY
The concept of green growth is based on the idea that economic and environmental policies can foster economic growth while increasing carbon, energy and material productivity, maintaining the natural asset base and improving people’s quality of life.
A number of countries embarked upon a challenge of greening their economic growth in order to enhance the performance of production processes and new, improved products, drive innovation and structural changes in the economy, promote fiscal consolidation through reviewing the composition and efficiency of public spending and increasing revenues from the pricing of pollution, build investor confidence through greater predictability and stability of how governments deal with major environmental and development issues and generate more balanced macroeconomic conditions and reduced resource price volatility. A wide range of partners work together at the international level to provide and implement a framework for measuring the green transformation of the economy.
To ensure effective policy design supporting green growth, sound information and data on the environment and economy nexus are needed. Not only does tracking and assessing progress in green growth contribute to a better understanding of the determinants of green growth but can also point out further synergies between the environment and the economy. Knowing the natural asset base and possible economic opportunities as well as monitoring the environmental dimension of quality of life contributes to establishing policy priorities. It is also important to have a solid information base to better communicate progress on green growth with the public.
The OECD has supported global efforts to promote and monitor green growth and facilitates the exchange of experience and good practice on developing indicators and applying a coherent and consistent green growth measurement framework. In the countries of the European Union (EU) Eastern Partnership (EaP) (Armenia, Azerbaijan, Belarus, Georgia, Republic of Moldova and Ukraine) the OECD teamed up with the European Union in partnership with UNEP, UNIDO and UNECE, to implement the EaP GREEN project, which helps these economies to move towards a green economy,
The present document, which was developed as part of the EaP GREEN, serves as a guide for interested countries, supporting them in applying and adapting the OECD framework in their country. The guide draws on lessons learned from the application of the green growth measurement framework and environmental indicators in OECD and EaP countries and other transition economies of Eastern Europe, the Caucasus and Central Asia.
A framework to measure the green transformation of the economy
The OECD green growth measurement framework is structured along the key objectives of green growth: ensuring that the economy is low-carbon and resource efficient through the environmental and resource productivity of the economy, maintaining the natural asset base, improving the environmental dimension of quality of life, and seizing economic opportunities and implementing policy responses to green growth. The four groups are complemented by a section on the socio-economic context and the characteristics of growth in the country studied.
Under each of the groups, the framework suggests concrete indicators that were selected according to their policy relevance, analytical soundness and measurability. The present document discusses all proposed indicators in terms of potential data sources and data availability for EaP countries and beyond and summarises the definitions as well as the methodology for their calculation proposed by OECD. With this, it serves as a starting point and orientation aid for interested countries that are composing their own

9
national set of indicators. Not all proposed indicators are equally relevant to all countries and the list will have to be adjusted depending on national contexts and priorities.
Lessons learned from the application of the green growth measurement framework
The practical application of the OECD-suggested set of green growth indicators (GGI) started in 2011, when the Netherlands issued its first report of this kind. Soon, the Czech Republic, Germany, Denmark, Slovenia, the Slovak Republic and the Republic of Korea followed this initiative and produced GGI-based reports following the OECD framework.
While the original grouping of indicators was altered only marginally, countries attached different importance to the various groups and individual indicators of the OECD set. In some cases, certain indicators were excluded and/or new ones added, depending on national circumstances and priorities.
The most challenging part of developing practical application of the OECD-suggested set of GGI concerns gathering data. Data sources used to construct the indicators include primarily official statistics, but also data from administrative sources and in some cases data from research studies. Collecting data for the sub-group of policy response indicators was the most problematic part for almost all countries. Several countries lack data over long periods. This limits the indicators’ usefulness for assessing progress in greening the economic development and the role of policies in this process.
The process of identifying national green growth indicators has commonly been done in a collaborative way among the relevant institutions. At the same time, particularly developing countries may face institutional challenges at the phase of indicator identification when there is a lack of information exchange between departments and governmental agencies.
Compiling and testing a national green growth measurement framework
Ideally the framework could be applied in parallel to the development of a Green Growth Strategy. For countries that do not have agreed on such a strategy yet, however, the launch of a pilot study on green growth measurement at the national level may be a useful way to take stock of the current situation and help to devise such a strategy.
Based on the lessons learned from the application of national green growth measurement frameworks in OECD countries, a roadmap for deriving a national set of indicators and relevant products is proposed.
The process of the national-level reflection on the measurement framework should be structured and participatory, with clear milestones and timeframes. In a first step, the awareness and the demand for such an exercise should be determined. Where the awareness and demand is still nascent, a pilot application of the OECD set of GGI can in fact catalyse such awareness and demand, and the development of green growth policies.
It is crucial that the involved bodies have a clear agreement on milestones and division of responsibilities for developing a green growth strategy and related indicators for the national measurement framework. While the Ministry of Economy may assume leadership in the process, the major environmental authority and statistical agencies should have a strong voice in the process. The involved ministries may wish to establish an inter-ministerial supervisory group for a regular exchange during the process that can ensure political support for the project and is able to decide on follow up policy action. Stakeholders from academia, non-governmental organisations (NGO), and actors of the private sector may wish to contribute to the process.

10
The supervisory group may appoint experts that identify relevant indicators for the national measurement framework and suggest a structure for both the framework as well as national headline indicators. Consultations need to be organised to facilitate the exchange between experts, the inter-ministerial supervisory group, and other stakeholders.
The pilot testing of a national green growth measurement framework could result in two complementary products: An expert paper addressing the needs and feasibility for a regular measurement of progress towards green growth in the country and a data-based publication resulting from the pilot application of the OECD set of GGIs based on currently available data. Based on these outputs stakeholders should develop a communication strategy to disseminate the products and should discuss steps to be taken towards a regular measurement practice.

11
INTRODUCTION
Background
Green growth policies aim at fostering economic development and human well-being by preserving and making sound use of natural capital, i.e. the natural resources and ecosystems that provide the raw materials, energy, water and a wide range of other services on which well-being relies (OECD 2011a, 2011b). Besides increasing the resilience of ecosystems and the environmental quality of life, green growth policies can result in a wide range of economic benefits, including enhanced performance of production processes; new, improved products and new markets; increased efficiency of public spending and increasing revenues through the pricing of pollution; enhanced investor confidence through greater predictability and stability of how governments deal with major environmental and development issues.
Policies that promote green growth need to be founded on a good understanding of the determinants of green growth and of related trade-offs or synergies. They also need to be supported with appropriate information and indicators to monitor progress and gauge results. Indicators to monitor progress towards green growth need to be embedded in a conceptual framework and should be selected according to well-specified criteria. Ultimately, they need to be capable of sending clear messages to policy makers and the public at large. When used in international work, they further need to be based on internationally comparable data.
The OECD has supported global efforts to promote and monitor green growth and facilitates the exchange of experience and good practice on developing indicators and applying a coherent and consistent green growth measurement framework. In the countries of the European Union (EU) Eastern Partnership (EaP) (Armenia, Azerbaijan, Belarus, Georgia, Republic of Moldova and Ukraine) the OECD teamed up with the European Union to implement the EaP GREEN project, which helps these economies to move towards a green economy.1
The objective of this Guide on Measuring the Green Transformation of the Economy, developed under the EaP GREEN project, is to help governments in the EaP countries in establishing national frameworks for monitoring and analysing the transition towards green growth and to support them in producing green growth indicators (GGIs).
The guide presents the concept of green growth, shares practical experience available from the frontrunners of green growth measurement, and combines it with experience from ongoing work of EaP countries and other transition economies of Eastern Europe, the Caucasus and Central Asia in producing green growth and environmental indicators. It uses OECD’s work on green growth measurement as a starting point, and describes how it connects to other relevant international work.
This Guide addresses questions such as:
Why should green growth be measured?
How could a measurement framework be structured?
Which indicators are relevant for monitoring the different aspects of green growth?
1 The EaP GREEN, Greening Economies in the Eastern Neighbourhood, is funded primarily by the European Commission (EC) and implemented
by the OECD in partnership with UNEP, UNIDO and UNECE.

12
What needs to be considered when a national green growth measurement framework is developed and implemented?
The guide is principally addressed to the management and technical personnel in Statistical Agencies, Ministries of Economy, Finance, and Environment of the EaP countries. At the same time it may be useful for sectoral ministries, including ministries of energy, industry and agriculture, and other stakeholders, for example from NGOs, academia, and the private sector, involved in setting up a national framework on measuring green growth (Chapter 4.2). While the guide primarily targets the EaP countries, it is relevant to any emerging and transitional economy.
Structure of the document
The guide is structured in four chapters:
Chapter 1 discusses the OECD green growth measurement framework, presents criteria for selecting indicators for the framework and shows how the OECD work on green growth relates to international initiatives and standards.
Chapter 2 provides a detailed description of the proposed indicator groups and individual indicators that could be used to monitor progress towards green growth, including their definitions, policy context of use, information on their calculation and on data availability and data sources.
Chapter 3 makes a synthesis of the existing international experience in applying the OECD green growth measurement framework and its set of green growth indicators.
Chapter 4 describes a roadmap for deriving a national set of indicators and relevant products that could be used for making information on green growth available to the decision-makers and the general public.
Authors and development process
The guide was prepared by Robin Rieprich and Christin Thurow, consultants to the OECD, in collaboration with Krzysztof Michalak and Mikaela Rambali of the OECD Secretariat. It is based on an earlier draft prepared by Angela Bularga and on the report “Green Growth Indicators 2014” prepared by Myriam Linster and Ziga Zarnic (OECD 2014a). The report draws on further OECD work on GGIs, including the 2015 report “The Shared Environmental Information System and Green Growth” (OECD et al. 2015). Important expert contribution was made by Myriam Linster of the OECD secretariat. Administrative support for developing the report was provided by Irina Belkahia and Shukhrat Ziyaviddinov of the OECD secretariat.

13
CHAPTER 1: A FRAMEWORK FOR DEVELOPING AND APPLYING GREEN GROWTH INDICATORS
1.1 Green growth policies –fostering economic performance and preserving natural capital
Green growth policies aim at fostering economic development and human well-being by preserving and making sound use of natural capital, i.e. the natural resources and ecosystems that provide the raw materials, energy, water and a wide range of other services on which well-being relies (OECD 2011a, 2011b). Thus, a central idea is that “green” can promote “growth”. This can be achieved by designing and applying a green growth policy framework that is setting price signals and regulatory actions that provide incentives towards substituting away from scarce environmental resources, and by fostering innovation, productivity and human capital.
Box 1. Key elements of green growth
Economic growth is conventionally thought of as the process through which workers, machinery and equipment, materials and new ideas and technologies contribute to producing goods and services that are valuable for individuals and society. The concept of green growth builds on this with four additional elements:
Capturing the importance of changes in the comprehensive wealth of an economy, meaning paying attention to all types of capital: natural (e.g. ecosystems), human (e.g. education and skills), physical (e.g. machinery and equipment), and the intangible assets, which are so crucial to human progress like ideas and innovation. This comprehensive approach captures some important aspects of growth including the nature of trade-offs, which arise at the frontier of production possibilities. For example, substituting environmental assets in production or consumption is not necessarily a smooth process: critical thresholds can be crossed after which assets that are renewable cease to be so (e.g. fisheries or soil) or assets that are non-renewable are depleted to a point that substitution with other inputs or goods and services becomes impossible (e.g. climate or biodiversity), potentially short-circuiting growth in well-being. This introduces uncertainties about thresholds, irreversible outcomes and discontinuities that complicate policy design. Different considerations will apply for different environmental assets (e.g. renewables and non-renewables); there is no single rule for determining whether assets should be preserved or not.
Incorporating the dual role played by natural capital in this process, being both sources and sinks for the economy. Natural capital contributes to production by providing crucial inputs, some of which are renewable and others, which are not. It also influences individual and social welfare in various ways, through the effect that the environment has on health, through amenity value and through provision of ecosystem services.
Acknowledging that investment in natural capital is an area in which public policy intervention is needed because market incentives are weak or non-existent. This is largely because the contribution of natural capital to production and to individual welfare is often not priced nor appropriately valued. The lack of proper valuation and market incentives or signals can affect behaviour and truncate the foresight of households and firms in ways that set the economy on trajectories that are unsustainable (or conversely that miss growth opportunities) or that are not necessarily maximising well-being.
Recognising that innovation is needed to attenuate trade-offs that arise between investing in (depleting) natural capital and raising consumption or investing in other forms of capital. Indeed, once resource productivity is raised and inefficiency eliminated, a “frontier” is reached along which these trade-offs become more pronounced. Through innovation, the frontier at which trade-offs start to bind can be pushed outwards; essentially greening growth. Most importantly, policies that aim to push out the frontier of economic growth need to grapple with existing incentives to innovate which are heavily biased towards improving the efficiency of currently dominant production techniques (e.g. in energy and transport) due to the tendency of innovation to build on previous innovations and existing technologies. Overcoming this kind of “path dependency”, which contributes to inhibit the development of green technology (other factors are learning-by-doing effects and economies of scale) through appropriate innovation policies is therefore crucial for green growth.

14
Besides increasing the resilience of ecosystems and boosting the environmental quality of life and ensuring the sustainability of agro-food systems, green growth policies can result in a wide range of economic benefits (OECD 2014a), such as:
Enhanced performance of production processes and new, improved products;
Innovation and structural changes in the economy, which would be accompanied by the emergence of new industries, products, services, and new business opportunities more generally, and overcoming technological lock-in, especially in relation to infrastructure;
Fiscal consolidation through, for instance, reviewing the composition and efficiency of public spending and increasing revenues through the pricing of pollution;
Investor confidence through greater predictability and stability of how governments deal with major environmental and development issues;
More balanced macroeconomic conditions and reduced resource price volatility.
Integrating these elements into policy is at the heart of green growth. In terms of well-being, policy decisions need to reflect the relative value to households of services from natural capital relative to other goods, and thus the trade-offs that occur at the frontier. Trade-offs need to be evaluated and re-evaluated over time to weigh the impacts of a decline in natural capital for current and future generations. These trade-offs vary geographically depending on available technologies, the natural resource base and on households’ and societal preferences; hence, policies have to be adapted to different circumstances.
In order to be politically appealing, green growth policies need to address equity concerns up front by identifying and building in measures that would correct eventual adverse social impacts of certain policy interventions, such as reforming environmentally harmful energy subsidies. Matching objectives of green growth and poverty reduction policies is particularly important in emerging and developing economies. Complementarities between green growth and poverty reduction include, for example, providing more efficient water and transport infrastructure, and alleviating poor health associated with environmental degradation.
Though green growth is relevant to all countries, policies and approaches used to anchor this new model in everyday behaviour have to be tailored to specific regional and national circumstances and stages of development. The choice of such policies and approaches, and their mixes, may be influenced by a number of factors, for instance the weight put on environmental well-being, market conditions (e.g. the share of informal economy or the maturity of financial markets), or specific governance conditions (e.g. weak capacity in policy design or implementation).
Given their economic and environmental angles, green growth strategies involve two broad sets of policies:
Framework policies. These include, essentially, fiscal and regulatory settings, as well as competition, trade and innovation policies, which, if well designed and executed, maximise the efficient allocation of resources;
Environmental policies. These policies further incentivise the efficient use of natural resources and ecosystems and correct market distortions. Putting a price on pollution and natural resource use should be a central element of any policy mix to support green growth notwithstanding differences in national circumstances. The responsiveness of businesses and consumers to price signals can, in many situations, be further strengthened through better regulation and information-
15
based measures (i.e. non-market policy instruments). Unfortunately, the value of the natural capital is in general not yet sufficiently captured by prices therefore decisions related to its management may be badly affected by this market failure.
In addition, education, labour, and social protection policies are essential for facilitating the green growth transition. Policy coherence is a key ingredient of success.
1.2 The OECD green growth measurement framework and its indicators
1.2.1 The OECD conceptual framework
To ensure effective policy design supporting green growth, sound information on physical characteristics of the natural capital and its interactions with other forms of capital is needed. In order to develop and maintain a system that can measure progress in this regard, governments need to adopt relevant measurement frameworks and ensure that the necessary data are collected, analysed and their quality assured. Experiences from OECD’s work on green growth indicators can help countries to implement such a framework underpinned by sound data.
At the OECD Ministerial Council Meeting in June 2009, Ministers asked the OECD to develop a Green Growth Strategy to support countries’ effort to achieve economic recovery and environmentally and socially sustainable economic growth. Since then, the OECD has been working with a wide range of partners from across government and civil society to provide a policy framework for how countries can achieve economic growth and development while at the same time combating climate change and preventing costly environmental degradation and the inefficient use of natural resources.
The OECD’s approach to measure progress towards green growth was presented in the 2011 report, “Towards Green Growth: Monitoring Progress” (OECD 2014a). It involves a conceptual measurement framework that combines the main features of green growth with the basic principles of accounting and the pressure-state-response (PSR) model2 used in environmental reporting and assessment.
The OECD green growth measurement framework takes the economy and its production function and the associated consumption facet as a starting point (the economic lens) and then dwells upon the natural asset base on which it relies, and on the policy responses and opportunities generated (Figure 1). It is intended to structure the analysis of the sources of green growth, and to help identify indicators that are relevant for decision-makers and the public.
The measurement framework addresses a set of key questions that relate to the following dimensions of green growth:
Characteristics of the natural capital itself: Is there a risk of qualitative and quantitative alterations of the natural asset base and ecosystem services, which would trigger shocks to future growth and social development? Is the natural capital used within the limits of its resilience?
The nexus between the natural and manufactured capital: Do production and consumption patterns improve in terms of environmental productivity? Is the manufactured capital used and disposed of more effectively? How does this affect the productivity of the economy? Are measures to open up new sources of growth and promote green growth effective?
2 The PSR model is based on the concept of causality: human activities exert pressures on the environment and change its quality and quantity of
natural resources (state). Society responds to these changes through environmental, general economic and sectoral responses. For more information on the PSR model see OECD (2003, Annex II).

Tq
Source: OECD
The qwhich, aftematerial anmodel (FigMaintaininwell-being
Withinsubstitutabsubstitutingdo not necirreversibleimportant f
The nexus bequality of life
Figure
D (2014a)
questions aboer being engand non-mategure 2) that ng the inter-g
constitutes t
n this inputility with otg it with othcessarily fole both for thfrom an econ
etween the nae for all?
e 1. OECD
ove relate to aged in proderial well-beishows their
generational the essence o
t-output modther forms oher forms of llow a smoohe environmnomic point o
atural and h
's conceptua
a range of iuction and cing. All formlinkages anflows of cap
of sustainable
del, one distf capital. Ercapital. Byp
oth, foreseeament and econ
of view, beyo
16
human capita
al measureme
inputs, such consumption,ms of capita
nd contributiopital intact ae developme
tinctive charroding naturapassing the liable trajectonomy. Thereond represen
al: Do green
ent framewor
as natural, h, result in eital can be inon to human
and avoidingent.
racteristic ofal capital wiimits of its e
ory. They caefore a dive
nting a value
n growth poli
k for green g
human, and ther positive tegrated inton well-beingg the deterior
f the naturaill first resulerosion can han lead to cerse and resi
as such.
icies result in
growth
manufacture or negative o a single ing and wealthration of the
al capital is lt in increasehave consequchanges thatilient “living
n a better
ed capitals, changes in
nput-output h evolution. e individual
its limited ed costs of uences that t would be g planet” is

Source: GGK
1.2.2 Ratio
Indicathat describmeasures mcannot be cframeworkin a mann(parameter
Indicaindicators (
Swinn
Sthu
P (2013)
onale behind
ators can be be a phenommulti-dimencaptured by
k/definition, wner, which s) are charac
ators can se(OECD 2011
Synthetic funwould be requndicator set a
number of ind
Simplificationhe results of
user needs, in
Figur
d and structu
defined as mmenon/envirosional concea single ind
which allowsreflects the
cteristics or in
rve differen1a):
ction: Indicauired to giveand the leveldicators will
n and adaptameasuremen
ndicators may
re 2. Input-
ure of the OE
measurable inonment/area epts (e.g. c
dicator. Ideals individual
dimensionsnformation u
nt purposes
ators reduce tan exact preof details cotend to clutt
tion functionnt are providey not always
17
-output mode
ECD set of g
nformation (a and possesompetitivenelly, a compoindicators/v
s or structuusually nume
and uses. T
the number oesentation ofontained in thter the overvi
n: Indicators ed to the use meet strict s
el of green gr
green growth
(parameters, s a synthetiess, e-trade
osite indicatoariables to bre of the perical that are
The OECD
of measuremf a situation. he set need toiew that it is
simplify theer. Due to thiscientific dem
rowth
h indicators
or value derc meaning. or environm
or should be e selected, c
phenomena be collected th
identifies tw
ments and parAs a consequo be limited.meant to pro
e communicas simplificatmands to dem
rived from pA compositmental qual
e based on a combined anbeing measuhrough obser
wo major fu
rameters thatuence, the si. A set with aovide;
ation processtion and adapmonstrate cau
parameters) te indicator lity) which theoretical
nd weighted ured. Data rvation.
unctions of
t normally ize of an a large
by which ptation to usal

18
chains. Indicators should therefore be regarded as an expression of “the best knowledge available”.
Within the policy-making and implementation cycle, uses of indicators are multiple and include:
Baseline definition and target setting: Indicators can be used to clarify the need for policy interventions, by providing information on the current situation, and enabling the definition of desirable qualitative and quantitative changes;
Performance monitoring: Indicators sets can enable the measurement of progress in relation to specific targets set in policies;
Benchmarking: Indicators can serve comparison purposes nationally and internationally. This can contribute to limiting gaps in performance between countries or between administrative-territorial units within a country;
Reporting on performance and awareness raising: Indicators can contribute to the broader objective of ensuring government transparency and accountability, and making the general public aware of the impact of policy interventions.
The set of GGIs proposed by the OECD (2014a) is the outcome of an intense inter-governmental and multi-stakeholder consultation process, involving environmental, economic and statistical communities from the 34 OECD member countries and several non-members (accession countries, BRIICS), and including NGOs, the business sector and academia. The approach adopted to develop the indicator set is, in part, based on the approach developed for the OECD’s work on environmental indicators and environmental reporting that has been operational at the OECD for more than three decades (see section 1.3). Work continues to refine and further elaborate the indicator set as new data become available and concepts evolve. While the number of potentially useful indicators for measuring green growth is fairly large, the applied set should be concise and of a manageable size.
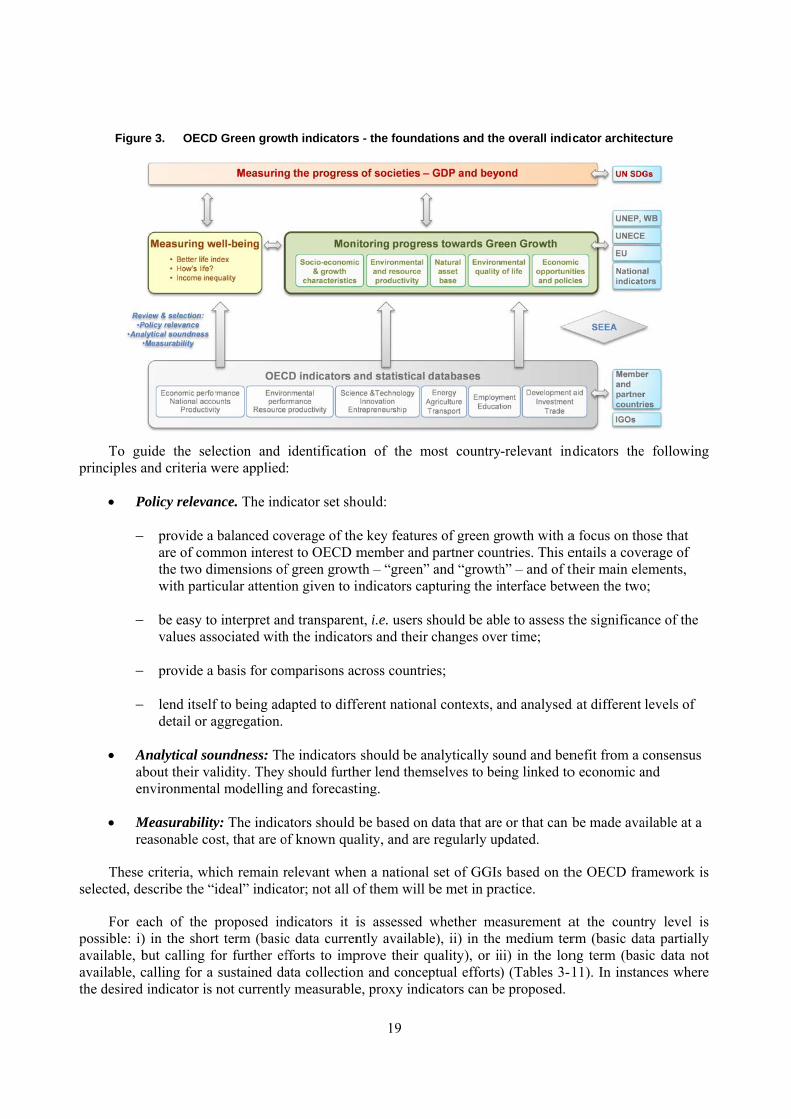
The OECD elaborated a set of GGIs in line with the main components of the measurement framework (OECD 2014a). The indicators were selected from a broad range of data and indicators that are already part of the work of OECD and partner organisations and supplemented with a few proposals for new indicators (Figure 3).
Figur
To guprinciples a
P
Aaben
Mre
Theseselected, de
For epossible: i)available, bavailable, cthe desired
re 3. OECD
uide the seland criteria w
Policy relevan
provide a are of comthe two diwith parti
be easy tovalues ass
provide a
lend itselfdetail or a
Analytical sobout their vanvironmenta
Measurabilityeasonable co
e criteria, whescribe the “
ach of the ) in the shorbut calling fcalling for a
d indicator is
D Green grow
lection and were applied
nce. The ind
balanced common interesimensions oficular attentio
o interpret ansociated with
basis for com
f to being adaaggregation.
undness: Thalidity. They al modelling
y: The indicaost, that are o
hich remain rideal” indica
proposed inrt term (basicfor further ef
sustained danot currently
wth indicators
identificatio:
dicator set sho
verage of thest to OECD mf green growon given to i
nd transparenh the indicato
mparisons ac
apted to diffe
he indicators should furthand forecast
ators should of known qua
relevant wheator; not all o
ndicators it ic data currenfforts to impata collectiony measurable
19
s - the founda
on of the m
ould:
e key featuremember and
wth – “green”indicators cap
nt, i.e. users sors and their
cross countri
ferent nationa
should be anher lend themting.
be based on ality, and are
en a nationalof them will b
is assessed ntly availablprove their qn and concepe, proxy indi
ations and the
most country
es of green gpartner coun
” and “growthpturing the in
should be abchanges ove
ies;
al contexts, a
nalytically somselves to be
data that aree regularly up
set of GGIsbe met in pra
whether mee), ii) in the
quality), or iiptual effortscators can be
e overall indic
-relevant in
rowth with antries. This eh” – and of thnterface betw
le to assess ter time;
and analysed
ound and bening linked to
e or that can bpdated.
s based on thactice.
asurement a medium terii) in the lon) (Tables 3-1e proposed.
cator archite
ndicators the
a focus on thentails a covetheir main eleween the two
the significan
d at different
nefit from a co economic a
be made ava
he OECD fra
at the countrm (basic dang term (bas11). In instan
cture
e following
ose that erage of ements, o;
nce of the
levels of
consensus and
ailable at a
amework is
try level is ata partially sic data not nces where
20
The proposed indicator set provides countries with a starting point for developing a national green growth indicator set building on the OECD measurement framework. The OECD set is neither exhaustive nor final, and has been kept flexible enough so that countries can adapt it to different national contexts. The conceptual measurement framework developed by the OECD is to be used to structure the thinking about the indicator set and to organise it in a way useful to decision-makers and the broader public. It does not replace international guidelines and statistical standards on which the underlying data series should be based, in particular the Framework for the Development of Environment Statistics (FDES) and the System of Environmental and Economic Accounting (SEEA). International statistical guidelines help to ensure that the underlying data are harmonised at the international level. In particular, the SEEA helps to structure and organise underlying data in a way that is relevant with the system of national accounts (SNA) and thus ensures coherence between data sets and breakdowns by industry (Box 2).
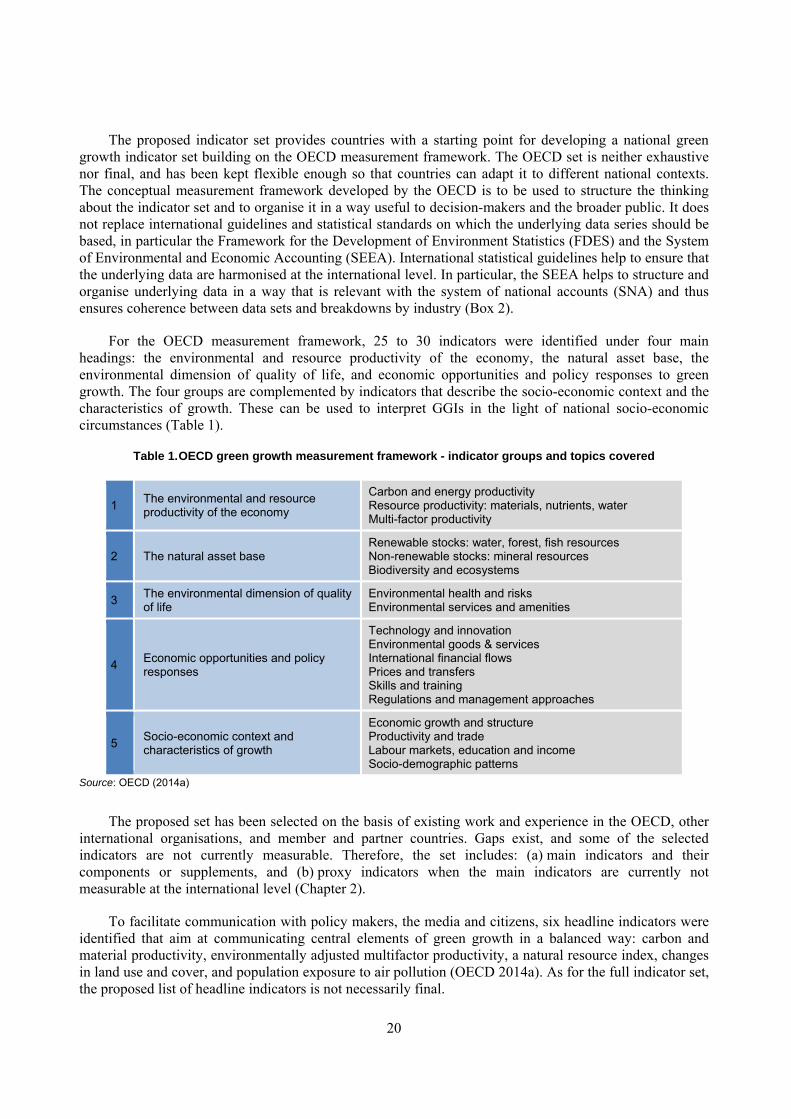
For the OECD measurement framework, 25 to 30 indicators were identified under four main headings: the environmental and resource productivity of the economy, the natural asset base, the environmental dimension of quality of life, and economic opportunities and policy responses to green growth. The four groups are complemented by indicators that describe the socio-economic context and the characteristics of growth. These can be used to interpret GGIs in the light of national socio-economic circumstances (Table 1).
Table 1. OECD green growth measurement framework - indicator groups and topics covered
1 The environmental and resource productivity of the economy
Carbon and energy productivity Resource productivity: materials, nutrients, water Multi-factor productivity
2 The natural asset base Renewable stocks: water, forest, fish resources Non-renewable stocks: mineral resources Biodiversity and ecosystems
3 The environmental dimension of quality of life
Environmental health and risks Environmental services and amenities
4 Economic opportunities and policy responses
Technology and innovation Environmental goods & services International financial flows Prices and transfers Skills and training Regulations and management approaches
5 Socio-economic context and characteristics of growth
Economic growth and structure Productivity and trade Labour markets, education and income Socio-demographic patterns
Source: OECD (2014a)
The proposed set has been selected on the basis of existing work and experience in the OECD, other international organisations, and member and partner countries. Gaps exist, and some of the selected indicators are not currently measurable. Therefore, the set includes: (a) main indicators and their components or supplements, and (b) proxy indicators when the main indicators are currently not measurable at the international level (Chapter 2).
To facilitate communication with policy makers, the media and citizens, six headline indicators were identified that aim at communicating central elements of green growth in a balanced way: carbon and material productivity, environmentally adjusted multifactor productivity, a natural resource index, changes in land use and cover, and population exposure to air pollution (OECD 2014a). As for the full indicator set, the proposed list of headline indicators is not necessarily final.

21
Box 2. The System of Environmental-Economic Accounting (SEEA)
International organisations including UNEP, UNSD, UNECE and the OECD recommend that countries use SEEA as the underlying framework for deriving indicators that reflect interrelations between the economy and the environment. Most data used for green growth measurement should, where possible, be produced in accordance with the SEEA framework (OECD 2011b).
The SEEA provides a consistent, coherent and comprehensive framework for producing integrated economic and environmental statistics (UN et al. 2014). It contains the internationally agreed standard concepts, definitions, classifications, accounting rules and tables for producing internationally comparable statistics that are in line with those of the SNA.
The methodology for producing a number of the indicators from the OECD green growth measurement framework can be directly obtained from the SEEA central framework. Indicators for environmental efficiency and resource efficiency can be derived from the physical flow accounts. Combining physical information with monetary indicators from the SNA provides information on the interaction between environmental pressure and economic growth. The asset accounts provide the basis for indicators related to the natural asset base. Environmental activity accounts offer useful information on the application and efficiency of various policy instruments, such as environmental taxes and subsidies. Finally, data from the environmental goods and services (EGS) sector provide indicators for evaluation of economic opportunities that may be initiated by green growth.
By applying the SEEA framework, monetary and physical data can easily be combined in a consistent format, for example for calculating intensity and productivity ratios. And macro-level indicators can be broken down by economic sector and by industry, to show structural changes over time, to analyse environmental pressures exerted by different industries, and to distinguish government responses from those of the business sector or private households. This is important when the indicators address both the environmental effectiveness and the economic efficiency of policies, or when they are to support structural policy analyses.
Table 2. Overview of selected indicator types and relevant SEEA accounts
Topic or issue Indicator examples Examples of relevant SEEA accounts
Environmental efficiency
Pollutant emission or waste generation intensities and productivity ratios, relating the generation of residuals to economic output: Carbon productivity and air emission intensities Waste generation intensities Nutrient balance intensities
Physical flow accounts for water Physical flow accounts for materials: product flows, air emissions (including greenhouse gases), pollutant emissions to water
Resource efficiency
Resource use intensities and productivity ratios, relating resource inputs to economic output: Energy productivity Material productivity Water productivity
Physical flow accounts for materials: solid waste accounts, economy-wide material flow accounts. Physical flow accounts for water Physical flow accounts for energy
Natural assets Intensity of use of natural resource stocks, relating resource extraction to available stocks: water, minerals, energy, timber, fish Index of natural resources Land use and cover changes Soil productivity
Asset accounts for: Water resources Mineral and energy resources; Timber resources; Aquatic resources Land and soil resources SEEA experimental ecosystem accounts
Environmentally-related activities and instruments
Share of environment-related activities in the economy: output, investments, trade, employment. Level and composition of environmental expenditureEnvironment related tax rate and revenue structure Environment-related support measures, e.g. fossil fuel subsidies
Environmental activity accounts and statistics: environmental protection and resource management expenditure, environmental goods and services Accounts for other transactions related to the environment: payments, transfers
Source: OECD (2014a)

22
1.3 Other OECD work on measuring progress in environment and well-being
1.3.1 OECD Environment indicators
For more than 30 years, the OECD has prepared harmonised international data and sets of indicators on many topics, including on the environment, and assisted countries to improve their environmental information systems. The main aims of this work have been to measure environmental progress and performance; monitor and promote policy integration, in particular, the integration of environmental considerations into policy sectors, such as transport, energy and agriculture, and into economic policies more broadly (OECD, 2013d).
The OECD approach to indicators is based on the view that:
There is no unique set of indicators; whether a given set of indicators is appropriate depends on its use.
Indicators are only one tool among others and generally should be used with other information in order to draw robust conclusions.
OECD environmental indicators are relatively small sets of indicators that have been identified for use at the international level, and should be complemented by national indicators when examining issues at national level.
The programme builds on agreement by OECD member countries to:
Use the pressure-state-response (PSR) model as a common reference framework.
Identify indicators on the basis of their policy relevance, analytical soundness and measurability.
Use the OECD approach and adapt it to their national circumstances.
The development of environmental indicators in OECD has been grounded in the practical experience of OECD countries. Their development has benefited from strong support from member countries, and their representatives in the OECD Working Party on Environmental Information. OECD work on indicators also benefits from close co-operation with other international organisations, notably the United Nations Statistics Division (UNSD) and United Nations regional offices, the United Nations Environment Programme (UNEP), the World Bank, the European Union (including Eurostat and the European Environment Agency), as well as international institutes.
1.3.2 Wealth accounting approaches
Methodological imperfections and a widespread lack of policy-useable information on the value of natural capital (and its depletion) has been a major factor impeding decision-makers to see future growth constraints related to natural resource use. Traditionally, Gross Domestic Product (GDP) has been applied to measure economic progress. This measure, however, fails to grasp the evolution in the value of a nation’s assets and to reveal the decline in its natural or social capital, which are indispensable for the sustainability of growth. As a gross measure, GDP takes no account of depreciation, depletion or degradation of assets, whether produced or natural. Recent years have seen an increasing awareness that macroeconomic statistics, including statistics on GDP do not provide policy-makers with a sufficiently detailed picture of the living conditions that people experience.

23
One of the possible approaches, which could complement the monitoring of GDP evolution, is to measure total wealth and its structure. The wealth accounting approach, as suggested by the World Bank (2006) and further developed by UNU-IHDP and UNEP (2012), presumes that development can be treated as a process of “…building and managing a portfolio of assets. The challenge of development is to manage not just the total volume of assets – how much to save versus how much to consume – but also the composition of asset portfolio, that is, how much to invest in different types of capital, including the institutions and governance that constitute social [intangible] capital” (World Bank 2011).
Though the wealth accounting approaches are still under development, they can be a helpful for moving the discussion on the value of natural capital forward.
Explicitly introducing some of the key environmental services into growth accounting computations is a first step towards reviewing measures of the sources of economic growth without fundamentally altering the basic growth accounting methodology. Two complications have to be overcome, however:
Identifying the relevant environmental services: only those environmental services that have a bearing on sustainable use of natural capital should qualify as a relevant measure. A different way of putting it is that for environmental services to be relevant for inclusion in growth accounts, there has to be a social cost associated with them;
Produce a reasonable estimate for the value of the environmental service: The scientific basis to value environmental inputs is unfortunately limited. The UN Handbook on Integrated Environmental and Economic Accounting (UN et al. 2014) provides detailed indications about the possibilities and techniques for such valuations.
A second step is building the bridge between environmental services and alternative measures of material well-being. With the two steps combined, it would be possible to track changes in material well-being (real income) back to the effects of changing uses of traditional inputs such as labour and capital, selected environmental services, and a modified rate of multi-factor productivity growth.
Looking at environmental quality, but also at other topics such as related to health and education, the OECD Framework for Measuring Well-Being and Progress (OECD, 2013b) (Figure 4) is based on the recommendations made in 2009 by the Commission on the Measurement of Economic Performance and Social Progress – also known as the Stiglitz-Sen-Fitoussi Commission – and reflects earlier OECD work and various national initiatives in the field.

Source: OECDOI: http://dx.
The Fsustainabilieach personsociety as population
The Bbeen designmatters thecountries bframework
1.4 Towarcountries
Over These inclustatistical stransition ddedicated t
Fig
CD. (2011), How.doi.org/10.1787
Framework ity. Each of n can be desa whole reqaverages an
Better Life Inned to invol
e most to theby giving thek.
ds measurin
the last decude, for exa
standards anddrive, econoto the strengt
gure 4. OEC
w's Life?: Measu7/97892641211
is built arouthese domai
scribed in terquires aggregd inequalitie
ndex (www.lve people inem. This inteir own weig
ng the green
ade, statisticample, a widd the developmic and socthening of se
CD framewor
uring Well-being64-en
und three dins includes rms of a numgating these es, based on t
.oecdbetterlin the discusseractive web
ght to each o
n transforma
cal systems dening covepment of newcial statisticsectoral statist
24
rk for measur
g, OECD Publis
distinct doma number o
mber of separoutcomes f
the preferenc
feindex.org)sion on wellb-based tool of the eleven
ation of the
in the EaP erage of dataw statistical ps have evolvtics, includin
ring well-bein
shing, Paris.
ains: materif relevant dirate outcome
for broader cces and value
, released fo-being and, enables citi
n dimensions
economy in
countries haa collection,products, incved most rapng environme
ng and progre
ial conditionimensions. Wes, the assesscommunitiese judgments
or the first tthrough this zens to com
s explored in
EU Eastern
ave seen sign gradual ad
cluding onlinpidly. Importental statistic
ess
ns, quality oWhile the wesment of con
s, and considof each com
time in Mays process, to
mpare well-ben the OECD
n Partnershi
nificant impdoption of inne databases.tant efforts
cs.
of life and ell-being of nditions for dering both
mmunity.
y 2011, has learn what
eing across well-being
ip
provements. nternational Due to the have being

25
Such positive changes are a prerequisite for improving the analytical evidence in support to a green transformation of economies and societies at large and monitoring the pace of this transformation. Demand for such evidence from decision-makers is growing in all countries, particularly as drivers become stronger for moving towards an economy that is based on a sustainable and fair use of environmental resources and services.
While there are no commonly agreed green growth/green economy indicators in the pan-European region, a number of countries already use as a basis the set of GGIs developed by the OECD. To support this work the OECD facilitates the exchange of experience and good practice on developing and applying the green growth measurement framework under the EaP GREEN project funded by the European Union (OECD, UNECE, UNEP, EEA 2015).
The availability of coherent data over longer periods is essential to monitor progress towards green growth over time. To date, the consistency and completeness of time series vary greatly by issue and country, not always allowing a systematic and meaningful presentation of trends over longer periods. To improve the situation, many of the EaP countries are initiating the production of data on the environment and economy nexus in accordance with the SEEA framework (Box 2) and are working towards the implementation of a Shared Environmental Information System (SEIS) (Box 3).
The availability of time series data for the proposed indicators in EaP countries is assessed in the sections “data sources and availability” under each indicator (Chapter 2). The choice of a national set of indicators should be made in view of a detailed assessment of data availability in the respective country.
Box 3. The Shared Environmental Information System (SEIS) and green growth
To improve the collection, exchange and use of environmental data and information across the pan-European region, the European Environmental Agency (EEA) members and cooperating countries3 as well as EU Eastern Partnership countries and other countries of Eastern Europe, the Caucasus, and Central Asia work towards the implementation of a Shared Environmental Information System (SEIS). With the support of technologies such as the internet, the approach would link all existing data and information flows relevant at the country and international levels in support of a regular environmental assessment process.
SEIS aims to enhance the availability of integrated, relevant, high quality, timely and easily accessible environmental information, which provides the means for assessing the environmental status and the foundation for meaningful and informed environmental governance. Through the implementation of SEIS and corresponding benefits, such as efficiency gain and cost savings, effective and meaningful governance, simplification, innovation and an informed public, development in every country of the pan-European region could be positively affected.
Across the pan-European region the process of establishing such national systems is led by the United Nations Economic Commission for Europe (UNECE) and European Environmental Agency in close cooperation with other organisations such as OECD and the United Nations Environment Programme (UNEP). The UNECE Working Group on Environmental Monitoring and Assessment (WGEMA) was mandated to review the progress in establishing SEIS and agreed on 67 priority dataflows underpinning SEIS4 that could be used for a possible pan-European assessment cycle in 2016. The dataflows are based on the UNECE environmental indicators (EIs) on thematic areas such as air pollution, ozone depletion, climate change, water and biodiversity5.
One of the principles of SEIS states that information should be collected once, and shared for multiple purposes. To this end, data collected as part of the national SEIS can be used for producing OECD GGIs. A recent study aiming at identifying matches and differences between those dataflows found that a number of the GGIs can be calculated based on dataflows under SEIS (OECD et al. 2015). Many indicators describing the environmental and resource productivity of the economy, the natural asset base, and the environmental quality of life are similar. At the same time, policy responses, the socio-economic context and demand-based indicators are not covered under SEIS, due to a different focus of the set.
For the respective cases, detailed information on how to use dataflows under SEIS for calculating GGIs is included in Chapter 2.
3 http://www.eea.europa.eu/about-us/countries-and-eionet 4 http://www.unece.org/fileadmin/DAM/env/documents/2015/ece/cep/ac.10/ece.cep.ac.10.2015.2_as_advance_copy.pdf 5 http://www.unece.org/env/Indicators/

26
CHAPTER 2: GREEN GROWTH INDICATORS – DETAILED DESCRIPTION
This chapter offers an in depth discussion of the green growth indicators proposed by the OECD (2014a). For each indicator, a discussion of the policy context is provided, followed by information on potential data sources and directions for the calculation of the indicator.
It is important to note that the selection of indicators discussed here is neither exhaustive nor final, but should rather be seen as a starting point and orientation aid for interested countries. Not all indicators proposed here are equally relevant to all countries and the list will have to be adjusted for the pilot testing of a national green growth indicators framework depending on national contexts and priorities. For the national sets of GGIs to be developed full alignment of definitions and calculation methods is not necessarily needed, but the methodology applied by OECD can serve as a reference.
2.1 The socio-economic context
Green growth indicators build on the interaction between economic growth and the environment. Indicators on the socio-economic context provide important background information, particularly with regard to economic growth, productivity and competitiveness, along with key features of the labour market that are important to sustain job creation and facilitate labour markets adjustments, and with information on demography, health, education and income inequality (Table 3).
Such information is useful to track the effects of green growth policies on growth, to establish links to social concerns such as poverty reduction, social equity and inclusion, to interpret GGIs in the light of national socio-economic circumstances, and complement them with additional details. For example, data on environmental pressures are rarely available by industrial activity, and consistent measures that combine environmental and economic information can only be constructed at the level of the entire economy. In such cases, it is important to supplement the economy-wide indicator with information on countries’ industry structure (OECD, 2014a).
Table 3. The socio-economic context - proposed indicators
Proposed indicators
Group/theme Proposed indicators Type Measurability
The socio-economic context and characteristics of growth
Economic growth, productivity and competitiveness
Economic growth and structure -- GDP growth and structure -- Net disposable income (or net national income)
M M
S M
Productivity and trade -- Labour productivity -- Multi-factor productivity -- Trade weighted unit labour costs -- Relative importance of trade: (exports + imports)/GDP
M M M M
S M M S
Inflation and commodity prices -- Consumer price index -- Prices of food; crude oil; minerals, ores and metals
M M
S S
Labour market, education and income
Labour markets -- Labour force participation -- Unemployment rate
M M
S S

27
Socio-demographic patterns -- Population growth, structure and density -- Life expectancy: years of healthy life at birth -- Income inequality: GINI coefficient -- Educational attainment: level of and access to education
M M M M
S M M S
Type: M = Main indicators P = Proxy indicators when the main indicators are not available
Measurability (M): S = short term, M = medium term, L = long term
See Annex for a complete list of indicators.
Source: OECD (2014a)
2.1.1 Economic growth, productivity and competitiveness
DEFINITION AND CALCULATION OF INDICATORS
Economic growth and structure
Gross domestic product (GDP) measures market and government production and the associated economic activity.
GDP relates to the sphere of production. As a “gross” measure, it takes neither account of the depreciation of produced assets nor of the depletion of natural assets. However, GDP is the most widely used measure of economic growth and remains a central variable for macroeconomic management and economic activity. For international comparisons, the GDP should be based on chained constant US-Dollar (USD) and constant purchasing power parities (PPPs6).
The GDP can be structured according to divisions of the International Standard Industrial Classification of All Economic Activities (ISIC)7. Value added is the net output of a sector after adding up all outputs and subtracting intermediate inputs.
Net national income (NNI) captures the average material well-being of individuals and households.
Unlike GDP, net national income takes into account the depreciation of produced capital and income flows between residents and the rest of the world. It is the aggregate value of the balances of net primary incomes summed over all sectors. Gross national income (GNI) less the consumption of fixed capital from GNI gives NNI at market prices. The aggregate net national disposable income should be based on chained constant USD and constant PPPs. Real income should be obtained through deflation with a consumer price index.
Productivity and trade
Labour productivity is a key driver of economic growth and living standards.
Labour productivity is expressed as GDP per hour worked with GDP in national currency at constant prices, or in USD at constant prices and constant PPPs. Labour input is defined as total hours worked by all persons engaged.
6 OECD is currently using 2010 as a base year for PPP but the base year changes regularly and may be defined according to national preferences. 7 http://unstats.un.org/unsd/cr/registry/regcst.asp?Cl=27
28
An important source of labour productivity is multifactor productivity growth. It represents the increase in economic output, that cannot be explained by increases in economic inputs, which raises the rate of output growth and therefore domestic income.
Multifactor productivity for the total economy is computed as the difference between the rate of change of output and the rate of change of total inputs (calculated as volume indices of combined labour and capital inputs for the total economy); shares of compensation of labour input and of capital inputs in total costs for the total economy are measured at current prices (compensation of labour input corresponds to the compensation of employees and self-employed persons and compensation of capital input is the value of capital services). The measure presented may only recognise labour and capital inputs and not primary inputs of natural capital that also feed into production.
Trade-weighted unit labour costs (ULCs) in manufacturing is a proxy measure of international price competitiveness.
Trade-weighted unit labour costs (ULCs) (Competitiveness index) are defined as the average cost of labour per unit of output produced. Unit labour costs reflect the combined effects of wage development and labour productivity. Changes in unit labour costs approximate output price developments as labour accounts for a significant share of final output. Relative unit labour costs in manufacturing are calculated using overall weights (a system of weights based on a double-weighting principle, which takes account of the structure of competition in both export and import markets). Manufacturing ULCs are often seen as more representative for competition in tradable products, but they do not account for the increasing trade in services.
The relative importance of international trade in countries’ economies.
The Relative importance of international trade is calculated as total trade flows, including exports and imports of goods and services, over GDP. This measure indicates exposure to international competition abroad and domestically.

29
Box 4. Trends in productivity and trade in OECD countries
Trade is one of the key contributors to economic growth. It is closely associated with foreign investment, developments in the international chain of value added and trends towards greater specialisation and interconnectedness of producers and consumers. When environmentally intensive tasks concentrate in emerging economies, displacement effects may occur, showing up in lower environmental productivity in emerging economies than in OECD countries.
Multifactor productivity (MFP) grew more slowly in the 2000s than the 1990s in those OECD countries for which data are available, with a sharp fall in some countries after the economic crisis (Figure 5).
Price competitiveness in international trade (as approximated by trade-weighted unit labour costs) has changed for most OECD countries since the 1990s. One factor in this development is productivity. While there were large differences among OECD countries, labour productivity growth has fallen significantly in most OECD countries during the 2008 economic crisis as the total hours worked were reduced less than output, and this decline is broadly spread across sectors (Figure 6).
Figure 5. Labour and multifactor productivity
Labour (left) and multifactor (right) productivity, annual average growth, %
Source: OECD Productivity Statistics (database); http://dx.doi.org/10.1787/888932924989.
Figure 6. Competitiveness index
OECD countries, 1990-92 and 2009-11
Source: OECD Economic Outlook: Statistics and Projections (database); http://dx.doi.org/10.1787/888932925008.
IRL POL KORCHL
ESP
SVK
USA
ISL
EST
PRT
CZE
ISR
AUT
CAN
FRASWE
DNKMEXAUSFINNZLJPN
TUR
CHE
DEU
BEL
NLD
ITA
NOR
SVN
GBR
HUN
GRCLUX
OECD
-5
0
5
10
1990-92 2009-2011IRL
USA
ESP
NZL
KOR
CAN
CHE
DEU
FINFRAITA
SWE
JPN
BEL
AUS
DNK
GBR
NLD
-5
0
5
1990-92 2009-2011
0
50
100
150
200
250
SVK
LUX
NO
R
CAN CH
L
AUS
ISR
EST
SVN
ITA
ESP
BEL
TUR
FRA
CZE
DEU JP
N
PRT
DN
K
NLD
SWE
AUT
NZL
GBR
HU
N
FIN
MEX
USA PO
L
IRL
KOR
ISL
CH
E
GR
C
2009-11 average
1990-92 average
Competitiveness index: Relative unit labour costs manufacturing sector, 2005=100
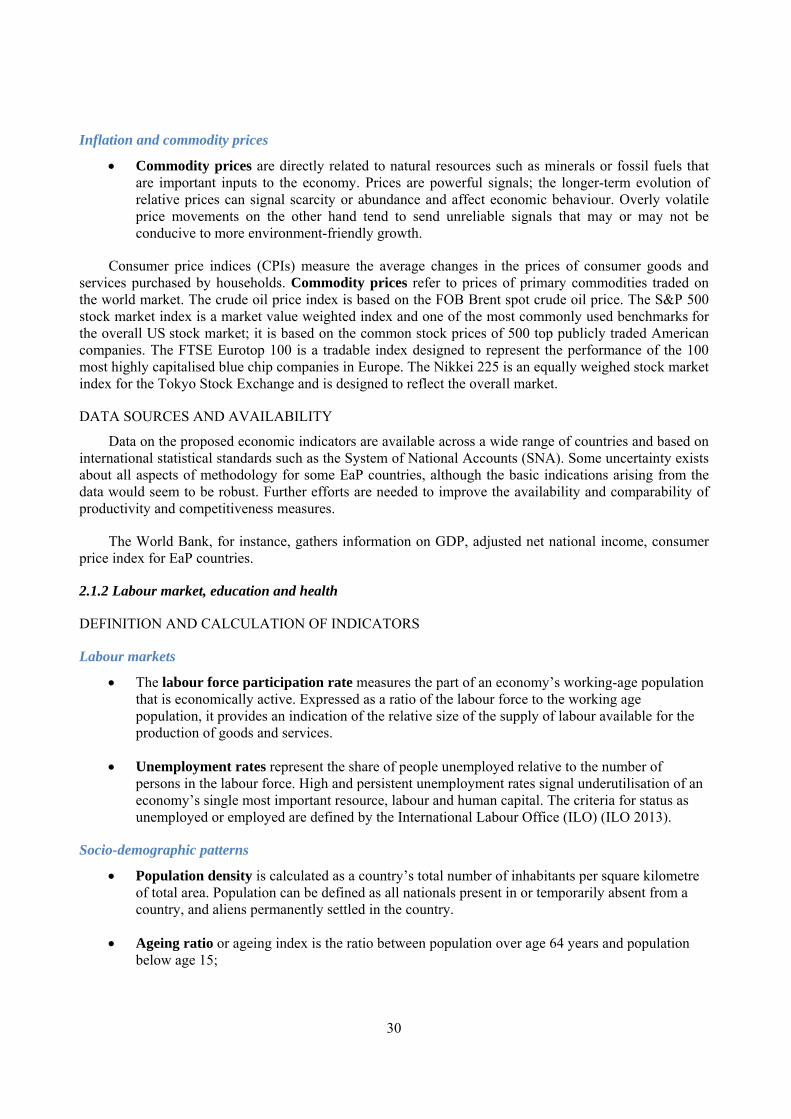
30
Inflation and commodity prices
Commodity prices are directly related to natural resources such as minerals or fossil fuels that are important inputs to the economy. Prices are powerful signals; the longer-term evolution of relative prices can signal scarcity or abundance and affect economic behaviour. Overly volatile price movements on the other hand tend to send unreliable signals that may or may not be conducive to more environment-friendly growth.
Consumer price indices (CPIs) measure the average changes in the prices of consumer goods and services purchased by households. Commodity prices refer to prices of primary commodities traded on the world market. The crude oil price index is based on the FOB Brent spot crude oil price. The S&P 500 stock market index is a market value weighted index and one of the most commonly used benchmarks for the overall US stock market; it is based on the common stock prices of 500 top publicly traded American companies. The FTSE Eurotop 100 is a tradable index designed to represent the performance of the 100 most highly capitalised blue chip companies in Europe. The Nikkei 225 is an equally weighed stock market index for the Tokyo Stock Exchange and is designed to reflect the overall market.
DATA SOURCES AND AVAILABILITY
Data on the proposed economic indicators are available across a wide range of countries and based on international statistical standards such as the System of National Accounts (SNA). Some uncertainty exists about all aspects of methodology for some EaP countries, although the basic indications arising from the data would seem to be robust. Further efforts are needed to improve the availability and comparability of productivity and competitiveness measures.
The World Bank, for instance, gathers information on GDP, adjusted net national income, consumer price index for EaP countries.
2.1.2 Labour market, education and health
DEFINITION AND CALCULATION OF INDICATORS
Labour markets
The labour force participation rate measures the part of an economy’s working-age population that is economically active. Expressed as a ratio of the labour force to the working age population, it provides an indication of the relative size of the supply of labour available for the production of goods and services.
Unemployment rates represent the share of people unemployed relative to the number of persons in the labour force. High and persistent unemployment rates signal underutilisation of an economy’s single most important resource, labour and human capital. The criteria for status as unemployed or employed are defined by the International Labour Office (ILO) (ILO 2013).
Socio-demographic patterns
Population density is calculated as a country’s total number of inhabitants per square kilometre of total area. Population can be defined as all nationals present in or temporarily absent from a country, and aliens permanently settled in the country.
Ageing ratio or ageing index is the ratio between population over age 64 years and population below age 15;

31
Life expectancy at birth is the average number of years a new-born could expect to live if he or she were to pass through life exposed to the sex- and age-specific death rates prevailing at the time of his or her birth, for a specific year, in a given country, territory or geographic area.
Healthy Life Years (HLY) can be calculated as the number of years spent free of activity limitation by gender. In Europe, HLYs are calculated annually by Eurostat for EU countries and some European Free Trade Association (EFTA) countries using the Sullivan method (Sullivan 1971). The corresponding disability measure is the Global Activity Limitation Indicator (GALI), which comes from the European Union Statistics on Income and Living Conditions (EU-SILC) survey. GALI measures limitation in usual activities due to health problems.
Education and income
Access to education is an indicator of a country’s investment in human capital, measured by university-level enrolment and by the graduation rate of men and women from tertiary-type A programmes.
Human capital development is a driver of growth in its own right. Education induces behavioural changes and raises skills, including in the adoption and adaption of environment-friendly processes, products and technologies.
Entry rates estimate the proportion of people who enter a tertiary-type A programme during their lifetimes. They also indicate the accessibility of tertiary education and the perceived value of attending tertiary programmes, and provide some indication of the degree to which a population is acquiring the high-level skills and knowledge valued by today’s labour market.
Tertiary-type A programmes (ISCED 5A) are largely theory-based and are designed to provide sufficient qualifications for entry to advanced research programmes and professions with high skill requirements, such as medicine, dentistry and architecture. Tertiary-type A programmes have a minimum cumulative theoretical duration (at tertiary level) of three years’ full-time equivalent, although they typically last four or more years. Information on the reading, mathematics and science performance may be given as complement.
Income inequality is measured by the Gini coefficient which ranges from 0 to 1 (Box 5). The Gini coefficient equals zero when all people have the same level of income and equals one when one person receives all the income. Higher values thus indicate higher income inequality (UNECE 2011).

32
Box 5. Rising income inequality poses social and economic challenges
In the three decades prior to the economic downturn, wage gaps widened and household income inequality increased in a large majority of OECD countries.
In most countries, the household incomes of the richest 10% grew faster than those of the poorest 10%, so income inequality widened. Today in the OECD, the average income of the richest 10% of the population is about nine times that of the poorest 10%. However the ratio varies widely by country.
Income dispersion has increased across OECD countries. The Gini coefficient stood at an average of 0.29 in OECD countries in the mid-1980s. By the late 2000s, it had increased by almost 10% to 0.32. Important drivers of household income inequality are changes in the distribution of wages and salaries, influenced by the average level of educational attainment and skills of the work force.
Figure 7. Income inequality
OECD and BRIICS countries, 1990, 2000 and 2010
Source: OECD Social and Welfare Statistics (database); http://dx.doi.org/10.1787/888932925122.
DATA SOURCES AND AVAILABILITY
Data on the socio-economic context of green growth should be obtained from national economic, labour and social statistics. Comparable data on labour market conditions may be difficult to obtain for long time series. The OECD is working on the further development of measures of income dispersion, job creation and worker reallocation. Further efforts are needed to calculate and regularly update indicators on the number of years of healthy life expectancy for all OECD countries and the world, and to establish closer links with environment-related health issues.
The World Bank gathers data and estimates on both labour market indicators and socio-economic indicators for EaP countries.
2.2 The environmental and resource productivity of the economy
A central element of green growth is the environmental and resource efficiency of production and consumption, and how this changes with time, place and across sectors. Understanding these trends, together with the underlying factors, is an essential part of monitoring the transition to green growth.
Progress toward green growth can be monitored by relating the use of environmental services in production to the output generated. Environmental services include natural resources and materials, including energy, and pollutants and other residuals with their implied use of environmental services which are functional attributes of natural ecosystems such as land, water and air that are beneficial to humankind. Tracking trends in decoupling of inputs to production from economic and sectoral growth is an important focus for monitoring.
0
0.2
0.4
0.6
0.8
1
DN
KSV
NN
OR
CZE IS
LFI
NSV
KBE
LAU
TSW
EH
UN
LUX
NLD
DEU FR
AC
HE
POL
KOR
IRL
ITA
ISR
EST
CAN NZL
JPN
GR
CAU
SES
PPR
TG
BR USA
TUR
MEX CH
LO
ECD
IDN
IND
RU
SC
HN
ARG
BRA
ZAF
2010 1990 2000
Gini coefficient [1 = the highest inequality]

33
Box 6. Understanding the notion of productivity
Productivity is commonly defined as a ratio between the volume of output and the volume of inputs. In other words, it measures how efficiently production inputs, such as labour and financial capital, are being used in an economy to produce a given level of output. Understanding productivity provides an essential tool for policy makers to identify the underlying drivers for growth.
Economic growth can be increased either by raising the labour and capital inputs used in production, or by improving the overall efficiency in how these inputs are used together, i.e. higher multifactor productivity (MFP) growth. GDP per capita measures economic activity or income per person and is one of the core indicators of economic performance. Growth in MFP is measured as the residual growth, i.e., that part of GDP growth that cannot be explained by growth in labour or capital input. Both labour productivity (GDP per hour worked) and labour utilisation need to be measured.
Internationally comparable indicators of productivity are central for assessing economic performance. They help grasp the role played by labour, capital and multifactor productivity growth in driving economic growth. They can also show the contribution of individual industries or sectors to more aggregate labour productivity growth. Furthermore, they provide insights into the link between productivity and international competitiveness.
Source : OECD (2013c)
The OECD GGIs in this area focus on:
Carbon and energy productivity, which characterises, among other things, interactions with the climate system and the global carbon cycle as well as the environmental and economic efficiency with which energy resources are used in production and consumption, and which informs about the results of policies that promote low carbon technologies and energy efficiency.
Resource productivity, which characterises the environmental and economic efficiency with which natural resources and materials are used in production and consumption, and which informs about the results of policies and measures that promote resource productivity and sustainable materials management in all sectors. Higher resource productivity will minimise the amount of resources that the economy requires and reduce waste generation. Important resources and materials include mineral resources (metallic minerals, industrial minerals, construction minerals); biotic resources (food, feed, wood); water; and nutrients, which among other characteristics reflect interactions with nutrient cycles and food production systems.
Environmentally adjusted multi-factor productivity, which accounts for the role of environmental services in productivity growth (provisioning services such as natural resource inputs; regulatory or sink functions of ecosystems that absorb pollutant emissions). This indicator is not yet fully measurable and is not further discussed here8.
For most indicators on the environmental and resource productivity of the economy, a breakdown by industry (ISIC/NACE) is highly recommended (data availability permitting).
Table 4. The environmental and resource productivity of the economy - proposed indicators
Proposed indicators
Theme Proposed indicators Type Measurability
Carbon & energy CO2 productivity
8 For more information on the currently used methodologies for measuring environmentally adjusted multi-factor productivity please refer to the
OECD working paper ENV/EPOC/WPEI(2014)4/REV1/ANN, which is available on OLIS: http://www.oecd.org/general/olis.htm.

34
productivity Production-based CO2 productivity M S GDP per unit of energy-related CO2 emitted
Demand-based CO2 productivity M S/M Real income per unit of energy-related CO2 emitted
Energy productivity Energy productivity M S (GDP per unit of TPES) Energy intensity by sector M S/M (manufacturing, transport, households, services) Share of renewable energy sources M S in TPES, in electricity production
Resource productivity
Material productivity (non-energy) Demand-based material productivity M M/L
(comprehensive measure; original units in physical terms) related to real disposable income
Domestic material productivity (GDP/DMC) P S/M - Biotic materials (food, other biomass) - Abiotic materials (metallic minerals, industrial minerals) Waste generation intensity and recovery ratios M M/L By sector, per unit of GDP or value added, per capita Nutrient flows and balances (N, P) M L Nutrient balances in agriculture (N, P) P S/M per agricultural land area and change in agricultural output
Water productivity M M Value added per unit of water consumed, by sector
(for agriculture: irrigation water per hectare irrigated)
Multifactor productivity
Multifactor productivity reflecting environmental services (comprehensive measure; original units in monetary terms)
M M/L
Type: M = Main indicators P = Proxy indicators when the main indicators are not available
Measurability (M): S = short term, M = medium term, L = long term
See Annex for a complete list of indicators.
Source: OECD (2014a)
2.2.1 Carbon productivity
POLICY CONTEXT
CO2 from the combustion of fossil fuels and biomass is a major contributor to greenhouse gas (GHG) emissions, which enhance the natural greenhouse effect, leading to temperature changes and other consequences for the earth's climate. Accounting for over 80% of global GHG emissions, CO2 determines the overall trend in emissions and is a key component in countries’ ability to deal with climate change.
Climate change is of global concern as regards its effects on ecosystems, human settlements and agriculture, and the frequency and scale of extreme weather events. It could have significant consequences for human well-being and socio-economic activities, which could in turn affect global economic output.
With current climate change mitigation policies, and increasing industrialisation of emerging economies, global emissions will likely continue to grow. Progress in stabilising the concentration of GHGs in the atmosphere therefore is dependent on the development and coordination of national and international strategies to further decouple CO2 and other GHG emissions from economic growth.

35
Carbon productivity indicators inform about the relative decoupling between economic activity and carbon inputs into the atmosphere. They provide insight into how much carbon productivity has improved, as well as how much of the improvement is due to the implementation of domestic policies and how much to displacement or substitution effects.
Since reductions in national emissions can be achieved by offshoring certain activities of domestic production and thus related emissions, evidence of decoupling gained from production-based measures may reveal only part of the story. The demand perspective is an important addition to the debate on global environmental issues, and the related indicators help explain movements in production-based measures.
DEFINITION AND CALCULATION OF INDICATORS
Production-based CO2 productivity (1.1) represents the GDP generated per unit of CO2 emitted in production.
Production-based emissions refer to gross direct CO2 emissions from fossil fuel combustion, emitted within the national territory and excluding bunkers, carbon sequestration sinks and indirect effects. The emissions can be calculated using IEA energy databases and the 2006 IPCC Guidelines for National GHG Inventories (IPCC 2006) (Box 7) 9.
Box 7. Calculating consumption and production-based CO2 emissions
The consumption-based emissions of country j’s resident are calculated as:
… …
⋮
⋮
The production-based emissions of country j’s resident are calculated as:
Legend:
hji = Emission factor of final consumption of the products of country j’s sector i (hji=θji+φji),
eji = Industrial emissions intensity of country j’s sector i (eji=εji+ρji+σji),
R = Number of countries,
B = Leontief inverse,
N = Number of sector and
F1ji = Final expenditure by country j for country 1’s product of sector i.
9 For further information on the calculation of consumption and production-based CO2 emissions please refer to: http://www.oecd.org/sti/ind/47478124.pdf.

For thecountry’s tot
Source
DDm
The evarious stagwhere the v
For Ocombinatiofrom fossilemitted inintermediatdemand-baimports wiand high embased policunderlying excluded.
CO2 emissionsectors. In 20
At the same tGDP (relativedecoupling). economic acti
Source: IEA C
e calculation otal production-
e: http://www.o
Demand-basDemand-baseminus emissio
estimates of ges of produvarious stage
OECD counon of multi-cl fuel combu
n producing te processes
ased estimateithin relativemission comcy measures
data up to
ns from energy 13, global energ
time, the overale decoupling). In recent yearsivity following th
CO2 emissions f
of the indicator-based CO2 em
oecd.org/indus
ed CO2 proed emissionsons embodie
demand-basuction of the es of product
ntries, emisscountry inputustion. This
a product and countrie
es use macrely aggregate
mpanies allocas can be dev date. Emis
use are still grogy-related CO2 e
l carbon producIn more than
s, emissions hahe economic cris
Figur
O
from fuel combu
r, a country’s rmissions.
stry/ind/carbon
oductivity (s are produced in exports.
sed CO2 progoods and s
tion occurred
sions embodt-output tableprovides a to the fina
es the produro approacheed industry gated to the saveloped. Conssions from
Box 8. Tren
owing worldwideemissions reach
ctivity of OECD one-third of Oave been decresis.
re 8. Prod
OECD and BRII
ustion statistics
36
real GDP (exp
ndioxideemiss
1.2) is the rction-based e.
oductivity (1services consd.
died in finaes, bilateral framework t
al purchaser uct passes thres that assumgroupings, mame sector. Tntinued efforbunkers and
nds in CO2 p
e, mainly due thed a record hig
economies hasECD countrieseasing in almo
uction-based
CS countries, 2
(database); http
penditure appr
sionsembodie
real nationalemissions plu
1.2) should rsumed in dom
al domestic trade data anthat can be
of that prorough beforeme homogen
meaning theyThis limits thrts are needd fugitive e
roductivity
o increases in tgh of 32.2 billion
s grown and CO emissions hav
ost 80% of OE
d CO2 produc
2000 and 2013
p://dx.doi.org/10
roach) should
dininternation
l income perus emissions
reflect the Cmestic final d
demand arnd productionused to allooduct, irresp
e arriving at ineity in proy cannot difhe extent to wed to keep tmissions fro
the transport ann tonnes.
O2 emissions inve decreased CD countries,
tivity
3
0.1787/8889329
be divided by
naltrade.html.
r unit of COs embodied
CO2 emitted demand, irre
re calculateon-based CO2
ocate the flopective of hits final purc
oduction profferentiate bewhich specifthe methodoom fuel ext
nd the energy t
ncreased at a loin absolute termainly due to
925160
y the
O2 emitted. in imports
during the espective of
ed using a 2 emissions ws of CO2
how many chaser. The
ocesses and etween low fic demand-ologies and raction are
transformation
ower rate than rms (absolute decreases in

37
DATA SOURCES AND AVAILABILITY
In EaP countries national GHG inventories constitute the key source of data for these indicators. National statistical and/or environmental agencies collect data on GHG emissions from stationary sources using a standardised reporting form. Emissions from mobile sources are calculated on the basis of consumed fuel and composition of the vehicle fleet. Parties to the United Nations Framework Convention on Climate Change (UNFCCC) submit national GHG inventories to UNFCCC. Annex I Parties10 are required to submit a national communication to the UNFCCC on a regular basis (every four to five years) and a GHG inventory on a yearly basis.
Continued efforts are being made to further improve national GHG inventories, particularly to better evaluate sinks and indirect effects and to calculate comparable net GHG emissions, including for non-Annex I countries. More needs to be done to monitor the effects of domestic demand and the use of international transactions and the flexible mechanisms of the Kyoto Protocol on emissions outside the national territory.
Data on CO2 emissions from fossil fuel combustion for all EaP countries can be found in the International Energy Agency (IEA) energy databases11.
2.2.2 Energy productivity
POLICY CONTEXT
Energy is a major component of the economy, both as a sector in itself and as a factor input to all other economic activities. The structure of a country's energy supply and the intensity of its energy use, along with changes over time, are key determinants of the environmental performance and the sustainability of economic development, and hence of green growth. Another concern regarding energy choices is that access to affordable energy is essential to reduce poverty.
The environmental effects of energy production and use differ by energy source. The main concerns relate to contributions to GHG emissions and local and regional air pollution. Other effects involve the impact on water quality, land use, and risks related to the nuclear fuel cycle and to the extraction, transport and use of fossil fuels. The use of renewable energy sources and of low-carbon and clean fuel technologies plays an important role in addressing climate change, as well as improving energy security.
Progress towards green growth can be assessed against the energy productivity of the economy and against domestic objectives for energy intensity, energy efficiency targets, or the share of renewable energy in energy or electricity supply. Progress can further be assessed against international environmental and climate change commitments that have implications for domestic energy policies and strategies.
DEFINITION AND CALCULATION OF INDICATORS
The energy productivity (2.1) 12 of the economy, expressed as GDP in constant prices per unit of total primary energy supply (TPES), measures how much national revenue is generated for each unit of primary energy supplied.
This indicator is based on information on a country’s total TPES, which is calculated as the production plus imports minus exports of energy minus international marine and aviation bunkers plus or minus stock changes.
10 Annex 1 parties include the EaP countries Belarus and Ukraine 11 See, for example, https://www.iea.org/publications/freepublications/publication/CO2EmissionsFromFuelCombustionHighlights2015.pdf 12 It should be noted that energy productivity is not the same as carbon productivity, though the two are closely related. As fossil fuel use declines
and more “clean energy” technologies are deployed, CO2 productivity becomes decoupled from energy productivity.

38
The energy intensity by sector (2.2) is calculated as the amount of energy consumed per activity or output for sub-sectors (manufacturing, transport, households, services) and end uses.
The Energy intensity by sector (2.2) is the inverse of energy productivity. The choice of the denominator often depends on data availability, but the energy intensity in the residential sector, service sector, industrial sector, and the transport sector are usually calculated. The output or activity may be defined differently for different sectors: for the passenger transport sector, for example, they could be defined as the total passenger transport energy consumption per passenger-kilometre (pkm); for the industry sectors it could be total industry energy consumption per unit of value-added.
The following should be noted for the different sectors: Services include residential and commercial and public services; Industry includes manufacturing, mining and quarrying, and construction, but does not include energy used for transport; Transport covers all transport activity (in mobile engines) regardless of the economic sector to which it is contributing.
The share of renewables in TPES and in electricity generation (2.3) is calculated as the proportion of renewable sources of energy in a country’s total primary energy supply. Depending on data availability, the share of renewables in electricity generation may be presented as an alternative or complement. The main renewable forms include:
Hydro power represents the potential and kinetic energy of water converted into electricity in hydroelectric plants.
Geothermal is the energy available as heat emitted from within the earth’s crust, usually in the form of hot water or steam. It can be used directly as heat for district heating, agriculture, etc., or to produce electricity. Unless the actual efficiency of the geothermal process is known, the quantity of geothermal energy entering electricity generation is inferred from the electricity production at geothermal plants assuming an average thermal efficiency of 10%.
Wind represents the kinetic energy of wind exploited for electricity generation in wind turbines. The quantities entering electricity generation are equal to the electrical energy generated.
Solar includes solar thermal and solar photovoltaic (PV). The quantities of solar PV entering electricity generation are equal to the electrical energy generated. Direct use of solar thermal heat is also included.
Combustible renewables and waste comprises solid biomass, liquid biomass, biogas, industrial waste and municipal waste. Biomass is defined as any plant matter used directly as fuel or converted into fuels (e.g. charcoal) or electricity and/or heat. Included here are wood, vegetal waste (including wood waste and crops used for energy production), ethanol, animal materials and/or waste, and sulphite lye (black liquor). Municipal waste is waste produced by the residential and commercial and public service sectors (which is collected by local authorities for disposal in a central location for the production of heat and/or power).
Tide, wave and ocean represents the mechanical energy deriving from tidal movement, wave motion or ocean current and exploited for electricity generation. The quantities entering electricity generation are equal to the electrical energy generated.

39
Box 9. Calculating energy-related GGIs based on SEIS dataflows
The dataflows underpinning SEIS contain dataflows, which are also necessary to calculate the GGIs on Energy intensity by sector, Energy productivity, and Share of renewable energy sources in Total primary energy supply (TPES). In the following paragraphs, each of these areas will be discussed separately. Both the dataflows required by the EIs on energy and by the subindicators under the GGI Energy productivity (2) are based on energy balances provided by the International Energy Agency (IEA) and are therefore generally compatible. However, based on this data, slightly differing statistical operations are to be performed.
Energy productivity (2.1)
The SEIS dataflow on TPES (EI G2) can be used to produce GGI 2.1, which is calculated as GDP per TPES. As both UNECE and OECD dataflows are based on IEA energy balances, TPES is consistently calculated as production plus imports minus exports minus international marine and aviation bunkers plus or minus stock changes. For the production of GGI 2.1 these data on TPES are to be related to a country’s GDP. The relevant SEIS dataflow is expressed as thousand tonnes of oil equivalent (ktoe). From this, the unit of measurement of the GGI 2.1 (unit of GDP per ton of oil equivalent (toe)) can be easily calculated.
Energy intensity by sector (2.2)
The SEIS dataflow Final energy consumption (EI G1) contains data on final energy consumption by category, with accordance to the International Standard Industrial Classification of All Economic Activities (ISIC) classification: industry, transport, households, commercial and public services, agriculture, forestry and fishery, non-specified and non-energy use. This complies with the dataflow on the consumption of energy by sectors, Likewise following ISIC, which is required for GGI Energy intensity by sector (2.2). For the production of GGI 2.2 this data has to be related with the output for sub-sectors and end uses (see above). The energy consumption by sector is to be provided as 1,000 tonnes of oil equivalent (ktoe) for the SEIS dataflow, from which the dataflow for the GGI, expressed as toe per unit of GDP, toe per passenger-kilometre etc. can be calculated.
The share of renewables in TPES and in electricity generation (2.3)
The SEIS dataflows on Renewable energy supply (EI G4) can be used for the production of GGI Share of renewable energy sources in TPES (2.3). Both indicators require the production of dataflows on the share of different renewable sources of energy in TPES. Units of measurement for those indicators are fully compatible, both being expressed as percentage of the respective renewables in TPES. Moreover, beyond the share of renewables in TPES, the under GGI 2.3 share of renewables in electricity generation may be presented. This dataflow goes beyond the data included in the SEIS dataflow, as the total energy supply is not broken down into electricity generation and the generation of other fuels.
At the macro level, energy intensity can also be expressed as total final energy consumption per GDP, TPES per capita, or TPES per GDP (also in EI G3). However, as in the context of green growth “energy productivity” is preferred over “energy intensity” as an indicator on energy efficiency on the macro level, these possibilities are not further discussed here.
Table 5. Mapping of UNECE and OECD dataflows on energy
Topic Indicator and dataflows Unit of measurement
SEIS dataflows
Total primary energy supply (G2)
TPES (production + imports - exports - international marine and aviation bunkers +/- stock changes)
Kilotonnes of oil equivalent (ktoe)
GGI Energy productivity (2.1)
GDP per TPES Unit of GDP / tonnes of oil equivalent (toe)
SEIS dataflows
Final energy consumption (G1)
Final energy consumption by category (according to ISIC: industry, transport, households, commercial and public services, agriculture, forestry and fishery, non-specified, non-energy use)
Ktoe

40
GGI Energy intensity by sector (2.2)
Energy intensity (final consumption or by sectors according to ISIC: manufacturing, transport, households, services)
Toe /unit of GDP Other sectoral units, e.g. for transport sector: toe / pkm
SEIS dataflows
Renewable energy supply (G4)
Energy from hydropower, geothermal energy, wind power, biomass and waste and solar power in TPES
Ktoe Percentage of the respective renewables in TPES
GGI Share of renewable energy sources in TPES (2.3)
The share of renewables in TPES and in electricity generation (hydro, geothermal, wind, biomass, waste and solar energy)
Percentage of the respective renewables in TPES
Source: Extract from OECD et al. (2015).
Box 10. Trends in energy productivity in OECD countries
Over the past two decades, energy productivity increased for OECD countries overall, and some decoupling of environmental effects from growth in energy use was achieved. This is a consequence of structural changes in the economy and energy conservation measures, as well as, in some countries, decreases in economic activity and the transfer of energy-intensive industries to other countries. Differences between OECD countries in energy productivity remain high, though there are feeble signs of convergence in productivity trends since 1990.
Figure 9. Energy productivity
OECD and BRIICS countries, 2000 and 2011
Source: IEA World Energy Statistics and Balances (database); http://dx.doi.org/10.1787/888932925236
Figure 10. Total final energy consumption by sector
OECD countries
OECD 2011
0
2
4
6
8
10
12
14
IRL
CH
E
GBR
DN
K
ESP
ITA
PRT
GR
C
AUT
DEU IS
R
TUR
JPN
LUX
NO
R
NLD
MEX CH
L
FRA
SVN
HU
N
POL
SWE
AUS
SVK
BEL
NZL
USA CZE
KOR
FIN
CAN ES
T
ISL
OEC
D
BRA
IND
IDN
CH
N
ZAF
RU
S
BRII…
Wor
ld
2011 2000
GDP / TPES

41
Source: OECD, IEA
DATA SOURCES AND AVAILABILITY
Data on energy supply and consumption are available from the IEA for all EaP countries. The agency’s Energy Balances contain the data on TPES, consumption by sectors, and on the share of renewables in TPES, which are required for the production of the indicators (up to 2014)13.
In addition, the World Bank gathers information on energy supply and use. It also has information on electric power transmission and distribution losses in EaP countries.
2.2.3 Resource productivity – materials
POLICY CONTEXT
Material resources14 form the physical foundation of the economy; essential raw materials and other commodities support economic activity and are an important source of income and jobs. Material resources differ in their physical and chemical characteristics, their abundance and their value to countries. The use of materials from natural resources and the attendant production and consumption-processes have many environmental, economic and social consequences that often extend beyond the borders of countries or regions:
From an environmental perspective, the manner in which materials are used and managed affects the quantity and quality of natural resource stocks and the quality of ecosystems and environmental media. The intensity and nature of the consequences depend on the kind and amounts of natural resources and materials used, the stage of the resource cycle at which uses occur, the way the material resources are used and managed and the type and location of the natural environment where they originate.
From an economic perspective, the manner in which materials are used and managed affects (i) short-term costs and long-term economic sustainability, (ii) the supply of strategically important materials and (iii) the productivity of economic activities and industrial sectors.
13 http://www.iea.org/statistics/statisticssearch/ 14 Materials are aggregated using mass-based weights and are classified as biotic materials (biomass for food and feed, wood), construction minerals, other abiotic materials (industrial minerals and metals) and energy carriers.
0
2000
4000
6000
1990 1995 2000 2005 2009 2010
Agriculture OtherIndustry TransportServices Energy supply
Mtoe

42
Progress towards green growth can in part be assessed against changes in the amounts of materials needed to support economic activities and in the associated material productivity. It can also be assessed against international objectives and national targets concerning material productivity and resource efficiency. Examples of international initiatives include the 3R (Reduce, Reuse and Recycle) Action Plan, the 2004 and 2008 OECD Council Recommendations and the UNEP International Resource Panel.
DEFINITION AND CALCULATION OF INDICATORS
Domestic material productivity is expressed as the amount of economic output generated in terms of GDP per unit of materials consumed in terms of raw material consumption (RMC) or domestic material consumption (DMC).
Materials are aggregated using mass-based weights and are classified as biotic materials (biomass for food and feed, wood), construction minerals, other abiotic materials (industrial minerals and metals) and energy carriers. Since energy is already covered under the indicators “carbon productivity” and “energy productivity”, it is suggested to focus the material productivity indicator on non-energy materials.
Domestic material consumption (DMC) measures the total amount of materials used in an economy (apparent consumption) and is calculated as Domestic extraction used (DEU) minus export plus imports. DEU measures the flows of materials that originate from the environment (i.e. that are extracted from natural resource stocks) and that physically enter the economic system for further processing or direct consumption (they are “used” by the economy). They are converted into or incorporated in products in one way or another, and are usually of economic value.
Demand-based material productivity is a comprehensive measure to calculate the raw material equivalents embodied in the trade of goods and services, and to monitor flows of secondary raw materials.
The measure should then be related to real disposable income. However, there may be gaps in data availability for the demand-based indicator, and more needs to be done to calculate it in an internationally harmonised way. Therefore, the EaP countries may wish to start working on the production-based material productivity (domestic material productivity).
Box 11. Trends in domestic material productivity in OECD countries
Worldwide use of most significant materials has been rising for many years, causing recurrent concerns about shortages of natural resource stocks, the security of supply of energy and other materials, and the environmental effectiveness of their use.
Global extraction of materials is up more than 60% since 1990, but growing more slowly in OECD countries than worldwide. Construction materials, fossil fuels, and biomass for food and feed, together represent more than 80% of total global extraction.
Material consumption in OECD countries grew by 12% during the 1990s, reached about 23 Gt per year in the mid-2000s, and then decreased to 21 Gt in the late 2000s due to the economic downturn. Per capita material consumption in OECD countries remains high at about 17 tonnes per year, and is about 60% higher than the world average.
Material productivity is improving. OECD economies today generate 50% more economic value with a tonne of materials other than energy than in the 1990s. From 1990 to 2010, the non-energy material productivity of OECD economies increased from USD 1.6/kg to USD 2.5/kg in real terms.
43
Figure 11. Domestic material consumption (DMC)
DMC, GDP and municipal waste, OECD, 1990-2011 DMC and GDP, OECD, 1995-2011
Source: OECD Environment Statistics (database); http://dx.doi.org/10.1787/888932925312.
DATA SOURCES AND AVAILABILITY
The OECD maintains a “database on material flows” based on ongoing international work on material flow accounting and analysis (MFA). Estimations of material resources are aggregated using mass-based weights and are classified as biotic materials (biomass for food and feed, wood), construction minerals, other abiotic materials (industrial minerals and metals) and energy carriers.
Data for EaP countries can be found in a database on material flows set up by the Sustainable Europe Research Institute (SERI) and the Vienna University of Economics and Business15.
Although considerable progress has been made to set up material flow accounts, missing information, including on physical flows of international trade, and a lack of consensus on conversion factors limit the calculation of some material flow indicators at international level. Work is ongoing to calculate internationally harmonised demand-based indicators that measure the raw material equivalents embodied in the trade of goods and services, and to monitor flows of secondary raw materials.
2.2.4 Resource productivity - waste
POLICY CONTEXT
Waste is generated at all stages of human activities. Its composition and amounts depend largely on consumption and production patterns. Inappropriate treatment and disposal of the generated waste may cause pollution and expose humans to harmful substances and infectious organisms. A reduction in the volume of waste generated per unit of GDP can be an indication of the economy’s move towards less material intensive production patterns.
DEFINITION AND CALCULATION OF INDICATORS
The Waste generation intensity can be calculated by dividing total waste generation by unit of GDP or value added. Waste recovery ratios help to understand which proportion of the amount of waste generated (or collected) is collected for recovery operations.
The categorisation of waste by sector should follow the International Standard Industrial Classification of All Economic Activities (ISIC). When data on the total amounts of waste are not
15 http://www.materialflows.net/
-
25
50
75
100
125
150
175
200
1990 1995 2000 2005 2010
Municipal wasteGDPNon-energy DMC
Index, 1990=100
05
10152025303540
GDP DMC GDP DMC GDP DMC GDP DMC GDP DMC
1995 2000 2005 2008 2011Construction Biotic Abiotic Energy GDP
GDP (trillion USD), DMC (Gt)

44
available, municipal waste can be used instead. It should however be noted that municipal waste commonly only represents about 10% of the total waste generated.
Municipal waste encompasses household and similar waste collected by or on behalf of municipalities. It includes waste originating from households, small commercial activities, office buildings, institutions such as schools and government buildings, and small businesses that dispose of waste at the same facilities used for municipally collected household waste. Household waste is waste generated by the domestic activity of households. It includes mixed household waste, bulky waste and separately collected waste.
Waste recovery rates for municipal waste can be defined as the amount of waste (or material) collected for recovery operations as a percent of the amount of waste generated (or collected, or treated - depending on data availability). Recovery operations include recycling, composting and incineration with energy recovery.
Box 12. Calculating GGI “Waste generation intensity and recovery ratios” based on SEIS dataflows
Dataflows under SEIS on Waste generation (EI I1) and Waste reuse and recycling (EI I3) can be used for the production of GGI Waste generation intensity and recovery ratios (3.3).
Both EI I1 and GGI 3.3 contain a dataflow on municipal waste generation and on waste generation by source following ISIC.
While the EI in particular refers to the methodology of data collection applied in the UNSD/UNEP Questionnaires on Environment Statistics, the OECD collects data via the OECD questionnaire on the state of the environment, a joint questionnaire with Eurostat for common member countries. The questionnaires are harmonized between OECD, UNSD, and other organizations and the same data are required.
For EI I1, thousand tonnes are used as a unit of measurement for the total amounts of waste and kilogram per unit of GDP and kilogram per capita for the respective subindicator. Those are easy to recalculate into the units of measurement used for GGI 3.3: thousand tonnes, tonnes per unit of GDP and tonnes per capita, respectively.
Dataflows on the percentage of reused and recycled waste in total managed waste (and/or in total municipal waste managed) contained in EI Waste reuse and recycling (I3) are compatible with the approach of GGI 3.3 for calculating waste recovery rates. The EI I3 includes a dataflow on the share of total waste recycled in total waste managed (expressed as a percentage). The GGI measures waste recovery rates, which are defined as “the amount of waste (or material) collected for recovery operations as a percent of the amount of waste generated (or collected)”. In practice, the definition used varies across countries and depends on data availability and on surveying methods used.
Data on the “amount of recycled materials (secondary raw materials) used in production as a percent of the total apparent consumption of the same materials”, suggested as a dataflow for GGI 3.3, are not part of the EIs.
Table 6. Mapping of UNECE and OECD dataflows of waste
Topic Indicator and dataflows Unit of measurement
SEIS dataflows
Waste generation (I1)
Total waste generation (may be expressed as generation of municipal waste) Waste generation by sector (following ISIC)
1000 t Kg / unit of GDP Kg / capita
GGI
Waste generation intensity and recovery ratios (3.3)
Total waste generation (may be expressed as generation of municipal waste) Waste generation by sector (following ISIC)
1000 t t / unit of GDP t / capita
SEIS dataflows
Waste reuse and recycling (I3)
Total waste recycled in total waste managed
1000 t Percentage of total waste managed
GGI
Waste generation intensity and recovery ratios (3.3)
Waste recovery ratios of waste generated (or collected) Amount of recycled materials (secondary raw materials) used in production
Waste (or material) collected for recovery operations as a percentage of the amount of waste generated Percentage of recycled materials used in the total consumption of selected materials
45
Source: Extract from OECD et al. (2015).
DATA SOURCES AND AVAILABILITY
In EaP countries, data on the generation of waste from economic sectors are usually collected by environmental authorities or by statistical agencies. In many countries, data on waste generation are published in national state-of-the-environment reports and statistical yearbooks. National data on waste generation are collected by the United Nations Statistics Division (UNSD) and UNEP in their Questionnaire on Environment Statistics and published under the UNSD Environmental Indicators16.
A 2013 UNEP report (Hak et al, 2013) looked at 12 EECCA countries, including all EaP countries, to provide a better understanding of resource efficiency issues in the region. For this purpose, a material flows database was established using mainly FAO and IEA statistics.
2.2.5 Resource productivity - nutrients
POLICY CONTEXT
The sustainability of agro-food systems is at the centre of green growth considerations. The main concerns relate to food security, flows of potentially polluting nutrients (nitrogen, phosphorus) from commercial fertiliser use and intensive livestock farming, and pesticide residues that may leach into surface water and groundwater and may enter the food chain. Agriculture’s environmental effects can be negative or positive. They depend on the scale, type and intensity of farming as well as on agro-ecological and physical factors, climate and weather, and policy, economic and market developments. Farming can lead to deterioration in soil, water and air quality and to loss of natural habitats and biodiversity. These environmental changes can in turn have implications for the level of agricultural production and food supply, and limit the sustainable development of agriculture. But farming can also provide sinks for GHGs, contribute to conservation of biodiversity and landscapes, and help prevent floods and landslides.
Progress towards green growth can partly be assessed against changes in agricultural nutrient balances and intensities. Nutrient balances are an indication of the level of potential environmental pressures from nutrients, in particular on soil, water and air in the absence of effective pollution abatement.
DEFINITION AND CALCULATION OF INDICATORS
Nitrogen and phosphorus surplus intensities, expressed as the gross N and P balance per hectare of agricultural land
Agricultural nutrient intensity related to changes in agricultural output, expressed as changes in the gross N and P balance per hectare of agricultural land versus changes in agricultural production.
The indicator Nutrient flows and balances (N, P) (3.3) describes potential environmental pressures, and may hide important spatial variations. They reflect nutrient balances from primary agriculture, and do not consider nutrient flows from other food production systems, such as fisheries or total nitrogen cycles in the economy. Cross-country comparisons of change in nutrient surplus intensities over time should take into account the absolute intensity levels during the reference period.
The indicators relate to the gross nutrient balances, which is the difference between the quantity of nutrients inputs entering an agricultural system and the quantity of nutrient outputs leaving the agricultural
16 http://unstats.un.org/unsd/environment/wastetreatment.htm

46
system. It is calculated by subtracting the uptake of nutrients (e.g. by crops and forage) from the total nutrient supply (e.g. fertilisers, livestock manure, animal feed). This calculation can be used as a proxy to reveal the status of environmental pressures, such as declining soil fertility in the case of a nutrient deficit, or for a nutrient surplus the risk of polluting soil, water and air.
The nutrient balance indicator is expressed in terms of kilograms of nutrient surplus (or deficit) per hectare of agricultural land per year to facilitate the comparison of the relative intensity of nutrients in agricultural systems between countries. The nutrient balances are also expressed in terms of changes in the physical quantities of nutrient surpluses (deficits) to indicate the trend and level of potential physical pressure of nutrient surpluses into the environment. Spatial variations in nutrient balances depend on regional differences in farming systems, differing climates and types of soil, farming types and crop types, and varying topography across agricultural regions.
Handbooks on the calculation methods for agricultural nutrient balances are available from OECD/Eurostat17.
Box 13. Trends in agricultural nutrient balances and agricultural production in OECD countries
For many OECD countries, nutrient surpluses relative to changes in agricultural output declined in terms of both absolute tonnes of nutrients and nutrient surpluses per hectare of agricultural land. The rate of reduction in OECD nutrient surpluses was more rapid in the 2000s than the 1990s. Over the past decade, the volume of OECD agricultural production increased by more than 1% per year, whereas the nitrogen balance (tonnes) declined by over 1% per year and the phosphorus balance by over 5% per year.
There are, however, sizeable variations within and between countries in terms of the intensity of and trends in nutrient surpluses. Territorial variations within countries are explained by the spatial distribution of intensive livestock farming and cropping systems that require high nutrient inputs, such as those for maize and rice. In some countries the absolute pressure on the environment (measured as the intensity of nitrogen and phosphorus surpluses) remains high.
Figure 12. Decoupling trends: agricultural nutrient balances and agricultural production
Nitrogen balance, OECD, 1990-2009 Phosphorus balance, OECD, 1990-2009
Source: “OECD agri-environmental indicators”, OECD Agriculture Statistics (database);
17 http://www.oecd.org/greengrowth/sustainable-agriculture/40820243.pdf and http://www.oecd.org/greengrowth/sustainable-
agriculture/40820243.pdf
0
25
50
75
100
125
150
175
200
0
25
50
75
100
1990 1992 1994 1996 1998 2000 2002 2004 2006 2008
Gross nitrogen balance per haAgricultural production indexAgriculture share in GDP index
N-balance (kg/ha) Index (1990=100)
0
25
50
75
100
125
150
175
200
0
25
50
75
100
1990 1992 1994 1996 1998 2000 2002 2004 2006 2008
Gross phosphorus balance per haAgricultural production indexAgriculture share in GDP index
P-balance (kg/ha) Index (1990=100)

47
http://dx.doi.org/10.1787/888932925407.
DATA SOURCES AND AVAILABILITY
In the EaP countries data on the use of mineral and organic fertilisers as well as on agricultural outputs are collected by the ministries of agriculture or the environment, and by statistical agencies. Rather complete and current data (until 2011/2013) on the consumption of nitrogen and phosphate fertilisers are published in the databases of FAOSTAT (Agri-Environmental Indicators)18 and the World Bank19.
2.2.6 Resource productivity – water productivity
POLICY CONTEXT
The availability of water for meeting basic human needs is a prerequisite for life, health and economic development. Progress towards green growth can be assessed against changes towards more efficient use of limited water resources by the different economic sectors. Increasing values in time series indicate decoupling of the economic growth from water use. It does not necessarily indicate decline in total water use or decline of the (regional) impact of water use.
DEFINITION AND CALCULATION OF INDICATORS
Water productivity (4) is calculated as economic outputs (value added) per unit of water consumed by economic sectors (classified according to ISIC).
Water consumed can be calculated as the water supplied to a given industry or sector, including the water abstracted for self-supply. The choice of economic sectors depends on data availability. The outputs may be defined differently for different sectors: for the energy sector, for example, they could be defined as the amount of energy generated per unit of water used; for agriculture it could be the crop output per unit of water used.
Box 14. Calculating GGI “Water productivity” based on SEIS dataflows
SEIS Dataflows on Total freshwater use (EI C3) can be used for the production of the GGI Water productivity (4). Both indicators are calculated on the basis of data on total freshwater use by ISIC sectors (households, agriculture, forestry and fishing, manufacturing, electric power industry, other economic activities). At the same time, the GGI includes the value added per unit of water consumed by sector. While the general required data on water use is fully compatible, the data on the value added by economic sectors are not part of the dataflows under SEIS.
Water use by sectors is to be provided as million cubic metres (m3) for EI C3, from which the dataflow for the GGI, expressed as unit of GDP per cubic metre, unit of energy per cubic metre, etc. can be calculated.
Table 7. Mappingo f UNECE and OECD dataflows on water productivity
Topic Indicator and dataflows Unit of measurement
SEIS dataflows
Total water use (C3) Total freshwater use (classified according to ISIC)
Million m3
GGI Water productivity (4)
Value added per unit of water consumed or supplied, by sector (classified according to ISIC) – value added expressed as economic output or as physical output of the economic sectors, e.g. energy generated per unit of water used
Unit of GDP / m3 Other sectoral units, e.g. for energy sector: toe generated per m3
Source: Extract from OECD et al. (2015).
18 http://faostat3.fao.org//faostat-gateway/go/to/compare/Q/QC/E
19 http://data.worldbank.org/indicator/AG.CON.FERT.ZS

48
DATA SOURCES AND AVAILABILITY
In EaP countries data on water use are usually collected by national environmental authorities from the water supply industry and other enterprises and users. Measurement methods employed may vary considerably among the countries. Data on total freshwater use by sector was collected in the Questionnaire on Environment Statistics (2013) of UNSD and UNEP.
2.3 The natural asset base
Natural resources are a major foundation of economic activity and human welfare. Their stocks are part of the natural capital and they provide raw materials, energy carriers, water, air, land and soil. They support the provision of environmental and social services that are necessary to develop human and social capital. The extraction and consumption of resources affects the quality of life and well-being of current and future generations.
Natural resources differ in their physical characteristics, abundance and value to countries or regions. Their efficient management and sustainable use are key to economic growth and environmental quality. The aim is to optimise the net benefits from resource use within the context of economic development by (1) ensuring adequate supplies of renewable and non-renewable resources to support economic activities and economic growth; (2) managing environmental impacts associated with extracting and processing natural resources to minimise adverse effects on environmental quality and human health; (3) preventing natural resource degradation and depletion; and (4) maintaining non-commercial environmental services.
Progress can be monitored by looking at stocks of natural resources and of other environmental assets along with flows of environmental services, and by using indicators that reflect the extent to which the asset base is being maintained, in terms of quantity, quality or value.
The main issues of importance to green growth include:
availability and quality of renewable natural resource stocks, including freshwater, forests and fish
availability and accessibility of non-renewable natural resource stocks, particularly mineral resources such as metals, industrial minerals and fossil energy carriers
biological diversity and ecosystems, including species and habitat diversity and the productivity of land and soil resources.
Moreover, the availability of natural resources can be measured through a comprehensive index of natural resources, which is not further discussed here, as it is still being tested. For more information on the currently performed tests please refer to Schreyer and Obst (2015).

49
Table 8. The natural asset base - proposed indicators
Proposed indicators
Theme Proposed indicators Type M
Natural resource stocks
Index of natural resources M M Comprehensive measure expressed in monetary terms
Renewable stocks Freshwater resources M S/M Available renewable natural resources (groundwater, surface water) and related abstraction rates (national, territorial)
Forest resources M S/M Area and volume of forests; stock changes over time Fish resources M S Proportion of fish stocks within safe biological limits (global)
Non-renewable stocks Mineral resources M M/L Available (global) stocks or reserves of selected minerals: metallic minerals, industrial minerals, fossil fuels, critical raw materials; and related extraction rates
Biodiversity and ecosystems
Land resources M M/L Land cover types, conversions and cover changes from natural state to artificial state
Land use: state and changes P S/M Soil resources M M/L Degree of topsoil losses on agricultural land, on other land Agricultural land area affected by water erosion, by class of erosion P S/M Wildlife resources (to be further refined) Trends in farmland or forest bird populations or in breeding bird
populations P S/M
Species threat status: mammals, birds, fish, vascular plants in % species assessed or known
P S
Trends in species abundance P S/M
Type: M = Main indicators P = Proxy indicators when the main indicators are not available
Measurability (M): S = short term, M = medium term, L = long term
See Annex for a complete list of indicators.
Source: Extract from OECD (2014a).
2.3.1 Renewable stocks - freshwater resources
POLICY CONTEXT
Freshwater resources are of major environmental and economic importance. Their distribution varies widely among and within countries. Pressures on water resources are exerted by overexploitation as well as by degradation of environmental quality. Water quality is affected by water abstraction, by pollution loads from human activities (agriculture, industry, households) and by climate and weather.
The main concerns relate to inefficient use of water and the environmental and socio-economic consequences: low river flows, water shortages, salinisation of freshwater bodies in coastal areas, human health problems, loss of wetlands, desertification and reduced food production.
Progress towards green growth can be assessed against domestic objectives and international commitments. The Agenda 21 from the United Nations Conference on Environment and Development (UNCED, Rio de Janeiro, 1992) explicitly considered the protection and preservation of freshwater

50
resources. This was reaffirmed at the World Summit on Sustainable Development (WSSD, Johannesburg, 2002). Relating resource abstraction to renewal of stocks is a central question concerning sustainable water resource management.
DEFINITION AND CALCULATION OF INDICATORS
Available renewable freshwater resources expressed as the long term annual average availability in cubic metres per capita;
Total renewable freshwater resources refer to internal flow plus actual external inflow. The internal flow is equal to precipitation less actual evapotranspiration. It represents the total volume of river run-off and groundwater generated, in natural conditions, exclusively by precipitation into a territory. The external inflow is the total volume of the flow of rivers and groundwater coming from neighbouring territories. The amount of water required to sustain ecological processes should be taken into account.
The intensity of freshwater resource use (or water stress), expressed as gross abstraction from groundwater or surface water bodies in percentage of total available renewable freshwater resources (including transboundary inflows) and in percentage of internal freshwater resources (precipitation minus evapotranspiration).
Water stress can be categorised as:
low (less than 10%): generally no major stress on the available resources
moderate (10-20%): water availability is becoming a constraint on development and significant investment is needed to provide adequate supplies
medium-high (20-40%): implies management of both supply and demand, and a need for conflicts among competing uses to be resolved.
high (more than 40%): indicates serious scarcity and usually shows unsustainable water use, which can become a limiting factor in social and economic development.
National water stress levels may hide important variations at subnational (e.g. river basin) level, particularly in countries with extensive arid and semi-arid regions.
These indicators can usefully be complemented with further information on water abstraction, e.g. the abstraction broken down by major use or industry according to the International Standard Industrial Classification (ISIC) (abstraction by water supply industry, households, agriculture, forestry and fishing, manufacturing, electric power industry, and other economic activities); intensity of water abstractions per capita, or water supply prices in selected cities. In the presentation and analysis of data a comprised categorisation may be used, depending on the quality of data, as well as on the policy question.
Box 15. Calculating GGI “Freshwater resources” based on SEIS dataflows
SEIS dataflows on Renewable freshwater resources (EI C1) and Freshwater abstraction (EI C2) correspond to the GGI Freshwater resources (7). Both EI C1 and GGI 7 require data on available renewable freshwater resources. The EI in particular refers to the methodology of data collection applied in the UNSD/UNEP Questionnaires on Environment Statistics while the OECD collects data via the OECD questionnaire on the state of the environment, a joint questionnaire with Eurostat for common member countries. The questionnaires are harmonized between OECD, UNSD, and other organizations (UN Water 2012) and the same data are required.

51
The available freshwater resources are to be provided in million cubic metres for the EI, from which the unit of measurement used for the GGI, cubic metres per capita, can easily be calculated.
Moreover, the "Water Exploitation Index (WEI)" included in the EI C2 is equal to the "Water stress index" contained in GGI 7. It is calculated as the share of freshwater abstracted in the available renewable freshwater resources and expressed as a percentage.
Table 9. Mapping of UNECE and OECD dataflows on water
Topic Indicator and dataflows Unit of measurement
SEIS dataflows Renewable freshwater resources (C1)
Renewable freshwater resources (Internal flow + Inflow of surface and groundwaters)
Million m3
GGI Freshwater resources (7)
Available renewable natural resources (Internal flow + Inflow of surface and groundwaters)
m3/capita
SEIS dataflows Freshwater abstraction (C2)
Water Exploitation Index (WEI): freshwater abstracted over available renewable freshwater resources
Percentage (Freshwater abstracted / Renewable freshwater resources )
GGI Freshwater resources (7)
Water stress (intensity of freshwater resource use): abstraction rates (national, territorial) of available renewable natural resources
Percentage (Freshwater abstracted / renewable freshwater resources )
Source: Extract from OECD et al. (2015).

52
Box 16. Trends in freshwater stocks and abstraction intensities in OECD countries
Most OECD countries increased their water abstractions over the 1970s in response to demand by the agricultural and energy sectors. In the 1980s, some countries stabilised their abstractions through more efficient irrigation techniques, the decline of water-intensive industries (e.g. mining, steel), increased use of more efficient technologies and reduced losses in pipe networks. Since the 1990s trends in water abstractions have been generally stable. In some countries this is due to increased use of alternative water sources, including water reuse and desalination. Trends since 2000 indicate a relative decoupling between water use and GDP growth in many OECD countries.
Water stress levels – the intensity of use of available resources – show a wide variation among and within countries. Most OECD countries face at least seasonal or local water quantity problems and several have extensive arid or semi-arid regions where water scarcity is a constraint to economic development. In about one-third of OECD countries, freshwater resources are under medium to high stress.
Figure 13. Freshwater stocks and abstraction intensities in OECD countries
Renewable freshwater resources
per capita*
Freshwater abstraction
per capita*
Water stress* % of renewable resources % of internal resources
1000 m3/capita m3/capita % % Water stress: <10%: low 10%-20%: medium-high >40% high
* Latest available year. Data prior to 2006 were not considered. OECD totals are estimated and exclude Chile and Ireland.
Source: OECD Environment Statistics (database); http://dx.doi.org/10.1787/888932925445.
0.0 50.0 100.0 150.
ISRKORCZEPOLBELITA
DEUESPGBRDNKFRALUXTURJPNMEXNLDGRCCHEPRTUSAESTAUTIRL
HUNSVKSVNAUSSWE
FINCHLNORCANNZLISL
530//
0 500 1000 1500
AUTCHLIRLISL
KORUSALUXSVKDNKGBRISR
CZESWECHEPOLDEUSVNFRAHUNBELAUSJPNNLDNORTURMEXESPGRCPRTITA
CANNZLFIN
EST
OECD
n.a.n.a.n.a.
n.a.n.a.
n.a.
0 10 20 30 40 50
AUTCHLIRLISL
KORUSALUXSVKDNKGBRISR
CZESWECHEPOLDEUSVNFRAHUNBELAUSJPNNLDNORTURMEXESPGRCPRTITA
CANNZLFIN
EST
n.a.n.a.n.a.
n.a.n.a.
n.a.
n.a.
0 10 20 30 40 50 60
AUTCHLIRLISL
KORUSALUXSVKDNKGBRISR
CZESWECHEPOLDEUSVNFRAHUNBELAUSJPNNLDNORTURMEXESPGRCPRTITA
CANNZLFIN
EST
73
72
103
n.a.n.a.n.a.
n.a.n.a.
n.a.

53
DATA SOURCES AND AVAILABILITY
For EaP countries data on renewable freshwater resources data are collected at selected hydrological stations and calculated on the basis of long-term measurements of levels, flow rates and inflows/outflows carried out on rivers and lakes as well as groundwater horizons and countrywide precipitation. In the UNSD Environmental Statistics database (Inland Water Resources)20 data on Precipitation, Internal flow, Inflow of surface and ground waters and on total renewable freshwater are published for all EaP countries. Aquastat also collects data on renewable freshwater resources21 but data may not be based on national submissions but on estimations by international experts.
Definitions and estimation methods may vary considerably by country and over time. More work is needed to improve the completeness and historical consistency of data on water abstraction, and the methods for estimating renewable water resources.
The World Bank gathers information on freshwater resources including renewable internal freshwater resources per capita and annual withdrawals by different sectors and covers EaP countries.
2.3.2 Renewable stocks – forest resources
POLICY CONTEXT
Forests are among the most diverse and widespread ecosystems on earth, and have many functions: they provide timber and other products; have cultural values; deliver recreation benefits and ecosystem services including regulation of soil, air and water; are reservoirs for biodiversity; and commonly act as carbon sinks.
The main concerns relate to the impact of human activities on forest diversity and health and on natural forest growth and regeneration, and to the consequences for the provision of economic, environmental and social forest services. Many forest resources are threatened by overexploitation, fragmentation, degradation of environmental quality and conversion to other types of land use. The main pressures from human activities include agriculture expansion, transport infrastructure development, unsustainable forestry, air pollution and intentional burning of forests.
Progress towards green growth can be assessed against national objectives and international principles on sustainable forest management adopted at UNCED in 1992 and reaffirmed at the WSSD in 2002. Other relevant international initiatives include the Ministerial Conferences for the Protection of Forests in Europe, which led to the Pan-European Criteria and Indicators for Sustainable Forest Management; the Montreal Process on Sustainable Development of Temperate and Boreal Forests; and the UN Forum on Forests.
DEFINITION AND CALCULATION OF INDICATORS
The area of forest land represents the share of total land area or square kilometres per capita.
For the calculation of the indicator area of forest land, relevant definitions established by FAO/UNECE for its Global FRA should be used. Forests are defined as land spanning more than 0.5 hectares with trees higher than 5 meters and a canopy cover of more than 10 %, or trees able to reach these thresholds in situ. It does not include land that is predominantly under agricultural or urban land use. Out of these areas classified as forest, areas which are which are natural or planted forest, areas designated for production, as well as areas designated for the protection of soil and water, ecosystem services and biodiversity can be distinguished.
20 http://unstats.un.org/unsd/environment/waterresources.htm 21 http://www.fao.org/nr/water/aquastat/water_res/index.stm

54
Forest resource stocks are measured as volume over bark of living trees more than X cm in diameter at breast height (or above buttress if these are higher). It is expressed in cubic metres, or related changes.
Includes stem from ground level or stump height up to a top diameter of Y cm, and may also include branches to a minimum diameter of W cm. The diameters used may vary by country; generally the data refer to diameters of more than 10 cm at breast height. The area of other wooded land may be provided as a complement.
Box 17. Calculating GGI “Forest resources” based on SEIS dataflows
The SEIS dataflows on Forests and other wooded land (EI D3) and the GGI Forest resources (8) contain dataflows on forest area and the area of wooded land to understand whether forests and wooded land are used in a sustainable way. Both indicators refer to the FAO/UNECE Global Forest Resource Assessments (FRA) for data collection. Therefore these dataflows are fully compatible.
In terms of the unit of measurement of forest areas both under the SEIS dataflows and the GGIs use square kilometres and measure the percentage of forest areas in the total land area. Also, the forest area per capita, which is part of the GGI and expressed as square kilometres per capita, can easily be calculated based on the units of the EI.
The GGI also contains data on volume of forest resource stocks and stock changes over time, which are not part of the EI, but are contained in the FRA.
Table 10. Mapping of UNECE and OECD dataflows on forest resources
Topic Indicator and dataflows Unit of measurement
SEIS dataflows Forests and other wooded land (D3)
Total forest area Total area of other wooded land
1000 km2 Percentage of total land area
GGI Forest resources (8) Area of forests land (and other wooded land) Volume of forests and stock changes
km2 per capita percentage of total land area
Source: Extract from OECD et al. (2015).

55
Box 18. Trends in forest land and volume of forest resource stocks in OECD countries
The global forest area is about 4 billion ha, which amounts to 30% of the total land area or an average of 0.6 ha per capita. OECD countries account for about one-fourth of the world’s forest area.
Over the past 50 years, the area of forests and wooded land has remained stable or slightly increased in most OECD countries, but fragmentation, degradation of environmental quality and conversion to other types of land use raise concerns. At world level, the area of forests has been decreasing, due in part to continued deforestation in tropical countries, often to provide land for agriculture, grazing and logging.
Figure 14. Forest land and growing stock
Forest land, 2011 Growing stock in forest land, 2010 as % of land area per capita m3/hectare
Source: FAOSTAT (database); OECD Environment Statistics (database); http://dx.doi.org/10.1787/888932925483
0 20 40 60 80
IcelandIsrael
NetherlandsIreland
United KingdomDenmark
TurkeyAustralia
ChileBelgiumHungary
FranceGreecePoland
SwitzerlandItaly
New ZealandGermany
MexicoUSA
NorwayLuxembourg
CanadaCzech Republic
SpainPortugal
Slovak RepublicAustriaEstonia
SloveniaKoreaJapan
SwedenFinland
%
0 20 40 60 80 100
km²/1000 inhabitants
0 250 500
IcelandIsrael
IrelandNetherlands
United KingdomDenmark
TurkeyAustralia
ChileHungaryBelgiumFranceGreecePoland
ItalySwitzerland
New ZealandGermany
NorwayUSA
MexicoLuxembourg
CanadaCzech Republic
SpainPortugal
Slovak RepublicAustriaEstonia
SloveniaKoreaJapan
SwedenFinland
Growing stockof which commercial species
56
DATA SOURCES AND AVAILABILITY
Data on the area of forests and wooded land are available all EaP countries with varying degrees of completeness. Data on forest resources and the intensity of their use can be derived from forest accounts and from the FAO/UNECE Global Forest Resource Assessments (FRA)22.
The World Bank gathers information on forest area, as a share of land area or square km for EaP countries23.
2.3.3 Renewable stocks – fish resources
POLICY CONTEXT
Fish resources play key roles for human food supply and aquatic ecosystems. In many countries fisheries make an important contribution to sustainable incomes and employment opportunities.
The main concerns relate to the impact of human activities on fish stocks and habitats in marine waters and freshwater, and to the consequences for biodiversity and for the fish supply for human consumption and other uses. Pressures on fish resources include fishing, coastal development and pollution loads from land-based sources, maritime transport, and maritime dumping. Many valuable fish stocks are fully exploited or overexploited. Natural variability and climate change have significant implications for the productivity and management of capture fisheries and aquaculture development.
Progress towards green growth can be assessed against domestic objectives and bilateral and multilateral agreements such as those on conservation and use of fish resources (Atlantic Ocean, Pacific Ocean, Baltic Sea, etc.), the Rome Consensus on world fisheries, the Code of Conduct for Responsible Fishing (FAO, November 1995) and the UN Convention on the Law of the Sea and its implementation agreement on straddling and highly migratory fish stocks. Within the framework of the FAO Code of Conduct for Responsible Fishing, efforts are being made to address the issue of illegal, unreported and unregulated (IUU) fishing.
DEFINITION AND CALCULATION OF INDICATORS
Fish resources within safe biological limits can be defined as the proportion of fish stocks exploited within their level of maximum biological productivity. It is expressed as the percentage of fish stocks exploited within their level of maximum biological productivity, i.e. underexploited, moderately exploited or fully exploited. Safe biological limits are the precautionary thresholds advocated by ICES. The stocks assessed are classified on the basis of various phases of fishery development: underexploited, moderately exploited, fully exploited, overexploited, depleted and recovering.
This indicator is designed for global and regional assessments, and is not well suited for country assessments. For monitoring fisheries management in countries, more specific indicators are needed. Therefore, for a country level assessment, this indicator may have to be adjusted or replaced, e.g. by indicators on fish production (from aquaculture and capture fisheries) and on fish supply for food.
Box 19. Trends in the state of world marine stocks
The trend towards increased global fish production since 1980 has been achieved partly through exploitation of new or less valuable species and partly through aquaculture. Illegal, unreported and unregulated (IUU) fishing remains
22 http://www.fao.org/forestry/fra/en/
23 http://data.worldbank.org/indicator/AG.LND.FRST.ZS

57
widespread and hinders the achievement of sustainable fishery management objectives.
Global production of marine capture fisheries peaked in 1996 at about 74 Mt and has since declined slightly, reaching about 68 Mt in 2011. The stabilisation of production from marine capture fisheries in recent years arises from a combination of greater exploitation of some stocks and declines in stock size and productivity in others.
In the European Union, 63% of fish stocks (for which the information is available) are being fished beyond maximum sustainable yields; these fish populations could generate higher economic output if they were subject to reduced fishing pressure. In addition 30% of these stocks are outside safe biological limits, meaning they have a high risk of depletion.
Figure 15. Global trends in the state of world marine stocks
Source: FAO (2012), The State of World Fisheries and Aquaculture.
DATA SOURCES AND AVAILABILITY
Data on the size of major fish populations exist but are scattered across national and international sources. At a global level, some information on the state of fish stocks is available from The State of World Fisheries and Aquaculture, published every two years by the FAO. For a large number of stocks, it is still not possible to determine the status. Assessments of internationally managed stocks are available from regional fisheries management organisations and from the International Council for the Exploration of the Sea (ICES). This indicator is also included in the Millennium Development Goal (MDG) monitoring framework (for more information on MDGs/SDGs please refer to Box 29).
2.3.4 Biodiversity and ecosystems – land resources
POLICY CONTEXT
Land and soil resources are essential components of the natural environment and of the natural asset base of the economy. They are both a private property and a global common; and are critical for the production of food and other biomass, the preservation of biological diversity and the productivity of ecosystems.
The way land is used and managed influences land cover and soil quality in terms of nutrient content and carbon storage, affects water and air quality, determines erosion risk, plays a role in flood protection and affects GHG emissions. Land’s economic value derives from food and other biomass production,
0
10
20
30
40
50
60
1974 1979 1984 1989 1994 1999 2004 2009
Non-fully exploited Fully exploited Overexploited
% of stocks assessed

58
mineral extraction and activities linked to built environment. From a social point of view, land acquires value through ownership and through cultural and traditional heritage. As land is a factor input into many economic activities, competing demands and conflicting uses may become constraints to both economic development and environmental protection. Competing demands and the main drivers behind land use conversions, include: agriculture and food production; forestry and biomass; urbanisation and infrastructure development; production of biofuels and non-food crops; other renewable energy production (hydroelectricity; windmills); mining and quarrying; water and flood management; and the protection of biodiversity and cultural landscapes. Land use is also increasingly influenced by global economic and environmental change (e.g. as a result of climate change mitigation and adaptation).
Progress towards green growth can be assessed against changes in land use and cover, conversions of land from its natural state to an artificial state and changes in the share of built-up areas. This delivers important messages about competing uses of land and pressures on biodiversity that may alter habitats.
DEFINITION AND CALCULATION OF INDICATORS
The proposed indicators on land resources (11) inform about land cover types, conversions and cover changes. Particular attention is given to:
changes from a “natural state” to an “artificial” or man-made state (or land take) and drivers of land take, i.e. the sectors responsible for cover changes from natural state to artificial state.
For the calculation of the indicator on drivers of land take, data on land take in ha/year should be provided for major sectors, including housing, services and recreation, industrial and commercial activities, transport and infrastructures, mines, quarries and dumpsites, as well as construction.
Indicators on land use and land-use changes complete the picture:
the state of land use, by category of uses (arable and permanent crop land, pastures, forest land, and other land);
Land use is characterised by the arrangements, activities and inputs that people undertake in a specific land cover type to produce, change or maintain it. Land use defined in this way establishes a link between land cover and the actions of people in their environment. A given land use may take place on one, or more than one, piece of land and several land uses may occur on the same piece of land. For the calculation of the indicator on the state of land use, the total area of a country can be distinguished by the following categories:
Arable and permanent crop land: (i) all land generally under rotation, whether for temporary crops or meadows, or left fallow (less than five years), and (ii) land under permanent crops, i.e. crops that occupy land for a long period and do not have to be planted for several years after each harvest.
Pastures: permanent grassland, i.e. land used for five years or more for herbaceous forage, either cultivated or growing wild.
Forest land: land of more than 0.5 ha with a canopy cover of more than 10 %, or trees able to reach these thresholds in situ. This excludes woodland or forest predominantly in agricultural or urban use and used only for recreation purposes.
Other land: built-up and related land, wet open land and dry open land, with or without vegetation cover. Areas under inland water bodies (rivers and lakes) are excluded.

59
land-use changes relate to the change over time of the distribution of land uses within a country. The unit of observation is the proportion of each category of land use changed to another land use over a given period.
Box 20. Calculating GGI “Land resources” based on SEIS dataflows
SEIS dataflows on Land uptake (EI E1) can be used to produce the dataflows on drivers of land take that are part of the GGI on land resources (11)
In terms of EI E1, dataflows on total land uptake broken down by sectors, as well as dataflows on total land uptake broken down by country area, are collected. For the dataflow the following drivers are distinguished: mining and quarrying areas, constructions, manufacturing areas, technical infrastructure, transport and storage infrastructure, commercial, financial and public services, residential areas including recreational facilities and other uses (landfills, waste dumps, tailing pits and refuse heaps). For the GGI different sectors are suggested (housing, services and recreation, industrial and commercial activities, transport and infrastructures, mines, quarries and dumpsites, as well as construction), but the sectors are overlapping and the selection may depend on data availability.
Data on EI E1 are given in thousands of square kilometres. Additionally, the share of total land uptake in the country area is calculated as percentage. For GGI 11 changes in land use are calculated in hectares and square kilometres. Furthermore natural areas lost for urban development are provided as percentage. Therefore EI E1 is compatible with GGI 11 pertaining to units of measurement.
Data on the state of land use by category of uses and on land-use changes are not part of the SEIS dataflows.
Table 11. Mapping of UNECE and OECD dataflows on land resources
Topic Indicator and dataflows Unit of measurement
SEIS dataflows
Land uptake (E1) Total land uptake (broken down by sectors) Total land uptake (broken down by country area)
1000 km2
GGI
Land resources: land cover conversions and cover changes from natural state to artificial state (11)
Land take and related drivers Land use, by category of uses Land use changes
Hectare; km2
Source: Extract from OECD et al. (2015).

Biodive
PermaOECD counarea of othestable.
Source: FAO,
DATA SOU
Data oEaP countr
Time data on forUNSD Envforest area
Howebuilding a
24 http://www.e25 http://faostat326 http://data.wo27 http://unstats
ersity-rich natu
The arecountrieland use
There hdeclininsignifica
anent pasture, tries; it has mr types of sem
FAOSTAT (dat
URCES AN
on land take ries yet.
series data orest areas) arvironmental as a share of
ever, many coland cadastr
eea.europa.eu/dat3.fao.org/faostat-orldbank.org/indis.un.org/unsd/env
Box
ural and semi-
ea of forests anes, but fragmee raise concer
has been a netg. Wetlands a
ance.
which represeainly been con
mi-natural agric
OECD an
OECD
tabase); http://d
D AVAILAB
are calculate
on land use re published Indicators27.f land area fo
ountries havere, which are
a-and-maps/indic-gateway/go/to/doicator
vironment/Time s
21. Trends in
-natural areas
nd wooded lanntation, degrarns.
t loss of wetlaare highly valu
ents a major snverted to forecultural habita
Figure 16
nd BRIICS cou
dx.doi.org/10.17
BILITY
ed by the EE
(including thfor EaP cou The World
or all EaP cou
e their own ce not compli
cators/land-take-2ownload/E/EL/E
eries.htm#
60
n land use in
s have continu
nd has remainadation of env
nds to agricultued habitats fo
share of agricuest or, in someats (farm wood
6. Land-use
untries, rest o
BRIICS
787/8889329255
EA based on
he total area untries by FA
Bank gatheruntries up to
classificationant with inte
2
OECD count
uously declined
ned stable or sironmental qu
tural use, althor biodiversity
ultural semi-nae countries, ardland and fallo
changes
f the world, 19
559.
satellite ima
of agricultuAOSTAT25, trs informatio
o 2013.
ns on land typernational sta
tries
d in OECD co
slightly increasality and conv
ough the rate and their loss
atural habitatsrable and permow land) has in
990-2011
Rest of world
ges24. Howev
ural land andhe World Ba
on on agricul
pes and theirandards. In m
ountries.
sed in most Oversion to othe
of loss has bes is of internati
s, has declinedmanent croplancreased or re
d
ver, this doe
d arable landank26 and asltural land, a
r own methomost countri
OECD er types of
een onal
d most and. The emained
es not cover
d as well as part of the
arable land,
odologies in ies the data

61
are collected from land agencies. Further work is needed to harmonise classifications and definitions and more needs to be done to exploit satellite images to monitor changes in land cover.
2.3.5 Biodiversity and ecosystems – wildlife resources
POLICY CONTEXT
Biological resources provide the raw materials of production and growth in many sectors of the economy. They are essential elements of ecosystems and of natural capital and their diversity plays an essential role in maintaining life-support systems and quality of life.
Conservation of biodiversity is a key concern nationally and globally. Pressures on biodiversity from human activities can be physical (e.g. habitat alteration and fragmentation through changes in land use and land cover), chemical (toxic contamination, acidification, oil spill, other pollution from human activities) or biological (e.g. alteration of population dynamics and species structure through the release of exotic species or commercial use of wildlife resources). The primary drivers are land use changes for conversion from natural state to agriculture and infrastructure, unsustainable use of natural resources, invasive alien species, climate change and pollution.
Progress towards green growth can be assessed against domestic objectives and international agreements such as the Convention on Biological Diversity (CBD, 1992), the Convention on International Trade in Endangered Species of Wild Fauna and Flora (CITES, Washington, 1973) and the Convention on Wetlands of International Importance (Ramsar, 1971).
DEFINITION AND CALCULATION OF INDICATORS
The number of threatened species compared to the number of known or assessed species.
For the calculation of the indicator on Threatened species, critically endangered, endangered, and vulnerable species, i.e. those plants and animals that are in danger of extinction or soon likely to be, should be taken into account (IUCN 2001). For the presentation and analysis of data certain categories of species may be selected. In OECD (2014a), data cover mammals, birds, and vascular plants, while other major groups (e.g. fish, reptiles, amphibians, invertebrates, fungi) are not covered.
Trends in species abundance shows the trends in the abundance of selected species over time.
OECD (2014a) uses bird populations (farmland or forest bird populations or breeding bird populations). Depending on data availability and national importance other species may be used.
Box 22. Calculating GGI “Wildlife resources” based on SEIS dataflows
SEIS dataflows on Threatened and protected species (EI D4) and Trends in the number and distribution of selected species (EI D5) contain information that can be used to produce the GGI Wildlife resources (13).
Both EI D4 and GGI 13 require dataflows on threatened species. The dataflows necessary for the production of both indicators are based on the IUCN lists of threatened species. Therefore, those dataflows are fully compatible. However, for the presentation and analysis of data certain categories of species may be selected. As units of measurement the percentage of species threatened of species assessed or known is used for both indicators.
Complementary to the dataflows on threatened species, data on the abundance of selected species are contained in both EI Trends in the number and distribution of selected species (D5) and GGI Wildlife resources (13). For the EI two species each from the categories “Keystone species”, “Flagship species”, “Endemic species” and “Other characteristic species” should be selected as proxies and data on the number of individuals should be provided. OECD uses a similar approach by selecting certain species under its indicator 13. OECD (2014a) uses bird populations (farmland or forest bird populations or breeding bird populations) as a proxy to measure the state of wildlife in a country. As those may be selected as characteristic species for a country for the EI, both indicators are compatible. The number of individuals of the respective species is used as units of measurement for the SEIS dataflows and the

62
GGIs.
Table 12. Mapping of UNECE and OECD dataflows on wildlife resources
Topic Indicator and dataflows Unit of measurement
SEIS dataflows
Threatened and protected species (D4)
Number and percentage of species threatened (mammals, birds, fishes, reptiles, amphibians, invertebrates, vascular plants, mosses, lichens, fungi, algae)
Number of species threatened Percentage of species threatened
GGI Wildlife resources (13) Species threat status: mammals, birds, fish, vascular plants in percentage of species assessed or known
Percentage of species threatened
SEIS dataflows
Trends in the number and distribution of selected species (D5)
Number of selected species — Keystone species, Flagship species Endemic species, Other species — characteristic species for country
Thousands of individuals
GGI Wildlife resources (13) Trends in species abundance (e.g. farmland or forest bird populations or in breeding bird populations)
Number of individuals
Source: Extract from OECD et al. (2015).

63
Box 23. Threatened species in OECD countries
While protected areas have grown in most OECD countries, pressures on biodiversity and threats to global ecosystems and their species are also increasing. The targets agreed in 2002 by parties to the CBD to “significantly reduce the rate of biodiversity loss” by 2010 were not met, at least not at global level. Parties to the CBD have defined a new set of 20 targets for 2020 that can be measured with related indicators28.Diversity of genes, species and ecosystems continues to decline as pressures on biodiversity remain constant or increase in intensity, mainly as a result of human actions. Scientific consensus projects a continuing loss of habitats and high rates of extinction throughout the century if current trends persist.
In most OECD countries, the number of animal and plant species identified as endangered is increasing. Many species are threatened by habitat alteration or loss, both within and outside protected areas (e.g. on farms and in forests). Threat levels are particularly high in countries with high population density and a high concentration of human activities.
Figure 17. Threatened species
OECD countries, latest available year, in % of species known or assessed
Mammals Birds Vascular plants
Source: OECD Environment Statistics (database) http://dx.doi.org/10.1787/888932925597
28 https://www.cbd.int/sp/targets/default.shtml
0 20 40 60 80 100
USAGBRTURCHESWEESPSVNSVKPRTPOLNORNZLNLDMEXLUXKORJPNITAISRIRLISL
HUNGRCDEUFRAFIN
ESTDNKCZECHLCANBELAUTAUS
0 20 40 60 80 100
USAGBRTURCHESWEESPSVNSVKPRTPOLNORNZLNLDMEXLUXKORJPNITAISRIRLISL
HUNGRCDEUFRAFIN
ESTDNKCZECHLCANBELAUTAUS
% of indigenous species % of species known0 20 40 60 80 100
USAGBRTURCHESWEESPSVNSVKPRTPOLNORNZLNLDMEXLUXKORJPNITAISRIRLISL
HUNGRCDEUFRAFIN
ESTDNKCZECHLCANBELAUTAUS

64
DATA SOURCES AND AVAILABILITY
For many years, the International Union for the Conservation of Nature (IUCN) has been monitoring the extent and pace of biodiversity degradation by assigning species to categories of threat through detailed assessments of information against a set of quantitative criteria. The IUCN Red List of Threatened Species29 is regularly updated and contains country level data on threatened species (totals by taxonomic group30, and by Red List Category31) for all EaP countries. In the majority of countries information on threatened species is collected in “red books”, which include data on the abundance and state of rare and/or protected species of wild fauna and flora and conservation measures.
The World Bank provides information on threatened bird, mammals and plants species for year 2015 for EaP countries. Threatened species are the number of species classified by the IUCN as endangered, vulnerable, rare, indeterminate, out of danger, or insufficiently known.
Furthermore, all EaP countries are Parties to the Convention on Biological Diversity (CBD) and are regularly submitting national reports to the CBD that contain data on endangered species32. However, the definitions that should follow IUCN standards are applied with varying degrees of rigour in countries. Historical data are generally not comparable or are not available.
2.4 The environmental quality of life
Environmental outcomes are important determinants of human health and well-being. They demonstrate that production and income growth may not always be accompanied by a rise in well-being. Degraded environmental quality can result from and cause unsustainable development patterns. It can have substantial economic and social consequences, from health costs and lower labour productivity to reduced agricultural output, impaired ecosystem functions and a generally lower quality of life.
Environmental conditions affect the quality of people’s life in various ways. They affect human health through air and water pollution and exposure to hazardous substances and noise, as well as through indirect effects from climate change, transformations in water cycles, biodiversity loss and natural disasters that affect the health of ecosystems and damage people’s property and life. People also benefit from environmental services, such as access to clean water and nature, and their choices are influenced by environmental amenities.
The main aspects of importance to green growth include:
Human exposure to pollution and environmental risks, the associated effects on human health and on quality of life, and the related health costs and impacts on human capital.
Public access to environmental services and amenities, or the level and type of access various groups have to environmental services such as clean water, sanitation, green spaces and public transport.
Indicators on exposure to natural or industrial risks and related economic losses are not yet fully measurable and require further specification. They are not further discussed here.
29 http://www.iucnredlist.org/about/summary-statistics#Tables_5_6 30 http://cmsdocs.s3.amazonaws.com/summarystats/2014_2_Summary_StatsPage_Documents/2014_2_RL_Stats_Table5.pdf 31 http://cmsdocs.s3.amazonaws.com/summarystats/2014_2_Summary_StatsPage_Documents/2014_2_RL_Stats_Table6a.pdf 32 http://www.cbd.int/reports/map

65
Table 13. The environmental qualitiy of life - proposed indicators
Proposed indicators
Theme Proposed indicators Type Measurability
Environmental health and risks
Environmentally induced health problems & related costs M L (e.g. years of healthy life lost from degraded environmental conditions)
Population exposure to air pollution P S/M
Exposure to natural or industrial risks and related economic losses M L
Environmental services and amenities
Access to sewage treatment and drinking water M Population connected to sewage treatment (at least secondary, in relation to optimal connection rate)
S/M
Population with sustainable access to safe drinking water S/M Type: M = Main indicators
P = Proxy indicators when the main indicators are not available
Measurability (M): S = short term, M = medium term, L = long term
See Annex for a complete list of indicators.
Source: Extract from OECD (2014a).
2.4.1 Environmental health and risks – air quality
POLICY CONTEXT
Atmospheric pollutants from energy transformation, energy consumption and industrial processes are the main contributors to regional and local air pollution. Degraded air quality can have substantial economic and social consequences, from health costs, reduced labour productivity and building restoration needs to reduced agricultural output, forest damage and a generally lower quality of life.
Major concerns relate to effects on human health and ecosystems. Human exposure is particularly high in urban areas, where economic activities are concentrated. Some population groups, notably the very young and very old, are especially vulnerable. Causes of growing concern are concentrations of fine particulates, NO2, toxic air pollutants and acute ground-level ozone episodes in both urban and rural areas.
Progress towards green growth can be assessed against domestic objectives and international commitments regarding air emissions and quality, and against changes in the number of people exposed to certain levels of air pollution, with particular attention to vulnerable groups (children, the elderly). Progress can also be assessed against health costs induced by degraded air quality and the impact on labour productivity and human capital.
DEFINITION AND CALCULATION OF INDICATORS
The proposed indicators on environmentally induced health problems and related costs (14) were selected to measure the influence of environmental degradation as well as pollution on human health, well-being and human capital. One important dimension of this is the population exposure to air pollution. The indicator informs about:
exposure to fine particulates (PM2.5): Estimates of the share of the population exposed to various PM2.5 levels, derived from satellite-based measurements.

66
exposure to small particulates (PM10): Urban-population weighted PM10 levels in residential areas of cities with more than 100 000 residents. It represents the average annual exposure level of an average urban resident to outdoor particulates;
The major components of particulate matter (PM2.5 and PM10) are sulfate, nitrates, ammonia, sodium chloride, black carbon, mineral dust and water. It consists of a complex mixture of solid and liquid particles of organic and inorganic substances suspended in the air. Small particulates are suspended particulates of less than 10 µm in diameter (PM10), fine particulates are particulates smaller than 2.5 microns in diameter (PM2.5).
Air quality measurements are typically reported in terms of daily or annual mean concentrations of particles per cubic meter of air volume (m3), and routinely expressed in terms of micrograms per cubic meter (μg/m3).
Information on the indicator on fine particulates may be derived from satellite-based measurement of PM2.5. The population exposure to air pollution is calculated by taking the weighted average value of PM2.5 for the grid cells present in each region with the weight given by the estimated population count in each cell. Current World Health Organisation (WHO) air quality guidelines are annual mean concentrations of 10 micrograms per cubic meter for particulate matter less than 2.5. microns in diameter.
The indicator on small particulates should show urban-population weighted PM10 levels in residential areas of cities with more than 100,000 residents. Estimates should represent the average annual exposure level of the average urban resident to outdoor particulate matter. Current WHO air quality guidelines are annual mean concentrations of 20 micrograms per cubic meter for particulate matter less than 10 microns in diameter.
If data from satellite-based measurement is not available, the indicator could be calculated based on ground-based measurements according to the methodology proposed by UNECE33.
Exposure to ground-level ozone (O3): Estimates of O3 levels in selected cities.
Ozone at ground level (O3) – not to be confused with the ozone layer in the upper atmosphere – is one of the major constituents of photochemical smog. It is formed by the reaction with sunlight (photochemical reaction) of pollutants such as nitrogen oxides (NOx) from vehicle and industry emissions and volatile organic compounds (VOCs) emitted by vehicles, solvents and industry.
The indicator on ground-level ozone (O3) shows the population weighted concentration of ozone to which the urban population in Europe is potentially exposed. It refers to the annual sum of daily maximum 8-hour mean concentrations above a threshold (70 microgram ozone per m3 or 35 parts per billion) at urban background stations in agglomerations and calculated for all days in a year. Current WHO air quality guidelines for ozone are 8-hour mean concentrations of 100 micrograms per cubic meter. For data collection ground-based measurement is applied.
Box 24. Calculating GGI “Population exposure to air pollution” based on SEIS dataflows
SEIS dataflows on Ambient air quality in urban areas (EI A2) can contribute to producing GGI Environmentally induced health problems & related costs (14). Both indicators require data on particulate matter (PM 2.5 and PM10) and ground-level ozone (O3) expressed as annual average concentrations. EI A2 measures concentrations for the capital city and other major cities and the number of days with exceeded daily limit value. GGI 14 measures the average annual exposure level of an average urban resident to outdoor particulates (PM2.5 and PM10 levels in residential areas of cities with more than 100,000 residents). It further measures a
33 http://www.unece.org/fileadmin/DAM/env/europe/monitoring/Indicators/A-2-en-final.pdf

67
weighted annual sum of maximum daily 8-hour mean ozone concentrations above the threshold (μg/m3 per day) and is calculated for all days in a year. For data collection on O3 ground-based measurement is applied, whereas - depending on the unit chosen - ground-based monitoring or satellite-based-measurements for PM2.5 PM10 are used. As there are differences between both GGI and EI in terms of data collection, raw data are not fully compatible for PM2.5 and PM10. At the same time, data evaluation may lead to similar conclusions.
While the GGI 14 is designed to reflect to the average human exposure level to the pollutants, the EI A2 focusses on annual average concentrations and daily values of PM10 and O3. Furthermore EI A2 strongly focuses on concentrations of PM10 and O3 in agglomerations and exceeding daily limit values to get an overview of the general exposure of the country’s urban population, whereas the GGI 14 focuses on aspects with regard to population weighted concentrations.
Table 14. Mapping of UNECE and OECD dataflows on air pollution and ozone depletion
Topic Indicator and dataflows Unit of measurement
SEIS dataflows
Ambient Air quality in urban areas (A2)
Annual average concentration of particulate matter (PM10) PM10 - Number of days with exceeded daily limit value Annual average concentration of ground-level ozone (O3) O3 - Number of days with exceeded daily limit value
μg/m3 Number of days
GGI
Environmentally induced health problems & related costs (14)
Urban-population weighted PM2.5 and PM10 levels in residential areas of cities (>100 000) Population weighted concentration of ozone to which the urban population is potentially exposed
Percentage of population; μg/m3 μg/m3 per day
Source: Extract from OECD et al. (2015).
Box 25. Trends in air quality in OECD countries
Over the past two decades, urban air quality in OECD countries has continued to improve slowly with respect to sulphur dioxide (SO2) concentrations, and the estimated average annual exposure level of an average urban resident to PM10 has been decreasing. This progress is due to, among other factors, switching from coal to natural gas for electricity generation and improvement in the performance of pollution abatement equipment at industrial facilities, which has reduced PM10 emissions.
But acute ground-level ozone pollution episodes in both urban and rural areas, NO2 concentrations, PM2.5 and toxic air pollutants have often exceeded recommended limits and are of growing concern. These exceedances are largely due to the concentration of pollution sources in urban areas and to increasing use of private vehicles for urban trips. Exposure to ambient ozone concentrations increased in the EU between 2000 and 2011 by 1.7% per year on average, with considerable temporal and spatial variation across cities.
Figure 18. Population exposed to air pollution by fine particulates (PM2.5), by WHO thresholds
OECD and BRIICS countries, 2001-06 average, share of population
Source: OECD (2011), Regions at a Glance 2011; http://dx.doi.org/10.1787/888932925635.
0%
20%
40%
60%
80%
100%
BEL
CZE
DEU
HUN
LUX
NLD
SVN
CHE
ISR
SVK
POL
KOR
GRC AU
T
DNK
TUR
GBR FR
A
JPN
ITA
ESP
MEX PR
T
USA
CHL
CAN
IRL
SWE
AUS
NOR
EST
FIN
ISL
NZL
BRA
RUS
ZAF
IND
CHN
No data >35 ug/m3 25 to 35 ug/m3 15 to 25 ug/m3 10 to 15 ug/m3 <10 ug/m3

68
Figure 19. Population exposed to air pollution by ozone
selected European countries, 2000 and 2011
Notes: Population exposure to pollution by ozone: weighted yearly sum of maximum daily 8-hour mean ozone concentrations above a threshold (70 micrograms per m3) at urban background stations in agglomerations. Based on EEA calculations.
Source: European Environment Agency; Eurostat, Sustainable Development Indicators (database); http://dx.doi.org/10.1787/888932925673.
DATA SOURCES AND AVAILABILITY
Data on population exposure to air pollution are scattered. Internationally comparable measures can be derived from satellite-based measurements. These can be less precise than ground-based measurements, but have the advantage of being available for the large areas of the globe that still lack air monitoring stations. They measure PM2.5 originating from both natural and human sources. Country aggregates of urban-population-weighted PM10 concentrations are available from the World Bank34 for all EaP countries. They are annual means that may deviate from actual daily and seasonal data. The data come either from primary sources or from municipal monitoring stations. Monitoring techniques, sampling frequencies and the location of monitoring stations vary by country and over time.
At the same time, data from national ground-based measurements of PM2.5, PM10 and O3 are available for all EaP countries, following the standards of the UNECE environmental indicators35. For the ground-based measurement, dataflows are collected from an air quality-monitoring network incorporating fixed manual or automated monitoring stations, which may be complemented by mobile stations.
Moreover, the Global Burden of Disease (GBD) study thoroughly covers a number of issues related to environmentally induced health problems. Country profiles for all EaP countries are available at the website of the Institute for Health Metrics and Evaluation (IHME)36.
The World Bank gathers information on air pollution in EaP countries up to 2013, including on PM2.5 (as mean annual exposure or as share of the population exposed to levels exceeding WHO guideline value).
34 http://data.worldbank.org/indicator/ 35 http://www.unece.org/index.php?id=38894 36 http://www.healthdata.org/results/country-profiles
0
2000
4000
6000
8000
10000
NOR
IRL
UKD
LUX
NLD
FIN
EST
SWE
BEL
DNK
DEU
POL
PRT
CZE
FRA
ESP
CHE
AUT
HUN
SLO
ITA
SVK
GRC
EU27
2011
2000
Weighted annual sum of maximum daily 8-hour mean ozone concentrations above a threshold (70μg/m3 per day)(microgram/m3 day)

69
2.4.2 Environmental services and amenities - access to sewage treatment and drinking water
POLICY CONTEXT
Water quality, which is closely linked to water quantity, is of economic, environmental and social importance. It has many aspects (physical, chemical, microbial, biological), and can be defined in terms of a water body's suitability for various uses, such as drinking water supply, swimming and protection of aquatic life. If pressure from human activities becomes so intense that water quality is impaired to the point that drinking water requires ever more advanced and costly treatment, or that aquatic plant and animal species in rivers and lakes are greatly reduced, then the sustainability of water resource use is in question. Poor quality water affects people’s health and well-being, and can be a cost factor for economic activities.
Progress towards green growth can be assessed against domestic objectives and international commitments. It can also be assessed against changes in the share of the population that has access to safe drinking water and appropriate sanitation and sewage treatment services, and changes in the health status of the population.
Box 26. The Sustainable Development Goals
The Sustainable Development Goals (SDGs) were agreed on 25 September 2015 at a summit of world leaders in New York. The 17 goals, encompassing 169 targets, provide an agenda for: ending extreme poverty, ensuring environmental sustainability and achieving well-being for all. They are universal, and will apply equally to OECD members and to other countries. The SDGs replace the Millennium Development Goals (MDGs), which in September 2000 rallied the world around a common 15-year agenda to tackle the indignity of poverty.
Countries will be responsible for setting national targets that are consistent with the overall ambitions of the goals, and for monitoring progress through indicators. The international community, including the OECD, will need to adapt its work to support countries in implementing the SDGs.
An Inter-agency Expert Group on SDG Indicators (IAEG-SDGs) was established with the task to develop an indicator framework for the goals and targets of the post-2015 development agenda at the global level, and to support its implementation. It is expected that an agreement on an indicator framework will be reached in the course of 2016.
Monitoring progress in terms of the SDGs requires reliable, timely and comparable data from both traditional and new sources, regular updates, and continuity in measurement. Countries will need to improve their statistical capacity and monitoring systems, at a time when many also have to cope with economic challenges and tight budgets. The SDGs provide a good opportunity for strengthening their efforts to advance the measurement agenda for green growth and for environmental indicators.
Several of the proposed indicators currently under discussion are the same as or similar to those produced and used by the OECD. These include indicators on development aid and education, as well as a few environmental and green growth indicators, and agri-environmental indicators.
It is recommended that the respective indicators listed in this document that have so far been measured in accordance with the MDGs, if selected for the national set of GGIs, are defined and measured according the SDG indicator framework developed by the IAEG-SDGs. Once the list of global SDG indicators has been adopted at UN level, a detailed mapping and comparison of indicators will be carried out by OECD.
DEFINITION AND CALCULATION OF INDICATORS
Public access to sewage treatment services (16.1) shows the percentage of the national resident population that is connected to a wastewater treatment plant and to sewerage.
The indicator reflects the level of service provided to the inhabitants. Individual private treatment facilities such as septic tanks are not covered. Ideally data should be related to an estimated optimal connection rate taking into account economic and environmental aspects.
The extent of secondary (biological) and/or tertiary (chemical) treatment provides an indication of efforts to reduce pollution loads. Primary treatment refers to a physical and/or chemical process involving settlement of suspended solids, or other process in which the BOD5 (the amount of dissolved oxygen consumed in five days by biological processes breaking down organic matter) of the incoming wastewater

70
is reduced by at least 20% before discharge and the total suspended solids are reduced by at least 50%. Secondary treatment refers to a process generally involving biological treatment with a secondary settlement or other process, resulting in reductions in biochemical oxygen demand of at least 70% and chemical oxygen demand of at least 75%. Tertiary treatment refers to treatment of nitrogen and/or phosphorus and/or any other pollutant affecting the quality or a specific use of water: microbiological pollution, colour, etc.
Population with sustainable access to safe drinking water (16.2), as measured by the Millennium Development Goals (MDG) and the Sustainable Development Goals (SDG) indicators (Box 26);
The GGI on Population with sustainable access to safe drinking water is defined according to the MDGs. In the MDGs “access to safe drinking water” is defined as the proportion of people using improved drinking water sources: household connection; public standpipe; borehole; protected dug well; protected spring; rainwater. The MDG on water was reaffirmed in the SDG goal 6 “Ensure access to water and sanitation for all”.
Public access to basic sanitation, expressed as the percentage of the national resident population that has access to improved sanitation facilities, as measured by the MDGs.
The indicator Public access to basic sanitation relates to population with access to facilities that hygienically separate human excreta from human waste. Improved facilities include flush/pour-flush toilets or latrines connected to a sewer, septic tank or septic pit, ventilated improved pit latrines, pit latrines with a slab or platform of any material which covers the pit entirely, except for the drop hole, and composting toilets/latrines.
Box 27. Calculating GGI “Access to sewage treatment and drinking water” based on SEIS dataflows
Population connected to sewage treatment services
Both SEIS dataflows on the Population connected to wastewater treatment (EI C14) and the GGI Population connected to sewage treatment (16.1) show the degree of a country’s population connected to facilities for the physical and/or chemical reduction of biochemical oxygen demand (BOD) and suspended solids in wastewaters. Both dataflows are to be categorised in primary, secondary, and tertiary treatment. The data on the share of the population not connected to a sewerage network, which are required by the GGI, can be easily calculated based on UNECE dataflows by abstracting the population connected to a wastewater collecting system from the total population of a given country.
The same units of measurement are used for the EI and GGI: total numbers of the population connected are to be provided in millions, and the shares of the population connected in the total population are expressed as a percentage.
Population with sustainable access to safe drinking water
SEIS dataflows on Drinking water quality (EI C9) is partially suitable to produce the GGI Population with sustainable access to safe drinking water (16.2). For the EI C9, the population connected to the water supply industry, and the population using untreated surface water and groundwater is measured. The respective data should be estimated based on numbers from the water supply industry and from national public authorities. At the same time, the OECD defines its GGI 16.2 according to the Millennium Development Goals (MDGs). To this end, the categorisation of drinking water sources is more detailed in the GGI 16.2 than in the EI C9. For both indicators, the same units of measurement are to be used: the population connected to different sources of drinking water is expressed in millions of people or as a percentage of the total population.
Table 15. Mapping of UNECE and OECD dataflows on sewage treatment and drinking water

71
Topic Indicator and dataflows Unit of measurement
SEIS dataflows
Population connected to wastewater treatment (C14)
Population connected to wastewater treatment facilities (by categories: primary, secondary, tertiary treatment) Population connected to a wastewater collecting system
Million Percentage of total population
GGI Population connected to sewage treatment (16.1)
Population connected to sewage treatment plants (by level of treatment: primary, secondary, tertiary treatment)
Percentage of total population
SEIS dataflows
Drinking water quality (C9)
Population connected to water supply industry Population using untreated surface water Population using untreated groundwater
Million Percentage of total population
GGI
Population with sustainable access to safe drinking water (16.2)
Population with sustainable access to safe drinking water - proportion of people using household connection; public standpipe; borehole; protected dug well; protected spring; rainwater.
Percentage of total population
Source: Extract from OECD et al. (2015).
Box 28. Trends in access to sewage treatment in OECD countries
OECD countries have progressed with basic domestic water pollution abatement: the share of the population connected to a municipal waste water treatment plant rose from about 60% in the early 1990s to over 75% today. Due to varying settlement patterns, economic and environmental conditions, starting dates, and the rate at which the work was done, the share of population connected to waste water treatment plants and the level of treatment vary significantly among OECD countries. Some countries have reached the economic limit in terms of sewerage connection and must find other ways of serving small, isolated settlements.
Figure 20. Population of OECD countries connected to a wastewater treatment plant
2011 or latest year available
Source: UN Water, Key Water Indicators (database); OECD (2014a), http://dx.doi.org/10.1787/888932925692
0
20
40
60
80
100
NLD
CH
EG
BRD
EU AUT
ESP
LUX
ISR
KOR
GR
CD
NK
SWE
FIN
EST
CZE JP
NBE
LU
SA IRL
HU
NC
AN CH
LPO
LPR
TN
OR
SVN
TUR
ISL
NZL ITA
SVK
MEX
AUS
FRA
partial data
N.A.
% Legend: National population
Not connected to a sewerage network
Connected to a sewerage network without treatment
- with secondary or tertiary treatment
(includingindependent treatment)
Connected to a STP:
Connected to a sewerage network
Connected to a sewage treatment plant (STP)
- with primary treatment only

72
DATA SOURCES AND AVAILABILITY
Data on the share of the population connected to sewage treatment plants are available for all EaP countries in the UNSD database37, though the data are not always up to date and information on the level of treatment remains partial.
At the same time, the EaP countries monitor drinking water quality regularly. However, the number of samples of drinking water taken varies considerably between the countries. The WHO/United Nations Children’s Fund (UNICEF) Joint Monitoring Programme (JMP) for Water Supply and Sanitation38 publishes current estimates on the share of population using different sources of drinking water and on the percentage of the national population with access to improved sanitation facilities all EaP countries.
2.5 Economic opportunities and policy responses
Governments play a key role in fostering green growth by creating conditions that stimulate greener production and consumption through economic and other policy instruments, by encouraging co-operation and sharing of good practices among enterprises, by developing and promoting use of new technology and innovation, and by increasing policy coherence. The main challenge is to harness environmental protection as a source of growth, international competitiveness, trade and jobs.
Businesses have an important role in adopting greener management approaches and new business models, developing and using new technologies, carrying out research and development (R&D) and spurring innovation. Business, government and civil society also contribute by giving consumers with the information needed to make purchasing choices that reduce the environmental impact of consumption.
The main issues of importance to green growth dealt within this section are:
Technology and innovation, which are important drivers of growth and productivity in general, and of green growth in particular. They are important for managing natural resources and raw materials and minimising the pollution burden. Innovation can spur new markets, contribute to job creation, support shifts towards new management methods and facilitate the adoption of co-operative approaches and the diffusion of knowledge.
Production of environmental goods and services, which are an important aspect of the economic opportunities that arise in a greener economy.
International financial flows to facilitate uptake and dissemination of technology and knowledge, foster cross-country exchange of knowledge and contribute to meeting development and environmental objectives.
Prices, taxes and transfers, which provide important signals to producers and consumers. They serve as tools to internalise externalities and influence market participants to adopt more environment-friendly behaviour patterns.
Ideally, these indicators should be complemented by indicators on regulation and training and skill development. However, data availability and comparability of regulatory measures across countries hamper the construction of such indicators. Those indicators will yet have to be developed in the future. Moreover, the set contains indicators on International financial flows, which would have to be reformulated to be relevant to national contexts in EaP countries.
37 http://unstats.un.org/unsd/ENVIRONMENT/wastewater.htm 38 http://www.wssinfo.org/documents/?tx_displaycontroller[type]=country_files

73
Table 16. Economic opportunities and policy responses - proposed indicators
Proposed indicators
Theme Proposed indicators Type Measurability
Technology and innovation Research and development (R&D) expenditure of importance to green growth
M M
- Renewable energy sources (% of energy-related R&D) S - Environmental technology (% of total R&D, by type) S - All-purpose business R&D (% of total R&D) S
Patents of importance to green growth (% of country applications under the Patent Cooperation Treaty)
M S/M
- Environment-related and all-purpose patents S/M - Structure of environment-related patents S/M Environment-related innovation in all sectors M M
Environmental goods and services
Production of environmental goods and services (EGS) M M Gross value added in the EGS sector (% of GDP) M Employment in the EGS sector (% of total employment) M
International financial flows International financial flows of importance to green growth % of total flows and % of GNI
M L
Official development assistance S Carbon market financing S Foreign direct investment L
Prices and transfers Environmentally related taxation - Level of environmentally related tax revenue (% of total tax revenues and in relation to labour-related taxes)
M S/M
- Structure of environmentally related taxes (by type of tax base)
S/M
Energy pricing (share of taxes in end-use prices)
M S
Water pricing and cost recovery (tbd) M S/M To be complemented with indicators on: Environmentally related subsidies M/L Environmentally related expenditure: level and structure L
Regulations and management approaches
Indicators to be developed ..
Training and skill development Indicators to be developed .. Type: M = Main indicators
P = Proxy indicators when the main indicators are not available
Measurability (M): S = short term, M = medium term, L = long term
See Annex for a complete list of indicators.
Source: Extract from OECD (2014a).

74
2.5.1 Technology and innovation
POLICY CONTEXT
Technology development and innovation are key drivers of economic growth and productivity. They are important for managing energy and materials successfully and have a bearing on policies intended to preserve natural resources and materials and to minimise the pollution burden.
Innovation in technology supports the move towards more integrated approaches to material production and management. Much technology associated with energy use, such as “clean” technology and information and communications technology (ICT), results in reduced emissions.
Innovation in education and governance is important to support shifts towards new management methods and greater transparency in decision making. It also facilitates the adoption of co-operative approaches and partnerships, and the diffusion of knowledge.
While technology and innovation have a huge potential, new technology can also generate additional environmental pressures or strain material availability. It often involves new or substitute materials whose consequences may not yet be known. The same applies to the development and marketing of new products that affect air pollution, chemical safety, recyclability and waste disposal.
Progress towards green growth can be assessed against governments’ actions to spur innovation and technology change in terms of R&D and intellectual property support, and against technology development and system innovation in the business sector.
CALCULATION OF THE INDICATORS
Research and development (R&D) expenditure of importance to green growth (17). The data refer to government appropriations or outlays for R&D (GBAORD) and to business expenditure on R&D, expressed as percentages of all R&D expenditure.
These are defined on the basis of the primary purpose of the funder and include control and care for the environment as well as energy. The selection can be based on the socio-economic objectives “energy” and “environment” in the NABS 2007 classification (Nomenclature for the Analysis and Comparison of Scientific Budgets and Programmes). Additional information on the methodology for internationally harmonised collection and use of R&D statistics can be found in the Frascati Manual (OECD 2002).
R&D budgets for control and care for the environment include research on the control of pollution and on developing monitoring facilities to measure, eliminate and prevent pollution. Energy R&D budgets include research on the production, storage, transport, distribution and rational use of all forms of energy, but exclude research on prospecting and on vehicle and engine propulsion. The notion of which technologies are considered “environmental” evolves over time, as it tries to reflect the public consensus on the comparative usefulness of different technologies in reducing environmental impact.
Patents of importance to green growth (18)
The indicator Patents of importance to green growth (18) refers to patent applications filed under the Patent Cooperation Treaty (PCT) related to certain technologies listed below, using inventor's residence and application date. Patents in environmental technologies are identified using refined search strategies based on the International Patent Classification (IPC) and the detailed European Classification System (ECLA). The following technology fields should be considered:

75
energy generation and efficiency, including renewables-based energy generation, energy generation from fuels of non-fossil origin, insulation, heating and lightning
transport, including internal combustion engines, electric motors, hybrid propulsion and fuel efficiency
environmental management, including air pollution abatement, water pollution abatement, waste management, soil remediation and environmental monitoring
technology with potential for emission mitigation, including for improved output efficiency and for improved input efficiency (both relating to combustion technology with mitigation potential), as well as technology specific to climate change mitigation and with potential or indirect contribution to emission mitigation.
Data on patent applications under the PCT are based on inventors’ addresses, but the inventor may live in one country while the patent is owned by an enterprise headquartered in another country.
For more information on measuring environmental innovation using patent data please refer to Haščič and Migotto (2015).
Environment-related innovation in all sectors (19) can be captured by the share of firms with procedures in place to identify and reduce environmental impacts, expressed in terms of all innovating firms across all sectors.
Environment-related innovation in all sectors (19) is difficult to capture with measured indicators. For OECD (2014a), the latest information from the EU Community Innovation Survey is used to give a snapshot of possible indicators of environmentally related innovation.

76
Box 29. Trends in research and development (R&D) expenditure in OECD countries
Public R&D spending in OECD countries has slightly decreased since 1990, but the amount dedicated to environment and energy efficiency has increased.
Data on government budget appropriations or outlays for R&D (GBAORD) show the public resources that economies invest in research on energy and the environment. There are large differences among countries as regards government R&D spending on energy and on environment. In absolute terms, Japan, the United States and Germany are the largest funders, while Mexico, New Zealand, Canada and Japan are top investors in relative terms. With few exceptions, energy related R&D accounts for the vast majority of the spending. Compared to the 2002 most economies have increased the percentage of GBAORD going to energy and environment-related programmes.
Figure 21. Government R&D budget related to energy and environment
OECD countries, 2008-2012 average
Source: OECD (2014) Green growth indicators. http://dx.doi.org/10.1787/888932925711
DATA SOURCES AND AVAILABILITY
Data on government R&D expenditure are available for all EaP countries in the databases of the United Nations Educational, Scientific and Cultural Organization (UNESCO)39, though the coverage of national surveys and the sampling and estimation methods used may vary and data are not always up to date. This information has been complied in the World Bank database40. The IEA collects and publishes related data on government support for energy demonstration projects, typically referred to as RD&D41.
Data on patent applications are available in the statistics database of the World Intellectual Property Organization (WIPO)42.
The data availability in terms of environment-related innovation may be fragmentary in some countries. Little information is available on non-technological innovation, such as changes in business models, work patterns, city planning or transport arrangements that are also instrumental in driving green growth.
39 http://data.uis.unesco.org/?queryid=74 40 http://data.worldbank.org/indicator/GB.XPD.RSDV.GD.ZS
41 Statistics on public energy-related RD&D spending in OECD member countries are not available for all years or all technologies. Most of the available statistics focus on public RD&D; by definition, this fails to capture private sector efforts.
42 http://ipstats.wipo.int/ipstatv2/
OECD average environment
OECD average energy
0
2
4
6
8
10
12
14
16
CH
E
ISR
USA NLD
AUT
GBR BE
L
IRL
ISL
HU
N
SVK
LUX
PRT
SVN
CZE
POL
NO
R
SWE
DN
K
DEU
GR
C
FRA
KOR
ESP
AUS
ITA
EST
FIN
CAN JP
N
NZL
MEX
% of total GBOARD
EnvironmentEnergy
77
2.5.2 Environmental goods and services
POLICY CONTEXT
Producing environmental goods and services (EGS) generates growth and employment while contributing to greener growth. Examples for EGS are catalytic converters, air filters or consultancy services on wastewater management. The move from end-of-pipe pollution abatement to pollution prevention at source and to integrated pollution and resource management throughout the supply chain, along with new business models, has created new markets for EGS43. It has also influenced the structure of the EGS sector by increasing the importance of R&D, innovation, market and product design, environmental consulting and other services.
Progress towards green growth can be assessed by examining the share of the EGS sector in the economy in terms of employment and value added, along with conditions for doing business and accessing financing. It can also be assessed against transformation in economic sectors and shifts from traditional business activities to greener activities.
DEFINITION AND CALCULATION OF INDICATORS
Gross value added in the environmental good and services (EGS) sector (20) is expressed as a percentage of the GDP;
The scope of the indicator Gross value added in the EGS sector should be defined according to the classification of environmental protection activities (CEPA) and the classification of resource management activities (CREMA).
Despite existing definitions, setting the boundaries of the EGS sector remains difficult as does measurement and interpretation. Eurostat (2009) defines the sector as comprising activities to measure, control, restore, prevent, treat, minimise, research and sensitise regarding environmental damage to air, water and soil, resource depletion and problems related to waste, noise, biodiversity and landscapes. The definition includes cleaner technologies, goods and services that prevent or minimise pollution and resource-efficient technologies, goods and services that minimise natural resource use. At the same time, some studies have tried to capture the broader aspect of green activities. From a green growth point of view, there is good reason to measure activities with environmental benefits outside the EGS sector as internationally defined. Examples include water supply, ecotourism, energy and resource savings from information technology, and activities related to natural hazards and risk management intended to prevent or reduce the impact of disasters on human health (included in an earlier OECD/Eurostat definition) (OECD 2012a, Nordic Co-operation 2012).
Employment in the EGS sector and in selected environmental protection activities (20) is expressed as a percentage of all employment in various sectors such as recycling (ISIC 37); water collection, purification and distribution (ISIC 41); and sewage and refuse disposal, sanitation and similar activities (ISIC 90).
The indicator Employment in the EGS sector consists of two dimensions. Firstly, the employment in the environmental products sector, for selected countries and selected sectors, is expressed as a percentage of the total employment. Secondly, the employment in environmental protection and resource management activities is measured by the full-time equivalent employment engaged in the production of the environmental output. The full-time equivalent is the number of full-time equivalent jobs, defined as total hours worked divided by average annual hours worked in full-time jobs.
43 http://www.oecd.org/tad/envtrade/tradethatbenefitstheenvironmentanddevelopmentopeningmarketsforenvironmentalgoodsandservices.htm

78
Box 30. Trends in the environmental goods and services sector in the European Union
In the European Union, the contribution of the EGS sector to GDP in terms of gross value added is estimated to have grown from 1.6% in 2000 to about 2.0% in 2011; this is a conservative estimate since not all resource management activities are covered. Employment in environmental protection activities and in water and energy management is estimated to represent more than 4 million full time equivalents, an increase of about 44% since 2000. The driver for this increase is the growing importance of energy related activities, in particular the production of energy from renewable sources and equipment and installations for heat and energy savings.
Figure 22. The environmental goods and services sector in the European Union
Employment by domain, 2000-2011 Gross value added, 2000-2011
Source: STAN: OECD Structural Analysis Statistics (database); Eurostat; http://dx.doi.org/10.1787/888932925787
DATA SOURCES AND AVAILABILITY
When interpreting these indicators, it should be kept in mind that the scope of EGS as defined in the context of trade negotiations is not the same as the scope defined to analyse the domestic EGS sector. Interpretation thus depends on how “green industries” are defined (for more information see OECD 2014, p 121, OECD 2012a, Nordic Co-operation (2012)).
Environmental goods and services include specific services, connected products and adapted goods, but their definition and measurement scope varies across and within countries. Further efforts are needed to generate internationally comparable data on EGS (turn-over, value added, exports, employment, etc.) in accordance with the recommendations of the SEEA Framework.
Most indicators used to describe entrepreneurial performance are not available at the level of detail required to capture activities characterised as ‘green’. For OECD (2014a), data on the environmental goods and services sector in the EU result from a data collection carried out by Eurostat in 2009, 2011 and 2013, and include estimates.
2.5.3 Prices and transfers
POLICY CONTEXT
Prices and financial transfers (taxes, subsidies) provide important market signals that influence the behaviour of producers and consumers. Along with regulations, they can be used to address the environmental externalities of economic activity and to leverage more environment-friendly production and consumption patterns.
Environmentally related taxes are an important instrument for governments to shape relative prices. In the case of energy, changes in relative price affect substitution between various types of energy input and
0500
1000
150020002500300035004000
4500
2000 2001 2002 2003 2004 2005 2006 2007 2008 2009 2010 2011
1000 full time equivalents
Other
Energy management
Air & climate
Wastemanagement
Watermanagement
Wastewater management
2000 20110%
20%
40%
60%
80%
100%
share in total
0.0
0.5
1.0
1.5
2.0
2.5
2000 2002 2004 2006 2008 2010
% GDP
resource management actvities
environmental protection actvities

79
between energy and other production inputs. The level of taxation of energy relative to that of labour can influence the relative price of inputs, affect labour demand and stimulate the use of energy from cleaner sources. Energy end-use prices influence overall energy demand and their composition influences the fuel mix, which in turn determines environmental pressures caused by energy activities.
Environmentally related subsidies, if properly targeted and phased out when necessary, can be used to counteract distributional effects of policies or to leverage consumer behaviour and corporate investment towards cleaner options. Budgetary support to environmentally harmful consumption or production, by contrast, does not meet the criteria of effective subsidisation. Reforming or eliminating support to environmentally harmful products or activities can contribute to tackling pressing environmental problems while improving economic and fiscal outcomes.
Progress towards green growth can be assessed against the evolution of tax structures, price signals and producer and consumer support mechanisms.
DEFINITION AND CALCULATION OF INDICATORS
Environmentally related taxation (22) can be expressed in percentage of the GDP and percentage of the total tax revenue, and can be compared to labour tax revenue in percentage of GDP and percentage of total tax revenue.
Environmentally related taxes include taxes on energy products (for transport and stationary purposes, including electricity, petrol, diesel and fossil fuels), motor vehicles and transport (one-off import or sales taxes, recurrent taxes on registration or road use, other transport taxes), waste management (final disposal, packaging, other waste-related product taxes), ozone-depleting substances and other environmentally related taxes. The structure of the tax base may be provided as a complement.
Energy pricing (23), expressed as the share of taxes in end-use prices of energy for both industry and households.
Government support in the agriculture sector by type of support as defined in the OECD framework for producer and consumer support estimates, and expressed as percentages of total support estimates and in USD;
The indicator Government support in the agriculture sector can be provided as the theoretically more environmentally harmful and the more environmentally favourable agricultural support. The more environmentally harmful support refers to the share of payments based on output and input use in terms of total producer support estimates (% PSE). Payments based on output refer to transfers from taxpayers to agricultural producers from policy measures based on current output of a specific agricultural commodity.44 Payments based on input refer to transfers from taxpayers to agricultural producers arising from policy measures based on on-farm use of inputs; to transfers reducing the on-farm cost of a specific variable input or a mix of variable inputs; to transfers reducing the on-farm investment cost of farm buildings, equipment, plantations, irrigation, drainage and soil improvement; and to transfers reducing the cost of technical, accounting, commercial, sanitary and phyto-sanitary assistance, and training provided to individual farmers.
The indicator of theoretically more environmentally favourable agricultural support refers to the share of payments based on non-commodity criteria (% PSE), which refer to transfers for the long-term retirement of factors of production from commodity production; to transfers for the use of farm resources
44 Further reading on the PSE methodology is available at the OECD Producer Support Estimate web page: www.oecd.org/agriculture/agricultural-policies/producerandconsumersupportestimatesdatabase.htm

80
to produce specific non-commodity outputs of goods and services, which are not required by regulations; and to other non-commodity criteria.
Road fuel taxes and prices.
Road fuel taxes and prices for diesel and unleaded petrol should be reported in USD at current prices and exchange rates.
These indicators could be complemented with indicators reflecting Water pricing and cost recovery (24), environmentally related subsidies and the level and the structure of environmentally related expenditure. Those indicators yet have to be further developed.
Box 31. Trends in environmentally related tax revenue in OECD countries
The use of environmentally related taxes is growing but remains limited in many countries. The revenue they raise represents about 2% of GDP in OECD countries. The share has decreased slightly over the past decade, in part due to rising international fuel prices that triggered substitution away from motor vehicle fuels, some of the most heavily taxed products in the economy. It has to be kept in mind, however, that a tax can have an impact on the environment without raising much revenue; from an environmental perspective, one would like to see the tax bases in question being significantly reduced.
In the OECD area, the structure of environmentally related tax revenue is dominated by taxes on motor vehicles and transport (28%) and on energy products, including motor vehicle fuels (69%). Other environmentally related taxes, such as those on waste and water management and on hazardous chemicals – for which the price elasticities in many cases are larger than for energy and vehicles – represent a relatively low share in current tax revenue (3%).
Figure 23. Environmentally related tax revenue
As a share of GDP and of total tax revenue
OECD, 1994-2012
By tax base
OECD, 2012
Source: OECD Tax Statistics (database); OECD-EEA, Database on Instruments Used for Environmental Policy. http://dx.doi.org/10.1787/888932925825
DATA SOURCES AND AVAILABILITY
Information on environmentally related taxes is available for OECD countries and some other countries from the OECD database on instruments used for environmental policy and natural resource
0
5
10
15
20
25
30
35
40
45
50
0
2
4
6
8
10
12
14
16
1994
1995
1996
1997
1998
1999
2000
2001
2002
2003
2004
2005
2006
2007
2008
2009
2010
2011
2012
Labour tax revenue in % total tax revenue(right-hand axis)
Env tax revenue in % GDP (left-hand axis)
Env tax revenue in % total tax revenue (left-hand axis)
Waste management
1%
Other 2%
Energy products 69%
Motor vehicles and transport28%

81
management45. The data are more complete for taxes; further efforts are needed to cover other instruments, such as fees and charges, tradable permits, deposit refund systems and environmentally motivated subsidies.
Information on energy prices and taxes is available only for OECD countries from the IEA. Data availability for EaP countries may be fragmentary. Deregulation of energy markets has led to an exponential increase in the number of market players and to more and more difficulties in collecting price data on an equivalent basis.
45 http://www2.oecd.org/ecoinst/queries/Query_2.aspx?QryCtx=3

82
CHAPTER 3: GREEN GROWTH INDICATORS IN PRACTICE
Since 2011, governments increasingly have used the OECD green growth measurement framework to develop their own indicators and to assess progress towards a green transformation of their economy. This goes beyond the OECD member countries: of the 23 national initiatives described in a recent report (OECD 2014a), 15 involve emerging or developing economies. This chapter presents lessons learned in different countries.
3.1 Application by the OECD
Internationally, the OECD has issued two reports (OECD 2011a and 2014a) so far that reflect progress on green growth in its member countries and several other economies. Such reports will be published regularly. As a complementary tool, a database46 containing selected GGIs has been established, covering 46 countries (OECD and G20 countries).
GGIs are regularly being integrated into relevant country-specific OECD work on the environment and the economy. For example, green growth considerations are being built into national policy surveillance, such as Economic Surveys, Environmental Performance Reviews (EPR), Investment Policy Reviews, Innovation Reviews and the Green Cities programme. Two areas where GGIs are figuring prominently are in the OECD’s work on environment and on the economy.
For over a decade, OECD Economic Surveys have included analysis of policies with environmental dimensions and recommendations to enhance policy integration. In a first phase, there was the practice of developing chapters dedicated to sustainable development or specific environmental challenges. Since 2010, the development of chapters related to green growth has become more systematic over time and across member countries. The Economic Surveys of several countries, e.g. Denmark, Norway, Poland, Sweden, and the United States have addressed environmental issues more regularly than others. Some countries never had any environment or sustainable development related chapter in their Economic Surveys (e.g. Greece, Portugal, Estonia, and Slovenia) but integrated these topics within the main recommendations. Issuing the OECD GGIs-based report regularly can help keeping the buy-in for such integration and for GGI work at the country level.
As the indicators are further developed and their linkages with economic and environmental outcomes are better explored, they can serve for mainstreaming green growth considerations into the OECD Going for Growth47 project. Going for Growth uses the OECD’s expertise on structural policy reforms and economic performance to provide recommendations on reform areas that have been identified as priorities for achieving sustained growth. It examines among others the potential side effects of growth-enhancing measures on such aspects of well-being as income distribution and the environmental quality of life.
The OECD’s EPRs have been restructured to place a greater emphasis on green growth and the use of related indicators. These indicators complement and reinforce the OECD core set of EIs. In all third-cycle EPRs, a first chapter uses the green growth measurement framework to present a snap-shot of the reviewed countries’ progress in (i) transition to a low-carbon, resource-efficient economy, (ii) managing the natural asset base, and (iii) improving the environmental quality of life. The UNECEs EPRs also strengthen the position of the green growth development. Therefore a part of the reports analyses how the policies in the various economic sectors could be directed towards greening the economy. The most important sectors in this context are agriculture, including fishery and forestry, energy, industry and transport. Consumption
46 http://stats.oecd.org/Index.aspx?DataSetCode=GREEN_GROWTH 47 http://www.oecd.org/eco/growth/goingforgrowth.htm

83
patterns are another component to be assessed. Issues such as economic instruments, environmental expenditures, costs of action and of inaction and eco- innovation have to be looked at as well.48
3.2 Application in the OECD countries
The practical application of the OECD-suggested set of GGIs started in the member states even prior to the official launch of this set: in April 2011, the Netherlands issued its first report of this kind. Very soon, the Czech Republic followed this initiative. Today, the Netherlands, the Czech Republic, Germany, Denmark, Slovenia, the Slovak Republic and the Republic of Korea have produced GGIs-based reports.
Table 17. Comparative analysis of GGIs application
The Netherlands, the Czech Republic, Germany, Denmark, Slovenia and the Slovak Republic
Country Number of indicators
Grouping Additional indicators
Comparison with targets
International comparison
Dashboard use
Netherlands 20 (2011) 33 (2012) 36 (2015)
Adjusted49 Yes Some Yes Yes
The Czech Republic
27 (2011) 27 (2013)
Identical Yes Yes Yes Yes
Germany 27 (2012) Identical Yes Some Some No
Denmark 5 (2012) Adjusted50 No Yes Yes No
Slovenia 14 (2014) Identical Yes Yes Yes Yes
Slovak Republic
32 (2014) Identical No Yes Yes Yes
Source: Compiled by the OECD based on English versions of the country reports
3.2.1 The Netherlands
The first edition of Netherland’s indicator-based report contained data and analysis of 20 indicators derived from the preliminary OECD set. They were identified by an inter-ministerial working group under the direction of the Ministry of Infrastructure and Environment, with the participation of the Ministries of Finance and Economic Affairs, Agriculture and Innovation, the Netherlands Environmental Assessment Agency and Statistics Netherlands. In the report’s first edition, the indicators were grouped around four main dimensions, following the OECD set of GGIs. The second edition of the report, published in November 2013, contains 33 indicators that are broken down in six themes resulting from the sub-division of two OECD-suggested groups: (i) environmental efficiency; (ii) resource efficiency; (iii) natural asset base; (iv) environmental quality of life; (v) green policy instruments; and (vi) economic opportunities. The latest edition of the report (Statistics Netherlands, 2015) uses the same OECD-suggested groups.
Not all indicators from the OECD list were considered relevant for the Netherlands. For instance, the OECD indicator “access to sewage treatment and sanitation” was judged irrelevant, as (almost) all households have access to these amenities (Statistics Netherlands 2013). Therefore this indicator was
48 https://www.unece.org/fileadmin/DAM/env/documents/2010/ece/cep/ECE.CEP.2010.8.e.pdf. 49 Indicator groups: (i) environmental efficiency, (ii) natural asset base, (iii) quality of life, (iv) policy responses and economic opportunities. 50 Indicators groups: (i) Denmark’s green production, (ii) enterprises with green production, (iii) Research, development and innovation in
enterprises with green production, (iv) Danish green goods exports, (v) international benchmarking.

84
omitted in favour of water quality indicators, which do not feature in the OECD set but are highly relevant for the situation in the Netherlands.
Data for the Dutch GGIs originate from several different sources (Statistics Netherlands 2013). Many indicators are derived from the Dutch environmental accounts, which are fully consistent with macro-economic indicators from the national accounts. Other indicators come from a variety of statistics, including environmental statistics, energy statistics, and innovation and technology statistics. A few indicators are obtained from sources outside Statistics Netherlands.
A key aspect of the Dutch reports was the interpretations of trends, which were labelled as positive, neutral, and negative. For example, when the share of renewable energy rises or the waste recycling percentage increases this is scored as “positive”. If the trend is stable, such as a stable exposure to air pollution, the indicator is assessed as “neutral”. If the trend deteriorated since 2000, such as a decline in biodiversity or decrease in energy reserves, the indicator is assessed as “negative”. The scores for environmental and resource efficiency indicators are based on the notion of decoupling. Absolute decoupling has been assigned a positive score; relative decoupling – a neutral score, and a lack of decoupling – a negative score. Also international comparisons were used to come up with low, average or high international ranking. The results of data interpretation are presented in a dashboard using a colour code.
The report takes a sectoral perspective (Box 32), analysing the evolution of GGIs in the so-called “top sectors” of the Dutch economy. These sectors, including Energy, High Tech Systems and Materials, Agriculture and Food, or Logistics, play a central role for the goal of promoting innovation, job creation and strengthening the Dutch economic competitiveness. The sectoral analysis uses fourteen indicators of green growth, categorised according to green growth themes formulated by the OECD. Data resulting from analysis of top sectors performance is compared with data on non-top sectors and the average of the Dutch economy.
Box 32. The sectoral perspective
While all top sectors combined comprise 27% of the value added and 21% of the employment in the Dutch economy, they are also responsible for 70% of all GHG and PM emissions. The second green growth theme (resource efficiency) shows a similar picture: the top sectors use three-quarters of all energy and materials used within the Dutch economy as a whole. The fact that the top sectors share a large proportion of the total environmental pressure can be explained by their composition. The top sectors consist mainly of businesses that are active in the manufacturing, energy, agricultural and transportation sectors. These are all sectors in which the production processes are characterised by relatively high environmental and material intensities.
A striking finding with regard to the third theme (green policy-instruments and economic opportunities) is that the top sectors are taxed relatively less in terms of environmental taxes compared to the Dutch average or other (non-top) sectors. The top sectors therefore experience less financial burden, despite the relatively high level of environmental pollution associated with them. Consequently, the financial cost of this level of pollution is less incorporated within the price. A further finding concerning the third theme is that the production of EGSs is relatively high among the top sectors with respect to the Dutch economy. The contribution of the top sectors to the transition to a green economy, in terms of economic opportunities, is therefore above average.
Figure 24. Top sectors and green growth indicators in the Netherlands
Share of top sectors in total economy for macro-economic and green growth indicators, Netherlands, 2010

1) some top soverlap with re
Source: Statis
The 2can be placthe compar
Relative
sectors overlap wegard to GGI is
stics Netherland
013 and 201ced in an interison of the p
share of top s
with respect to c available.
ds (2013), Statis
15 editions oernational pposition of th
ectors for each
certain activities
stics Netherland
of the Dutch perspective (Bhe Netherland
85
investigated gre
s. This could no
ds (2015).
reports are aBox 33). Theds with the o
een growth indi
ot be taken into a
also a usefule basis for inother OECD
cator, Netherlan
account in this g
l example ofnternational band EU mem
nds, 2015
graph as no dat
f how analysbenchmarkinmber states.
ta for this
sis of GGIs ng has been

86
Box 33. The international perspective
The Netherlands might be dealing less efficiently with resources or pollution control than other countries, incurring higher compensation costs for society and companies and making the Netherlands less competitive. In order to compare performance, the Netherlands have been scored by comparing the value of the indicator for the most recent year with other countries. This was different from scoring trends from a national perspective that was based on assessing change of greening growth over a time period. The position of the Netherlands in the OECD or European ranking is divided by the number of countries for which data are available. For example, if the Netherlands is in 10th place and data are available for 27 countries, the indicator value for the Netherlands is 10/27 = 0.37. The value was then colour-coded with the following boundaries:
(i) Green 0 ≤ value ≤ 1/3;
(ii) Yellow 1/3 < value < 2/3; and
(iii) Red 2/3 ≤ value ≤ 1.
Countries with the same values for a certain indicator are assigned the same position.
The scores for this international benchmark, however, should be interpreted with care. First of all, the Netherlands might be positioned close to a boundary for some indicator values. A relatively small change in the figures may also result in a different indicator colour and score though (see colour code above). Secondly, there is no internationally comparable data available for certain indicators. Therefore, it is not entirely possible to assess the position of the Netherlands against other countries. Thirdly, the international comparison is based on data from the most recent available year. This is not always the same year for each indicator though this might not result in substantial changes, since the indicators are quite robust and year-on year changes are generally relatively small for the indicators. Finally, indicators that are best harmonised and comparable internationally are not always exactly the most appropriate ones to measure green growth in the Netherlands. However, it is the best one that approximates it.
An important addition to the second edition of the report is an (interactive) infographic site that was developed in 2012 to inform policymakers and the general public on the status of green growth in the Netherlands. This exercise was reiterated in 2015 (table 13)51.
51 http://www.cbs.nl/NR/rdonlyres/2C613080-F668-439C-B12C-98BF361B5ADF/0/2013p44pub.pdf and http://download.cbs.nl/pdf/green-growth-
in-the-netherlands-2015.pdf

Table 18.
1) some top soverlap with r
To givthe theme r
Resou
All indNetherlandsthe use of dwaste per in
The shenergy from2014, the lerenewable eextensive arivers for gehouseholds
Position o
sectors overlap regard to GGI is
ve a better pictesource efficie
urce efficienc
dicators for ress is rather mixdomestic biomnhabitant is th
hare of renewm renewable eevel still remaienergy by hydpplication of w
enerating hydr are already li
f the Netherla
with respect to s available.
ture of green gency is descri
cy
source efficienxed. The Netheass, metals ae lowest in Eu
wable energy cnergy sourcesns well below
dropower and wind power. Thropower, by thnked to gas n
ands in the O
certain activitie
growth Netherbed in more d
ncy could be merlands scoresnd minerals purope.
consumption (ts has increasethe Europeanthe use of biohe low ranking
he low level of networks for he
87
OECD and inte
es. This could no
rlands in an indetail below.
measured inters green for groer capita is low
table 13) showed over the yen average of 1mass. Denmag of the Nethegovernment s
eating (rather
ernationally i
ot be taken into
nternational co
rnationally. Thoundwater absw compared to
ws a score belears, up to 5.6
5 %. Norway,ark also scoreserlands can besupport for renthan biomass
n terms of gr
account in this
ontext and the
he internationastraction (ranko other OECD
ow average. A% of final ene Sweden and s relatively hig
e explained by newable energ) (Statistics N
reen growth i
graph as no da
notion of com
al position of tking 5 of 14 in
D countries. La
Although the sergy consumpt
Finland produgh with 23%, dy the lack of fagy and by the etherlands, 20
indicators
ata for this
mparison,
he n 2012) and andfilled
share of tion in uce a lot of due to its st-moving fact that 015).

1) Estimates
Source: Sta
3.2.2 The C
In ord“Green Groframework
Figur
s figure for Lu
atistics Netherl
Czech Repub
der to pursueowth in the C
k on GGIs wa
re 25. Share
uxembourg
rlands (2015) u
blic
e the develoCzech Repubas adopted (
of renewable
Selec
using Eurostat
opment of a blic and SelecCzech Statis
88
e energy in g
cted countries,
t and Statistic
Czech econcted Indicatostical Office
ross final ene
2013
cs Netherlands
nomy based ors” was pub2011). Simi
ergy consum
s.
on green grblished in 20larly to the N
mption
rowth, a firs11, in whichNetherlands,
t report on h the OECD , the Czech

89
Republic developed a set of 27 GGIs which builds the basis for future analysis on the field of measuring green growth. The chosen indicators cover the four main dimensions of the OECD green growth framework ((i) Environmental and resource productivity/intensity; (ii) Natural asset base; (iii) The environmental quality of life; (iv) Policies and economic opportunities), as well as the socio-economic context with emphasis on sustainability and equity issues. This report was complemented by a second edition, launched in 2013 (Czech Statistical Office 2013). This update takes into account the framework of the GGKP (2013) - a global network of researchers and development experts addressing green growth theory and practice that help countries to make advances on measurement, design and implementation of green growth policies. The Czech Statistical Office in cooperation with the Charles University Environment Centre has prepared both documents.
The updated report of 2013 contains 27 indicators, out of a set of fifty proposed and identified by the GGKP. The indicators were selected by a team of authors according to their relevance to Czech conditions and data availability. Part of data was “mined from existing administrative sources” (Czech Statistical Office 2013) given that not all domains of this green growth are covered by statistical surveys. The set was amended to include data on “Adjusted Net Savings” (as part of contextual information) and “Ecological Debt” (as part of the “natural asset base” group).
The results of data analysis are summarised in a dashboard that evaluates trends for the entire period of data availability, highlights the last year-to-year change and makes compares the country’s data mainly with data from the EU and OECD member countries. Time series are provided, commonly, from 1995 or, in some cases, for the earliest year available. There are indicators for which even longer periods are analysed (e.g. on old age index – since 1945). Within the report each indicators explanation is complemented by a graph, illustrating the development over the available period of time. The portrayal of the indicator “Energy productivity” (Box 34) can serve as an example for the approach of the Czech report.
It is aimed to further assess and develop the set of GGIs in the Czech Republic in cooperation with international organisations and partners, to cement ties and to strengthen the national green growth and green economy strategy.
Box 34. Energy productivity in the Czech Republic
The energy productivity indicator is the ratio between gross domestic product in constant prices and total primary energy supply.
Growing energy productivity allows the production of more economic output from the same amount of energy. This in principle does not necessarily reduce consumption of raw materials and fuels, but it does increase GDP produced by the same amount of energy. Energy productivity is influenced by technological development and economic structure.
Energy productivity in the Czech Republic steadily increased until 2008, since when it more or less stagnated for a number of reasons, e.g. the global economic crisis. The country has no legal binding target for energy productivity, but has one for energy intensity (the inverse value of productivity) which should aim to stabilise the annual rate of fall of the energy intensity of GDP creation by 3.0 – 3.5% (indicative target) according to the Czech Republic’s energy policy.
In 2011, the Czech Republic was about 18% below the OECD average in energy productivity.

Source: Czec
3.2.3 Germ
Germadevelopmepublished a2012). Its Environmeof life; (iv)proposed bother conddefinition wprovide thebe implemedefinition uthe proposeand soil resappear suff
Presenindicators tconsequent
The wGGI set, Gfeasibility;
For thgeneral prostatistics acalculated
Figure 26
ch Statistical Off
many
any has testent indicatora report calle27 indicato
ental and reso Policies and
by OECD forditions in ordwas adjustede necessary tented complused deviateed version (Dsources) couficient.
nted data aretime series stly builds the
work was carGermany bleit was a seco
he pilot studoductivities,
and thereforeand politica
6. Energy pr
fice (2013).
ted the OECrs and withed “Test of thors cover theource producd economic or the chosen der to be abld. In such catransparencyletely or to as from the pDestatis 2012uld not be pro
e provided fostarts only ine end of time
rried out by tended officiaondary consi
dy the conscijobs marke
e do not neal targets we
oductivity an
CD set of Genvironmen
he OECD see four mainctivity/intensopportunitiesGGIs, definle to use/testases, the rele for compari
a large extenproposals, an2). Another tovided as the
or a time rann 2005. The e series withi
the German al statistics ideration whe
ious decisionet, trade dataeed to be “tere not comp
90
nd primary en
GGIs buildingntal accoun
et of green grn dimensionssity; (ii) Nats). As it was
nitions had tot an indicatoevant definitison purpose
nt in line withnd three furththree indicatere was no d
nge of arounddeadline forin the report.
Federal Statwith data frether the dat
n not to prea, etc.) was tested”. Furtpared, as tho
nergy supply
g on the Genting. The Growth indicas of the OEtural asset baimpossible t
o be changedor. As a resutions were c
es and followh the OECDher applied dtors (multifacdata available
d 20 years, sr presented d
tistical Officrom other sota were up-to
esent econommade, as th
thermore theose are not p
in the Czech
erman experGerman Fedators in GermECD green gase; (iii) Theto be consist
d depending ult of that, fcompiled intow-up work. SD framework,definitions dctor productie in Germany
starting 1991data was the
e (Destatis). ources. The
o-date (Desta
mic framewohese data aree indicators part of the p
Republic
rience with deral Statistimany” in 201growth frame environmentent with the on the data sfor some indto an annex Sixteen indic, for five ind
differ significivity, minera
ny or the qua
1 or 1993. Fomiddle of 2
While pilotmain aim w
atis 2012).
ork conditionre available
trends haveprovided set
sustainable ical Office 12 (Destatis mework ((i) ntal quality definitions
situation or dicators the in order to ators could
dicators the cantly from al resources ality did not
or scattered 012, which
testing the was to test
ns (growth, in national e not been t of OECD

GGIs, in cowas not po
In thedescriptionemissions aNetherland2013).
Accordmethane (CHhydrofluoroc
In 2012accounted fofluoro-carbo
From 1equivalents)A large propreunification%.
OveralThis means and GHG emconsidered ieconomic cr
Source: Desta
ontrast to thessible to sho
e report then and visualsand producti
ds (2011) as w
ding to the KyoH4), nitrous mcarbons (HFCs
2, 939 million or by far the lans for 1.4 %.
1990 until 201). In the case oportion was abn. After this, en
ll, GHG produthat resource
missions was in absolute terrisis of 2008/2
Figur
atis (2013).
e sustainabiliow assessmen
e status and s such as divity” illustrawell as to in
Box 35. CO2
oto Protocol, tonoxide (prevs), perfluoro- c
tonnes of GHargest share in
2 GHG emissof the most im
bove all saved nvironmental a
ctivity rose bys were used mdecoupled so rms (without ta009 as well as
re 27. Green
ity indicatorsnts related to
developmeniagrams or cates the applidicator-base
2 and GHG em
he following sviously: nitrouscarbons (PFC
Gs (in CO2 eqn GHG emissi
sions in Germamportant compo
by companiesand climate po
y 72 % betweemore efficiently
that the enviraking accounts the subsequ
nhouse gas p
91
s of the natioo the achievem
nt of each charts. In Boied structure
ed report und
missions and
six substancess oxide) = laug
C) and sulphur
quivalents) weions. Methane
any fell substaonent, namelys closing dowolicies had an
en 1990 and 2y with increasronmental burdt of imports). Auent recovery.
productivity in
onal sustainaments of the
of the indiox 35 the in, which is sim
der the Germ
d productivity
s are included ghing gas (N2Ohexafluoride
ere emitted in Ge accounted fo
antially by 25 %y CO2, the decn during the fieffect. Betwee
012, CO2 proding economic den from a GeAt the end of th
n Germany (d
bility strategse targets (D
cators are pndicator “COmilar to the p
man Sustainab
y in Germany
as GHGs: carO), partly halo(SF6).
Germany. Witor 5.2 %, laugh
% (309 millioncrease was 22rst five years en 1990 and 2
ductivity alonegrowth. The t
erman perspeche time series
domestic con
gy. As a resuDestatis 2012
presented wO2 and greenpublication obility Strateg
rbon dioxide (ogenated
th 87.5 % carbhing gas for 5
n tonnes CO2 20 million tonnafter German 2010 the GDP
e, however, ontrend in econoctive also dec
s the trend refl
ncept)
ult of this, it ).
ith a brief nhouse gas of Statistics gy (Destatis
(CO2),
bon dioxide .9 % and
nes (−21 %).
P rose by 29
nly by 65 %. omic growth clined when ects the

92
3.2.4 Denmark
In November 2012 the report “Green production in Denmark – and its significance for the Danish economy” was jointly published by the following national institutions: Danish Energy Agency; Ministry of Climate, Energy and Building; Danish Business Authority; Ministry of Business and Growth; Danish Environmental Protection Agency (EPA) and the Ministry of Environment.
Denmark used the OECD measurement framework to develop a set of five GGIs in the fields of (i) resource productivity of the economy as well as (ii) the socio-economic context and characteristics of green growth. Also the report identifies and describes Danish enterprises’ production of green technologies, goods and services (Danish Energy Agency et al. 2012). In addition the report informs about research, development and innovation in enterprises with green production as well as Danish green goods exports and international benchmarking.
The purpose of the report was to monitor the future development of green business in Denmark based on solid statistics. Green production was broken down into nine green business areas (Box 36), adapted from Eurostat’s guidelines EGS sector (Eurostat 2009), which allowed a detailed definition of products sold by Danish enterprises (Danish Energy Agency et al. 2012).
In view of achieving the best coverage rate as possible, four sources were used to generate data on green business statistics. The first and most essential source is the product code, which gives information on what a company produces and sells52. The results of a questionnaire survey addressing 10 % of all Danish enterprises builds the second source, complemented by the third source, which is a review of the on-line appearance of 2,000 Danish enterprises. The fourth source, used for data on organic farms in the country, is the National AgriFish Agency.
Box 36. Green business areas defined for Denmark
Air pollution control
Surface and wastewater management
Better utilisation of energy
Protection of soil, groundwater and the aquatic environment
Protection of biodiversity and landscape
Waste management
Utilisation of renewable energy sources
Measurement and analysis related to climate protection
Noise and vibration abatement
Source: Danish Energy Agency et al. (2012).
52 The identification of Danish green enterprises across industries was based on the official German list of green product codes published by Federal Statistical Office of Germany (Destatis) in April 2012.

ThrouDanish entcomparison
The fiproductionTo further production
Addedand serviceexpenditure prices of thearound 13%from 2008 thowever exp
The coaround 10%time employat a par with
From 2enterprises, production ienterprises differences bvery high penterprises other servicservice enteservice entethat there ahave not tak
ugh the greenterprise. Furtns between e
first chapter , such as turnclarify the D”, as it is pre
value is a ms through usion raw mate
e goods or ser% from 2005 to
to 2010, and perienced a sm
ontribution to % in 2009, afteyees, reveals ah the average f
2006 to 2009 while green pn trade and min manufactubetween greeroductivity coin 2009 can te enterprises
erprises in 20erprises in theare large diffeken this into ac
n business stathermore, in
economic sec
of the repornover, expor
Danish approesented withi
Box 37. A
measure for hoing labour anerials, auxiliarrvices which tho 2008, measu
today the 20maller decreas
added value er which it fell a measuremefor all enterpri
the productiviproduction in tmanufacturingring, trade ann and non-gre
ompared to noherefore be ahad a drop
10 can be exe general popurences in proccount.
Figur
atistics it wandicators on ctors and thei
rt gives inforts, export intoach, Box 40in the report.
Added value f
ow much the nd capital stocries and servihe individual eured in consta
005 level. These than did gr
by enterpriseto just under 9nt of productivises in manufa
ty in green prrade and mang. In 2010, thnd service (Feen productionon-green serv
attributed to thin productivity
xplained by thulation had anoductivity acro
re 28. Added
Denm
93
as possible togreen produir green prod
ormation on tensity, adde
0 shows the d.
from green p
individual entck, e.g. machces purchase
enterprise has ant prices. Afte trend is simreen productio
es with green9% in 2010. Lvity. In 2005, tacturing, trade
roduction by snufacturing cohe productivityigure 29). Thn productivity.vice enterpris
he fact that they of 5%. The
he fact that thn increase in poss industries
d value from
mark, in 2010 p
o identify theuctivity wereduction of go
key economed value (per depiction of
roduction in
erprise contribhinery. Addeded from other
sold. Added vter peaking in
milar for the reon (Figure 28).
n production inLooking at addthe productivite and service,
service enterprntinued to be y in green prohe statistics d. In 2009, in pses. The higheir productivitylarge drop in
eir productivitproductivity ofand across e
green produ
prices
e share of gree calculated,oods and serv
mic indicatorsfull-time emindicator “A
Denmark
butes to enhad value is calc
enterprises ovalue from gre2008, added
est of the bus
ncreased steaded value relaty in green prorespectively.
rises increasemore or less aoduction was o not therefoarticular, greerelative prod
y rose by aroun the relative ty fell by arouf 15%. Furtheenterprise size
ction
een productio, building thvices.
s for Denmamployee (proAdded value
ancing the valculated by deor abroad froeen productionvalue fell by siness comm
adily from 9%ative to the nuoduction was
ed relative to oat the same lethe average
ore reveal anyen service entductivity of grund 4%, but aproductivity o
und 6%, but aermore, it shoue, and these
on for each he basis for
ark’s green ductivity)). from green
ue of goods educting the m the sales n went up by around 14% unity, which
% in 2005 to umber of full-more or less
other service evel as other
level for all y systematic erprises had reen service also that the of the green also that the uld be noted calculations

Source: Danis
3.2.5 Slove
The Sthe OECD 2014 (Statiselected foSlovenian on GGIs coasset base;
Furtheare not pacollection, productionpicture of t
Throutime series time series process for
The princludes thfurther expproductivit
ExplanenvironmentEU should hemissions in3.2% lower tput forward amount of 1the base ye8.5%. The v
Figure 29
sh Energy Agen
enia
Statistical Offramework
istical Officeor the SlovenStatistical Oovers the fol(iii) environ
ermore, Slovart of the G
drinking w. These indithe extent the
ugh a schemaof data and
embraces 1r a couple of
resentation ohe indicatorsplanations onty” is shown
nation: Climatet as a whole. have decreasen Slovenia incthan in the bathe sinks whi,320 kilotons ar). In 2008 th
value of the ind
9. Added va
ncy et al. (2012)
ffice of the Rand publish
e of the Repunian report.
Office and Eullowing themnmental quali
venian authoGGI set propwater polluticators were e green grow
a the report gthe trend (in2 years on aindicators al
of all consides definition, n the presentexemplary f
Bo
e change ranIn line with th
ed by 8% overeased until 2
ase year. In ordich are the diof carbon dioxhe gross domdicator emissi
lue per full-ti
).
Republic of Shed a correspublic of SlovThe indicato
urostat. In acmatic areas: (ity of life; an
rities added posed by Oion, agriculconsidered
wth strategy i
gives an ovencrease, stagaverage, begilready started
ered indicatoa chart sho
ted data as wfor the conce
ox 38. Emissi
nks among thehe First Commr the base ye008, and thender to fulfil its rect result of xide equivalen
mestic product ion productivit
94
ime employee
Slovenia hasponding rep
venia 2014). Fors were seleccordance wi(i) Environmnd (iv) econo
five additioOECD: exploltural area to be of nas being enfo
erview of all gnation, decreinning around between 19
ors in the Sloowing the dewell as trendept applied in
ion productiv
e important famitment periodar. The statist
n started to gracommitment man’s activity
nt (i.e. a 6.5%started to de
ty slowly but f
e from green
s developedport “Green gFrom the proected with rith the OEC
mental and reomic opportu
nal indicatoroitation of nand utilised
ational imporrced in Slove
19 examineease) of the
nd the year 2990 and 1993
ovenian reporevelopment ds. The explan the Sloveni
vity in Sloven
actors that imd of the Kyototical data reveadually diminiunder EU Bury in forestry a
% decrease in crease and infirmly increase
production,
a national segrowth indicoposed set ofegard to datD frameworsource produ
unities and po
rs into the nnational resod agriculturartance and senia.
ed indicators,GGIs. For th
2000 in most3.
rt follows theover the avaanation of than report (Bo
nia
mpact the wello protocol, in teal that the qush. In the 200
rden Sharing Aand in handlingview of the qu
n the 2008-201ed from 1995 o
Denmark
et of GGIs bcators for Slf OECD GGta availabilitrk, the Sloveuctivity; (ii) olicy respons
national framources, sepaal area withsuitable to g
, showing thhe presentedt cases. The
e same structailable time
he indicator “ox 38).
-being of peothe 2008-201uantity of gree08-2012 periodAgreement, Sg the land, nauantity of the e12 period it don and in 201
building on lovenia” in
GIs, 14 were ty from the enian report
the natural ses.
mework that arate waste h ecologic ive a good
he available indicators,
monitoring
ture, which series and
“Emissions
ople and the 2 period the
enhouse gas d it was thus lovenia shall amely in the emissions in ecreased by 2 it reached

the value of
Source: Statis
3.2.6 Slova
The SSlovak EnvAt the samensure a reg
The penvironmen(iv) economassessment
Data pthe assesseenvironmenAlthough fcovers a ticomplete sp
In theindicators t
Similacharts, mapBox 42). Itthe nationa
EUR 1.26 per
stical Office of th
ak Republic
Slovak Repuvironmental
me time, a prgular updatin
present set ontal and resomic opportut were based
presented wied trends wnt, economyfor a few indime series bpan due to d
e report, a dthe overview
ar to the Slovps), giving at is also to m
al language a
r kilogram of c
Fig
he Republic of S
ublic has pubAgency in c
rocess of inteng of the ind
f GGIs in thource producunities and p
on OECD’s
ithin the Slovwere discussy, labour anddicators the between 200iffering appr
dashboard shw finds a posi
venian natioan impressionmention, thatand English w
carbon dioxide
gure 30. Emi
Slovenia (2014)
blished a repcooperation ergovernmen
dicators.
he Slovak Rctivity, (ii) thpolicy respon
proposed se
vak report ored with nat
d social affaiassessment p
00 and 2012roaches in da
hows informaitive trend an
nal report, en of the devet differently within one do
95
e equivalent. F
ission produc
).
port on selewith the minntal data col
Republic comhe natural asnses. The seet of GGIs.
riginate fromtional state irs and familperiod begin
2. In some cata collection
ation on trennd future per
each indicatoelopment duto other rep
ocument.
From 1995 it in
ctivity, Slove
cted GGIs inistry of envlection and p
mprises 32 insset base, (iiielection of i
m official or ispecialists
ly, finance, ans 1996 or 1cases, howevn or changes
nds of all 32rspective.
or’s definitionuring the monorts, the Slo
ncreased by 5
nia
n 2014. Thevironment anprocessing s
ndicators, coi) environmendicators an
international(departmentsagriculture a998, the majver, data arein methodol
2 indicators.
n is publishenitored time vakian publi
55%.
e work was nd the statistscheme was
overing the fental quality nd the metho
l databases. Is of the mi
and rural devajority of avae not availablogy and asse
. For two th
ed with visuae series (see ication provi
led by the tical office. initiated to
fields of (i) of life and
odology of
In addition, inistries of velopment). ailable data ble for the essment.
hirds of the
als (graphs, example in ides text in

Box 3
The mthrough suslimit values term below-l
Trends2000, with amonitoring nsignificant, hexceeded at(77).
Source: Slova
3.2.7 Repu
The RLow Carbogreen growStatistics Kgreen growsurveys, SE
Koreaframeworkaround fouquality of decoupling(Statistics K
39. Exposition
major current ipended particwill continue dlimits values.
s in average a slight increanetwork. In 20however, is et most monito
F
ak Environment
ublic of Kore
Republic of Kon-Green Growth related sKorea in coowth. StatisticsEEA, and Gr
a became thk (Statistics Kur themes: (i)
life and (ivg of environKorea, 2012)
n of the publi
issue in the qculate matter despite the fa
annual PM10 ase in recent012, two statixceeding the ring stations i
Figure 31. N
2002-2012 a
Agency (2014)
ea
Korea adoptowth Law instatistics in operation wis Korea has reen Industry
he third couKorea 2012) ) environmenv) economic
nmental pres). An update
ic to air pollu
quality of air (PM10). It is lict that annual
concentrationt years. PM10
ons reported permitted nu
n 2012 with m
Number of ex
at selected mo
.
ted a Nationn 2010. In thiorder to moith the Seoubeen compil
y Statistics.
ntry to pubin which it a
ntal and resouc opportunitisure from e
e of this repor
96
ution by partic
in the Slovakkely that in thl PM10 concen
ns in the Slov0 is currently
exceeded anmber of 35 e
most exceedin
ceedances o
onitoring statio
nal Strategy is context, Sonitor green ul National Uling informa
blish a reporanalysed 23 ource producties and poli
economic grrt was done
culate matter
k Republic anhe upcoming yntrations in the
vak Republic monitored at
nnual limit valexceeding limig occurrences
f daily limit v
ons in the Slov
for Green Gtatistics Korgrowth pro
University aation on gree
rt using the of the OECDtivity, (ii) naicy responseowth is undin 2013 (Sta
r (PM10) in th
d the whole oyears, the trene Slovak Rep
show fluctua32 stations oues (Jelšava,t values per ds reported from
value for PM10
vak Republic
Growth in 20ea (KOSTATgress. The w
and the Presn growth ind
OECD GreD GG indicatoatural asset bes. Most indder way but atistics Korea
he Slovak Rep
of Europe is nd of exceed
public have rec
ating characteof the nationa, Ružomberokday. This limm the station
0
009, accompT) has been work is carrsidential Comdicators, gre
een Growth ors. They arease, (iii) envdicators sho
more has ta, 2013). The
public
air pollution ing the daily corded long-
eristics since al air quality k). Far more it value was of Veľká Ida
panied by a developing
ried out by mmittee on en lifestyle
Indicators e organised
vironmental w that the to be done e indicators

97
are organised according to 3 main strategies and 10 policy agendas such as “efficient reduction of GHG emissions”.
3.2.8 Mexico
Mexico is applying the OECD GGIs, building on experience with environmental accounting. Additional country specific indicators relate to: the productivity of wastewater treatment services, subsidies to electric power services, and companies with green certifications. The work is led by the National Statistical and Geographical Institute (INEGI).
3.3 Application in Latin America and the Caribbean
In Latin America and the Caribbean, work is underway in Colombia, Costa Rica, Ecuador, Guatemala, Paraguay and Peru. The initiative is supported by the United Nations Industrial Development Organization (UNIDO) in co-operation with the OECD, the Latin American Development Bank (CAF), the Latin American and Caribbean Economic System (SELA), and UNEP.
The aim is to establish a framework to monitor green growth in the LAC region based on the OECD green growth measurement framework and drawing upon UNEP work on environmental indicators in Latin America. A considerable wealth of information has thus been compiled, and is being disseminated and published (Box 40). Particular attention is given to the living standards of people and opportunities from green growth. Examples of additional country specific indicators include: malnutrition, acute respiratory infections and reforestation.
The feedback received so far indicates that the use of GGIs in developing countries requires some special considerations. Developing countries may face many different challenges that are less prevalent or acute in developed countries, such as a substantial dependence on natural assets, persistent and high levels of poverty, a large informal economy, and, often, weak institutions. Beyond ensuring a balanced coverage of the two dimensions of green growth – “green” and “growth” – achieving green growth in developing countries is also about increasing the economic and environmental resilience of the society and ensuring that growth is inclusive. These aspects will also need to be reflected in an indicator set aiming to monitor progress.
Box 40. Applying the OECD green growth measurement framework in LAC countries
Through the project “Monitoring green growth in the LAC region”, the United Nations Industrial Development Organization (UNIDO) in co-operation with the OECD, the Latin American Development Bank (CAF), the Latin American and Caribbean Economic System (SELA), and UNEP – initiated a pilot study to test the applicability of the OECD green growth measurement framework and indicators in the LAC region. The selection of the indicators took into account the countries’ institutional and statistical capacity, their experience with indicators, and national industrial strategies.
The study reveals a number of implementation challenges that are common to many countries, and describes ways to address them:
Challenges Ways to address the challenges
Indicator selection Reflecting adequately national circumstances and
policy issues. Reflecting adequately the linkages between
economic growth and environmental issues. Assessing each indicator with respect to its
relevance, soundness, and measurability.
Adapt the indicators to the national context by developing new indicators on aspects of particular importance to the country.
Ensure that the indicator set encompasses both indicators that are internationally comparable and indicators that are country specific.
Data compilation and measurement Identifying data sources across different institutions
and government levels, and remaining gaps. Compiling the data and organising data flows.
Document the data using harmonised formats. Ensure compliance with statistical standards. Organise data flows in a way that enables regular updates. Combine graphics and tables with diagrams and explanatory

98
Harmonising the data across national sources and addressing data quality issues, including discontinuity over time.
text to compensate for missing data.
Interpretation and communication Placing the indicators in the country’s socio-
economic context. Interpreting the results in view of underlying
economic, social and political factors.
Provide background information on specific national circumstances.
Be clear about the limitations of the indicators and their interpretation.
Release the indicators through user-friendly reports and public websites.
Adapt the ways of reporting to the various audiences. Use standardised reporting templates for all indicators.
Institutional co-ordination and capacity building Coping with limited (human, financial) resources; Coordinating between national institutions at
different levels. Providing appropriate training and capacity building.
Establish a network of data providers and indicator users. Maximise the use of existing data. Exchange knowledge and learn from peers on:
- indicator selection and calculation methods. - data management and quality assurance. - interpretation of indicators and ways to use and
communicate them
Several lessons emerge from this experience.
First, clear communication is important and can be achieved in many different ways. Countries have opted for different solutions: producing user-friendly and visually appealing reports (e.g. Paraguay), adopting more concise, standardised reporting (e.g. Colombia, Mexico, Paraguay), complementing the indicator-based report with a summary for policy makers (e.g. Costa Rica), and highlighting concrete policy steps and their inter-linkages to facilitate application of the indicators in national policy agendas (e.g. Ecuador).
Second, the indicators need to be adapted to the national context. For example, some countries (e.g. Mexico, Colombia and Paraguay) have added more indicators on a particular natural resource because of its national importance.
Third, the application of the OECD framework that cuts across different themes and policy issues, contributes to a better cooperation among government institutions and helps improve the countries’ environmental information systems and their connection with economic information systems.
Finally, exchange of experience and good practices between the participants helps them address data challenges and measurability issues.
Source: CAF-OECD-UNIDO (2012).
3.4 Application in East Asia
In East Asia, eight emerging and developing ASEAN (Association of Southeast Asian Nations) countries, Malaysia, Thailand, Indonesia, the Philippines, Vietnam, Lao People's Democratic Republic, Cambodia and Myanmar participate in a project on the promotion of green growth in the region supported by the Republic of Korea and led by the OECD. A database with GGIs for participating countries is currently being established. Particular attention is given to business opportunities for small and medium-sized enterprises (SMEs) and to productivity issues.
In co-operation with officials and researchers from across the ASEAN-region, the OECD published Towards Green Growth in Southeast Asia in November 2014 (OECD 2014b). The report aims to provide evidence that Southeast Asia can pursue green growth and thus sustain the natural capital and environmental services, through of right policies and institutions. OECD actively advises the countries on this challenging task, to shift the on-going and strong economic growth towards green growth and to

99
achieve the integration of a green growth strategy into national development plans. These efforts can be summarised in three key messages (OECD 2014b), which emerge from the report and are further discussed in Box 41.
Box 41. Key messages towards green growth in Southeast Asia
Message 1: Green growth is not a separate strategy from long-term economic growth and higher levels of well-being, but rather is a means to achieve them
Economic growth, human well-being and environmental performance are inseparable. The future of the region’s population and the profitability of its economic activities will depend on policy makers and business accepting and acting on this. Evidence from around the region shows that environmental degradation is already undermining human well-being and economic growth. Yet there are ways in which economic and environmental performance can be mutually beneficial.
For example, this is the case of reducing outdoor air pollution. Outdoor air pollution resulted in nearly 200 000 deaths in the region on 2010, costing over USD 280 billion, based on statistical value of life calculations, i.e. the value people attach to not having their lives cut short by pollution-related health problems. By reducing air pollution, better public transport can reduce these costs and benefit the economy by easing congestion and increasing productivity.
Message 2: The window of opportunity for green growth is open now
Southeast Asia is at a turning point. The region is undergoing deep transformation and modernisation underpinned by strong – but unsustainable – economic growth. Today’s decisions by policy makers and business leaders will determine the sustainability of the regions development path for decades – potentially centuries - to come. Delayed action risks missing three golden opportunities: (1) To sustain regions natural wealth; (2) To lock in clean and resilient infrastructure; (3) To become a hub for green investment.
Message 3: Political leadership is the key to putting the right policies and institutions in place
Governments are only as strong as they are courageous: leaders must move beyond today’s incremental and isolated progress to instead embrace a different kind of economy. This will mean: strengthening governance and reforming economic structures; mainstreaming green growth into national development plans and government processes; accounting for the essential ecosystem services provided by natural resources and ending open-access exploitation.
Source: OECD (2014b).
The report can be seen as a guide for Southeast Asian countries, which are seeking for competitive advantages through clean and efficient technologies, the adoption of better standards and regulations and thus pursuing green growth.
3.5 International cooperation on monitoring progress towards green growth
International co-operation is essential to achieve synergies and advance knowledge about the measurement of green growth. It is also essential to help identifying commonalities in international work and to clarify the specific purposes of the various initiatives. Since 2011, OECD has been working closely with other international initiatives to share information and to promote common approaches. Several other international bodies have embarked on work on green growth, with somewhat different emphases and objectives than the work undertaken by the OECD.
The United Nations Environment Programme (UNEP) launched its Green Economy53 Initiative in late 2008, including a framework for assessing progress in moving towards a green economy. In December 2012, UNEP published a framework document “Measuring Progress towards an Inclusive Green 53 http://www.unep.org/greeneconomy/

100
Economy,” (UNEP 2012) and prepared a manual on using indicators to develop green economy policies (UNEP 2014). The manual is to be applied in all the countries where UNEP provides advisory services. UNEP’s green economy indicators fall into three major categories: (i) indicators of issues and targets to be addressed by green economy policies, (ii) indicators of policy interventions, and (iii) indicators of impacts for ex ante assessment and ex post monitoring and evaluation of adopted policies.
The World Bank report on Inclusive Green Growth (World Bank 2012) recognises that “sustained growth is necessary to achieve the urgent development needs of the world’s poor and that there is substantial scope for growing cleaner without growing slower”. It emphasises that sound indicators are necessary to monitor economic performance and gauge the effectiveness of policies. Through its Wealth Accounting and Valuation of Ecosystem Services (WAVES)54 Global Partnership, the World Bank provides technical support and capacity building for implementing the SEEA, including experimental ecosystem accounts.
The Global Green Growth Institute (GGGI)55 proposes several categories of GGIs, each corresponding to a specific purpose in GGGI’s country programmes. These programmes aim to help developing countries create green growth plans and strategies by incorporating green growth considerations into economic development plans and growth strategies at the national and local levels. Diagnostics Indicators (DIs) are designed to assess the overall sustainability of the country and to identify key issues that should be considered. Planning Indicators (PIs), structured in accordance with the Pressure-State-Response approach, are designed to support the development of alternative green growth scenarios by constructing the cause-effect linkages between the sustainability issues highlighted by DIs and their pressures and impacts. Monitoring and Evaluation Indicators (MEIs) are designed to help track green growth progress and performance achieved by the GGP programmes and projects.
The OECD works together with the GGGI, UNEP and the World Bank within the framework of the Green Growth Knowledge Platform (GGKP)56. One outcome of this co-operation has been the preparation of a report, “Moving Towards a Common Approach on Green Growth Indicators” (GGKP 2013) that builds on the OECD green growth measurement framework.
The Inclusive Wealth Report 2012 by the International Human Dimensions Programme (IDHP) on Global Environmental Change is the first in a series of biennial reports to measure progress toward sustainability. It was then updated in 2014 covering 140 countries over the past two decades (UNU-IHDP and UNEP 2014). It is a joint initiative of the International Human Dimensions Programme on Global Environmental Change of the United Nations University (UNU-IHDP) and UNEP in collaboration with the UN Water Decade Programme on Capacity Development (UNW-DPC) and the Natural Capital Project. The 2012 report (UNU-IHDP and UNEP 2012) introduces an index that measures the wealth of nations by looking into the countries’ capital assets, including manufactured, human and natural capital, and its corresponding values: the Inclusive Wealth Index (IWI).
The European Union’s 2020 Flagship Initiative for a resource-efficient Europe includes a Resource Efficiency Roadmap that specifies policy goals and targets, and indicators to measure progress. Several of the indicators listed are similar to those proposed by the OECD57.
The European Commission’s IGrowGreen assessment framework58 provides an indicator-based analytical tool to assess how structural reforms can contribute to a competitive, greener economy. Many of the indicators listed, in particular those relating to the environmental efficiency of production and
54 http://www.wavespartnership.org/en 55 http://gggi.org 56 http://www.greengrowthknowledge.org/about-us 57 http://ec.europa.eu/resource-efficient-europe/index_en.htm 58 http://ec.europa.eu/economy_finance/db_indicators/igrowgreen/index_en.htm

101
consumption, are similar to the indicators in the OECD green growth set. IGrowGreen also enables the construction of aggregated performance scores, an objective that is not pursued in the OECD’s work.
3.6 Key findings from the analysis of GGIs application in practice
As a result of examining the country specific progress related to implement a green growth strategy, the following main findings emerge:
While the original grouping of indicators was altered only marginally, countries attached different importance on the various groups and individual indicators of the OECD set. They either excluded indicators or added new ones, depending on their national circumstances;
Data sources used to construct the indicators include primarily official statistics, but also data from administrative sources and in some cases data from research studies. The sub-group of policy response indicators was the most problematic part for almost all countries, be they developed, emerging, or developing economies;
The length of the time series and the number of GGI used by countries vary. Several countries lack data over long periods. The latter limits the indicators’ usefulness for assessing the results of policies;
Several countries used comparison with policy targets and international trends. In this context, an enhanced availability of international databases would be useful for countries;
In many instances, national statistical agencies took the lead in preparing indicator-based reports. It is not yet clear how these reports have been linked to policy planning and performance monitoring by the entire government;
A geographic disaggregation of indicators, going to the sub-national level, is missing in all reports prepared so far;
Two pioneers of GGIs testing that produced their first national reports in 2011 – the Netherlands and the Czech Republic – have issued updates of their national indicator-based reports in 2012 and 2013, respectively, and in case of the Netherlands also for 2015.
Several countries included visual elements in their reporting, such as dashboards, diagrams or charts;
The process of the national GGI identification has commonly been done in a collaborative way among relevant institutions. At the same time, particularly developing countries may face institutional challenges at the phase of indicator identification when there is a lack of information exchange between departments and institutions;
Continuous feedback from country-level application is important for the further development and refinement of the indicator set. There are several avenues for the sharing of experiences and good practices. An essential one is co-operation within international organisations leading the work on GGIs, such as the OECD, the GGGI, UNEP, UNECE and the World Bank, or joint platforms established by them, for example the GGKP and the UNECE Working Group on Environmental Monitoring and Assessment (WGEMA).

102
CHAPTER 4: DEVISING NATIONAL SETS OF GREEN GROWTH INDICATORS
4.1 Overall approach
The aim of this chapter is to provide suggestions for setting up a national green growth measurement framework. These have been elaborated based on lessons learned from the practical application of GGIs as well as ongoing work with countries as part of the EaP GREEN programme and the work towards implementing SEIS. It is proposed that interested countries, which have not been applying the OECD green growth measurement framework so far conduct a national pilot testing of the GGI set.
The pilot testing should result in two complementary products:
An expert paper addressing the needs and feasibility for a regular measurement of progress towards green growth in the country;
A data-based publication resulting from the pilot application of the OECD set of GGIs based on currently available data.
The process of the national-level reflection on the measurement framework should be structured and participatory, with clear milestones and timeframes. The following main steps are suggested – though the scope of work may need adjustment depending upon the national context:
1. Step 1: Identifying awareness and demand;
2. Step 2: Setting a schedule for a pilot testing;
3. Step 3: Identifying stakeholders;
4. Step 4: Expert analysis: Development of a national measurement framework, including
1. Identifying indicators for the national measurement framework;
2. Identifying data sources and providers;
3. Structuring the measurement framework;
4. Identifying headline indicators;
5. Analysing steps towards a regular measurement practice;
5. Step 5: Stakeholder consultations;
6. Step 6: Finalisation of the expert paper;
7. Step 7: Finalisation of the data-based publication on the application of the GGIs;
8. Step 8: Dissemination of the results and implementation of follow up action.

The stsuggested ithe success
Figure 32.
4.2 Identif
In a fithe demand
Awareness
Abcog
Treinb
takeholders in this chaptesful pilot test
Testing a n
fying awaren
irst step towd for such an
Are decision-etween econosts of policyrowth)?
To what degreesources mannvestment clecause of po
to be involver are visualting of a nati
ational meas
ness and dem
ards the appn exercise sho
makers in ecnomic and eny inaction on
ee are decisinagement onimate, as we
oor environm
ved, actions ised in Figuronal green g
urement fram
mand
plication of aould be asses
conomic, envnvironmentaln environmen
on-makers an fiscal revenell as about thmental and na
103
needed andre 32. In the
growth measu
mework for gr
a green growssed. The fol
vironmental l policies, in ntal challeng
aware of the inues, the levehe degree to atural resourc
d products tofollowing, e
urement fram
reen growth:
wth measuremllowing ques
and sectoral particular th
ges, nationall
impact of ineel playing fiewhich acces
ces managem
o be created each of the e
mework is dis
stakeholders
ment framewstions can gu
ministries awe potential mly and global
efficient envield for busines to markets
ment?
as part of teight proposescussed in de
s, actions an
work, the awauide this asse
ware of the imonetary andlly (future sh
ironmental aesses and the may be restr
the process ed steps for etail.
d products
areness and ssment:
nterface d social hocks to
and natural e ricted

104
Are decision-makers aware about impacts of economic decisions on people’s well-being, including on health and health-related costs of inaction and losses from environmental degradation?
Are decisions makers aware of how green growth can open up new sources of growth?
Demand
Is there demand for information on the issues mentioned-above that can support policy-making? Where does the demand come from (citizens, businesses…)?
What data collection needs at the interface of economic and environmental policies stem from the current legislation?
High awareness of the opportunities through green growth and demand for an analytical base measuring it may lead to strong support among decision-makers for the exercise. Where the awareness and demand is still nascent, a pilot application of the OECD set can in fact catalyse such awareness and demand, and the development of green growth policies. Ideally, the process of the application of the green growth measurement should be run in parallel with the development of a Green Growth Strategy. However, for countries that do not have agreed on a Green Growth Strategy yet, the launch of a pilot study on green growth measurement may be a useful way to take stock of the current situation and help to devise such a strategy.
4.3 Setting a schedule for a pilot testing
Experience from OECD countries that went through the pilot testing on green growth measurement shows that good results can be achieved within a relatively short length of time. A prerequisite for a timely implementation is good interagency communication and a clear agreement on milestones and division of responsibilities. At an early stage of the project a timeline for the pilot testing should be defined in general lines, with milestones such as the following:
Identification of relevant stakeholders;
Expert analysis;
Stakeholder consultations;
Finalisation of the expert paper;
Finalisation of the data-based publication on the application of the GGIs;
Dissemination of results with the policy-makers and the public.
When setting a timeline, it should be taken stock of the internal and external capacities available for the exercise both in terms of human and financial resources, so that realistic targets can be set. It may be useful for the bodies initiating the process to develop a provisional timeline which is then further elaborated in cooperation with national stakeholders. The milestones for the pilot testing can fit into the wider timeframe of developing a Green Growth Strategy.

105
4.4 Identifying stakeholders
It is highly desirable for the Ministry of Economy to assume leadership in the process since its ultimate goal is to better inform economic decisions and policies. At the same time, the major environmental authority should also have a strong voice in the process and statistical agencies should be involved as their expertise in data collection and reporting can be of benefit for the effective implementation of the process. The involved ministries may wish to establish an inter-ministerial supervisory group for a regular exchange during the process. The group should ensure political support for the project and be able to decide on follow up policy action. Experiences from other countries have shown that continuity and coherence at the level of national stakeholders are key ingredients for a successful exercise. Therefore, the governmental stakeholders should consider obtaining a formal agreement on responsibilities and the schedule (see 4.3) for the exercise.
Leadership in the actual preparation of the data-based publication resulting from the pilot application of the GGIs could be taken by an institution within the government or outside it. With respect to experiences in processing and disseminating, the national statistical agency may be a natural choice.
Development partners could usefully contribute through knowledge transfer and assuming a facilitator role in the policy dialogue involving different sectors and stakeholder groups. Furthermore it should be considered to make use of international forums for the exchange of good practices in the measurement of green growth (Chapter 3.6).
Transparency should be an underlying characteristic of the whole exercise. Stakeholders from academia, non-governmental organisations (NGO), and actors of the private sector may wish to contribute to the process. The relevant stakeholders should openly discuss opportunities and constraints for launching green growth measurement in stakeholder consultations (Chapter 4.6).
The case of Kyrgyzstan can serve as an example for the involvement of various stakeholders in the pilot testing of a green growth measurement framework (Box 42).
Box 42. Towards measuring the green transformation of the economy in the Kyrgyz Republic
In the Kyrgyz Republic the national programme to measure progress towards green growth was launched in preparation of the Rio+20 Summit in 2012. The Rio+20 Preparatory Conference, convened by the Kyrgyz Government
in cooperation with several development partners, the Central Asian Regional Environmental Centre and UNDP, discussed a preliminary vision of the country’s progress towards green growth and the need for sound indicators to
monitor this process. The group agreed on the need for more detailed debates and planning after the Earth Summit. This process involved numerous governmental and non-governmental stakeholders, including central planning and
sectoral ministries, environmental authorities, academia, NGOs, and actors of the private sector.
After the Summit, a scoping meeting on the pilot testing of Green Growth Indicators was convened by the Kyrgyz Ministry of Economy. Its participants included officials from the host Ministry, the State Agency on Environmental Protection and Forestry Management, the National Statistical Committee, UNDP and the Central Asia’s Regional Environmental Centre. The group discussed OECD’s work on green growth and GGIs and it was decided that the
national measurement framework should be based on the OECD framework for measuring green growth.
A close link between this initiative and the UNDP-UNEP “Poverty and Environment” Initiative (PEI) in the Kyrgyz Republic was established. A group of national experts, set up under the UNDP-UNEP Poverty-Environment Initiative (PEI) was tasked to perform the technical work on GGI, while a steering group of high-level officials, PEI Programme
Board chaired by the Ministry of Economy, supervises its outcomes. The work on GGI in the Kyrgyz Republic has been possible thanks to the financial support of the PEI. It was developed a package of documents including Matrix of GGI,
Road Map, Newspaper indicators, Passport of indicators describing sources, measurements, role of an indicator in green growth etc.
106
In the country, sustainable development has been identified as a key instrument to tackle poverty and to facilitate growth. Like in other countries in the region, environmental and developmental challenges are closely interlinked, as environmental stressors such as radioactive waste from mining and growth of coal-based power plants continue to exert pressure on the environment.
The following sectors have been identified as a priority for the green growth measurement framework in the Kyrgyz Republic: (i) water; (ii) energy; and (iii) agriculture.
Since 2013 the statistical annual publication “The Environment in the Kyrgyz Republic” of the National Statistical Committee, contains a section on green growth indicators existing in the system of the state statistics and includes data on more than 40 GGIs.
In February 2015 the government of the Kyrgyz Republic approved a set of 65 indicators to monitor and evaluate the country’s progress towards a green transformation of the economy, and a corresponding decree was signed by the Prime Minister. The set of indicators is based on the OECD framework. The decree also specifies the data sources as well as the reporting frequency for each indicator.
4.5 Expert analysis: Development of a national measurement framework
Expert analysis is needed to help define the scope and structure of the national green growth measurement framework. While the experts selected for the conduction of the analysis could be government professionals, it may also make sense to consider involving independent experts (e.g. from NGOs or academia). The experts should report to the coordination group and are responsible for preparing the expert paper on the needs and feasibility for a regular measurement of progress towards green growth. Moreover, the experts could contribute to preparing the data-based publication.
The expert analysis should use the OECD GGI set as a starting point to clarify the following:
In how far can the suggested OECD indicators be devised based on the currently collected data?
Which of the OECD GGIs reflect national policy priorities and what indicators are not relevant nationally?
What additional indicators not being part of the OECD set are needed to reflect national policy priorities?
What contextual information is necessary in order to interpret the green growth indicators correctly or to supplement them?
What headline indicators could be used?
This analysis should result in a report assessing the feasibility of aligning a national measurement framework with the OECD set of GGIs. Among others, it should contain a clear expert opinion on feasible GGIs from the OECD list as well as relevant additional GGIs for the national-level use. Moreover, it should be discussed, which steps would be necessary to adjust the procedures for data collection by statistical agencies and other bodies to enable the regular collection of data underpinning the GGIs.
4.5.1 Identifying indicators for the national measurement framework
The expert analysis should start by comparing the existing national framework(s) for the measurement of the state of the environment and the economy with the proposed set of OECD GGIs. An existing

107
national framework could be, for instance, an adopted set of environmental indicators as part of the SEIS, or a preliminary framework for green growth monitoring devised in preparation of the Rio+20 Summit.
For each of the OECD GGIs (Chapter 2), the following selection criteria should be assessed:
Data availability
Is the indicator already monitored?
If so, are the data regularly updated, and what time series are available?
If the indicator is not monitored currently, would it be relevant for adoption in the country’s context?
International alignment
Is the definition of this indicator and the methodology for data collection aligned with the SEEA standard or the OECD definitions?
If not so, what are the differences between the national approach and the international standards?
Data validation and analysis
Are data validation and analysis procedures in place linked to the indicator?
If not, do capacities exist to set these procedures up?
Policy relevance
Is the indicator easy to interpret and transparent?
Does it provide a basis for comparisons across countries to enable international benchmarking?
Is there national policy targets and/or priorities linked to this indicator?
Is it linked to the interface between economic and environmental policy?
Dissemination
Is this indicator publicly disclosed?
If so, where is it published and with what periodicity?
If it is not disseminated yet, would it be possible to disclose it?
The selection of the relevant OECD GGIs should be made based on a thorough assessment and weighting of these criteria in accordance with national priorities. At the same time, given that the OECD framework is not exhaustive and may not fully reflect country priorities, it is necessary to define additional nationally monitored indicators that could be added to the set. Examples for country specific circumstances that may need to be reflected would be higher than average vulnerability to climate change and/or erosion due to geographic position. For further examples please refer to Chapter 3.
For any indicator in addition to the OECD set, a feasibility analysis using the selection criteria mentioned above should be performed.

108
4.5.2 Identifying data sources and providers
For each indicator that is selected for the framework, a detailed analysis of the data sources should be performed. It is important to ensure that the data that are available are actually suitable to underpin the selected indicator in terms of its scope, the methodology of its production and the time-series covered. Contemplable national sources of data include the national statistical offices, sectoral ministries and agencies as well as research studies.
When the suitable data providers are identified, agreements on the exchange of data and information between the relevant agencies should be reached. To ensure a straightforward flow of data and information, it is advisable to include all relevant data providers into the regular stakeholder meetings, so that the exchange can be planned directly between the responsible agencies.
For the EaP countries, potential data sources are discussed for each OECD GGI in chapter 2 (sections on “data sources and availability”).
4.5.3 Structuring the measurement framework
Though the OECD set of indicators is structured around five groups (see Chapter 1), it does not mean that the national set must follow the same logic. A different structuring can be used if a new structure would be more suitable from promoting awareness and knowledge about green growth, facilitating green growth planning in the country, and monitoring progress. A number of countries that have applied the framework made use of this possibility (Chapter 3). It has to be mentioned that the available set and methodologies are tailored, in particular, for a cross-cutting use. Sectoral GGIs may need to be identified, starting with priority sectors.
4.5.4 Identifying headline indicators
To facilitate the communication of results of the green growth assessment with policy makers, the media and citizens, headline indicators should be identified nationally59. The selection of headline indicators can be guided by the following five criteria:
9. Covering key national issues/priorities related to green growth;
10. Capturing the nexus between the environment and the economy;
11. Reflecting the multiple dimensions of green growth consistently with the national green growth measurement framework;
12. Strong measurability; and
13. Comparability across countries to enable international benchmarking.
While all of these criteria merit full consideration, the environment-economy nexus needs to be highlighted.
59 For its analysis on the level of OECD member states, OECD (2014a) suggests six headline indicators: carbon and material productivity, environmentally adjusted multifactor productivity, a natural resource index, changes in land use and cover, and population exposure to air pollution (Chapter 1.5). As national policy priorities and data availability differ, however, it is likely that a nationally adjusted set of headline indicators better represents the specific situation in EaP countries.

109
Another key consideration is the ease with which the indicator could be communicated to multiple users. National stakeholders may want to enlarge this list of criteria keeping it manageable. Countries are invited to add to their headline indicators an indicator reflecting economic opportunities arising from green growth. Ideally, the list of headline indicators should be sound and concise at the same tame. It is recommended to select about 5-8 headline indicators.
4.5.4 Analysing steps towards a regular measurement practice
In order to ensure that the pilot testing of green growth indicators is transposed into a regular measurement practice, a thorough analysis of the institutional framework is required. Such analysis should take stock of the institutional procedures for data collection and analysis and suggest steps to adjust the procedures for data collection by statistical agencies and other bodies to enable the regular collection of data underpinning the GGIs. Moreover, it should be assessed which institutional procedures are in place to link the measurement of environmental and economic information to decision-making and disseminate such information regularly.
4.6 Stakeholder consultations
Electronic and face-to-face consultations need to be organised to facilitate the exchange between the stakeholders involved in the project (Chapter 4.4). Regular exchange within the inter-ministerial supervisory group should be held throughout the process.
Moreover, wider consultations should be organised that should take the form of enlarged meetings of the inter-ministerial supervisory group with the involved experts and stakeholders from NGOs, academia and private sector. It is advisable to organise such consultations at different stages of the project, at least
14. At an early stage of the project, to discuss the demand for green growth measurement, goals and schedules and to agree on key issues that should be covered by the expert analysis.
15. When the results of the expert analysis are available, to provide feedback to the experts that can be considered for the expert paper and to coordinate the dissemination of the results and implementation of follow up action.
4.7 Finalisation of the expert paper
The expert analysis on the needs and feasibility for a regular measurement of progress towards green growth in the country should result in a clear product. The resulting expert paper should address the findings in terms of the development and application of the national measurement framework on green growth and share lessons learned from the pilot project. It should be structured around the considerations and criteria outlined in Chapter 4.5. It is recommended that the paper is finalised after the stakeholder consultations, so that input from the various groups involved in the process can be considered.
Based on the experiences from the pilot project, the paper should also present an outline for further steps in monitoring green growth that can be used for the implementation of follow up action (see 4.9).
4.8 Finalisation of the data-based publication on the application of GGIs
A second core product of the process should be a publication (preferably by the National Statistical Agency) resulting from the pilot application of the OECD set of GGIs. It should present the indicators selected for the national framework and show trends and analyses based on currently available data. Although the definition of priorities and style of the document bears with its producers, it is recommended

110
that in accordance with the 2014 OECD report on GGIs and international pilot studies a number of issues are covered for each selected indicator:
A brief definition of the indicator including the policy context;
A discussion of data sources and the measurability of the indicator;
An analysis of the available data that may include trends, assessments of policy targets and international comparisons. The analysis should be supported by visuals such as graphs, charts, and dashboards;
Links and references for further reading.
4.9 Dissemination of the results and implementation of follow up action
After the core products of the pilot test are prepared, a communication strategy needs to be developed to make the application of GGIs and the expert paper known by relevant stakeholders. This should include a shared (one-stop-shop) web site with easy accessible online documents. Findings should also be presented at relevant national and international forums.
At the same time, the communication of results to the public through national media should be supported. It is advisable to centre public communication on the set of selected headline indicators. Those should be regularly disclosed through mass media and other communication channels. Visual elements, such as dashboards, can be used to facilitate public access to complex information.
Based on the suggestions made in the expert paper, the supervisory group should coordinate and implement follow up action. This could include, for example, the identification of focal points for green growth measurement in the relevant ministries. Moreover, the green growth measurement framework can be used for regular reporting. The Kyrgyz Republic, for example, includes a section on GGIs in an annual statistical publication. It is recommended that the stakeholders explore how the green growth measurement framework can be included in the reporting system and agree on responsibilities and time frames for the establishment of a regular reporting on green growth.

111
REFERENCES
CAF-OECD-UNIDO (2012), Monitoring Green Growth in the Latin America and the Caribbean (LAC) Region: Progress and Challenges, http://www.oecd.org/greengrowth/Booklet_English_LAT%202015.pdf.
Czech Statistical Office (2011), Green Growth in the Czech Republic - Selected Indicators, https://www.czso.cz/csu/czso/green-growth-in-the-czech-republic-2010-a591berarf.
Czech Statistical Office (2013): Green Growth in the Czech Republic – Selected Indicators, https://www.czso.cz/csu/czso/green-growth-in-the-czech-republic-selected-indicators-2013-whvt3a3q88.
Danish Energy Agency; Ministry of Climate, Energy and Building; Danish Business Authority; Ministry of Business and Growth; Danish Environmental Protection Agency (EPA) and Ministry of Environment (2012), Green production in Denmark – and its significance for the Danish economy, http://www.ens.dk/sites/ens.dk/files/policy/green-production-denmark-contributes-significantly-danish-economy/Green%20production%20in%20Denmark%20-%20web%20111212.pdf.
Eurostat (2009), The Environmental Goods and Services Sector: A data collection handbook, Luxembourg, http://unstats.un.org/unsd/envaccounting/londongroup/meeting14/LG14_Bk6a.pdf.
Federal Statistical Office of Germany (Destatis) (2012), Sustainable Development in Germany – Indicator Report, https://www.bundesregierung.de/Content/EN/StatischeSeiten/Schwerpunkte/Nachhaltigkeit/Anlagen/2012-05-24-indikatorenbericht-2012-englisch.pdf?__blob=publicationFile&v=2.
Federal Statistical Office of Germany (Destatis) (2013), Test of the OECD Set of Green Growth indicators in Germany, www.destatis.de/EN/Publications/Specialized/EnvironmentalEconomicAccounting/TestOECDGreenGrowth5850016129004.pdf?__blob=publicationFile.
Green Growth Knowledge Platform (GGKP) (2013), Moving towards a common approach on green growth indicators, Green Growth Knowledge Platform Scoping Paper, April 2013, http://www.greengrowthknowledge.org/Pages/Reports.aspx.
Hak T., Kovanda J, West J, Schandl H and Krausmann F (2013) Resource Efficiency: economics and outlook for Easter Europe, the Caucasus and Central Asia http://www.grid.unep.ch/products/3_Reports/REEO_for_EECCA.pdf
Haščič, I. and M. Migotto (2015), Measuring environmental innovation using patent data, OECD Environment Working Papers, No. 89, OECD Publishing, Paris, http://dx.doi.org/10.1787/5js009kf48xw-en.
International Labour Office (ILO) (2013), Statistics of work, employment and labour under utilization, Report for discussion at the 19th International Conference of Labour Statisticians (Geneva, 2–11 October 2013), http://www.ilo.org/wcmsp5/groups/public/---dgreports/---stat/documents/publication/wcms_220535.pdf.

112
Intergovernmental Panel on Climate Change (IPCC) (2006), 2006 IPCC Guidelines for National Greenhouse Gas Inventories, Prepared by the National Greenhouse Gas Inventories Programme, http://www.ipcc-nggip.iges.or.jp/public/2006gl/.
International Union for Conservation of Nature (IUCN) (2011), IUCN Red List Categories and Criteria, Version 3.1 (second edition), http://www.iucnredlist.org/technical-documents/categories-and-criteria/2001-categories-criteria.
Nordic Co-operation (2012), Measuring Green Jobs?: An Evaluation of Definitions and Statistics for Green Activities. Nordic Council of Ministers.
OECD (2002), Frascati Manual, Proposed Standard Practice for Surveys on Research and Experimental Development, 6th Edition, OECD Publishing, http://www.oecd.org/innovation/inno/frascatimanualproposedstandardpracticeforsurveysonresearchandexperimentaldevelopment6thedition.htm.
OECD (2003), OECD Environmental Indicators: Development, measurement and use, OECD Reference Paper, http://www.oecd.org/env/indicators-modelling-outlooks/24993546.pdf.
OECD (2011a), Towards Green Growth: Monitoring Progress: OECD Indicators, OECD Green Growth Studies, OECD Publishing, doi: 10.1787/9789264111356-en.
OECD (2011b), Towards Green Growth, OECD Green Growth Studies, OECD Publishing. doi: 10.1787/9789264111318-en, http://www.oecd-ilibrary.org/environment/towards-green-growth_9789264111318-en.
OECD (2012), OECD Environmental Performance Reviews: Germany 2012, OECD Publishing, http://www.oecd.org/env/country-reviews/germany2012.htm.
OECD (2012b), OECD Environmental Outlook to 2050: The Consequences of Inaction, OECD Publishing, http://dx.doi.org/10.1787/9789264122246-en.
OECD (2013a), What have we learned from attempts to introduce green-growth policies?, OECD Green Growth Papers, March 2013, http://www.oecd-ilibrary.org/environment/what-have-we-learned-from-attempts-to-introduce-green-growth-policies_5k486rchlnxx-en.
OECD (2013b), How's Life? 2013: Measuring Well-being, OECD Publishing, http://www.oecd.org/statistics/how-s-life-23089679.htm.
OECD (2013c), OECD Compendium of Productivity Indicators 2013, OECD Publishing, http://dx.doi.org/10.1787/pdtvy-2013-en.
OECD (2013d), Environment at a Glance 2013: OECD Indicators, OECD Publishing. http://dx.doi.org/10.1787/9789264185715-en
OECD (2014a), Green Growth Indicators 2014, OECD Green Growth Studies, OECD Publishing, http://www.oecd.org/env/indicators-modelling-outlooks/green-growth-indicators-2013-9789264202030-en.htm.
OECD (2014b): Towards Green Growth in Southeast Asia, OECD Green Growth Studies,OECD Publishing, http://dx.doi.org/10.1787/9789264224100-en.

113
OECD, UNECE, UNEP and EEA (2015), The Shared Environmental Information System And
Green Growth. Mapping of UNECE environmental and OECD green growth indicators and their dataflows, Background paper for the Regional Workshop on the Shared Environmental Information System and Green Growth for countries of Eastern Europe, the Caucasus and Central Asia, Paris, France 10 - 11 March 2015, http://www.oecd.org/environment/outreach/Paper-OECD-UNECE-indicators-mapping-dataflows-March2015.pdf.
Schreyer, P. and Obst, C., (2015), Towards Complete Balance Sheets in the National Accounts: The Case of Mineral and Energy Resources, OECD Green Growth Papers, No. 2015/02, OECD Publishing, Paris.
Statistical Office of the Republic of Slovenia (2014), Green Growth indicators for Slovenia, http://www.oecd.org/greengrowth/Green%20growth%20indicators%20in%20Slovenia%202014.pdf.
Slovak Environment Agency (2014), Selected Green Growth Indicators in the Slovak Republic, http://www.oecd.org/greengrowth/Green%20Growth%20Indicators%20in%20the%20Slovak%20Republic.pdf.
Statistics Korea (2012), Korea's Green Growth based on OECD Green Growth Indicators. www.oecd.org/greengrowth/Korea's%20GG%20report%20with%20OECD%20indicators.pdf.
Statistics Korea (2013), Korean Green Growth Indicators 2013, http://kostat.go.kr/portal/eng/pressReleases/15/index.board?bmode=download&bSeq=&aSeq=346871&ord=1
Statistics Netherlands (2011), Green Growth in the Netherlands, http://www.cbs.nl/NR/rdonlyres/65FA4466-853C-4223-8B69-7C7872E37DC3/0/2011p44pub.pdf.
Statistics Netherlands (2013), Green growth in the Netherlands, http://www.cbs.nl/NR/rdonlyres/2C613080-F668-439C-B12C-98BF361B5ADF/0/2013p44pub.pdf.
Statistics Netherlands (2015), Green growth in the Netherlands, http://download.cbs.nl/pdf/green-growth-in-the-netherlands-2015.pdf.
Sullivan, D. (1971), A Single Index of Mortality and Morbidity, HSMHA Health Reports, 86, 347–354.
UN Water (2012), Inter-organization Water Statistics Harmonization on the UN-Water Key Water Indicator Portal, Working paper. http://www.unwater.org/KWIP/doc/UN-Water_KWIP_-_Harmonization.pdf.
UNECE (2011), Canberra Group Handbook on Household Income Statistics, Second Edition, http://www.unece.org/fileadmin/DAM/stats/groups/cgh/Canbera_Handbook_2011_WEB.pdf.
UNEP (2011), Towards a Green Economy – Pathways to Sustainable Development and Poverty Eradication, http://www.unep.org/greeneconomy.
UNEP (2012), Measuring Progress towards an Inclusive Green Economy,

114
http://www.unep.org/greeneconomy/Portals/88/documents/research_products/Measuring%20Progress%20report.pdf.
UNEP (2014), Using Indicators for Green Economy Policymaking, http://www.unep.org/greeneconomy/Portals/88/documents/GEI%20Highlights/UNEP%20INDICATORS%20GE_for%20web.pdf.
UN, EU, FAO, IMF, OECD, and World Bank (2014), System of Environmental-Economic Accounting 2012 - Central Framework, http://unstats.un.org/unsd/envaccounting/seeaRev/SEEA_CF_Final_en.pdf.
United Nations University International Human Dimensions Programme on Global Environmental Change (UNU-IHDP) and United Nations Environment Programme (UNEP) (2012), Inclusive Wealth Report 2012. Measuring progress toward sustainability, Cambridge University Press, http://www.unep.org/pdf/IWR_2012.pdf.
UNU-IHDP and UNEP (2014). Inclusive Wealth Report 2014. Measuring progress toward sustainability. Cambridge: Cambridge University Press
World Bank (2006), Where Is The Wealth Of Nations? Measuring Capital for the 21st Century. World Bank Publications, http://siteresources.worldbank.org/INTEEI/214578-1110886258964/20748034/All.pdf.
World Bank (2011), The Changing Wealth of Nations. Measuring Sustainable Development in the New Millennium, World Bank Publications, http://siteresources.worldbank.org/ENVIRONMENT/Resources/ChangingWealthNations.pdf.
World Bank (2012), Inclusive Green Growth. The Pathway to Sustainable Development, World Bank Publications, http://siteresources.worldbank.org/EXTSDNET/Resources/Inclusive_Green_Growth_May_2012.pdf.

115
ANNEX: THE OECD SET OF GREEN GROWTH INDICATORS - OVERVIEW BY GROUP AND BY THEME
The list of indicators presented includes: M= Main indicators
(numbered and in bold), and their components or supplements (numbered) P = Proxy indicators
(bulleted) when the main indicators are currently not measurable
Each indicator is accompanied with an evaluation of the measurability of the underlying data:
S = Short term basic data currently available for a majority of OECD countries;
M= Medium term basic data partially available, but calling for further efforts to improve their quality (consistency, comparability, timeliness) and their geographical coverage (number of countries covered)
L = Long term basic data not available for a majority OECD of countries, calling for a sustained data collection and conceptual efforts.
Group/theme Proposed indicators Type Measurability
The socio-economic context and characteristics of growth
Economic growth, productivity and competitiveness
Economic growth and structure -- GDP growth and structure -- Net disposable income (or net national income)
M M
S S/M
Productivity and trade -- Labour productivity -- Multi-factor productivity -- Trade weighted unit labour costs -- Relative importance of trade: (exports + imports)/GDP
M M M M
S M M S
Inflation and commodity prices -- Consumer price index -- Prices of food; crude oil; minerals, ores and metals
M M
S S
Labour market, education and income
Labour markets -- Labour force participation -- Unemployment rate
M M
S S
Socio-demographic patterns -- Population growth, structure and density -- Life expectancy: years of healthy life at birth -- Income inequality: GINI coefficient -- Educational attainment: level of and access to education
M M M M
S S/M S/M S

116
Group/theme Proposed indicators Type Measurability
The environmental and resource productivity of the economy
Carbon & energy productivity
1. CO2 productivity 1.1. Production-based CO2 productivity M S
GDP per unit of energy-related CO2 emitted
1.2. Demand-based CO2 productivity M S/M
Real income per unit of energy-related CO2 emitted
2. Energy productivity
2.1. Energy productivity M S
GDP per unit of TPES
2.2. Energy intensity by sector (manufacturing, transport, households, services)
M S/M
2.3. Share of renewable energy sources M S
in TPES, in electricity production
Resource productivity
3. Material productivity (non-energy)
3.1. Demand-based material productivity M M/L
(comprehensive measure; original units in physical terms) Real income per unit of materials consumed, materials mix
3.2. Production-based (domestic) material productivity P S/M
GDP per unit of materials consumed, materials mix
- Biotic materials: food, other biomass
- Abiotic materials: metallic minerals, industrial minerals
3.3. Waste generation intensity and recovery ratios M M/L
by sector, per unit of GDP or value added, per capita
3.4. Nutrient flows and balances (N, P) M L
Nutrient balances in agriculture (N, P) P S/M
per agricultural land area and change in agricultural output
4. Water productivity M M
Value added per unit of water consumed, by sector
Multifactor productivity
5. Multifactor productivity reflecting environmental services (comprehensive measure; original units in monetary terms)
M M/L
The natural asset base
Natural resource stocks
6. Index of natural resources M M
Comprehensive measure expressed in monetary terms
Renewable stocks 7. Freshwater resources M S/M Available renewable natural resources (groundwater, surface water) and related abstraction rates (national, territorial)
8. Forest resources M S/M Area and volume of forests; stock changes over time 9. Fish resources M S Proportion of fish stocks within safe biological limits (global)
Non-renewable stocks
10. Mineral resources: available (global) stocks or reserves for selected minerals: metallic minerals, industrial minerals, fossil fuels, critical raw materials; and related extraction rates
M M
Biodiversity and ecosystems
11. Land resources: land cover conversions and cover changes from natural state to artificial state
M M
Land use: state and changes P S 12. Soil resources: degree of topsoil losses on agricultural land, on other
land M M
Agricultural land area affected by water erosion, by class of erosion P S/M 13. Wildlife resources (to be further refined) Trends in farmland or forest bird populations or in breeding bird
populations P S/M

117
Group/theme Proposed indicators Type Measurability
Species threat status, in % species assessed or known P S Trends in species abundance P S/M
The environmental dimension of quality of life
Environmental health and risks
14. Environmentally induced health problems & related costs M L
(e.g. years of healthy life lost from degraded environmental conditions)
Population exposure to air pollution P S/M
15. Exposure to natural or industrial risks and related economic losses M L
Environmental services and amenities
16. Access to sewage treatment and drinking water M S 16.1. Population connected to sewage treatment
(at least secondary, in relation to optimal connection rate)
16.2. Population with sustainable access to safe drinking water Economic opportunities and policy responses
Technology and innovation
17. R&D expenditure of importance to green growth M S/M - Renewable energy sources (% of energy-related R&D) S - Environmental technology (% of total R&D, by type) S - All-purpose business R&D (% of total R&D) S
18. Patents of importance to green growth (% of country applications under the Patent Cooperation Treaty)
M S/M
- Environment-related and all-purpose patents S/M - Structure of environment-related patents S/M 19. Environment-related innovation in all sectors M M
Environmental goods and services
20. Production of environmental goods and services (EGS) P M - Gross value added in the EGS sector (% of GDP) - Employment in the EGS sector (% of total employment)
International financial flows
21. International financial flows of importance to green growth % of total flows and % of GNI
M L
21.1. Official development assistance S 21.2. Carbon market financing S 21.3. Foreign direct investment M/L
Prices and transfers 22. Environmentally related taxation - Level of environmentally related tax revenue (% of GDP, % of total tax revenues; in relation to labour-related taxes)
M S
- Structure of environmentally related taxes (by type of tax base) S 23. Energy pricing
(share of taxes in end-use prices) M S
24. Water pricing and cost recovery (tbd) M S/M To be complemented with indicators on: Environmentally related subsidies M/L Environmentally related expenditure: level and structure L
Regulations and management approaches
25. Indicators to be developed .. ..
Training and skill development
26. Indicators to be developed .. ..
Source: OECD (2014a).