Mean, Median, Mode Social Statistics. This week Mean Median Mode 2.
20
Mean, Median, Mode Social Statistics
-
Upload
allyson-merritt -
Category
Documents
-
view
246 -
download
4
Transcript of Mean, Median, Mode Social Statistics. This week Mean Median Mode 2.
Mean, Median, Mode
Social Statistics
This week
• Mean• Median• Mode
2
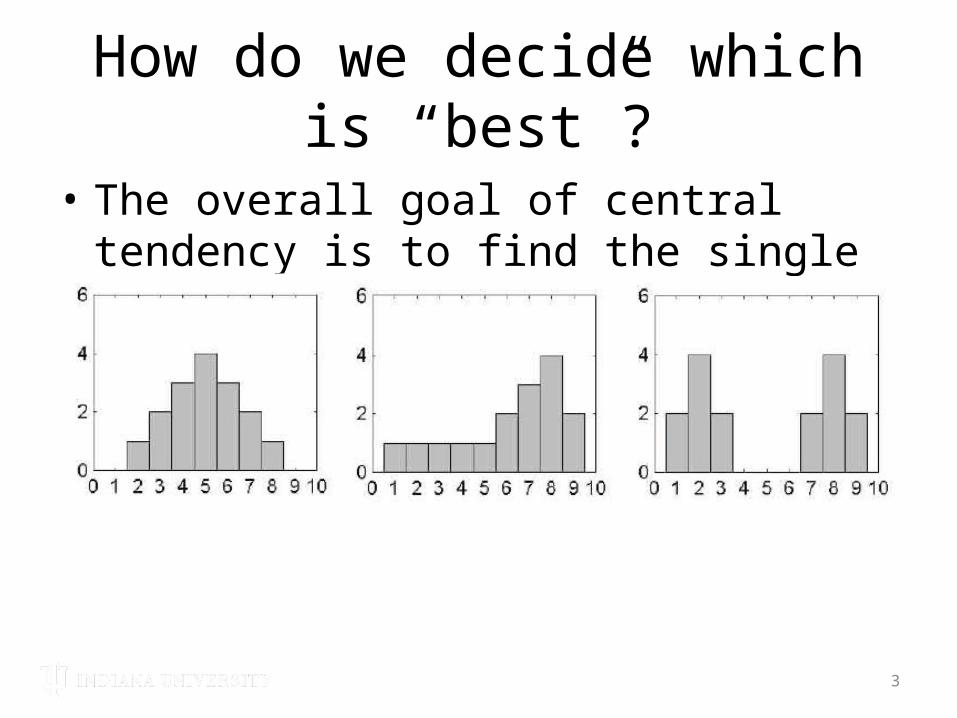
How do we decide which is “best”?
• The overall goal of central tendency is to find the single score that is most representative for the distribution.
3
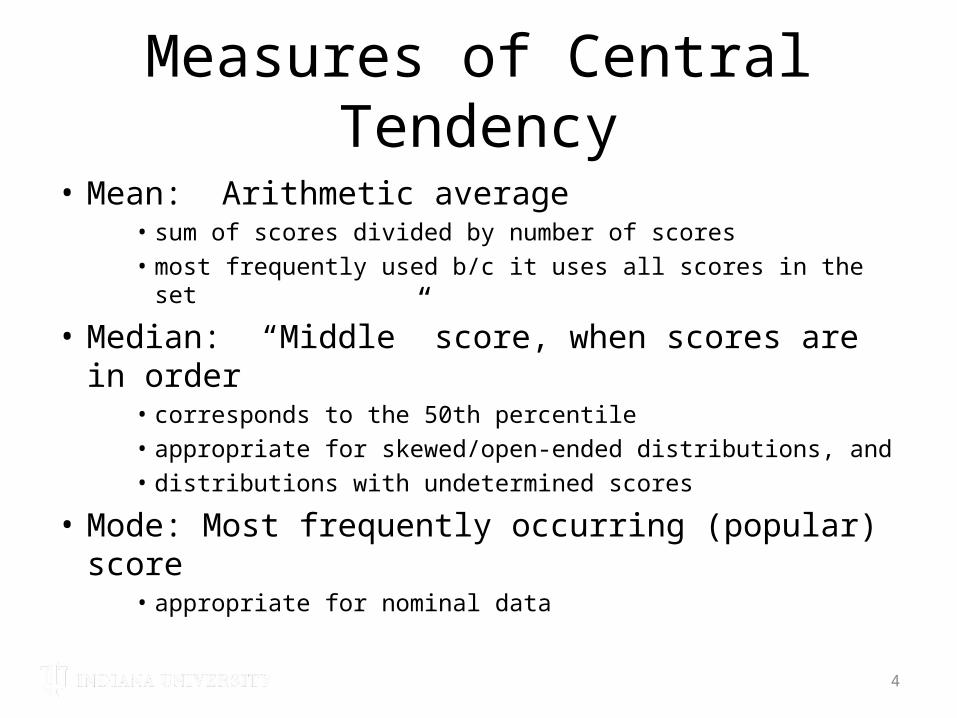
Measures of Central Tendency
• Mean: Arithmetic average• sum of scores divided by number of scores• most frequently used b/c it uses all scores in the set
• Median: “Middle” score, when scores are in order
• corresponds to the 50th percentile• appropriate for skewed/open-ended distributions, and• distributions with undetermined scores
• Mode: Most frequently occurring (popular) score• appropriate for nominal data
4
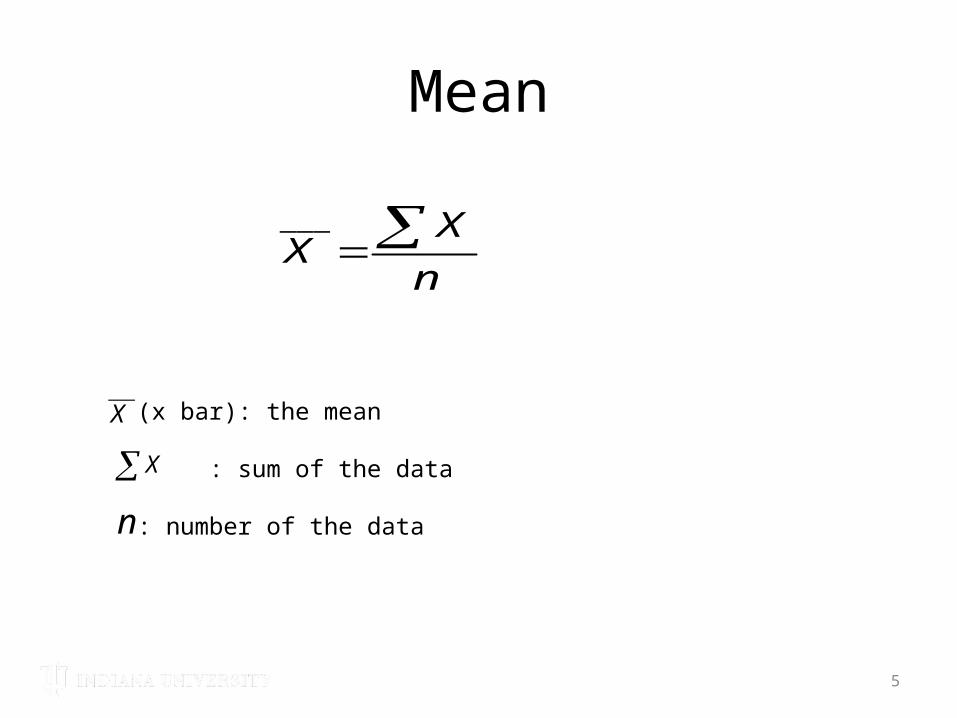
Mean
5
n
XX ___
(x bar): the mean
: sum of the data
: number of the data
___
X
X
n
Mean
• The sample mean is the measure of central tendency which can approximate the population mean
• The mean is very sensitive to extreme scores– It can put the mean in some extreme direction– Make it less representative– Less useful as a measure of central tendency
6
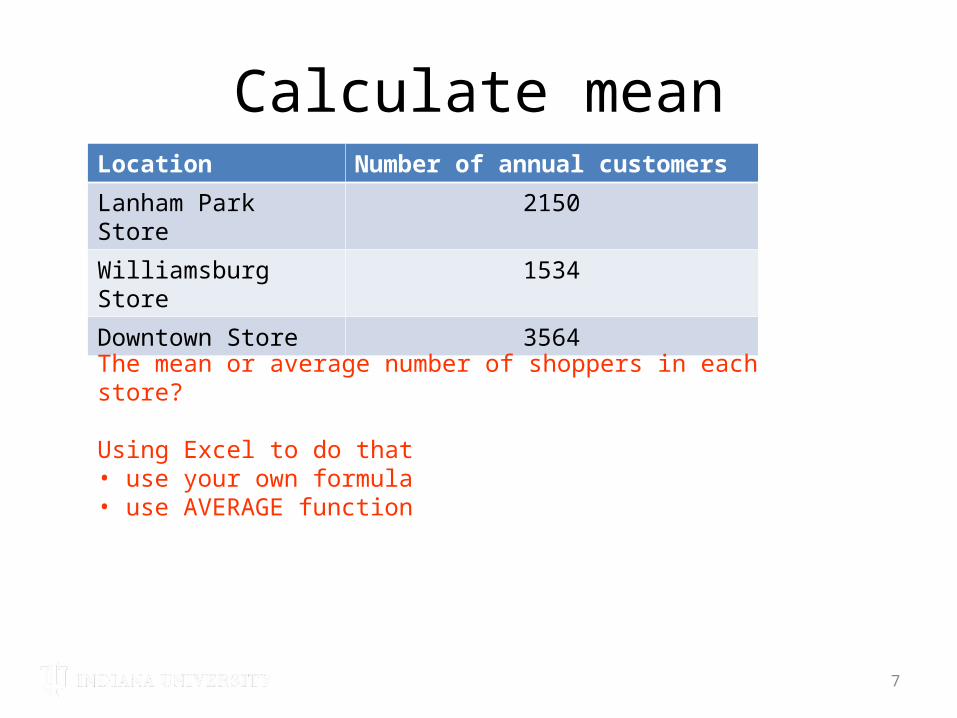
Calculate meanLocation Number of annual customers
Lanham Park Store 2150
Williamsburg Store 1534
Downtown Store 3564
7
The mean or average number of shoppers in each store?
Using Excel to do that• use your own formula• use AVERAGE function
Median
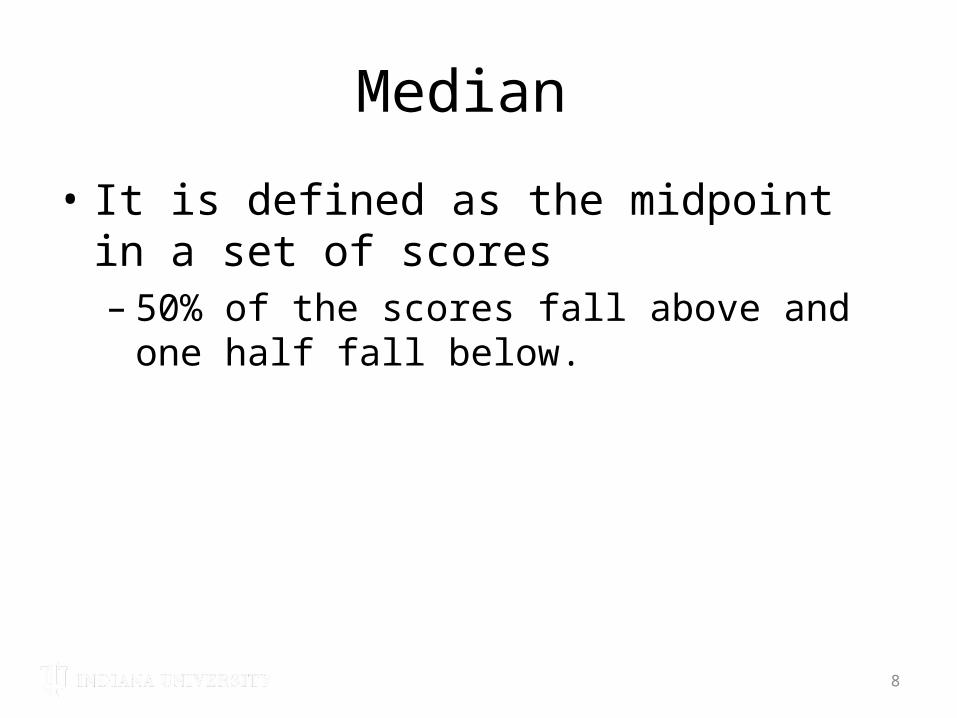
• It is defined as the midpoint in a set of scores– 50% of the scores fall above and one half fall
below.
8
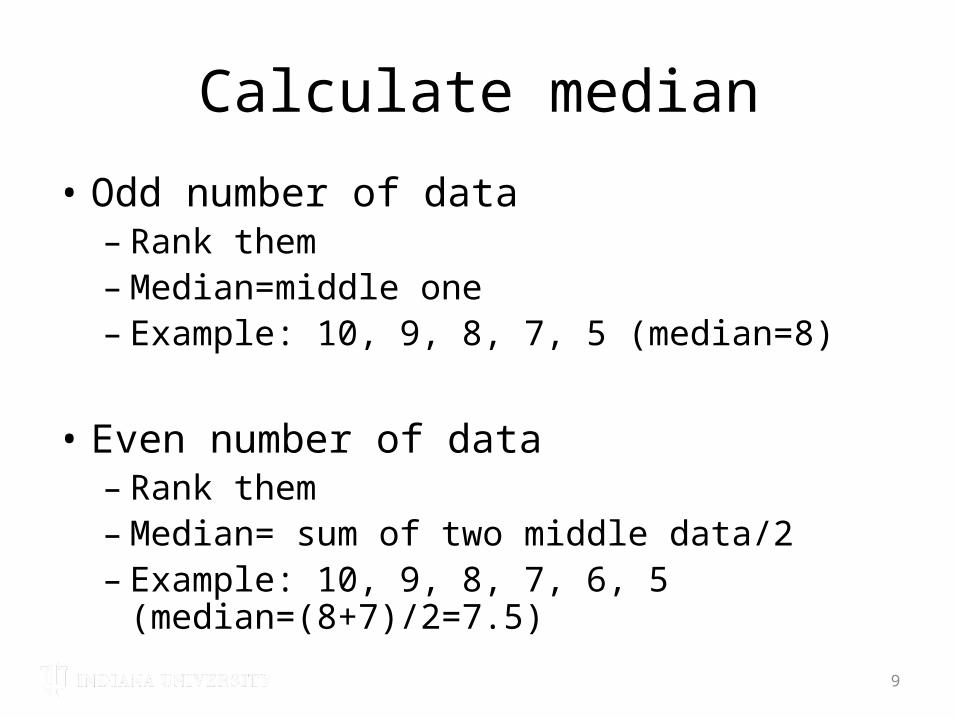
Calculate median
• Odd number of data– Rank them– Median=middle one– Example: 10, 9, 8, 7, 5 (median=8)
• Even number of data– Rank them– Median= sum of two middle data/2– Example: 10, 9, 8, 7, 6, 5 (median=(8+7)/2=7.5)
9
Median
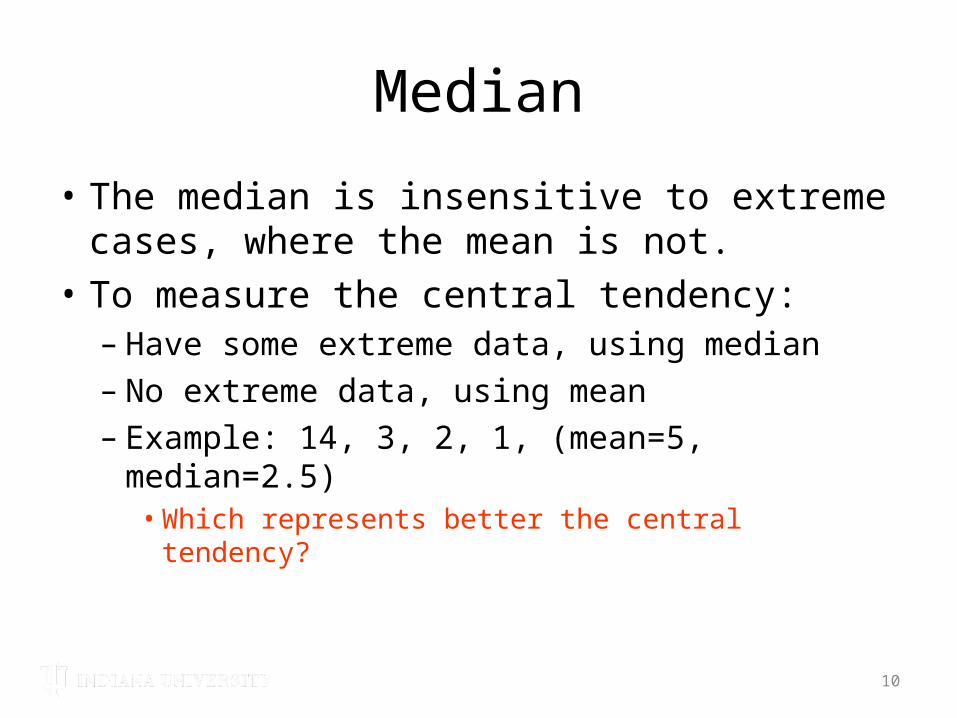
• The median is insensitive to extreme cases, where the mean is not.
• To measure the central tendency:– Have some extreme data, using median– No extreme data, using mean– Example: 14, 3, 2, 1, (mean=5, median=2.5)• Which represents better the central tendency?
10
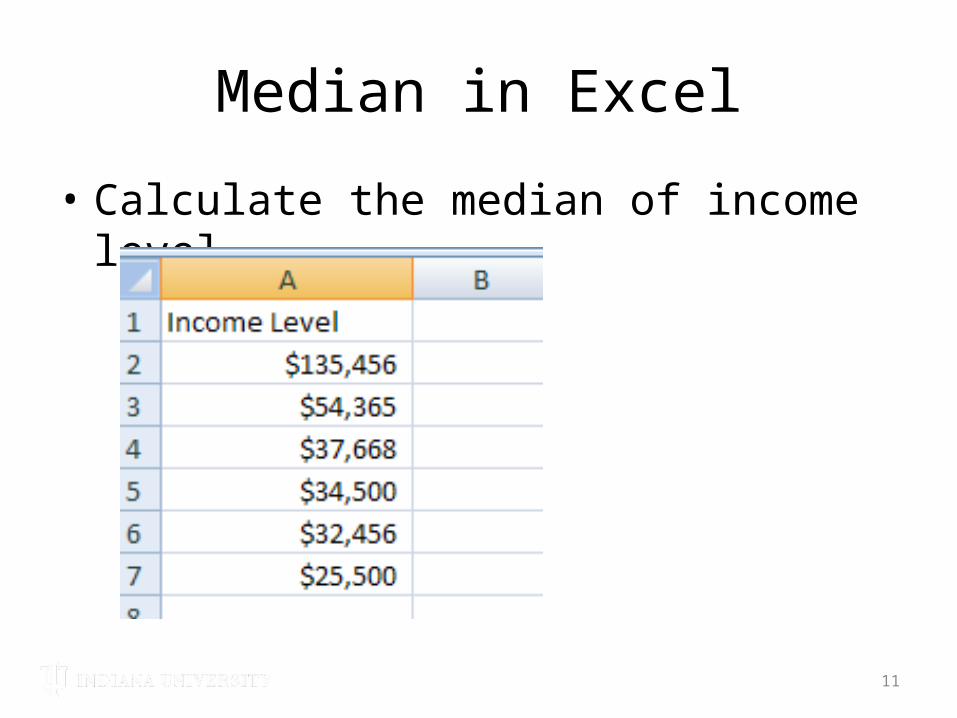
Median in Excel
• Calculate the median of income level
11
Mode
• The mode is the value that occurs most frequently.– Calculate the frequency of all the values in a
distribution– The value that occurs most often is the mode
12
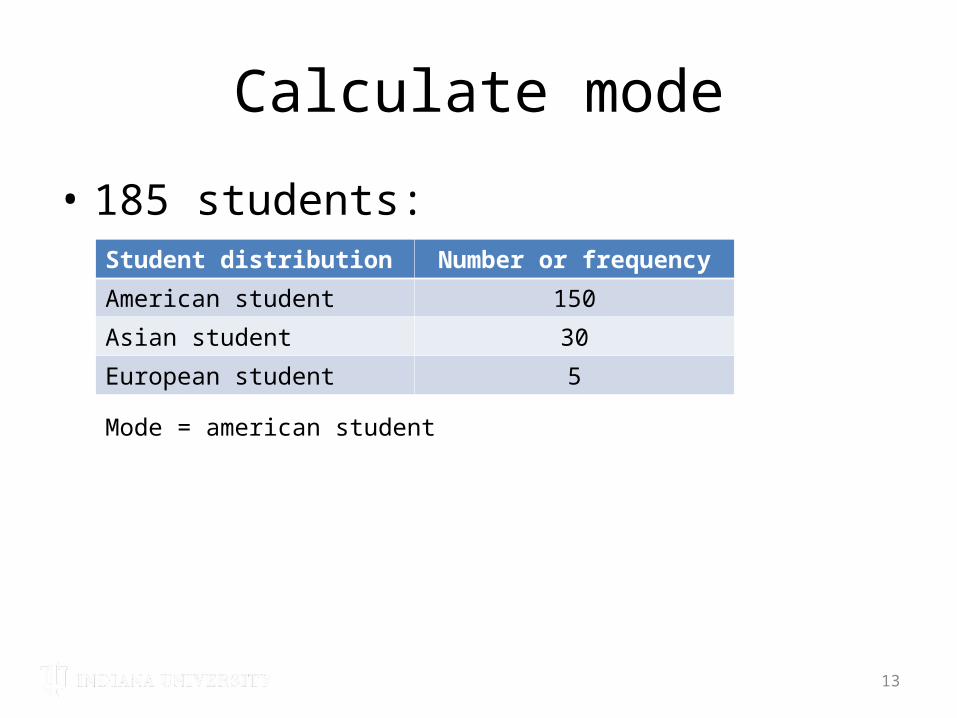
Calculate mode
• 185 students:
13
Student distribution Number or frequency
American student 150
Asian student 30
European student 5
Mode = american student
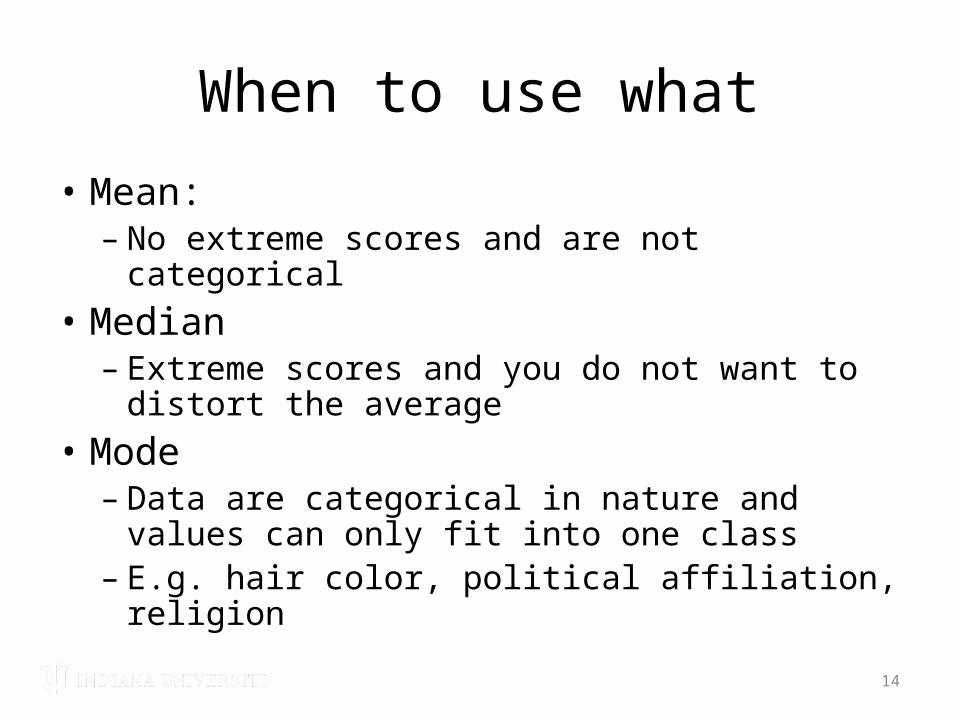
When to use what
• Mean:– No extreme scores and are not categorical
• Median– Extreme scores and you do not want to distort the
average• Mode– Data are categorical in nature and values can only
fit into one class– E.g. hair color, political affiliation, religion
14
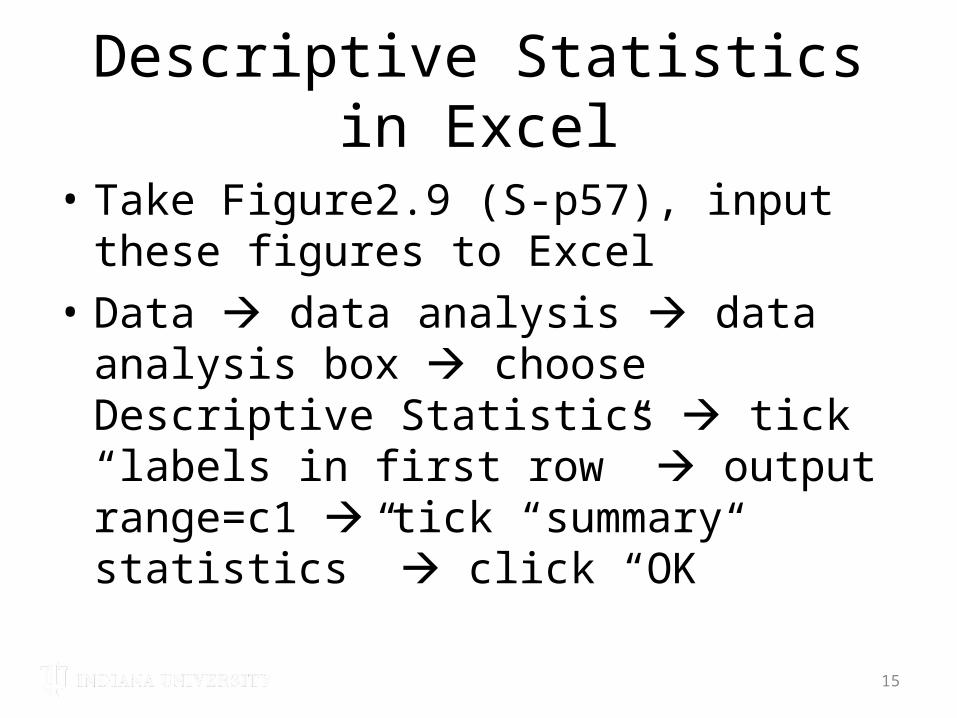
Descriptive Statistics in Excel
• Take Figure2.9 (S-p57), input these figures to Excel
• Data data analysis data analysis box choose Descriptive Statistics tick “labels in first row” output range=c1 tick “summary statistics” click “OK”
15
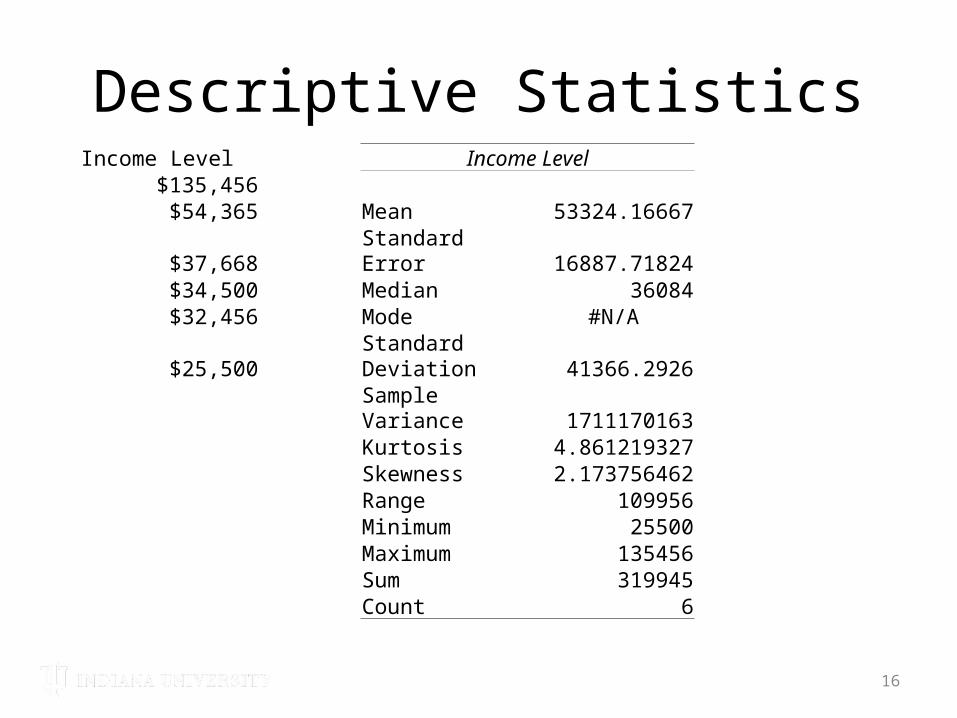
Descriptive StatisticsIncome Level Income Level
$135,456 $54,365 Mean 53324.16667$37,668 Standard Error 16887.71824$34,500 Median 36084$32,456 Mode #N/A$25,500 Standard Deviation 41366.2926
Sample Variance 1711170163Kurtosis 4.861219327Skewness 2.173756462Range 109956Minimum 25500Maximum 135456Sum 319945Count 6
16
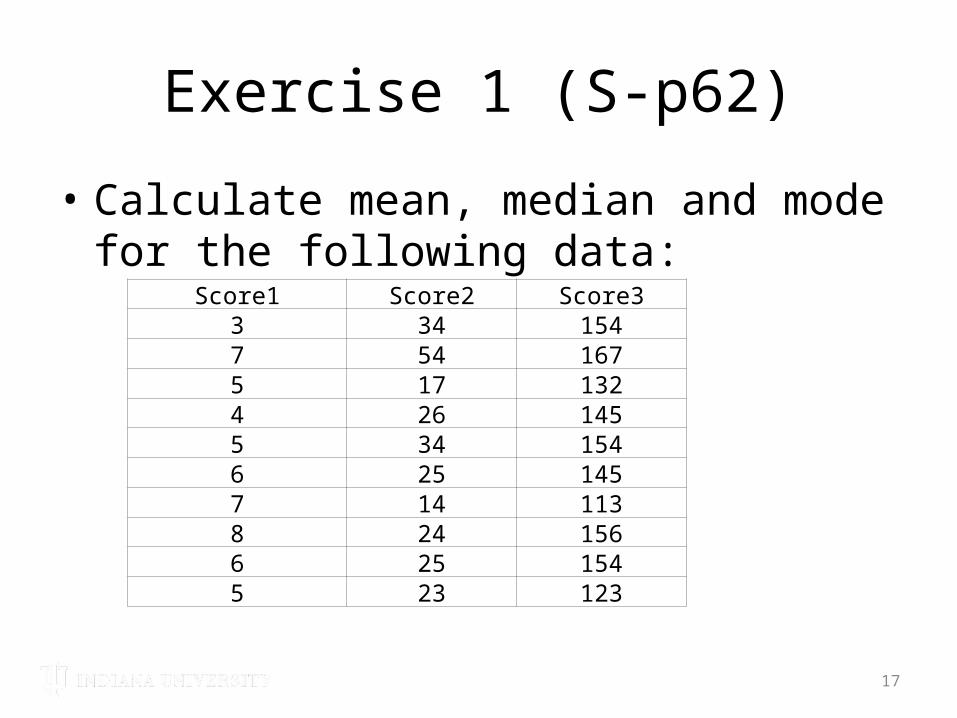
Exercise 1 (S-p62)
• Calculate mean, median and mode for the following data:
17
Score1 Score2 Score33 34 1547 54 1675 17 1324 26 1455 34 1546 25 1457 14 1138 24 1566 25 1545 23 123
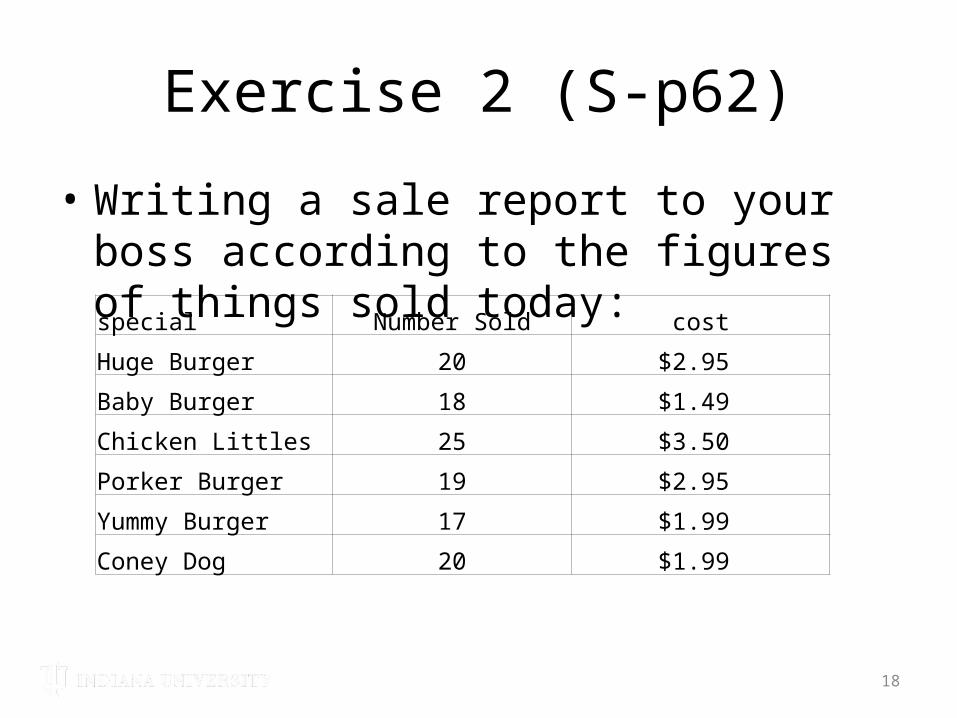
Exercise 2 (S-p62)
• Writing a sale report to your boss according to the figures of things sold today:
18
special Number Sold cost
Huge Burger 20 $2.95
Baby Burger 18 $1.49
Chicken Littles 25 $3.50
Porker Burger 19 $2.95
Yummy Burger 17 $1.99
Coney Dog 20 $1.99
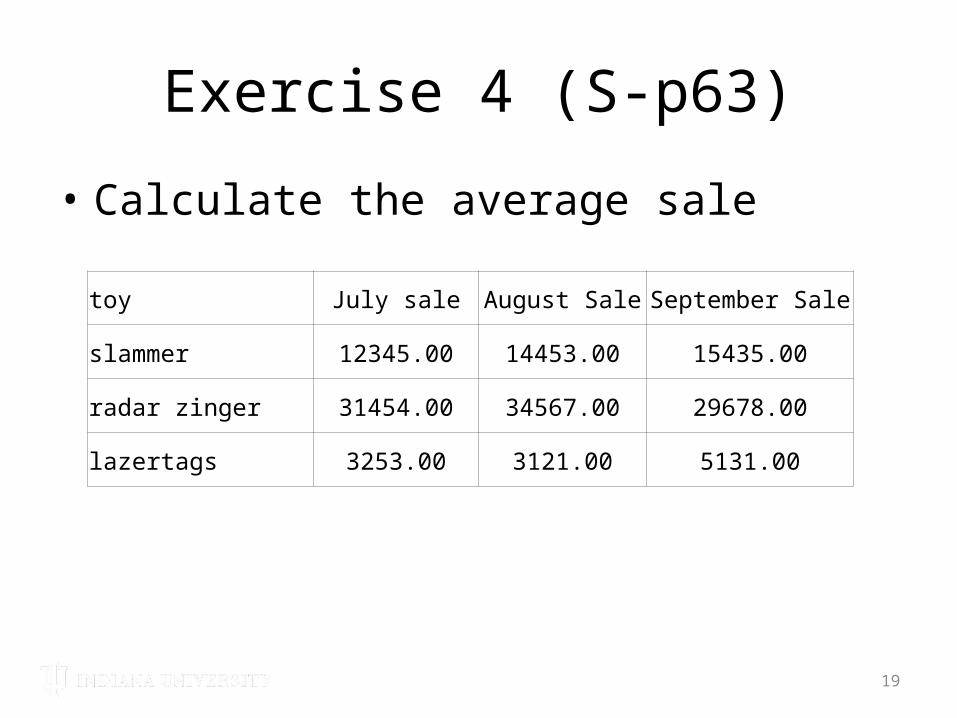
Exercise 4 (S-p63)
• Calculate the average sale
19
toy July sale August Sale September Sale
slammer 12345.00 14453.00 15435.00
radar zinger 31454.00 34567.00 29678.00
lazertags 3253.00 3121.00 5131.00
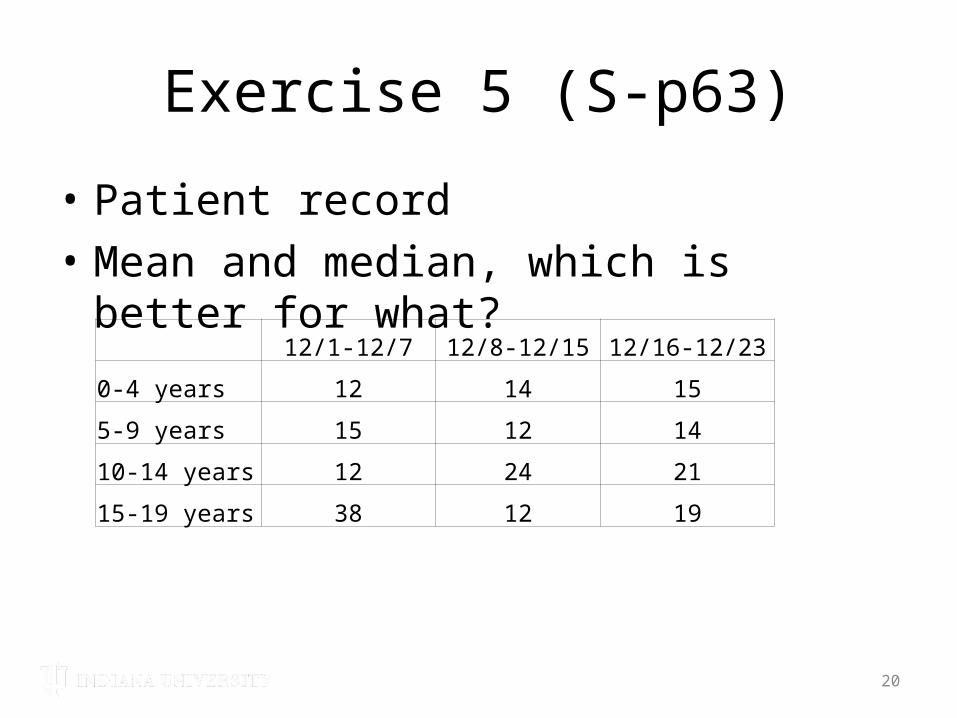
Exercise 5 (S-p63)
• Patient record• Mean and median, which is better for what?
20
12/1-12/7 12/8-12/15 12/16-12/23
0-4 years 12 14 15
5-9 years 15 12 14
10-14 years 12 24 21
15-19 years 38 12 19


![Mean, Mode, Median[1]](https://static.fdocuments.us/doc/165x107/5462509daf7959fe1b8b57b8/mean-mode-median1-5584ae32b3357.jpg)


![Mean, Mode, Median[1]](https://static.fdocuments.us/doc/165x107/54625097af7959aa3d8b540f/mean-mode-median1-5584ae32b6452.jpg)