MEAD JOHNSON NUTRITION COMPANY - sendd.comwebdrop/EZHTML/201004/im47DDDvrm6niKs64TUk/... · PART I...
108
UNITED STATES SECURITIES AND EXCHANGE COMMISSION Washington, D.C. 20549 FORM 10-K ANNUAL REPORT PURSUANT TO SECTION 13 OR 15(d) OF THE SECURITIES EXCHANGE ACT OF 1934 For the fiscal year ended December 31, 2009 Commission File Number 001-34251 MEAD JOHNSON NUTRITION COMPANY (Exact name of registrant as specified in its charter) Delaware 80-0318351 (State or other jurisdiction of incorporation or organization) (IRS Employer Identification No.) 2701 Patriot Blvd. Glenview, Illinois 60026 (Address of principal executive offices) Registrant’s telephone number: (847) 832-2420 Securities registered pursuant to Section 12(b) of the Act: Title of each class Name of each exchange on which registered Common Stock, $0.01 Par Value New York Stock Exchange Securities registered pursuant to Section 12(g) of the Act: None Indicate by check mark if the registrant is a well-known seasoned issuer, as defined in Rule 405 of the Securities Act. Yes ‘ No È Indicate by check mark if the registrant is not required to file reports pursuant to Section 13 or Section 15(d) of the Act. Yes ‘ No È Indicate by check mark whether the registrant has submitted electronically and posted on its corporate Web site, if any, every Interactive Data File required to be submitted and posted pursuant to Rule 405 of Regulation S-T during the preceding 12 months (or for such shorter period that the registrant was required to submit and post such files). Yes ‘ No ‘ Indicate by check mark whether the registrant (1) has filed all reports required to be filed by Section 13 or 15(d) of the Securities Exchange Act of 1934 during the preceding 12 months (or for such shorter period that the registrant was required to file such reports), and (2) has been subject to such filing requirements for the past 90 days. Yes È No ‘ Indicate by check mark if disclosure of delinquent filers pursuant to Item 405 of Regulation S-K is not contained herein, and will not be contained, to the best of the registrant’s knowledge, in definitive proxy or information statements incorporated by reference in Part III of this Form 10-K or any amendment to this Form 10-K. È Indicate by check mark whether the registrant is a large accelerated filer, an accelerated filer, a non-accelerated filer or a smaller reporting company. See definitions of “accelerated filer”, “large accelerated filer” and “smaller reporting company” in Rule 12b-2 of the Exchange Act. Large accelerated filer ‘ Accelerated filer ‘ Non-accelerated filer È Smaller reporting company ‘ Indicate by check mark if the registrant is a shell company (as defined in Rule 12b-2 of the Exchange Act). Yes ‘ No È The aggregated market value of the 76,768,037 shares of voting common stock held by non-affiliates of the registrant, computed by reference to the closing price as reported on the New York Stock Exchange, as of June 30, 2009, the last business day of the registrant’s most recently completed second fiscal quarter, was approximately $2,438,920,535. At February 16, 2010, there were 204,500,000 shares of common stock outstanding. DOCUMENTS INCORPORATED BY REFERENCE Portions of the Proxy Statement for the registrant’s Annual Meeting of Stockholders to be held May 11, 2010, are incorporated by reference into PART III of this Annual Report on Form 10-K.
Transcript of MEAD JOHNSON NUTRITION COMPANY - sendd.comwebdrop/EZHTML/201004/im47DDDvrm6niKs64TUk/... · PART I...
UNITED STATESSECURITIES AND EXCHANGE COMMISSION
Washington, D.C. 20549
FORM 10-KANNUAL REPORT PURSUANT TO SECTION 13 OR 15(d) OF THE
SECURITIES EXCHANGE ACT OF 1934For the fiscal year ended December 31, 2009
Commission File Number 001-34251
MEAD JOHNSON NUTRITION COMPANY(Exact name of registrant as specified in its charter)
Delaware 80-0318351(State or other jurisdiction of
incorporation or organization)(IRS Employer
Identification No.)
2701 Patriot Blvd.Glenview, Illinois 60026
(Address of principal executive offices)
Registrant’s telephone number: (847) 832-2420
Securities registered pursuant to Section 12(b) of the Act:Title of each class Name of each exchange on which registered
Common Stock, $0.01 Par Value New York Stock Exchange
Securities registered pursuant to Section 12(g) of the Act: None
Indicate by check mark if the registrant is a well-known seasoned issuer, as defined in Rule 405 of the SecuritiesAct. Yes ‘ No È
Indicate by check mark if the registrant is not required to file reports pursuant to Section 13 or Section 15(d) ofthe Act. Yes ‘ No È
Indicate by check mark whether the registrant has submitted electronically and posted on its corporate Web site, ifany, every Interactive Data File required to be submitted and posted pursuant to Rule 405 of Regulation S-T during thepreceding 12 months (or for such shorter period that the registrant was required to submit and post such files).
Yes ‘ No ‘
Indicate by check mark whether the registrant (1) has filed all reports required to be filed by Section 13 or 15(d) ofthe Securities Exchange Act of 1934 during the preceding 12 months (or for such shorter period that the registrant wasrequired to file such reports), and (2) has been subject to such filing requirements for the past 90 days.
Yes È No ‘
Indicate by check mark if disclosure of delinquent filers pursuant to Item 405 of Regulation S-K is not containedherein, and will not be contained, to the best of the registrant’s knowledge, in definitive proxy or informationstatements incorporated by reference in Part III of this Form 10-K or any amendment to this Form 10-K. È
Indicate by check mark whether the registrant is a large accelerated filer, an accelerated filer, a non-acceleratedfiler or a smaller reporting company. See definitions of “accelerated filer”, “large accelerated filer” and “smallerreporting company” in Rule 12b-2 of the Exchange Act.
Large accelerated filer ‘ Accelerated filer ‘ Non-accelerated filer È Smaller reporting company ‘
Indicate by check mark if the registrant is a shell company (as defined in Rule 12b-2 of the ExchangeAct). Yes ‘ No È
The aggregated market value of the 76,768,037 shares of voting common stock held by non-affiliates of theregistrant, computed by reference to the closing price as reported on the New York Stock Exchange, as of June 30,2009, the last business day of the registrant’s most recently completed second fiscal quarter, was approximately$2,438,920,535. At February 16, 2010, there were 204,500,000 shares of common stock outstanding.
DOCUMENTS INCORPORATED BY REFERENCE
Portions of the Proxy Statement for the registrant’s Annual Meeting of Stockholders to be held May 11, 2010, areincorporated by reference into PART III of this Annual Report on Form 10-K.
TABLE OF CONTENTS
Page
PART I
Item 1. BUSINESS 1
Item 1A. RISK FACTORS 15
Item 1B. UNRESOLVED STAFF COMMENTS 29
Item 2. PROPERTIES 29
Item 3. LEGAL PROCEEDINGS 30
Item 4. SUBMISSION OF MATTERS TO A VOTE OF SECURITY HOLDERS 31
PART IA EXECUTIVE OFFICERS OF THE REGISTRANT 32
PART II
Item 5. MARKET FOR REGISTRANT’S COMMON STOCK, RELATED STOCKHOLDERMATTERS, AND ISSUER PURCHASES OF EQUITY SECURITIES 34
Item 6. SELECTED FINANCIAL DATA 36
Item 7. MANAGEMENT’S DISCUSSION AND ANALYSIS OF FINANCIAL CONDITION ANDRESULTS OF OPERATIONS 37
Item 7A. QUANTITATIVE AND QUALITATIVE DISCLOSURES ABOUT MARKET RISK 55
Item 8. FINANCIAL STATEMENTS AND SUPPLEMENTARY DATA 57
Item 9. CHANGES IN AND DISAGREEMENTS WITH ACCOUNTANTS ON ACCOUNTINGAND FINANCIAL DISCLOSURE 95
Item 9A. CONTROLS AND PROCEDURES 95
Item 9B. OTHER INFORMATION 95
PART III
Item 10. DIRECTORS, EXECUTIVE OFFICERS AND CORPORATE GOVERNANCE 96
Item 11. EXECUTIVE COMPENSATION 96
Item 12. SECURITY OWNERSHIP OF CERTAIN BENEFICIAL OWNERS AND MANAGEMENTAND RELATED STOCKHOLDER MATTERS 96
Item 13. CERTAIN RELATIONSHIPS AND RELATED TRANSACTIONS, AND DIRECTORINDEPENDENCE 96
Item 14. PRINCIPAL ACCOUNTING FEES AND SERVICES 96
Item 15. EXHIBITS AND FINANCIAL STATEMENT SCHEDULES 97
1
PART I
Item 1. BUSINESS.
In this Annual Report on Form 10-K, we refer to Mead Johnson Nutrition Company and its subsidiaries as “theCompany,” “MJN,” “Mead Johnson,” “we” or “us.”
Our Company
Mead Johnson Nutrition Company is a global leader in pediatric nutrition with $2.8 billion in net sales for theyear ended December 31, 2009. We are committed to creating trusted nutritional brands and products that helpimprove the health and development of infants and children around the world and provide them with the beststart in life. Our Enfa family of brands, including Enfamil infant formula, is the world’s leading brand franchisein pediatric nutrition, based on retail sales. Our comprehensive product portfolio addresses a broad range ofnutritional needs for infants, children and expectant and nursing mothers. We have over 100 years of innovationexperience during which we have developed or improved many breakthrough or industry-defining productsacross each of our product categories. Our singular focus on pediatric nutrition and our implementation of abusiness model that integrates nutritional science with health care and consumer marketing expertise differentiateus from many of our competitors.
We market our portfolio of more than 70 products to mothers, health care professionals and retailers in more than50 countries in Asia, North America, Latin America and Europe. Our two reportable segments are Asia/LatinAmerica and North America/Europe, which comprised 58% and 42%, respectively, of our net sales for the yearended December 31, 2009. See “Item 8. Financial Statements—Note 17. Segment Information.” For the yearended December 31, 2009, 65% of our net sales were generated in countries outside of the United States.
We believe parents and health care professionals associate the Mead Johnson name and the Enfa family of brandswith quality, science-based pediatric nutrition products. We believe the strength of our brands allows us to createand maintain consumer loyalty across our product portfolio and stages of pediatric development.
The two principal product categories in which we operate are infant formula and children’s nutrition, whichrepresented 64% and 33% of our net sales for the year ended December 31, 2009, respectively.
Our History
Mead Johnson was founded in 1905, and we introduced Dextri-Maltose, our first infant formula product, in 1911.Over the next several decades, we built upon our leadership in science-based nutrition, introducing manyinnovative infant feeding products while expanding into vitamins, pharmaceutical products and adult andchildren’s nutrition. Some of our products brought such significant improvements in quality of life that theybecame cultural icons of their times. Others, developed in cooperation with clinicians and leading nutritionresearchers, established a partnership between Mead Johnson and the scientific community that continues to thisday.
During the course of our history, we have expanded our operations into geographies outside of the United States,including Asia, Latin America and Europe and now focus on pediatric nutrition. Throughout our history, ourdeeply-held commitment to support breastfeeding and our commitment to improve the health and development ofinfants and children around the world have been hallmarks of our organization. In 1967, we became a whollyowned subsidiary of Bristol-Myers Squibb Company (BMS).
In February 2009, we consummated an initial public offering of 34.5 million shares of our Class A commonstock and Mead Johnson became an independent, separately traded, publicly-held company. At that time, BMSbeneficially owned 42,344,571 shares of our Class A common stock (representing approximately 55.1% of our
1
outstanding shares of Class A common stock) and 127,655,429 shares of our Class B common stock(representing 100% of the outstanding shares of Class B common stock).
On December 23, 2009, BMS completed an exchange offer whereby BMS converted all outstanding shares ofClass B common stock to Class A common stock and then disposed its entire ownership and voting interest in us,resulting in the split-off of Mead Johnson from BMS. Effective January 7, 2010, our Class A common stock wasreclassified as common stock, par value $0.01 per share. Following the split-off, we are completely independentfrom BMS subject to certain agreements between BMS and us that will remain in place for specified terms. See“Item 8. Financial Statements—Note 4. Activities With Former Parent, BMS” and “Item 13. CertainRelationships and Related Transactions, and Director Independence.”
Our Growth Strategies
We are committed to improving the health and development of infants and children around the world. We intendto grow our business profitably through the following strategic initiatives:
Build on Our Leadership Position in Our Core Businesses
We intend to grow our business in our core countries and product categories by building loyal usage of ourbrands, introducing innovative products that differentiate us in the marketplace and leveraging our expertise inmarketing to consumers and health care professionals. In addition, we will continue to implement best practicesand insights using our balance of local, regional and global capabilities to execute the most effective programs inall markets. We have a successful business model based on acquiring new consumers and retaining them. Wealso intend to invest in order to attract, retain and train talented employees who are committed to improving thehealth of the world’s infants and children and who have world class capabilities in key business disciplines,including marketing, sales, product development, supply chain and finance.
Continued Leadership in Innovation
Innovation is fundamental to our long-term growth and profitability. We continually invest in research anddevelopment (R&D) and have established world-class professional capabilities in our global R&D headquarterslocated in Evansville, Indiana and regional labs around the world. Our processes drive the integration ofnutritional science with marketing across all phases of product development. We believe we have a stronginnovation pipeline that is focused on improving the health and development of infants and children, with aparticular focus on brain development, allergy and tolerance issues, immunity, healthy growth and improvedproduct experience. Investments in leading systems and processes will be used to reduce cycle times for projectsin our pipeline, and we are planning to bring a systematic flow of innovations to market over time. We believeour global R&D capabilities, the strength of our brands and our ability to convert advances in nutritional scienceinto marketable product innovations will continue to allow us to successfully develop new products and improveexisting products across each of our product categories.
Capitalize on Favorable Demographic Trends Driving Growth in Emerging Markets
Opportunities in Asia and Latin America, driven in part by favorable demographic trends, are estimated toaccount for a majority of the dollar (value) growth in the pediatric nutrition industry over the next five years. Wehave established presence in these emerging markets with our Asia/Latin America segment accounting for 58%of total sales for the year ended December 31, 2009. We believe that our strong global brands, sales andmarketing expertise, and investments to expand our distribution footprint, will enable us to continue to grow bycapitalizing on the favorable demographic trends in these emerging markets.
Expansion into Selected High-Growth Geographic Markets and Adjacent Product Categories
Emerging markets in Asia, Latin America, Eastern Europe and the Middle East are projected to experiencecontinued growth. We have established replicable business models and developed a deep understanding of
2
business drivers in our core markets that we believe will lead to success in selected new high-growth markets.We believe our global supply chain infrastructure, along with the strength of our business model and demand-creation capabilities, strategically positions us for further expansion into certain high-growth regions in which wecurrently have a more limited presence. In addition, there is a global trend of mothers seeking increasednutritional reassurance, and mothers and health care professionals alike associate the Mead Johnson name and theEnfa family of brands with the highest quality nutrition. We believe there are opportunities to extend our strongbrand equities into select adjacent product categories through organic development, partnerships andacquisitions.
Continuously Improve Upon Our Manufacturing and Global Supply Chain Excellence
We seek to continuously improve the management and operation of our business by increasing efficiency in ouroperations at all stages of production, from sourcing of raw materials to manufacturing and distribution in localgeographies. We maintained higher operating margins than those of our primary competitors in 2009, and weplan to continue to achieve incremental cost savings through broad-based, bottom-up organizational involvement.
Our Brands
The Mead Johnson name has been associated with science-based nutritional products for over 100 years. Inaddition to the Mead Johnson name, our products are marketed around the world under brands that we havedeveloped through our global sales and marketing efforts.
Enfa Family of Brands
The Enfa family of brands includes several of the world’s leading infant formula and children’s nutrition brands.We have positioned the Enfa family of brands as providing unique, clinically supported health anddevelopmental benefits. The Enfa family of brands features infant formula products that include docosahexaenoicacid (DHA) and arachidonic acid (ARA), which support brain, visual and nervous system development. Our Enfafamily of brands accounted for 76% of our net sales for the year ended December 31, 2009, and is the world’sleading brand franchise in pediatric nutrition, based on retail sales.
Building upon the strength of our brand equity, we have extended the Enfa family of brands into the fast-growingchildren’s nutrition category. We believe we have enhanced consumer retention by creating links between agegroups and leveraging brand loyalty.
Additionally, the use of the Enfa prefix in our prenatal nutrition products (such as EnfaMama A+) reinforces thescientific basis, quality and innovation that these products hold in common with our core pediatric nutrition line.
We consistently promote the brand through our global sales and marketing operations. Our studies show mothersand health care professionals often associate the Enfa family of brands with science, superior nutrition, qualityand good value. Mothers often describe the Enfa family of brands as science-based, sophisticated, trustworthy,reliable and comforting. Additionally, health care professionals frequently comment on our professional andinnovative approach to nutrition science.
Complementary Brands
In addition to the Enfa family of brands, we market several other powerful brands on a local, regional or globalbasis. These brands complement the Enfa family of brands portfolio and are designed to meet the nutritionalneeds of broad consumer populations (such as ChocoMilk and Cal-C-Tose) or the specific nutritional needs ofinfants under the supervision of health care professionals (such as Nutramigen).
3
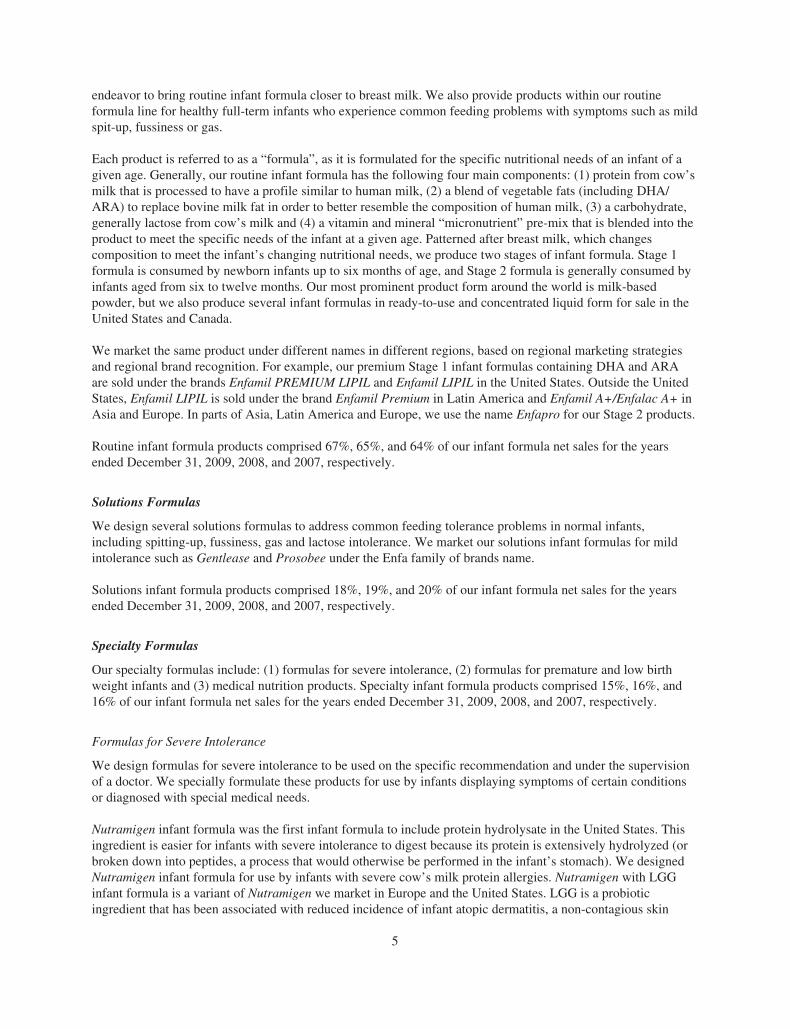
Stages of Development
Generally, there are five stages of pediatric development and we produce different products for each of thesestages. The stages of development are illustrated below:
Pre-Natal Infants0 to 12 months
Children12+ months
Stage 3: 12 months – 3 years old
Stage 4: 3 – 5 years old
Stage 5: Beyond 5 years old
Stage 1: 0 – 6 months old
Stage 2: 6 – 12 months old
Stage 0: Pre-Natal
In the United States, our business is primarily focused on the infant formula category (Stages 1 and 2). Outside ofthe United States, however, we market both infant formula products (Stages 1 and 2) and children’s nutritionproducts designed for the changing nutritional needs of growing toddlers and children (Stages 3, 4 and 5). Thisallows us to take advantage of brand loyalty developed in Stages 1 and 2 to retain consumers as they grow older.
Our Products
Our pediatric nutrition products are grouped by category of feeding: (1) infant formula products, (2) children’snutrition products and (3) other products. Infant formula, children’s nutrition and other product sales comprisedapproximately 64%, 32% and 4% of our net sales for the year ended December 31, 2009, respectively.
Infant Formula
General
Our infant formula products include formulas for routine feeding, solutions formulas for mild intolerance andspecialty formula products, including formulas for severe intolerance, formulas for premature and low birthweight infants and medical nutrition products. In 2009, we reclassified certain products previously classified asroutine infant formula into specialty formula, which impacts the percentage of those formulas as a percentage ourinfant formula net sales indicated for prior years in the discussion below. The table below illustrates our keyinfant formula brands and products:
ROUTINE INFANT FORMULASOLUTIONS FORMULA FOR
COMMON FEEDING PROBLEMS SPECIALTY FORMULAS
Stage 1• Enfamil PREMIUM LIPIL• Enfamil LIPIL• Enfalac A+• Enfamil Premium
Stage 2• Enfamil PREMIUM NEXT
STEP• Enfapro A+• Enfapro Premium
Many available in stages 1 and 2• Enfamil Gentlease: for gas/
fussiness• Enfamil ProSobee: soy
formula• Enfamil LactoFree: for lactose
intolerance• Enfamil A.R: for anti-
regurgitation• Enfamil HA: for infants with
milk protein allergy
Many available in stages 1 and 2• Nutramigen LIPIL: for severe
protein sensitivity• Nutramigen AA: for multiple
food allergies• Pregestimil: for fat
malabsorption• Enfamil Premature: for
premature infants
Routine Infant Formula
We design routine infant formula as a breast milk substitute for healthy, full-term infants without specialnutritional needs both for use as the infant’s sole source of nutrition and as a supplement to breastfeeding. We
4
endeavor to bring routine infant formula closer to breast milk. We also provide products within our routineformula line for healthy full-term infants who experience common feeding problems with symptoms such as mildspit-up, fussiness or gas.
Each product is referred to as a “formula”, as it is formulated for the specific nutritional needs of an infant of agiven age. Generally, our routine infant formula has the following four main components: (1) protein from cow’smilk that is processed to have a profile similar to human milk, (2) a blend of vegetable fats (including DHA/ARA) to replace bovine milk fat in order to better resemble the composition of human milk, (3) a carbohydrate,generally lactose from cow’s milk and (4) a vitamin and mineral “micronutrient” pre-mix that is blended into theproduct to meet the specific needs of the infant at a given age. Patterned after breast milk, which changescomposition to meet the infant’s changing nutritional needs, we produce two stages of infant formula. Stage 1formula is consumed by newborn infants up to six months of age, and Stage 2 formula is generally consumed byinfants aged from six to twelve months. Our most prominent product form around the world is milk-basedpowder, but we also produce several infant formulas in ready-to-use and concentrated liquid form for sale in theUnited States and Canada.
We market the same product under different names in different regions, based on regional marketing strategiesand regional brand recognition. For example, our premium Stage 1 infant formulas containing DHA and ARAare sold under the brands Enfamil PREMIUM LIPIL and Enfamil LIPIL in the United States. Outside the UnitedStates, Enfamil LIPIL is sold under the brand Enfamil Premium in Latin America and Enfamil A+/Enfalac A+ inAsia and Europe. In parts of Asia, Latin America and Europe, we use the name Enfapro for our Stage 2 products.
Routine infant formula products comprised 67%, 65%, and 64% of our infant formula net sales for the yearsended December 31, 2009, 2008, and 2007, respectively.
Solutions Formulas
We design several solutions formulas to address common feeding tolerance problems in normal infants,including spitting-up, fussiness, gas and lactose intolerance. We market our solutions infant formulas for mildintolerance such as Gentlease and Prosobee under the Enfa family of brands name.
Solutions infant formula products comprised 18%, 19%, and 20% of our infant formula net sales for the yearsended December 31, 2009, 2008, and 2007, respectively.
Specialty Formulas
Our specialty formulas include: (1) formulas for severe intolerance, (2) formulas for premature and low birthweight infants and (3) medical nutrition products. Specialty infant formula products comprised 15%, 16%, and16% of our infant formula net sales for the years ended December 31, 2009, 2008, and 2007, respectively.
Formulas for Severe Intolerance
We design formulas for severe intolerance to be used on the specific recommendation and under the supervisionof a doctor. We specially formulate these products for use by infants displaying symptoms of certain conditionsor diagnosed with special medical needs.
Nutramigen infant formula was the first infant formula to include protein hydrolysate in the United States. Thisingredient is easier for infants with severe intolerance to digest because its protein is extensively hydrolyzed (orbroken down into peptides, a process that would otherwise be performed in the infant’s stomach). We designedNutramigen infant formula for use by infants with severe cow’s milk protein allergies. Nutramigen with LGGinfant formula is a variant of Nutramigen we market in Europe and the United States. LGG is a probioticingredient that has been associated with reduced incidence of infant atopic dermatitis, a non-contagious skin
5
disease characterized by chronic inflammation of the skin, resulting from an allergy to cow’s milk. NutramigenAA infant formula is an amino acid formula we formulated with fully broken-down proteins that can beconsumed without the need for digestion of the protein. We designed this product for infants who experience asevere allergy to cow’s milk or multiple other food allergies. Pregestimil infant formula is a variation of theNutramigen formulation designed mainly for fat malabsorption. It contains medium chain triglycerides oilinstead of fat.
Formulas for Premature and Low Birth Weight Infants
We also design products for premature and low birth weight infants to meet these infants’ unique needs under thesupervision of a doctor, most often in the hospital. Typically, such infants need extra assistance obtaining therequisite nutrition. They require a higher density of nutrients and calories because they cannot take in enoughvolume of breast milk or routine infant formula. We designed Enfamil Human Milk Fortifier product as asupplement to a mother’s breast milk that improves nutritional density. EnfaCare infant formula, another of ourproducts, is a hypercaloric formula available at retail for premature babies when they are able to go home. Inaddition, Enfamil Premature is an infant formula used primarily in the hospital.
Medical Nutrition
We also produce medical foods, or foods for special medical purposes, for nutritional management of individualswith rare, inborn errors of metabolism such as maple syrup urine disease (Mead Johnson BCAD) andphenylketonuria (Mead Johnson Phenyl-Free). Category 1 products are intended for infants and young childrenfrom zero to three years of age and Category 2 products are suitable for children and adults. We produceapproximately 20 formulas targeted at specific disorders for use under the direct and continuous supervision of aphysician. We market these medical nutrition products under the Mead Johnson brand name.
Children’s Nutrition Products
Children’s nutrition products are designed to provide children with enhanced nutrition. Our children’s nutritionbusiness is present primarily in Asia and Latin America. We separate our children’s nutrition products into twocategories: (1) Enfa branded children’s nutrition products and (2) other children’s nutrition products. The tablebelow illustrates our key children’s nutrition products:
ENFA BRANDED CHILDREN’S NUTRITION PRODUCTS OTHER CHILDREN’S NUTRITION PRODUCTS
Stage 3• Enfagrow A+• Enfagrow Premium
Stage 4• Enfakid A+
Stage 5• EnfaSchool A+
Many available in stages 3, 4 and 5• Sustagen KID: nutritious powdered milk for
picky eaters• Lactum: nutritious powdered milk for picky
eaters• ChocoMilk: nutritious milk modifier• Cal-C-Tose: nutritious milk modifier
Enfa Branded Children’s Nutrition Products
Outside of the United States, we market children’s nutrition products under the Enfa family of brands. We designthese products to meet the changing nutrition needs of children at different stages of development. We offerproducts at Stages 3, 4 and 5 that are designed for children’s nutritional needs at one to three years of age, threeto five years of age and beyond five years of age, respectively. These products are not breast milk substitutes andare not designed for use as the sole source of nutrition but instead are designed to be a part of a child’sappropriate diet. Our use of the Enfa prefix allows for a consistent equity across Stages 3 and 4, with productssuch as Enfagrow offered at Stage 3 and Enfakid offered at Stage 4 and EnfaSchool at Stage 5. Enfa brandedchildren’s nutrition products comprised 65%, 56%, and 53% of our children’s nutrition products sales for theyears ended December 31, 2009, 2008, and 2007, respectively.
6
Other Products
We also produce a range of other products, including pre-natal and post-natal nutritional supplements forexpectant and nursing mothers, including Expecta LIPIL, EnfaMama A+. Our products for expectant or nursingmothers provide the developing fetus or breastfed infant with vitamin supplements and/or an increased supply ofDHA for brain, visual and nervous system development. These products also supplement the mother’s diet byproviding either DHA or ARA with increased proteins, as well as 24 vitamins and minerals. Our pediatricvitamin products, such as Enfamil Poly-Vi-Sol, provide a range of benefits for infants, including multivitaminsand iron supplements. These other products comprised 4%, 3%, and 3% of our net sales for the years endedDecember 31, 2009, 2008, and 2007, respectively.
The Special Supplemental Nutrition Program for Women, Infants and Children (WIC)
The WIC program is a U.S. Department of Agriculture (USDA) program created to provide nutritious foods,nutrition education and referrals to health care professionals and other social services to those considered to be atnutritional risk, including low-income pregnant, postpartum and breastfeeding women and infants and childrenup to age five. It is estimated that approximately 52% of all infants born in the United States during the 12-monthperiod ending December 31, 2009, benefited from the WIC program. The USDA program is administeredindividually by each state.
Participation in the WIC program is an important part of our U.S. business based on the volume of infant formulasold under the program. Our financial results reflect net WIC sales, after taking into account the rebates we paidto the state WIC agencies, which represented approximately 14% of our U.S. net sales and 5% of our global netsales in the year ended December 31, 2009.
During 2009, changes went into effect that resulted in less infant formula per participant being provided underthe WIC program. We do not believe that these changes will have an adverse effect on our business.
WIC Eligibility and Participation
The WIC program is available in all 50 U.S. states, 34 Indian Tribal Organizations, American Samoa, District ofColumbia, Guam, Commonwealth Islands of the Northern Marianas, Puerto Rico and the U.S. Virgin Islands. Tobe eligible to participate in WIC, one must: (1) be a pregnant or postpartum woman or a child less than five yearsof age, (2) be at “nutrition risk”, as determined by a health care professional and (3) meet certain incomerequirements. Under the WIC eligibility guidelines, families who are at or below 185% of the U.S. poverty levelmay participate (with some adjunct eligibility for families qualifying for other federal aid programs).
Process
Most state WIC programs provide vouchers that participants use at authorized food stores to obtain the productscovered by the program, including infant formula. Each state WIC agency is responsible for authorizing stores toaccept WIC vouchers. Nearly 49,000 stores currently are authorized to accept WIC vouchers.
State WIC agencies enter into contracts with manufacturers, pursuant to which the state agency provides motherswith vouchers for a single manufacturer’s brand of infant formula and, in return, the manufacturer gives the stateagency a rebate for each can of infant formula purchased by WIC participants. The manufacturer’s brand ofinfant formula provided by WIC varies from state to state depending on which manufacturer received theparticular state’s exclusive contract.
Retailers purchase infant formula directly from the manufacturer, paying the manufacturer’s published wholesaleprice. Mothers redeem the vouchers received from the WIC agency for infant formula at authorized retailers. Theretailer is then reimbursed the full retail price by the WIC agency for redeemed vouchers. On a monthly basis,
7
each state WIC agency invoices the contracted manufacturer for an amount equal to the number of cans of infantformula redeemed by the agency and paid to retailers during the month multiplied by the agreed rebate per can.
Contracts
The bid solicitation process is determined by each state’s procurement laws, but the process is relativelystandardized across the WIC program. Some states form groups and hold their bid processes jointly while otherstates solicit bids individually. Some states split bids between separate contracts for milk- and soy-basedformulas. During the bid process, each manufacturer submits a sealed bid. The manufacturer with the lowest netprice, calculated as the manufacturer’s published wholesale price less the manufacturer’s rebate bid, is awardedthe contract. No other factors are considered. WIC contracts are generally three years in duration with somecontracts providing for extensions. Specific contract provisions can vary significantly from state to state.
Our WIC Participation
Manufacturers that choose to compete for WIC contracts must have a widely distributed infant formula brand inorder to meet the requirements of the contract bidding process. As of December 31, 2009, we hold the contractsthat supply approximately 41% of WIC births. During 2009, we were the successful bidder for WIC contracts inArkansas, Mississippi, Nebraska, New Mexico, North Carolina and South Dakota. These were all renewals ofcontracts that we previously held.
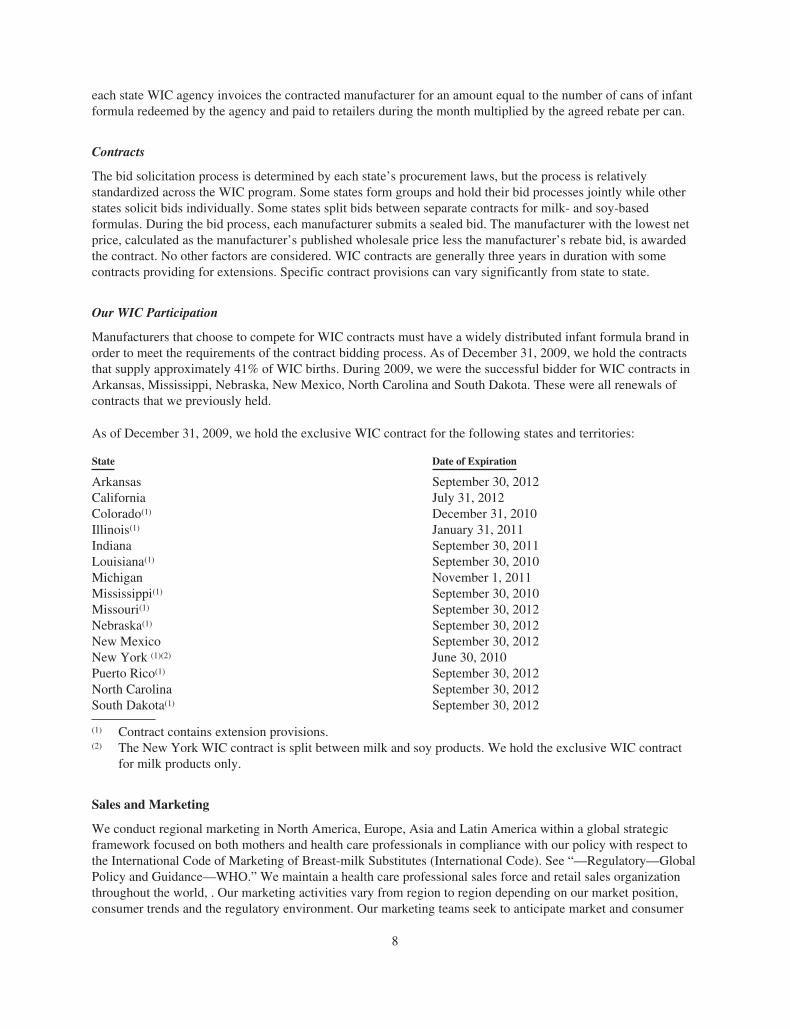
As of December 31, 2009, we hold the exclusive WIC contract for the following states and territories:
State Date of Expiration
Arkansas September 30, 2012California July 31, 2012Colorado(1) December 31, 2010Illinois(1) January 31, 2011Indiana September 30, 2011Louisiana(1) September 30, 2010Michigan November 1, 2011Mississippi(1) September 30, 2010Missouri(1) September 30, 2012Nebraska(1) September 30, 2012New Mexico September 30, 2012New York (1)(2) June 30, 2010Puerto Rico(1) September 30, 2012North Carolina September 30, 2012South Dakota(1) September 30, 2012
(1) Contract contains extension provisions.(2) The New York WIC contract is split between milk and soy products. We hold the exclusive WIC contract
for milk products only.
Sales and Marketing
We conduct regional marketing in North America, Europe, Asia and Latin America within a global strategicframework focused on both mothers and health care professionals in compliance with our policy with respect tothe International Code of Marketing of Breast-milk Substitutes (International Code). See “—Regulatory—GlobalPolicy and Guidance—WHO.” We maintain a health care professional sales force and retail sales organizationthroughout the world, . Our marketing activities vary from region to region depending on our market position,consumer trends and the regulatory environment. Our marketing teams seek to anticipate market and consumer
8
trends, and attempt to capture deep consumer insight to determine strategy for brand positioning andcommunication, product innovation and demand-generation programs. The marketing teams work with externalagencies to create strong marketing campaigns for health care professionals, retail sales organizations andconsumers, as permitted under the International Code and individual countries’ laws and regulations.
Health Care Professionals
Our health care professional sales force educates health care professionals about the benefits of our infantformula products in each of the countries where we market our infant formula products. Primary marketingefforts for infant formula products are directed toward securing the recommendation of the Enfa family of brandsby physicians or other health care professionals. We focus our product detailing efforts on neonatal intensive careunits, physicians and other health care professionals, hospital group purchasing organizations and otherintegrated buying organizations. We believe we have an industry-leading health care professional sales force.
Our health care professional sales force receives continuous training about our products and on customer serviceskills. We support health care professionals by organizing continuing medical education programs, symposia andother educational interfaces with health care professionals.
Retail Sales Organization
Our retail sales force markets our products to each of the retail channels where our products are purchased byconsumers, including mass merchandisers, club stores, grocery stores, drug stores and, to a limited extent,convenience stores. The size, role and purpose of our retail sales organization varies significantly from country tocountry depending on our market position, the consolidation of the retail trade, consumer trends and theregulatory environment. In North America, Latin America and Asia, we focus on all retail channels, while inEurope we focus primarily on pharmacies. In most countries, we have entered into logistics partnerships withdistributors and wholesalers.
Consumers
As their children grow older, mothers play an increasing role in brand selection. We participate in a variety ofmarketing activities intended for mothers of older children, including print and television advertising, direct mail,online/internet and promotional programs. Our marketing is evidence-based and emphasizes our superiornutritional science. Our direct marketing efforts focus upon the targeted direct-mail and coupon distributionprograms designed to reach consumers at key decision points starting from the pre-natal period. Direct mailincludes educational materials as well as discount coupons.
In the United States our Enfamil Family Beginnings program provides new or prospective mothers with manyresources to help them with their newborns, including free samples, nutritional and developmental informationfor mother and child and widely accepted instantly redeemable checks. The program also includes a direct mailcomponent used to better inform mothers on nutritional and developmental topics, as well as frequent e-mailupdates that provide pertinent information to program participants. The marketing materials at each of thesestages are designed to develop interest in our products with respect to mothers’ current and future needs in orderto drive purchase and create brand loyalty. The program’s educational materials are designed to help all motherswith their newborns while the program’s promotional aspects are focused primarily on our core consumer targets,mainly non-WIC mothers.
Global Supply Chain
We manage sourcing, manufacturing and distribution through our fully integrated global supply chain. Weoperate in-house production facilities at seven different locations around the world and additionally use third-party manufacturers for a portion of our requirements. We use our in-house production facilities for themanufacture of products distributed throughout Europe and Latin America. We use a third-party manufacturer in
9
addition to in-house facilities for products distributed throughout North America. Our in-house productionfacilities and third-party manufacturers provide certain material for finishing products in China, the Philippinesand Thailand for distribution throughout Asia. In addition, our liquid manufacturing facility at Evansville,Indiana, manufactures and packages liquid products that are distributed worldwide and also manufactures adultnutritional products for a third party. We believe our global manufacturing facilities and third-party supply chainwill continue to meet our worldwide demand.
Locations
Our in-house manufacturing and finishing facilities are located in the United States, Mexico, the Netherlands,China, the Philippines and Thailand. See “Item 2. Properties” for a description of our global manufacturingfacilities.
As the production process advances, regional or sub-regional teams support the global team, overseeingmanufacturing activities such as the finishing of our products. Our four regional quality departments performregional and manufacturing site quality control and assurance. These departments focus on regulatoryrequirements, food safety, continuous quality improvement, third-party compliance and ingredient suppliermanufacturing operations.
Suppliers
We generally enter into long-term supply agreements. We have over 30 suppliers, through which we sourceapproximately 80% of our materials. Through these suppliers, we obtain key raw materials (such as dairy,agricultural oil and agricultural products) and primary packaging materials (such as cans). Our suppliers alsoprovide us with minor raw materials and secondary packaging materials (such as cardboard and shipping cases).
We procure key raw materials and primary packaging materials on a global basis. Certain raw materials, whilemanaged and contracted on a global basis, are subject to regional and local variations in price under the terms ofthe supply agreement. For example, milk prices vary at the local level around the world partly due to governmentpricing regulation. Dairy products, consisting primarily of milk powders, non-fat dry milk, lactose and wheyprotein concentrates, accounted for approximately 37% of our global expenditures for materials in the year endedDecember 31, 2009.
Distribution
We manage our distribution networks locally with regional oversight. We generally enter into distributionagreements with third-party logistics providers and distributors and maintain a small staff at the local or regionallevel to track performance and implement initiatives.
Customers
Our products are sold principally to wholesale and retail customers, both nationally and internationally. One ofour customers, Wal-Mart Stores, Inc., including sales to Sam’s Club (Wal-Mart), accounted for approximately12%, 13% and 15% of our gross sales for the years ended December 31, 2009, 2008, and 2007, respectively.
Competition
We compete in two primary categories, infant formula and children’s nutrition. The competitive landscape ineach category is similar around the world, as the majority of the large global players are active in thesecategories. Our main global competitors for sales of infant formula and children’s nutrition products are NestléS.A., Abbott Laboratories, Groupe Danone and Pfizer. Pfizer does not compete with us in the United States. Wealso compete against significant local competitors in Asia and Europe.
10
Many other companies, including manufacturers of private label, store and economy brand products, manufactureand sell one or more products that are similar to those marketed by us. We believe sources of competitiveadvantage include product quality and clinical claims for efficacy, brand identity, image and associated value,broad distribution capabilities and consumer satisfaction. Significant expenditures for advertising, promotion andmarketing are generally required to achieve acceptance of products among consumers and health careprofessionals.
Research and Development (R&D)
Continuing to invest in R&D capabilities is an important part of our business. Our research and developmentorganization consists of professionals of which many have extensive industry experience and advancededucational backgrounds stationed primarily at three main research facilities. In 2010, we will completeconstruction of a new scalable pilot plant in Evansville, Indiana, headquarters of our global R&D operations. Wealso have R&D facilities in Mexico and Thailand.
With respect to infant formula, we organize our research and development on a global scale because thesescience-based products address nutritional needs that are broadly common around the world. With respect tochildren’s nutritional products, we organize our research and development on a more regional basis toincorporate geographic-specific consumer behaviors and preferences.
We have implemented a global formulation management system to support our innovative portfolio managementand product development process. We expect this system will provide significant benefits throughout the productdevelopment and manufacturing process.
We also have strong external development relationships that complement our internal research and developmentcapabilities. We manage our research and development activities in collaboration with leading scientists andinstitutes around the world and we have an active portfolio of projects involving commercial technologysuppliers. We believe this approach allows us to be at the forefront of scientific and technological developmentsrelevant for pediatric nutrition. Research and development expense was $71.9 million, $72.8 million, and$67.2 million in the years ended December 31, 2009, 2008, and 2007, respectively.
Intellectual Property
Patents
We own or license approximately 33 active U.S. and 118 non-U.S. patents and have 66 U.S. and 423 non-U.S.patent applications pending as of December 31, 2009.
Trademarks
We file and maintain our trademarks in those countries in which we have, or desire to have, a business presence.We hold an extensive portfolio of trademarks across our key geographies. We maintain more than5,800 trademark registrations and applications in more than 140 countries worldwide.
Regulatory
We are subject to the laws and regulations in each country in which we market our products. We have provenprocesses, systems and resources in place to manage the current regulatory requirements and to participateproactively in the shaping of future regional, country and global policy, guidance and regulations.
United States Food and Drug Administration (U.S. FDA)
The main regulatory body in the United States is the U.S. FDA. The U.S. FDA’s Center for Food Safety andApplied Nutrition is responsible for the regulation of infant formula. The Office of Nutritional Products,
11
Labeling, and Dietary Supplements (ONPLDS) has program responsibility for infant formula while the Office ofFood Additive Safety (OFAS) has program responsibility for food ingredients and packaging. The ONPLDSevaluates whether the infant formula manufacturer has met the requirements under the Federal Food, Drug andCosmetic Act (FFDCA) and consults with the OFAS regarding the safety of ingredients in infant formula and ofpackaging materials for infant formula.
All manufacturers of pediatric nutrition products must begin with safe food ingredients, which are eithergenerally recognized as safe or approved as food additives. The specific requirements for infant formula aregoverned by the Infant Formula Act of 1980, as amended (Formula Act). The purpose of the Formula Act is toensure the safety and nutrition of infant formulas, including minimum, and in some cases, maximum levels ofspecified nutrients.
Once an infant formula product is formulated, the manufacturer must provide regulatory agencies assurance ofthe nutritional quality of that particular formulation before marketing the infant formula. The U.S. FDA hasestablished requirements for certain labeling, nutrient content, manufacturer quality control procedures (to assurethe nutrient content of infant formulas), as well as company records and reports. A manufacturer must notify theU.S. FDA 90 days before the first processing of any infant formula that differs fundamentally in processing or incomposition from any previous formulation produced by the manufacturer. The U.S. FDA currently is finalizingincremental good manufacturing practices, quality control procedures, quality factors, notification requirements,and reports and records, for the production of infant formulas.
In addition, as part of its responsibility to implement the provisions of the FFDCA, the U.S. FDA continuouslymonitors infant formula products. The FFDCA requires infant formula manufacturers to test product compositionduring production and shelf-life, to keep records on production, testing and distribution of each batch of infantformula and to use good manufacturing practices and quality control procedures. In addition, the FFDCArequires infant formula manufacturers to maintain records of all complaints, some of which are reviewed toreveal the possible existence of a hazard to health. The U.S. FDA conducts yearly inspections of all facilities thatmanufacture infant formula. The U.S. FDA also inspects new facilities during early production runs. As part ofthe inspection, the U.S. FDA collects and analyzes samples of infant formula.
Outside of the United States
Country-specific regulatory laws have provisions that include requirements for certain labeling, nutrient contentand manufacturers quality control procedures (to assure the nutrient content of infant formulas), as well ascompany records and reports. With the exception of the European Union, most other countries’ regulatoryagencies have not promulgated specific requirements for the testing of new and reformulated infant formulas.Other countries will generally refer to the U.S. FDA, European Union or the World Health Organization (WHO)in establishing standards and regulations for infant formulas.
Global Policy and Guidance
WHO
The WHO is the directing and coordinating authority for health within the United Nations system. It isresponsible for providing leadership on global health matters, shaping the health research agenda, setting normsand standards, articulating evidence-based policy options, providing technical support to countries andmonitoring and assessing health trends.
In 1981, many Member States of the WHO’s World Health Assembly voted to adopt the International Code. TheInternational Code aims to protect and promote breastfeeding and to ensure the proper use of breast-milksubstitutes when they are necessary on the basis of adequate information and through appropriate marketing anddistribution. Countries have taken variable action to enact legislation based on the recommendations of theInternational Code. In 1983, we believe we were the first U.S. infant formula manufacturer to develop internal
12
marketing guidelines for developing countries based on the International Code. While the International Code isnot international law, it is our policy to comply with all applicable laws and regulations and International Codeguidance in developing countries. In developed countries such as the United States and Canada, we comply withthose countries’ laws and regulations.
CODEX
The Codex Alimentarius Commission (CODEX), a global body formed by the United Nations Food andAgriculture Organization, is the publication of internationally recognized standards, codes of practice, guidelinesand other recommendations relating to infant formula and food production. These texts are developed andmaintained by the CODEX Commission, a body that was established in 1963 by the WHO. In 2007, newcomprehensive and more restrictive infant formula standards were published by CODEX. It is usual practice forcountries in Central America, Latin America, Africa and Asia to incorporate CODEX standards directly intonational law. We maintain material compliance with all country law and with new CODEX standards wherenational regulatory requirements have not yet been enacted.
Environmental, Health and Safety
Our facilities and operations are subject to various environmental, health and safety laws and regulations in eachof the jurisdictions in which we operate. Among other things, these requirements regulate the emission ordischarge of materials into the environment, the use, management, treatment, storage and disposal of solid andhazardous substances and wastes, the control of combustible dust, the reduction of noise emissions and fire andexplosion risks, the cleanup of contamination and the prevention of workplace exposures and injuries. Pollutioncontrols and various permits and programs are required for many of our operations. Each of our globalmanufacturing facilities undergoes periodic internal audits relating to environmental, health and safetyrequirements and we incur operating and capital costs to improve our facilities or maintain compliance withapplicable requirements on an ongoing basis. If we violate or become subject to liabilities under environmental,health and safety laws and regulations, including requirements under the permits and programs required for ouroperations, we could incur, among other things, substantial costs (including civil or criminal fines or penalties orclean-up costs), third-party claims for property damage or personal injury, or requirements to install additionalpollution control or safety equipment.
From time to time, we may be responsible under various state, Federal and foreign laws, including the U.S.Comprehensive Environmental Response, Compensation, and Liability Act (CERCLA), for certain costs ofinvestigating and/or remediating contamination at our current or former sites and/or at waste disposal orreprocessing facilities operated by third parties. Liability under CERCLA and analogous state or foreign lawsmay be imposed without regard to knowledge, fault or ownership at the time of the disposal or release. Most ofour facilities have a history of industrial operations, and contaminants have been detected at some of ourfacilities. We also have been named as a “potentially responsible party”, or are involved in investigation andremediation, at three third-party disposal sites. As of December 31, 2009, management believes that theinvestigation and/or remediation costs related to our sites or third-party disposal sites that were probable andreasonably estimable, as well as any related accruals, are not material to us.
We are not aware of any pending environmental, health or safety-related litigation or significant environmental,health or safety-related financial obligations or liabilities arising from current or former operations or propertiesthat are likely to have a material adverse impact on our business, financial position or results of operations.Liabilities or obligations, which could require us to make significant expenditures, could arise in the future,however, as the result of, among other things, changes in, or new interpretations of, existing laws, regulations orenforcement policies, claims relating to on- or off-site contamination, or the imposition of unanticipatedinvestigation or cleanup obligations. See “Item 3. Legal Proceedings.”
13
Insurance
Our business involves an inherent risk of product liability and any claims of this type could have an adverseimpact on us. We will take what we believe are appropriate precautions, primarily self-insurance combined withproduct liability insurance coverage, to provide adequate coverage for possible product liability claims. Thoughour insurance coverage and cash flows have been adequate to provide for liability claims in the past, productliability claims could exceed our insurance coverage limits and cash flows, and insurance may not be availableon commercially reasonable terms or at all. We evaluate our insurance requirements on an ongoing basis toensure we maintain adequate levels of coverage.
Employees
As of December 31, 2009, we employed approximately 5,600 people worldwide. Our manufacturing workforcesat Zeeland, Michigan; Evansville, Indiana; Guangzhou, China; and Chonburi, Thailand are not unionized. Themanufacturing workforce at Delicias, Mexico, is unionized and covered by a collective bargaining agreement,with an annual negotiation process with the union. We completed a salary renegotiation with the union inDelicias on March 31, 2009, and the contract is subject to a comprehensive renegotiation March 31, 2010. Themanufacturing workforce and the non-supervised sales force at Makati, Philippines, are unionized and coveredby a collective bargaining agreement, which expires on December 31, 2010. In addition, several of ourworkforces in Europe have works council representation. We believe our employee relations are satisfactory.
Available Information
Our internet web site address is www.meadjohnson.com. On our web site, we make available, free of charge, ourannual, quarterly and current reports, including amendments to such reports, as soon as reasonably practicableafter we electronically file such material with, or furnish such material to, the U.S. Securities and ExchangeCommission (SEC). Stockholders and other interested parties may request email notification of the posting ofthese documents through the section of our web site captioned “Investors.”
Any materials we file with the SEC may be read and copied at the SEC’s Public Reference Room at 100 F.Street, N.E., Washington, DC, 20549. Information on the operation of the Public Reference Room may beobtained by calling the SEC at 1-800-SEC-0330. The SEC maintains an Internet site at www.sec.gov thatcontains reports, proxy information statements and other information regarding issuers that file electronicallywith the SEC.
We incorporate herein by reference certain information from parts of our Proxy Statement for the 2010 AnnualMeeting of Stockholders. The SEC allows us to disclose important information by referring to it in that manner.Please refer to such information. Our Proxy Statement for the 2010 Annual Meeting of Stockholders and 2009Annual Report to Shareholders will be available on our website, www.meadjohnson.com, under the “Investors”caption on or about April 2, 2010.
The information on our website is not, and shall not be deemed to be, a part of this Annual Report on Form 10-Kor incorporated into any other filings we make with the SEC.
14
Item 1A. RISK FACTORS
In addition to the other information in this Annual Repot on Form 10-K, any of the factors described below couldsignificantly and negatively affect the our business, prospects, financial condition or operating results, whichcould cause the trading price of our common stock to decline.
Risks Relating to Our Business
Our success depends on sustaining the strength of our brands, particularly our Enfa family of brands.
The Enfa family of brands accounts for a significant portion of our net sales. The willingness of consumers topurchase our products depends upon our ability to offer attractive brand value propositions. This in turn dependsin part on consumers attributing a higher value to our products than to alternatives. For example, in the UnitedStates, we face significant competition from the Similac brand of infant formula. If the difference in the valueattributed to our products as compared to those of our competitors narrows, or if there is a perception of such anarrowing, consumers may choose not to buy our products. If we fail to promote and maintain the brand equity ofour products across each of our markets, then consumer perception of our products’ nutritional quality may bediminished and our business could be materially adversely affected. Our ability to maintain or improve our valuepropositions will impact whether these circumstances will result in decreased market share and profitability.
We may experience liabilities or negative effects on our reputation as a result of real or perceived qualityissues, including product recalls, injuries or other claims.
Whether real or perceived, contamination, spoilage or other adulteration, product mislabeling or producttampering could require us to recall products. From time to time we have experienced recalls of our products.While such recalls have not been material to our business on a global level in the past, we cannot assure you thatsuch material product recalls will not occur in the future. We may also be subject to liability if our products oroperations violate or are alleged to violate applicable laws or regulations or in the event our products cause, orare alleged to cause, injury, illness or death.
Powder milk products are not sterile. A substantial portion of our products must be prepared and maintainedaccording to label instruction to retain their flavor and nutritional value and avoid contamination or deterioration.Depending on the specific type of product, a risk of contamination or deterioration may exist at each stage of theproduction cycle, including the purchase and delivery of raw food materials, the processing and packaging offood products and upon use and handling by health care professionals, hospital personnel and consumers. In theevent that certain of our products are found, or are alleged, to have suffered contamination or deterioration,whether or not such products were under our control, our brand reputation and business could be materiallyadversely affected.
Whether real or perceived, reports or allegations of inadequate product quality control with respect to othermanufacturers of pediatric nutrition products also could adversely impact sales of our products. For example, inNovember 2008 and December 2008, the U.S. FDA released test results that identified extremely low trace levelsof melamine and cyanuric acid in infant formula produced by U.S. manufacturers. The U.S. FDA has found nomelamine in our products, and only a trace amount of cyanuric acid, which the U.S. FDA believes does not raisepublic health concerns, was found in a sampling of our products. Chinese authorities found significant levels ofmelamine in Chinese dairy used in certain infant formula products of other manufacturers, which led to thedeaths of several infants in September 2008. We do not use dairy or protein-containing raw ingredients fromChina at any of our manufacturing sites and we have not been adversely impacted by these events in China thusfar. In addition, although the U.S. FDA currently permits the use of bisphenol-A (BPA) in food packagingmaterials, including various products intended for use by infants and children, recent public reports andallegations regarding the potential health hazards of BPA could contribute to a perceived safety risk for suchmaterials and adversely impact sales or otherwise disrupt our business. Moreover, certain states and
15
municipalities have either proposed or already passed legislation banning the use of BPA in certain infantproducts. If the U.S. FDA, other regulatory authorities or state legislatures were to follow the lead of these statesand municipalities, the use of BPA could be entirely prohibited in the future. Events such as these may create aperception of contamination risk among consumers with respect to all products in our industry.
In addition, we advertise our products and could be the target of claims relating to false or deceptive advertisingunder foreign laws and U.S. federal and state laws, including the consumer protection statutes of some states. Asignificant product liability or other legal claim or judgment against us or a widespread product recall maynegatively impact our profitability. Even if a product liability or consumer fraud claim is unsuccessful or is notmerited or fully pursued, the negative publicity surrounding such assertions regarding our products or processescould materially adversely affect our reputation and brand image and therefore our business.
We are subject to numerous governmental regulations, and it can be costly to comply with these regulations.Changes in governmental regulations could harm our business.
As a producer of pediatric nutrition products, our activities are subject to extensive regulation by governmentalauthorities and international organizations, including rules and regulations with respect to the environment,employee health and safety, hygiene, quality control, advertising and tax laws. It can be costly to comply withthese regulations and to develop compliant product processes. Our activities may also be subject to all kinds ofbarriers or sanctions imposed by countries or international organizations limiting international trade andincreasingly dictating the specific content of our products and, with regard to the protection of consumer healthand safety, limiting information and advertising about the health benefits of products that we market. In addition,regulatory changes or decisions that restrict the marketing, promotion and availability of our products, continuedaccess to health care professionals, the ability to include genetically modified organisms in our products, as wellas the manufacture and labeling of our products, could materially adversely affect our business. For example,regulations in the Philippines require governmental review of all advertisements for products intended forchildren under the age of two. In addition, certain consumer advocates, along with governmental agencies andnon-governmental organizations, have lobbied against the marketing and sale of some pediatric nutritionproducts. These efforts could result in increased regulatory restrictions on our activities in the future. Ouractivities could be materially adversely affected by any significant changes in such regulations or theirenforcement. Our ability to anticipate and comply with evolving global standards requires significant investmentin monitoring the global regulatory environment and we may be unable to comply with changes in regulationrestricting our ability to continue to operate our business or manufacture, market or sell our products.
Commodity price increases will increase our operating costs and may reduce our profitability.
Commodity prices impact our business directly through the cost of raw materials used to make our products(such as skim milk powder, lactose and whey protein concentrate), the cost of inputs used to manufacture andship our products (such as crude oil and energy) and the amount we pay to produce or purchase packaging for ourproducts (such as cans, pouches, cardboard and plastic). Commodities such as these are susceptible to pricevolatility caused by conditions outside of our control, including fluctuations in commodities markets, currencyfluctuations, availability of supply, weather, consumer demand and changes in governmental agriculturalprograms. Dairy costs are the largest component of our cost of goods sold. Increases in the price of dairy andother raw materials would negatively impact our gross margins if we were unable able to offset such increasesthrough increases in our selling price, changes in product mix or cost reduction/productivity enhancement efforts.The prices of these materials may continue to rise due to a general increase in commodities prices, especially foragricultural products. This would in turn affect the unit costs of products sold for our pediatric nutrition products.Although we monitor our exposure to commodity prices as an integral part of our overall risk managementprogram, continued volatility in the prices of commodities we purchase could increase the costs of our productsand we may experience lower profitability and be unable to maintain historical levels of productivity.
Our business is particularly vulnerable to commodity price increases in Asia, the fastest growing region in thepediatric nutrition industry. Commodity price increases in Asia could reduce our profits and limit our ability
16
to pursue our growth strategy in that region. We employ various purchasing and pricing contract techniques in aneffort to minimize commodity price volatility. Generally, these techniques include incorporating clauses settingforth unit pricing that is based on an average commodity price over a corresponding period of time. If we fail tomanage our commodity price exposure adequately, our business may be materially adversely affected.
Our profitability may suffer as a result of competition in our markets.
The pediatric nutrition industry is intensely competitive. Our primary competitors, including Nestlé S.A., AbbottLaboratories, Groupe Danone and Pfizer, have substantial financial, marketing and other resources. We competeagainst large global companies, as well as regional and local companies, in each of the regions in which weoperate. In most product categories, we compete not only with other widely advertised branded products, but alsowith private label, store and economy brand products that are generally sold at lower prices. Competition in ourproduct categories are based on the following factors:
• brand recognition and loyalty;
• product quality;
• effectiveness of marketing, promotional activity and the ability to identify and satisfy consumerpreferences;
• product innovation;
• price; and
• distribution and availability of products.
From time to time, in order to protect our existing market share or capture increased market share, we may needto improve our brand recognition and product value proposition, and increase our spending on marketing,advertising and new product innovation. The success of marketing, advertising and new product innovation issubject to risks, including uncertainties about trade and consumer acceptance. We may also need to reduce pricesfor some of our products in order to respond to competitive and customer pressures and to maintain our marketshare. Competitive and customer pressures may restrict our ability to increase prices, including in response tocommodity and other cost increases. Our business will suffer if profit margins decrease, either as a result of areduction in prices or an increase in costs with an inability to increase prices proportionally.
Economic downturns could cause consumers to shift their purchases from our higher-priced premiumproducts to lower-priced products, including private label or store brands, which could materially adverselyaffect our business.
The willingness of consumers to purchase premium brand pediatric nutrition products depends in part on localeconomic conditions. In periods of economic uncertainty, consumers may shift their purchases from our higher-priced premium products to lower-priced products, including private label and store brand products.
Turmoil in the financial markets could adversely affect our liquidity, cash flow and financial flexibility, aswell as the demand for our products.
Turmoil in the financial markets has adversely affected economic activity and credit markets in the United Statesand other regions of the world in which we do business. This could have an adverse impact on our customers,distributors, suppliers, counterparties to certain financial instruments, financial service providers and otherservice providers.
Our operations face significant foreign currency exchange rate exposure that could materially negativelyimpact our operating results.
We hold assets, incur liabilities, earn revenue and pay expenses in a variety of currencies other than the U.S.dollar, primarily the Chinese renminbi, the Hong Kong dollar, the Philippine peso, the Mexican peso, the euro,
17
the Malaysian ringitt and the Canadian dollar. Because our financial statements are presented in U.S. dollars, wemust translate our assets, liabilities, sales and expenses into U.S. dollars at the then-applicable exchange rates.Consequently, changes in the value of the U.S. dollar versus these other currencies may negatively affect thevalue of these items in our financial statements, even if their value has not changed in their original currency.While we attempt to mitigate some of this risk with hedging and other activities, our business will neverthelessremain subject to substantial foreign exchange risk from foreign currency translation exposures that we will notbe able to manage through effective hedging or the use of other financial instruments.
The global nature of our business subjects us to additional business risks that could cause our sales andprofitability to decline.
We operate our business and market our products internationally in more than 50 countries. For the years endedDecember 31, 2009, 2008, and 2007, 65%, 62%, and 56%, respectively, of our net sales were generated incountries outside of the United States. The risks associated with our operations outside of the United Statesinclude:
• multiple regulatory requirements that are subject to change and that could restrict our ability tomanufacture, market or sell our products;
• inflation, recession, fluctuations in foreign currency exchange and interest rates and discriminatoryfiscal policies;
• adverse tax consequences from the repatriation of cash;
• trade protection measures, including increased duties and taxes, and import or export licensingrequirements;
• price controls;
• government health promotional programs intended to discourage the use of our products;
• differing local product preferences and product requirements;
• difficulty in establishing, staffing and managing operations;
• differing labor regulations;
• potentially negative consequences from changes in or interpretations of tax laws;
• political and economic instability;
• enforcement of remedies in various jurisdictions;
• changes in foreign medical reimbursement policies and programs; and
• diminished protection of intellectual property in some countries.
These and other risks could have a material adverse effect on our business.
Our global operations are subject to political and economic risks of developing countries, and special risksassociated with doing business in corrupt environments.
We operate our business and market our products internationally in more than 50 countries, and we are focusingon increasing our sales and in some cases establishing new production facilities in regions, including Asia, LatinAmerica, India and the Middle East, which are less developed, have less stability in legal systems and financialmarkets, and are generally recognized as potentially more corrupt business environments than the United States,and therefore present greater political, economic and operational risks. We have in place policies, procedures andcertain ongoing training of employees with regard to business ethics and many key legal requirements, such asapplicable anti-corruption laws, including the U.S. Foreign Corrupt Practices Act (FCPA), which make it illegal
18
for us to give anything of value to foreign officials in order to obtain or retain any business or other advantages;however, there can be no assurance that our employees will adhere to our code of business ethics or any other ofour policies, applicable anti-corruption laws, including the FCPA, or other legal requirements. If we fail toenforce our policies and procedures properly or maintain adequate record-keeping and internal accountingpractices to accurately record our transactions, we may be subject to regulatory sanctions. If we believe or havereason to believe that our employees have or may have violated applicable anti-corruption laws, including theFCPA, or other laws or regulations, we are required to investigate or have outside counsel investigate the relevantfacts and circumstances, and if violations are found or suspected could face civil and criminal penalties, andsignificant costs for investigations, litigation, fees, settlements and judgments, which in turn could have amaterial adverse effect on our business.
Sales of our products are subject to changing consumer preferences, and our success depends upon our abilityto predict, identify and interpret changes in consumer preferences and develop and offer new products rapidlyenough to meet those changes.
Our success depends on our ability to predict, identify and interpret the tastes, dietary habits and nutritional needsof consumers and to offer products that appeal to those preferences. If we do not succeed in offering productsthat consumers want to buy, our sales and market share will decrease, resulting in reduced profitability. If we areunable to predict accurately which shifts in consumer preferences will be long lasting, or to introduce new andimproved products to satisfy those preferences, our sales will decline. In addition, given the variety of culturesand backgrounds of consumers in our global consumer base, we must offer a sufficient array of products tosatisfy the broad spectrum of consumer preferences. As such, we must be successful in developing innovativeproducts across our product categories.
The consolidation of our retail customers may put pressures on our profitability.
Our retail customers, such as mass merchandisers, club stores, grocery stores, drug stores and convenience stores,have consolidated in recent years and consolidation is expected to continue throughout the United States, Europeand other major markets. This consolidation has produced large, sophisticated customers with increased buyingpower, which are more capable of operating with reduced inventories, resisting price increases and demandinglower pricing, increased promotional programs and specifically tailored products. These customers also may useshelf space currently used for our products for their private label or store brand products. Meeting demands fromthese customers may adversely affect our margins and, if we fail to effectively respond to these demands, oursales could decline, each of which could materially adversely affect our profitability.
We rely on third parties to provide us with materials and services in connection with the manufacturing anddistribution of our products.
Unaffiliated third-party suppliers provide us with materials necessary for commercial production of our products,including certain key raw materials (such as dairy, agricultural oil and agricultural products) and primarypackaging materials (such as cans). In particular, Martek Biosciences Corporation (Martek) provides us withmost of the supply of DHA and ARA that we use in our products. We may be unable to manufacture our productsin a timely manner, or at all, if any of our third-party suppliers, including Martek, should cease or interruptproduction or otherwise fail to supply us or if the supply agreements are suspended, terminated or otherwiseexpire without renewal. If these suppliers are not able to supply us with the quantities of materials we need or ifthese suppliers are not able to provide services in the required time period, this could have a material adverseeffect on our business. We also utilize third parties in several countries throughout the world to distribute ourproducts. If any of our third-party distributors fail to distribute our products in a timely manner, or at all, or if ourdistribution agreements are suspended, terminated or otherwise expire without renewal, our profitability could bematerially adversely affected.
19
The manufacture of many of our products is a highly exacting and complex process, and if we or one of oursuppliers should encounter problems manufacturing products, our business could suffer.
The manufacture of many of our products is a highly exacting and complex process, in part due to strictregulatory requirements. Problems may arise during the manufacturing process for a variety of reasons, includingequipment malfunction, failure to follow specific protocols and procedures, problems with raw materials,maintenance of our manufacturing environment, natural disasters, various contagious diseases and process safetyissues. If problems arise during the production of a batch of product, that batch of product may have to bediscarded. This could, among other things, lead to increased costs, lost sales, damage to customer relations, timeand expenses being spent investigating the cause and, depending on the cause, similar losses with respect to otherbatches or products. If problems are not discovered before the affected product is released to the market, recalland product liability costs as well as reputational damage may also be incurred. To the extent that we or one ofour suppliers experience significant manufacturing problems, this could have a material adverse effect on ourbusiness.
We may experience difficulties and delays inherent in the manufacturing and selling of our products.
We may experience difficulties and delays inherent in the manufacturing and selling of our products, such as:(1) seizure or recalls of products or forced closings of manufacturing plants; (2) the failure to obtain, theimposition of limitations on the use of, or loss of, patent, trademark or other intellectual property rights; (3) ourfailure, or the failure of any of our vendors or suppliers, to comply with current good manufacturing practicesand other applicable regulations and quality assurance guidelines that could lead to temporary manufacturingshutdowns, product shortages and delays in product manufacturing; (4) construction delays related to theconstruction of new facilities or the expansion of existing facilities, including those intended to support futuredemand for our products; (5) other manufacturing or distribution problems, including changes in manufacturingproduction sites and limits to manufacturing capability due to regulatory requirements, changes in types ofproducts produced or physical limitations that could impact continuous supply; (6) availability of raw materials;and (7) restrictions associated with the transportation of goods in and out of foreign countries.
If we fail to increase our production and manufacturing capacity, we will be unable to continue to grow andour ability to produce new products, expand within our existing markets and enter into new markets will belimited.
Global growth and demand for our products has increased the utilization of our production and manufacturingfacilities, including manufacturing capacity provided by third-party manufacturers and packaging capacity withrespect to our products. If we are unable to successfully expand our production and manufacturing capacity, wewill be unable to continue our growth and expand within our existing markets or enter into additional geographicmarkets or new product categories. In addition, failure to successfully expand our production and manufacturingcapacity will limit our ability to introduce and distribute new products, including our existing pipeline ofinnovations and product improvements, or otherwise take advantage of opportunities in new and existingmarkets. Further, increasing our production and manufacturing facilities requires significant investment and buildtimes. Delays in increasing capacity could also limit our ability to continue our growth and materially adverselyaffect our business.
Disruption of our global supply chain could materially adversely affect our business.
Our ability to manufacture, distribute and sell products is critical to our success. Damage or disruption to rawmaterial supplies or our manufacturing or distribution capabilities due to weather, natural disaster, fire, terrorism,strikes, various contagious diseases or other reasons could impair our ability to manufacture or sell our products.Failure to take adequate steps to mitigate the likelihood or potential impact of such events, or to effectivelymanage such events if they occur, particularly when a product is sourced from a single location, could materiallyadversely affect our business.
20
Changes in WIC, or our participation in it, could materially adversely affect our business.
Participation in WIC is an important part of our U.S. business based on the volume of infant formula sold underthe program. As of December 31, 2009, we hold the contracts that supply approximately 41% of WIC births. Asa result, our business strategy includes bidding for new WIC contracts and maintaining current WICrelationships. Our failure to win bids for new contracts pursuant to the WIC program or our inability to maintaincurrent WIC relationships could have a material adverse effect on our business. In addition, any changes to howthe WIC program is administered and any changes to the eligibility requirements and/or overall participation inthe WIC program could also have a material adverse effect on our business.
Our business could be harmed by a failure of our information technology, administrative or outsourcingsystems.
We rely on our information technology, administrative and outsourcing systems to effectively manage ourbusiness data, communications, supply chain, order entry and fulfillment and other business processes. We are inthe process of transitioning, retiring or replacing all of our information technology, administrative and outsourcedsystems via transition services agreements over the next two years as we fully separate from BMS informationtechnology systems and shared service functions. Difficulties or failure to implement our IT initiatives or thefailure of our information technology, administrative or outsourcing systems to perform as we anticipate coulddisrupt our business and result in transaction errors, processing inefficiencies and the loss of sales and customers,causing our business to suffer. In addition, our information technology, administrative and outsourcing systemsmay be vulnerable to damage or interruption from circumstances beyond our control, including fire, naturaldisasters, systems failures, security breaches and viruses. Any such damage or interruption could have a materialadverse effect on our business and prevent us from paying our suppliers or employees, receiving payments fromour customers or performing other information technology, administrative or outsourcing services on a timelybasis.
We may face difficulties as we expand our operations into countries in which we have no prior operatingexperience or as we expand our operations into new product categories.
We intend to continue to expand our global footprint in order to enter into new markets. This may involveexpanding into countries other than those in which we currently operate. It may involve expanding into lessdeveloped countries, which may have less political, social or economic stability and less developed infrastructureand legal systems. We also intend to expand our product portfolio by adding new product categories. As weexpand our business into new countries or product categories we may encounter regulatory, personnel,technological and other difficulties that increase our expenses or delay our ability to start up our operations orbecome profitable in such countries or product categories. This may affect our relationships with customers,suppliers and regulators and could have a material adverse effect on our business.
Resources devoted to research and development may not yield new products that achieve commercial success.
Our ability to develop new pediatric nutrition products depends on, among other factors, our ability to understandthe composition and variation of breast milk. Analyzing breast milk requires significant investment in researchand development and testing of new ingredients and new production processes. We devote significant resourcesto investment in research and development in order gain a deep understanding of the composite ingredients ofbreast milk. The research and development process is expensive, prolonged and entails considerable uncertainty.Development of a new product, from discovery through testing and registration to initial product launch,typically takes between five and seven years. Each of these periods varies considerably from product to productand country to country. Because of the complexities and uncertainties associated with research and development,products that we are currently developing may not complete the development process or obtain the regulatoryapprovals required for us to market such products successfully. In addition, new regulations or changes toexisting regulations may have a negative effect on innovations in our pipeline, especially late-stage pipeline
21
products. The development of new products may take longer and cost more to develop and may be lesssuccessful than we currently anticipate as a result of:
• products that may appear promising in development but fail to reach market within the expected oroptimal time frame, or fail to ever reach market, for any number of reasons, including efficacy and thedifficulty or excessive cost to manufacture;
• failure to enter into or successfully implement optimal alliances where appropriate for the discoveryand commercialization of products, or otherwise to maintain a consistent scope and variety ofpromising late-stage pipeline products; or
• failure of one or more of our products to achieve or maintain commercial viability.
We cannot assure you that any of our products currently in our development pipeline will be commerciallysuccessful.
We could incur substantial costs to comply with environmental, health and safety laws and regulations and toaddress violations of or liabilities under these requirements.
Our facilities and operations are subject to various environmental, health and safety laws and regulations in eachof the jurisdictions in which we operate. Among other things, these requirements regulate the emission ordischarge of materials into the environment, the use, management, treatment, storage and disposal of solid andhazardous substances and wastes, the control of combustible dust, the reduction of noise emissions and fire andexplosion risks, the cleanup of contamination and the prevention of workplace exposures and injuries. Pollutioncontrols and various permits and programs are required for many of our operations. We could incur or be subjectto, among other things, substantial costs (including civil or criminal fines or penalties or clean-up costs), thirdparty damage claims, requirements to install additional pollution control or safety control equipment and/orpermit revocations in the event of violations by us of environmental, health, and safety requirements applicableto our facilities and operations or our failure to obtain, develop or comply with required environmental permits orprograms.
In addition, most of our facilities have a history of industrial operations, and contaminants have been detected atsome of our facilities. We also have been named as a potentially responsible party with respect to threeSuperfund or state sites. We can be held responsible, in some cases without regard to knowledge, fault, orownership at the time of the release, for the costs of investigating or remediating contamination of any realproperty we or our predecessors ever owned, operated, or used as a waste disposal site. In addition, we can berequired to compensate public authorities or private owners for damages to natural resources or other realproperty, or to restore those properties, in the event of off-site migration of contamination. Changes in, or newinterpretations of, existing laws, regulations or enforcement policies, could also cause us to incur additional orunexpected costs to achieve or maintain compliance. The assertion of claims relating to on- or off-sitecontamination, the discovery of previously unknown environmental liabilities or the imposition of unanticipatedinvestigation or cleanup obligations, could result in potentially significant expenditures to address contaminationor resolve claims or liabilities. Such costs and expenditures could have a material adverse effect on our business,financial condition or results of operations.
We may not be able to adequately protect our intellectual property rights.
Given the importance of brand recognition to our business, we have invested considerable effort in seekingtrademark protection for our core brands, including the Enfa family of brands. However, we cannot be certainthat the steps we have taken will be sufficient to protect our intellectual property rights in our brands adequatelyor that third parties will not infringe upon or misappropriate any such rights. Our trademark registrations andapplications can potentially be challenged and cancelled or narrowed. Moreover, some of the countries in whichwe operate offer less protection for these rights, and may subject these rights to higher risks, than is the case inEurope or North America. In addition, it is costly to litigate in order to protect any of our intellectual property
22
rights. If we are unable to prevent third parties from infringing or misappropriating these rights in our coreproducts or brands, including our Enfa family of brands, our future financial condition and our ability to developour business could be materially adversely affected.
Other companies have from time to time taken, and may in the future take, actions that we believe violate ourintellectual property rights and we may decide to enforce (and in some cases are currently enforcing) those rightsagainst such actions. Uncertainties inherent in such litigation make the outcome and associated costs difficult topredict. If unsuccessful, the legal actions could result in the invalidation of some of our intellectual propertyrights, which could materially adversely affect our business.
We rely on a combination of security measures, confidentiality policies, contractual arrangements and tradesecret laws to protect our proprietary formulae and other valuable trade secrets. We also rely on patent, copyrightand trademark laws to further protect our intellectual property rights. We cannot, however, be certain that thesteps we take will prevent the development and marketing of similar, competing products and services by thirdparties. Our existing patents and any future patents that we obtain may not be sufficiently broad to protect usagainst third parties with similar products or to provide us with a competitive advantage. Moreover, our patentscan potentially be challenged and narrowed or invalidated. Trade secrets are difficult to protect, and despite ourefforts may become known to competitors or independently discovered. The confidentiality agreements we relyon with our employees, customers, contractors and others may be breached, and we may not have adequateremedies for such breach. Failure to adequately protect our valuable intellectual property from being infringed ormisappropriated could materially adversely affect our business.
Our sales and marketing practices may be challenged by consumers and competitors, which could harm ourbusiness.
We participate in a variety of marketing activities, including print and television advertising, direct mail, online/internet and promotional programs. We work with external agencies to create strong marketing campaigns forhealth care professionals, retail sales organizations and consumers. Although our marketing is evidence-basedand emphasizes our superior nutritional science, consumers and competitors may challenge, and have challenged,certain of our practices by claiming, among other things, false and misleading advertising with respect toadvertising for certain of our products. Such challenges could result in our having to pay monetary damages orlimit our ability to maintain current sales and marketing practices.
Although we cannot predict with certainty the ultimate resolution of such lawsuits, investigations and claimsasserted against us, we do not believe any currently pending legal proceeding to which we are a party would havea material adverse effect on our business or financial condition, although an unfavorable outcome in excess ofamounts recognized as of December 31, 2009, with respect to one or more of these proceedings could have amaterial adverse effect on our results of operations for the periods in which a loss would be recognized.
We may be required to defend ourselves against intellectual property claims from third parties, which couldharm our business.
Regardless of merit, there are third-party patents that may cover our products. Third parties may obtain patents inthe future and claim that use of our technologies infringes upon these patents. If a third party asserts that ourproducts or services are infringing upon its intellectual property, these claims could cause us to incur significantexpenses and, if successfully asserted against us, could require that we pay substantial damages and/or prevent usfrom selling our products. Even if we were to prevail against such claims, any litigation regarding intellectualproperty could be costly and time-consuming and could divert the attention of our management and keypersonnel from our business operations. Furthermore, as a result of an intellectual property challenge, we mayfind it necessary to enter into royalty licenses or other costly agreements, and we may not be able to obtain suchagreements at all or on terms acceptable to us.
23
Increases in costs of current and post-retirement benefits may reduce our profitability.
With approximately 5,600 employees, our profitability is substantially affected by costs of current and postretirement medical and other employee benefits. These costs can vary substantially as a result of changes inhealth care costs, volatility in investment returns on pension plan assets and changes in discount rates used tocalculate related liabilities. These factors may put upward pressure on the cost of providing medical and otherbenefits. We can provide no assurance that we will succeed in limiting future cost increases, and upward pressurewould reduce our profitability.
Labor disputes may cause work stoppages, strikes and disruptions.
The manufacturing workforce at Delicias, Mexico is unionized and covered by a collective bargaining agreementwith an annual negotiation process with the union. We completed a salary renegotiation with the union inDelicias on March 31, 2009, and the contract is subject to a comprehensive renegotiation March 31, 2010. Themanufacturing workforce and non-supervised sales force in Makati, Philippines are unionized and covered by acollective bargaining agreement, which expires on December 31, 2010. In addition, several of our workforces inEurope have works council representation. As a result, any labor disputes, including work stoppages, strikes anddisruptions, could have a material adverse impact on our business.
Our success depends on attracting and retaining qualified personnel in a competitive environment.
Our business strategy and future success depends, in part, on our ability to attract, hire and retain highly-skilledmanagerial, professional service, sales, development, marketing, finance, accounting, administrative, informationtechnology, science, research and infrastructure-related personnel in a competitive environment, who are criticalto our business functions. The market for highly-skilled employees is competitive in the labor markets in whichwe operate. Our business could be materially adversely affected if we are unable to retain key employees orrecruit qualified personnel in a timely fashion, or if we are required to incur unexpected increases incompensation costs to retain key employees or meet our hiring goals. If we are not able to retain and attract thepersonnel that we require, or we are not able to do so on a cost-effective basis, it could be more difficult for us tosell and develop our products and services and execute our business strategy.
We derive a significant percentage of our sales from one customer. The loss of this customer could materiallyadversely affect our financial performance.
Our products are sold principally to the wholesale and retail trade, both nationally and internationally, and salesfrom one customer, Wal-Mart, accounted for approximately 12% of our gross sales for the year endedDecember 31, 2009. If this customer ceases doing business with us or if we encounter any difficulties in ourrelationship with Wal-Mart, our business could be materially adversely affected.
An adverse change in favorable demographic and economic trends as well as a change in scientific opinionregarding our products in any of our largest markets could materially adversely affect our business andreduce our profitability.
Our growth plan relies on favorable demographic and economic trends in various markets, including: (1) risingincomes in emerging markets, (2) increasing number of working mothers and (3) increasing consumer spendingon health care and wellness worldwide. If these demographic trends change in an adverse way, our businesscould be materially adversely affected. In addition, an adverse change in scientific opinion regarding ourproducts, such as the health benefits of DHA and ARA, could materially adversely affect our business.
We have substantial debt, which could materially adversely affect our business and our ability to meet ourobligations.
We had total indebtedness of $1,604.9 million as of December 31, 2009. See “Item 8. Financial Statements—Note 13. Short-Term Borrowings and Long-Term Debt” and “Item. 7. Management’s Discussion and Analysis of
24
Financial Condition and Results of Operations—Financial Position, Liquidity and Capital Resources—Short-Term Borrowings and Long-Term Debt.”
This amount of debt could have important consequences to us and our investors, including:
• requiring a substantial portion of our cash flow from operations to make payments on this debt;
• requiring us to repay the full amount of our debt upon a change of control triggering event;
• making it more difficult to satisfy other obligations;
• increasing the risk of future credit rating downgrades of our debt, which could increase future debtcosts;
• increasing our vulnerability to general adverse economic and industry conditions;
• reducing the cash flow available to fund capital expenditures and other corporate purposes and to growour business;
• limiting our flexibility in planning for, or reacting to, changes in our business and industry;
• placing us at a competitive disadvantage to our competitors that may not be as leveraged as we are;
• limiting our ability to borrow additional funds as needed or take advantage of business opportunities asthey arise; and
• limiting our ability to pay cash dividends or repurchase common stock.
To the extent we become more leveraged, the risks described above could increase. In addition, our actual cashrequirements in the future may be greater than expected. Our cash flow from operations may not be sufficient torepay at maturity all of the outstanding debt as it becomes due, and we may not be able to borrow money, sellassets or otherwise raise funds on acceptable terms, or at all, to refinance our debt.
In order to achieve a desired proportion of variable versus fixed rate debt, we have entered into interest rate swapagreements. Developing an effective strategy for dealing with risks from movements in interest rates is complex,and no strategy can completely insulate us from risks associated with such fluctuations. In addition, we areexposed to counterparty credit risk for nonperformance and, in the event of nonperformance, to market risk forchanges in interest rates. Finally, our interest rate risk management activities could expose us to substantial lossesif interest rates move materially differently from our expectations. As a result, our economic hedging activitiesmay not effectively manage our interest rate sensitivity or have the desired beneficial impact on our financialcondition or results of operations. Further discussion of our hedging of interest rate risk is included in “Item 7A.Quantitative and Qualitative Disclosures About Market Risk.”
We could evaluate acquisitions, joint ventures and other strategic initiatives, any of which could distract ourmanagement or otherwise have a negative effect on our sales, costs and stock price.
Our future success may depend on opportunities to buy or obtain rights to other businesses or technologies thatcould complement, enhance or expand our current business or products or that might otherwise offer us growthopportunities. We could evaluate potential mergers, acquisitions, joint venture investments, strategic initiatives,alliances, vertical integration opportunities and divestitures. If we attempt to engage in these transactions, weexpose ourselves to various inherent risks, including:
• accurately assessing the value, future growth potential, strengths, weaknesses, contingent and otherliabilities and potential profitability of acquisition candidates;
• the potential loss of key personnel of an acquired or combined business;
• our ability to achieve projected economic and operating synergies;
25
• difficulties successfully integrating, operating, maintaining and managing newly-acquired operations oremployees;
• difficulties maintaining uniform standards, controls, procedures and policies;
• unanticipated changes in business and economic conditions affecting an acquired business;
• the possibility we could incur impairment charges if an acquired business performs below expectations;and
• the diversion of our management’s attention from our existing business to integrate the operations andpersonnel of the acquired or combined business or implement the strategic initiative.
If any of the foregoing risks materializes, our results of operations and the results of the proposed transactionswould likely differ from ours, and market expectations, and our stock price could, accordingly, decline. Inaddition, we may not be able to complete desirable transactions, for reasons including a failure to securefinancing.
We depend on cash flows generated by our subsidiaries, and a failure to receive distributions from oursubsidiaries may result in our inability to meet our financial obligations, or to pay dividends.
We are a holding company with no material assets other than the equity interests of our subsidiaries and certainintellectual property. Our subsidiaries conduct substantially all of our operations and own substantially all of ourassets and intellectual property. Consequently, our cash flow and our ability to meet our obligations and paydividends to our stockholders depends upon the cash flow of our subsidiaries and the payment of funds by oursubsidiaries to us in the form of dividends, tax sharing payments or otherwise. There are a number of otherfactors that could affect our ability to pay dividends, including the following:
• lack of availability of cash to pay dividends due to changes in our operating cash flow, capitalexpenditure requirements, working capital requirements and other cash needs;
• unexpected or increased operating or other expenses or changes in the timing thereof;
• restrictions under Delaware law or other applicable law on the amount of dividends that we may pay;
• a decision by our board of directors to modify or revoke its policy to pay dividends; and
• the other risks described in this “Risk Factors” section.
Each of our subsidiaries is a distinct legal entity and its ability to make any payments will depend on its earnings,the terms of its indebtedness and legal restrictions. While no restrictions currently exist, under certaincircumstances, legal restrictions may limit our ability to obtain cash from our subsidiaries and our subsidiariesmay not be able to, or be permitted to, make distributions to us in the future. In the event that we do not receivedistributions from our subsidiaries, we may be unable to meet our financial obligations.
Risks Related to Our Relationship with Our Former Parent, BMS
The transitional services that BMS provides to us may not be sufficient to meet our needs, and we may havedifficulty finding replacement services or be required to pay increased costs to replace these services after ourtransitional services agreement with BMS expires.
Historically, BMS has provided us with significant corporate and shared services related to corporate functionssuch as executive oversight, risk management, information technology, accounting, audit, legal, investorrelations, human resources, tax, treasury, procurement, pensions and post retirement, stock based compensationand other services. For a limited time, BMS will continue to provide information technology and certain otherservices on a transitional basis for a fee. The terms of these services and amounts to be paid by us to BMS areprovided in the transitional services agreement described in “Item 8. Financial Statements—Note 4. Activities
26
With Former Parent, BMS” and “Item 13. Certain Relationships and Related Transactions, and DirectorIndependence.” While these services are being provided to us by BMS, our operational flexibility to modify orimplement changes with respect to such services or the amounts we pay for them are limited. After the expirationof the transitional services agreement, we may not be able to replace these services or enter into appropriatethird-party agreements on terms and conditions, including cost, comparable to those that we receive from BMSunder the transitional services agreement. Although we intend to replace portions of the services currentlyprovided by BMS, we may encounter difficulties replacing certain services or be unable to negotiate pricing orother terms as favorable as those we currently have in effect. In addition, we have historically received informalsupport from BMS, which may not be addressed in the transitional services agreement that we have entered intowith BMS. This informal support ceased following our split-off from BMS.
As a completely independent public company, we no longer have access to the resources of BMS, and we mayexperience increased costs resulting from decreased purchasing power.
We have benefited from BMS’s financial strength and numerous significant business relationships and have beenable to take advantage of BMS’s size and purchasing power in procuring goods, services and technology. We havedrawn on these resources in developing our own contacts and relationships. Following our split-off from BMS, weno longer are able to rely on BMS’s resources and contacts. As a completely independent public company, we maybe unable to obtain goods, services and technology at prices and on terms as favorable as those that we obtainedprior to our split-off from BMS and, as a result, our profitability could be materially adversely affected.
Restrictions in connection with the tax treatment of our split-off from BMS could adversely affect us.
In connection with our split-off from BMS, BMS and its counsel have relied on certain assumptions andrepresentations as to factual matters from us, as well as certain covenants by us regarding the future conduct ofour business and other matters, the incorrectness or violation of which could affect the qualification fornon-recognition of gain and loss of our split-off from BMS. In addition, current tax law generally creates apresumption that the split-off would be taxable to BMS, but not to its stockholders, if we or our stockholderswere to engage in transactions that result in a 50% or greater change in our stock ownership during the four-yearperiod beginning two years before the split-off, unless it is established that the split-off was not part of a plan orseries of related transactions to effect such a change in ownership.
As a consequence of the foregoing, BMS and we agreed to certain tax-related restrictions set forth in theAmended and Restated Tax Matters Agreement referred to herein, under which we agreed generally:
• for two years following the completion of the split-off, not to engage in any of the following actionsunless we provide BMS with an opinion of counsel acceptable to BMS or BMS receives a private letterruling, in each case to the effect that such actions will not cause our split-off from BMS to fail toqualify for non-recognition of gain and loss;
• cause or allow us to cease to be engaged in our current business as an active business;
• take any action that could cause the conversion of Mead Johnson & Company (from a Delawarecorporation to a Delaware limited liability company) to fail to qualify as a complete liquidation underSection 332 of the Internal Revenue Code by reason of the “liquidation-reincorporation” doctrine;
• liquidate or partially liquidate, by way of a merger, conversion or otherwise;
• sell or transfer 50% or more of our assets;
• engage in certain stock redemptions or repurchases;
• enter into or permit certain transactions or series of related transactions (or agreements orunderstandings to enter into such transactions) as a result of which one or more persons would directlyor indirectly acquire 40% or more of our total value or total voting power; and
27
• for 30 months following the qualification for non-recognition of gain and loss of our split-off fromBMS, if we propose to enter into or permit certain transactions or series of related transactions as aresult of which one or more persons would directly or indirectly acquire 10% or more of our total valueor total voting power, to undertake in good faith to provide written notice to BMS, including anexplanation as to why such transactions do not cause our split-off from BMS to fail to qualify fornon-recognition of gain and loss.
If our split-off from BMS fails to qualify for non-recognition of gain and loss, we may in certaincircumstances be required to indemnify BMS for any resulting taxes and related expenses, and we believe thatthe payment if required could have a material adverse effect on our financial condition and results ofoperations.
BMS and we agreed to certain tax-related indemnities set forth in the Amended and Restated Tax MattersAgreement referred to herein. We agreed, generally, to indemnify BMS for taxes and certain related expensesresulting from the failure of our split-off from BMS to qualify for non-recognition of gain and loss to the extentattributable to (i) the failure of any of our representations to be true or the breach by us of any of our covenants,(ii) the application of Section 355(e) or Section 355(f) of the Internal Revenue Code to any acquisition of ourstock or assets or any of our affiliates or (iii) certain other acts or omissions by us or our affiliates. To the extentwe become obligated to make an indemnification payment under the Amended and Restated Tax MattersAgreement, we believe that the payment could have a material adverse effect on our financial condition andresults of operations.
Risks Related to Our Common Stock
Future issuances of our common stock may depress the price of our common stock.
The market price of our common stock could decline significantly as a result of issuances of a large number ofshares of our common stock in the market. The perception that these issuances might occur could depress themarket price. The amount of shares of our common stock issued in connection with an investment or acquisitioncould constitute a material portion of our common stock, resulting in dilution to our stockholders. Theseissuances, or the possibility that these issuances may occur, also might make it more difficult for us to sell equitysecurities in the future at a time and at a price that we deem appropriate, for example, we may issue commonstock in connection with investments or acquisitions.
Our failure to successfully execute our growth strategy could adversely affect our business and results ofoperations and cause our stock price to decline.
Our continued success in part depends on our ability to successfully execute our growth strategy. We intend togrow our business profitably through several strategic initiatives, including geographic and category expansionand productivity savings. There can be no assurance that we will be successful in achieving our strategic plan. Ifwe fail to fully implement any material part of our strategic initiatives, or if we achieve these initiatives and theyfail to yield the expected benefits, there could be an adverse affect on our business and results of operations. Anysuch adverse affect on our business and results of operations could result in a decline in the price of our commonstock.
Anti-takeover provisions in our charter documents could discourage, delay or prevent a change of control ofour company and may result in an entrenchment of management and diminish the value of our commonstock.
Several provisions of our certificate of incorporation and by-laws could make it difficult for our stockholders tochange the composition of our board of directors, preventing them from changing the composition ofmanagement. In addition, the same provisions may discourage, delay or prevent a merger or acquisition that ourstockholders may consider favorable.
28
These provisions include:
• authorizing our board of directors to issue “blank check” preferred shares without stockholderapproval;
• prohibiting cumulative voting in the election of directors;
• prohibiting shareholder action by written consent;
• limiting the persons who may call special meetings of stockholders; and
• establishing advance notice requirements for nominations for election to our board of directors or forproposing matters that can be acted on by stockholders at stockholder meetings.
Additionally, effective January 7, 2010, we became subject to Section 203 of the Delaware General CorporationLaw, which generally prohibits a Delaware corporation from engaging in any of a broad range of businesscombinations with any interested stockholder for a period of three years following the date on which thestockholder became an interested stockholder. Any person or group that became an interested stockholder priorto our becoming subject to Section 203 will not be subject to the restrictions of Section 203.
These anti-takeover provisions could substantially impede the ability of our common stockholders to benefitfrom a change of control and, as a result, could materially adversely affect the market price of our common stockand our stockholders’ ability to realize any potential change-in-control premium.
If securities or industry analysts do not publish research or reports about us or our business, if they adverselychange their recommendations regarding our securities or if our operating results do not meet theirexpectations, our stock price could decline.
The trading market for common stock is influenced by the research and reports that industry or securities analystspublish about us or our business. If one or more of these analysts cease coverage of us or fail to publish reportson us regularly, we could lose visibility in the financial markets, which in turn could cause our stock price ortrading volume to decline. Moreover, if one or more of the analysts who cover us downgrades our stock or if ouroperating results do not meet their expectations, our stock price could decline.
Item 1B. UNRESOLVED STAFF COMMENTS
None.
Item 2. PROPERTIES
Our corporate headquarters are located in Glenview, Illinois, where we lease office space. We maintain ourglobal supply chain and R&D headquarters in Evansville, Indiana, where we own office, operations andlaboratory buildings comprising approximately 700,000 square feet. We also own or operate sevenmanufacturing facilities located in the following cities: Chonburi, Thailand; Delicias, Chihuahua, Mexico;Evansville, Indiana; Guangzhou, China; Makati, Philippines; Nijmegen, Netherlands; and Zeeland, Michigan.For additional information related to our seven manufacturing facilities around the world, see “Item 1.Business—Global Supply Chain.” We lease the vast majority of our other properties worldwide. In addition, inthe fall of 2008, we entered into a manufacturing arrangement that gives us access to 57,400 square foot ofmanufacturing space in Tatura, Australia.
Our in-house powder manufacturing facilities are located in the United States, Mexico, the Netherlands, China,the Philippines and Thailand.
29
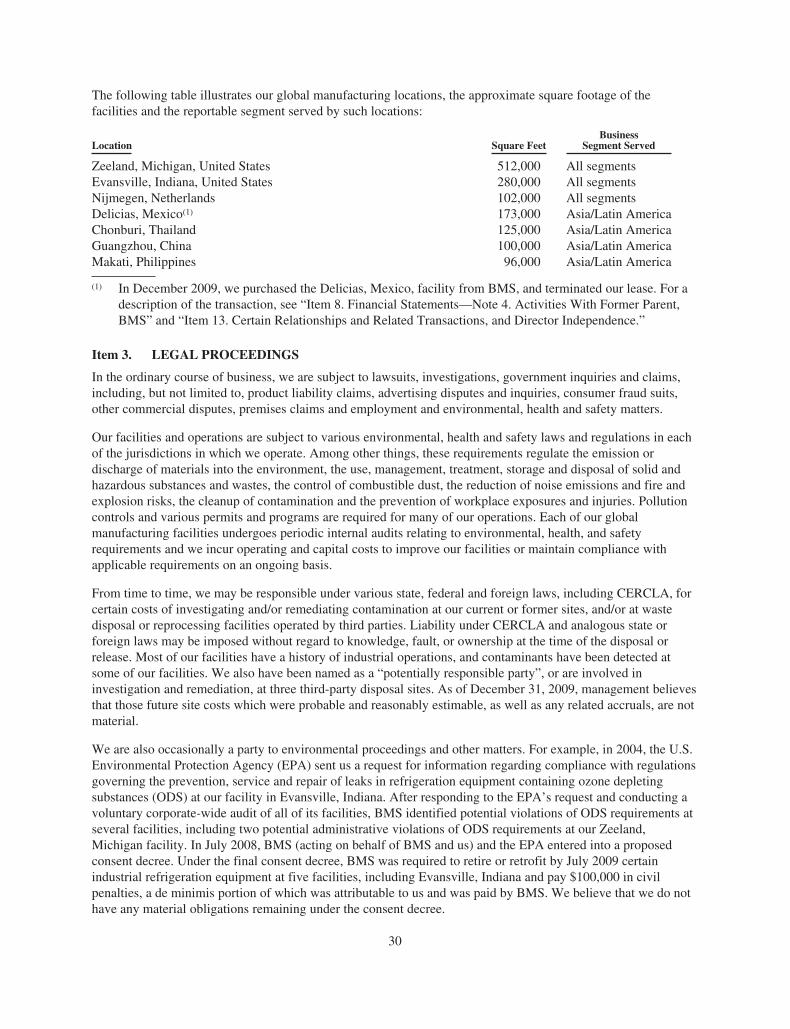
The following table illustrates our global manufacturing locations, the approximate square footage of thefacilities and the reportable segment served by such locations:
Location Square FeetBusiness
Segment Served
Zeeland, Michigan, United States 512,000 All segmentsEvansville, Indiana, United States 280,000 All segmentsNijmegen, Netherlands 102,000 All segmentsDelicias, Mexico(1) 173,000 Asia/Latin AmericaChonburi, Thailand 125,000 Asia/Latin AmericaGuangzhou, China 100,000 Asia/Latin AmericaMakati, Philippines 96,000 Asia/Latin America
(1) In December 2009, we purchased the Delicias, Mexico, facility from BMS, and terminated our lease. For adescription of the transaction, see “Item 8. Financial Statements—Note 4. Activities With Former Parent,BMS” and “Item 13. Certain Relationships and Related Transactions, and Director Independence.”
Item 3. LEGAL PROCEEDINGS
In the ordinary course of business, we are subject to lawsuits, investigations, government inquiries and claims,including, but not limited to, product liability claims, advertising disputes and inquiries, consumer fraud suits,other commercial disputes, premises claims and employment and environmental, health and safety matters.
Our facilities and operations are subject to various environmental, health and safety laws and regulations in eachof the jurisdictions in which we operate. Among other things, these requirements regulate the emission ordischarge of materials into the environment, the use, management, treatment, storage and disposal of solid andhazardous substances and wastes, the control of combustible dust, the reduction of noise emissions and fire andexplosion risks, the cleanup of contamination and the prevention of workplace exposures and injuries. Pollutioncontrols and various permits and programs are required for many of our operations. Each of our globalmanufacturing facilities undergoes periodic internal audits relating to environmental, health, and safetyrequirements and we incur operating and capital costs to improve our facilities or maintain compliance withapplicable requirements on an ongoing basis.
From time to time, we may be responsible under various state, federal and foreign laws, including CERCLA, forcertain costs of investigating and/or remediating contamination at our current or former sites, and/or at wastedisposal or reprocessing facilities operated by third parties. Liability under CERCLA and analogous state orforeign laws may be imposed without regard to knowledge, fault, or ownership at the time of the disposal orrelease. Most of our facilities have a history of industrial operations, and contaminants have been detected atsome of our facilities. We also have been named as a “potentially responsible party”, or are involved ininvestigation and remediation, at three third-party disposal sites. As of December 31, 2009, management believesthat those future site costs which were probable and reasonably estimable, as well as any related accruals, are notmaterial.
We are also occasionally a party to environmental proceedings and other matters. For example, in 2004, the U.S.Environmental Protection Agency (EPA) sent us a request for information regarding compliance with regulationsgoverning the prevention, service and repair of leaks in refrigeration equipment containing ozone depletingsubstances (ODS) at our facility in Evansville, Indiana. After responding to the EPA’s request and conducting avoluntary corporate-wide audit of all of its facilities, BMS identified potential violations of ODS requirements atseveral facilities, including two potential administrative violations of ODS requirements at our Zeeland,Michigan facility. In July 2008, BMS (acting on behalf of BMS and us) and the EPA entered into a proposedconsent decree. Under the final consent decree, BMS was required to retire or retrofit by July 2009 certainindustrial refrigeration equipment at five facilities, including Evansville, Indiana and pay $100,000 in civilpenalties, a de minimis portion of which was attributable to us and was paid by BMS. We believe that we do nothave any material obligations remaining under the consent decree.
30
We are not aware of any pending environmental, health or safety-related litigation or significant environmental,health or safety-related financial obligations or liabilities arising from current or former operations or propertiesthat are likely to have a material adverse impact on our business, financial position or results of operations.Liabilities or obligations, which could require us to make significant expenditures, could arise in the future,however, as the result of, among other things, changes in, or new interpretations of, existing laws, regulations orenforcement policies, claims relating to on- or off-site contamination, or the imposition of unanticipatedinvestigation or cleanup obligations.
Significant litigation matters of which we are a party are as follows:
On April 27, 2009, PBM Products, LLC (PBM), a manufacturer and distributor of store brand infant formulasand nutritionals, filed a complaint against Mead Johnson & Company, our subsidiary, in U.S. District Court(Eastern District of Virginia), alleging, among other things, false and misleading advertising with respect tocertain Enfamil LIPIL infant formula advertising. On November 10, 2009, a jury rendered a verdict in favor ofPBM in the amount of $13.5 million. On December 2, 2009, the Court entered a judgment against us in theamount of the jury verdict and ordered limited injunctive relief with respect to the advertisement at issue. TheCourt’s judgment is currently stayed pending several motions filed by the parties which could impact both theamount of the award and the scope of injunctive relief. We will evaluate our options for appeal upon finalizationof the Court’s judgment.
Four purported consumer class action suits seeking to take advantage of the PBM matter described above havealso been filed and served on us. Each of these cases cites the PBM complaint as support for allegations thatcertain false and misleading advertising of Enfamil LIPIL infant formula has resulted in financial injury toconsumers. We deny all allegations and will defend these cases.
We record accruals for such contingencies when it is probable that a liability will be incurred and the loss can bereasonably estimated. Although we cannot predict with certainty the ultimate resolution of these or otherlawsuits, investigations and claims asserted against it, we do not believe any currently pending legal proceedingto which we are a party will have a material adverse effect on our business or financial condition, although anunfavorable outcome in excess of amounts recognized as of December 31, 2009, with respect to one or more ofthese proceedings could have a material adverse effect on our results of operations for the periods in which a lossis recognized.
Item 4. SUBMISSION OF MATTERS TO A VOTE OF SECURITY HOLDERS
In connection with our split-off from BMS, we amended our certificate of incorporation pursuant to an action bywritten consent of BMS, as our then majority shareholder, which consent was given on December 17, 2009.Effective January 7, 2010, our certificate of incorporation was amended and restated.
31
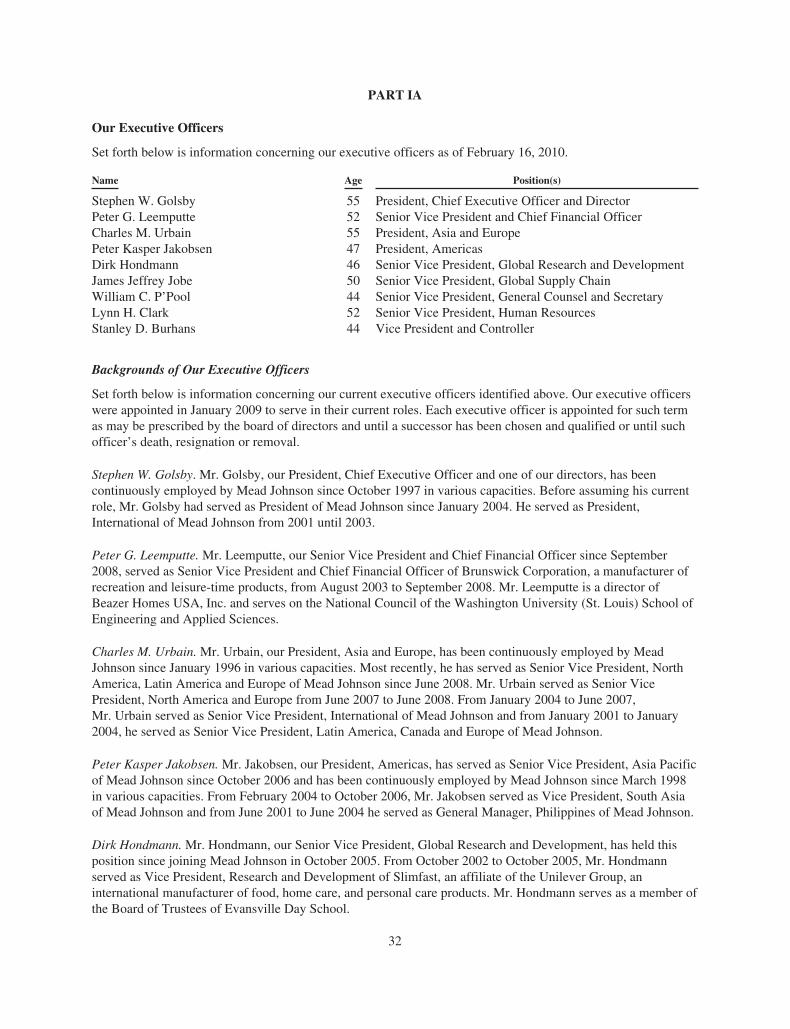
PART IA
Our Executive Officers
Set forth below is information concerning our executive officers as of February 16, 2010.
Name Age Position(s)
Stephen W. Golsby 55 President, Chief Executive Officer and DirectorPeter G. Leemputte 52 Senior Vice President and Chief Financial OfficerCharles M. Urbain 55 President, Asia and EuropePeter Kasper Jakobsen 47 President, AmericasDirk Hondmann 46 Senior Vice President, Global Research and DevelopmentJames Jeffrey Jobe 50 Senior Vice President, Global Supply ChainWilliam C. P’Pool 44 Senior Vice President, General Counsel and SecretaryLynn H. Clark 52 Senior Vice President, Human ResourcesStanley D. Burhans 44 Vice President and Controller
Backgrounds of Our Executive Officers
Set forth below is information concerning our current executive officers identified above. Our executive officerswere appointed in January 2009 to serve in their current roles. Each executive officer is appointed for such termas may be prescribed by the board of directors and until a successor has been chosen and qualified or until suchofficer’s death, resignation or removal.
Stephen W. Golsby. Mr. Golsby, our President, Chief Executive Officer and one of our directors, has beencontinuously employed by Mead Johnson since October 1997 in various capacities. Before assuming his currentrole, Mr. Golsby had served as President of Mead Johnson since January 2004. He served as President,International of Mead Johnson from 2001 until 2003.
Peter G. Leemputte. Mr. Leemputte, our Senior Vice President and Chief Financial Officer since September2008, served as Senior Vice President and Chief Financial Officer of Brunswick Corporation, a manufacturer ofrecreation and leisure-time products, from August 2003 to September 2008. Mr. Leemputte is a director ofBeazer Homes USA, Inc. and serves on the National Council of the Washington University (St. Louis) School ofEngineering and Applied Sciences.
Charles M. Urbain. Mr. Urbain, our President, Asia and Europe, has been continuously employed by MeadJohnson since January 1996 in various capacities. Most recently, he has served as Senior Vice President, NorthAmerica, Latin America and Europe of Mead Johnson since June 2008. Mr. Urbain served as Senior VicePresident, North America and Europe from June 2007 to June 2008. From January 2004 to June 2007,Mr. Urbain served as Senior Vice President, International of Mead Johnson and from January 2001 to January2004, he served as Senior Vice President, Latin America, Canada and Europe of Mead Johnson.
Peter Kasper Jakobsen. Mr. Jakobsen, our President, Americas, has served as Senior Vice President, Asia Pacificof Mead Johnson since October 2006 and has been continuously employed by Mead Johnson since March 1998in various capacities. From February 2004 to October 2006, Mr. Jakobsen served as Vice President, South Asiaof Mead Johnson and from June 2001 to June 2004 he served as General Manager, Philippines of Mead Johnson.
Dirk Hondmann. Mr. Hondmann, our Senior Vice President, Global Research and Development, has held thisposition since joining Mead Johnson in October 2005. From October 2002 to October 2005, Mr. Hondmannserved as Vice President, Research and Development of Slimfast, an affiliate of the Unilever Group, aninternational manufacturer of food, home care, and personal care products. Mr. Hondmann serves as a member ofthe Board of Trustees of Evansville Day School.
32
James Jeffrey Jobe. Mr. Jobe, our Senior Vice President, Global Supply Chain, a position he has held with MeadJohnson since November 2005, has been continuously employed by Mead Johnson since 1988. From May 2003to November 2005, Mr. Jobe served as Senior Director, North America Supply Chain of Mead Johnson.
William C. P’Pool. Mr. P’Pool, our Senior Vice President, General Counsel and Secretary, has been continuouslyemployed by Mead Johnson or BMS since June 2004 in various capacities. Before assuming his current position,Mr. P’Pool served as Vice President and Senior Counsel for Mead Johnson from May 2005 to December 2008and from June 2004 to May 2005, he served as Counsel for Mead Johnson. From May 2001 to June 2004,Mr. P’Pool served as Senior Counsel and Director, Legal Services at Yum! Brands, Inc., a large operator andfranchiser of restaurant companies.
Lynn H. Clark. Ms. Clark, our Senior Vice President, Human Resources, has been continuously employed byBMS or Mead Johnson since March 2001 in various capacities. Ms. Clark served as Vice President, HumanResources, Health Care Group of BMS from September 2005 to September 2008. From June 2004 to September2005, Ms. Clark served as Vice President, Human Resources, Americas of BMS and from September 2002 toJune 2004, she served as Vice President, Human Resources, ConvaTec, a division of BMS.
Stanley D. Burhans. Mr. Burhans, our Vice President and Controller, has been continuously employed by MeadJohnson or BMS since 1992 in various capacities. Before assuming his current position, Mr. Burhans served asVice President, Finance of Mead Johnson since February 2006. From July 2005 to February 2006, Mr. Burhansserved as Senior Director, International Finance of Mead Johnson and from June 2003 to July 2005, he served asSenior Director, U.S. Finance of Mead Johnson.
Involvement in Certain Legal Proceedings
Mr. Leemputte, our Senior Vice President and Chief Financial Officer, currently serves as a director of BeazerHomes and as the chairman of its audit committee. As previously disclosed, Mr. Leemputte was a nameddefendant in a derivative shareholder lawsuit, which also named Beazer Homes as a nominal defendant andalleged, among other things, that the defendants violated state and federal laws, including violations of theSecurities Exchange Act of 1934. The parties reached an agreement to settle the lawsuit. The settlementagreement was approved by the Court on February 17, 2010, and the derivative action was dismissed withprejudice.
33
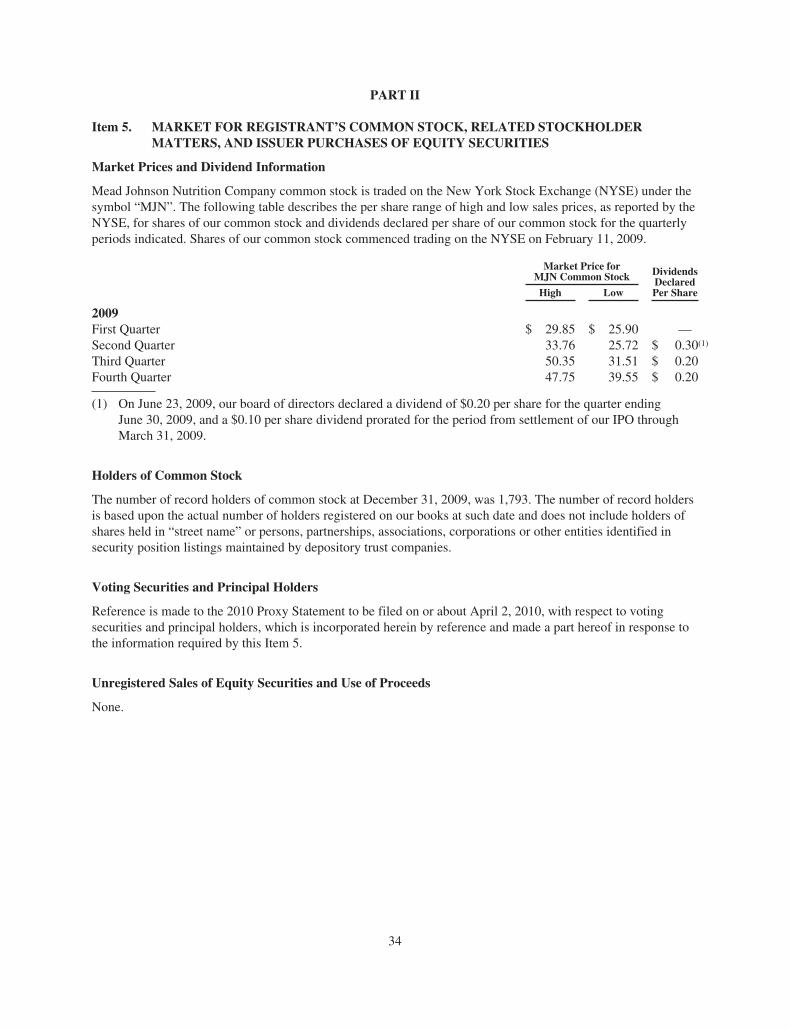
PART II
Item 5. MARKET FOR REGISTRANT’S COMMON STOCK, RELATED STOCKHOLDERMATTERS, AND ISSUER PURCHASES OF EQUITY SECURITIES
Market Prices and Dividend Information
Mead Johnson Nutrition Company common stock is traded on the New York Stock Exchange (NYSE) under thesymbol “MJN”. The following table describes the per share range of high and low sales prices, as reported by theNYSE, for shares of our common stock and dividends declared per share of our common stock for the quarterlyperiods indicated. Shares of our common stock commenced trading on the NYSE on February 11, 2009.
Market Price forMJN Common Stock Dividends
DeclaredPer ShareHigh Low
2009First Quarter $ 29.85 $ 25.90 —Second Quarter 33.76 25.72 $ 0.30(1)
Third Quarter 50.35 31.51 $ 0.20Fourth Quarter 47.75 39.55 $ 0.20
(1) On June 23, 2009, our board of directors declared a dividend of $0.20 per share for the quarter endingJune 30, 2009, and a $0.10 per share dividend prorated for the period from settlement of our IPO throughMarch 31, 2009.
Holders of Common Stock
The number of record holders of common stock at December 31, 2009, was 1,793. The number of record holdersis based upon the actual number of holders registered on our books at such date and does not include holders ofshares held in “street name” or persons, partnerships, associations, corporations or other entities identified insecurity position listings maintained by depository trust companies.
Voting Securities and Principal Holders
Reference is made to the 2010 Proxy Statement to be filed on or about April 2, 2010, with respect to votingsecurities and principal holders, which is incorporated herein by reference and made a part hereof in response tothe information required by this Item 5.
Unregistered Sales of Equity Securities and Use of Proceeds
None.
34
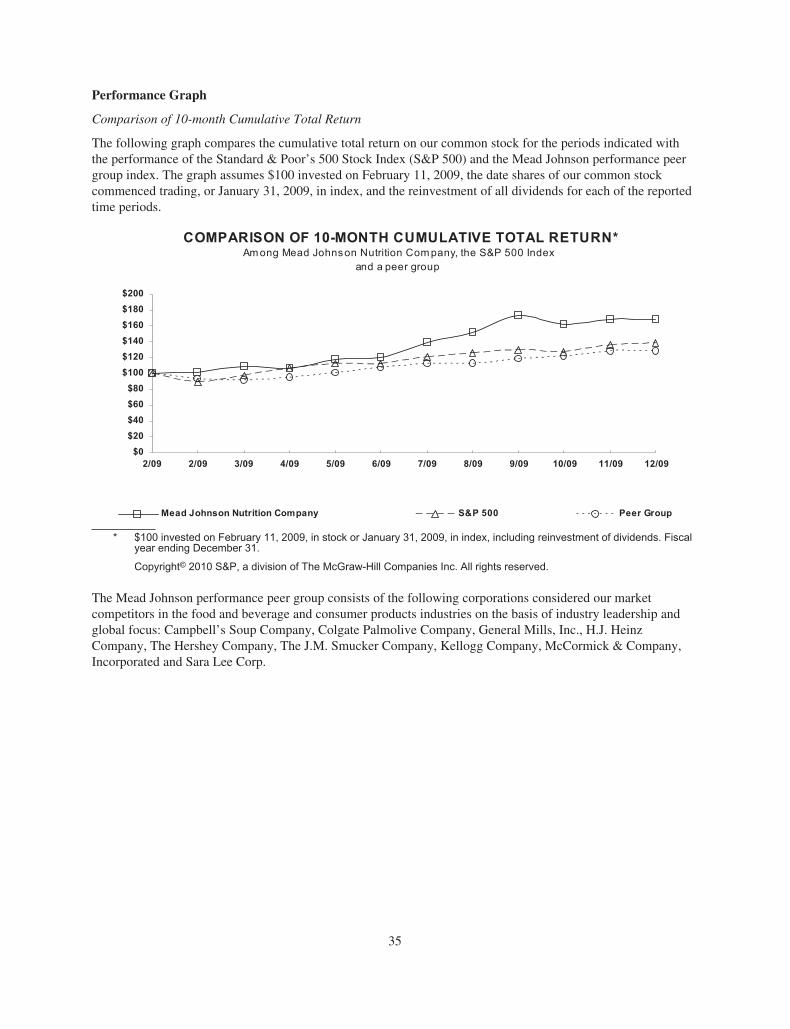
Performance Graph
Comparison of 10-month Cumulative Total Return
The following graph compares the cumulative total return on our common stock for the periods indicated withthe performance of the Standard & Poor’s 500 Stock Index (S&P 500) and the Mead Johnson performance peergroup index. The graph assumes $100 invested on February 11, 2009, the date shares of our common stockcommenced trading, or January 31, 2009, in index, and the reinvestment of all dividends for each of the reportedtime periods.
COMPARISON OF 10-MONTH CUMULATIVE TOTAL RETURN*Am ong Mead Johnson Nutrition Com pany, the S&P 500 Index
and a peer group
$0$20$40$60$80
$100$120$140$160$180$200
2/09 2/09 3/09 4/09 7/09 8/09 9/09 10/09 11/09 12/096/095/09
Mead Johnson Nutrition Company S&P 500 Peer Group
* $100 invested on February 11, 2009, in stock or January 31, 2009, in index, including reinvestment of dividends. Fiscalyear ending December 31.
Copyright© 2010 S&P, a division of The McGraw-Hill Companies Inc. All rights reserved.
The Mead Johnson performance peer group consists of the following corporations considered our marketcompetitors in the food and beverage and consumer products industries on the basis of industry leadership andglobal focus: Campbell’s Soup Company, Colgate Palmolive Company, General Mills, Inc., H.J. HeinzCompany, The Hershey Company, The J.M. Smucker Company, Kellogg Company, McCormick & Company,Incorporated and Sara Lee Corp.
35
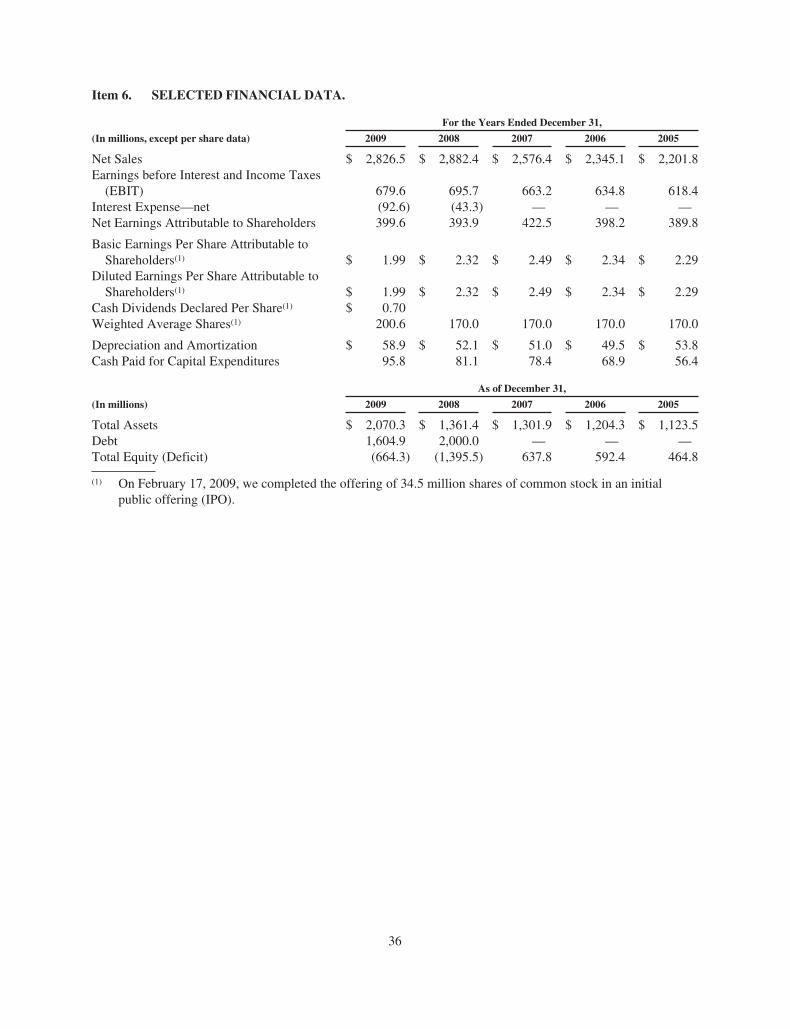
Item 6. SELECTED FINANCIAL DATA.
For the Years Ended December 31,
(In millions, except per share data) 2009 2008 2007 2006 2005
Net Sales $ 2,826.5 $ 2,882.4 $ 2,576.4 $ 2,345.1 $ 2,201.8Earnings before Interest and Income Taxes
(EBIT) 679.6 695.7 663.2 634.8 618.4Interest Expense—net (92.6) (43.3) — — —Net Earnings Attributable to Shareholders 399.6 393.9 422.5 398.2 389.8
Basic Earnings Per Share Attributable toShareholders(1) $ 1.99 $ 2.32 $ 2.49 $ 2.34 $ 2.29
Diluted Earnings Per Share Attributable toShareholders(1) $ 1.99 $ 2.32 $ 2.49 $ 2.34 $ 2.29
Cash Dividends Declared Per Share(1) $ 0.70Weighted Average Shares(1) 200.6 170.0 170.0 170.0 170.0
Depreciation and Amortization $ 58.9 $ 52.1 $ 51.0 $ 49.5 $ 53.8Cash Paid for Capital Expenditures 95.8 81.1 78.4 68.9 56.4
As of December 31,
(In millions) 2009 2008 2007 2006 2005
Total Assets $ 2,070.3 $ 1,361.4 $ 1,301.9 $ 1,204.3 $ 1,123.5Debt 1,604.9 2,000.0 — — —Total Equity (Deficit) (664.3) (1,395.5) 637.8 592.4 464.8
(1) On February 17, 2009, we completed the offering of 34.5 million shares of common stock in an initialpublic offering (IPO).
36
Item 7. MANAGEMENT’S DISCUSSION AND ANALYSIS OF FINANCIAL CONDITION ANDRESULTS OF OPERATIONS.
This management’s discussion and analysis of financial condition and results of operations contains forward-looking statements that involve risks and uncertainties. See “Item 1A. Risk Factors” for a discussion of theuncertainties, risks and assumptions associated with those statements. The following discussion should be read inconjunction with our audited financial statements and the notes to our audited financial statements. Our resultsmay differ materially from those discussed in the forward-looking statements as a result of various factors,including but not limited to those in “Risk Factors”.
Overview of Our Business
We are a global leader in pediatric nutrition. We are committed to creating trusted nutritional brands andproducts that help improve the health and development of infants and children around the world and providethem with the best start in life. Our comprehensive product portfolio addresses a broad range of nutritional needsfor infants, children and expectant and nursing mothers. We have over 100 years of innovation experience duringwhich we have developed or improved many breakthrough or industry-defining products across each of ourproduct categories. We operate in four geographic regions: Asia, Latin America, North America and Europe. Dueto similarities in the economics, products offered, production process, customer base and regulatory environment,these operating regions have been aggregated into two reportable segments: Asia/Latin America and NorthAmerica/Europe.
Executive Summary
In 2009, Mead Johnson Nutrition Company went from being a wholly owned division of Bristol-Myers SquibbCompany (BMS) to a separately traded, independent public company. In February 2009, we issued 34.5 millionshares of our common stock in an initial public offering (IPO) resulting in 204.5 million shares of common stockoutstanding, of which 170.0 million was owned by BMS. On December 23, 2009, BMS disposed of its entireownership interest in us through an exchange offer with its shareholders. All of our common stock is nowpublicly held. In November 2009, we issued $1.5 billion of notes through a private placement and used the netproceeds, along with borrowings under our revolving credit facility and available cash, to repay our debtobligations to BMS totaling $1.7 billion.
Our operating results are driven by a number of factors including, pediatric nutrition industry growth; favorabledemographic trends, especially in emerging markets; economic and other factors affecting the number of babiesborn each year; our ability to hold or gain market share and to sustain the strength of our brand franchise; thesuccess of new product innovations; the effectiveness of our sales and marketing efforts; growth throughgeographic expansion; the success of our on-going productivity efforts; changes in the cost of raw materials andother commodities, principally dairy; our ability to increase prices; and foreign exchange rate movements.
During 2009, we reported strong growth in our Asia and Latin America markets, resulting in share gains in manycountries within that segment. We continued to invest in high-growth markets in Asia and Latin America,particularly in China, by adding to our sales force as we expand into new cities and by supporting those effortsthrough product innovation and increased investments in advertising and promotion. The U.S. market contracted in2009 due to fewer births and our U.S. business also lost market share. We have begun to see our U.S. businessstabilize, benefitting from the success of new products launched in 2009, backed by increased investments inmarketing, advertising and promotion. During 2009, we benefited from lower commodity costs; however, dairyprices started increasing toward the end of the year, which we expect to adversely affect our gross profits in 2010.
During 2009, we also initiated a global infrastructure redesign project. We expect to transition, replace or retirethe information technology systems, administration and outsourced services provided to us by BMS, viatransition services agreements. Once this multi-year project is complete and we have fully separated from BMS’information technology and shared service functions, we believe our cost structure will be more efficient.
37
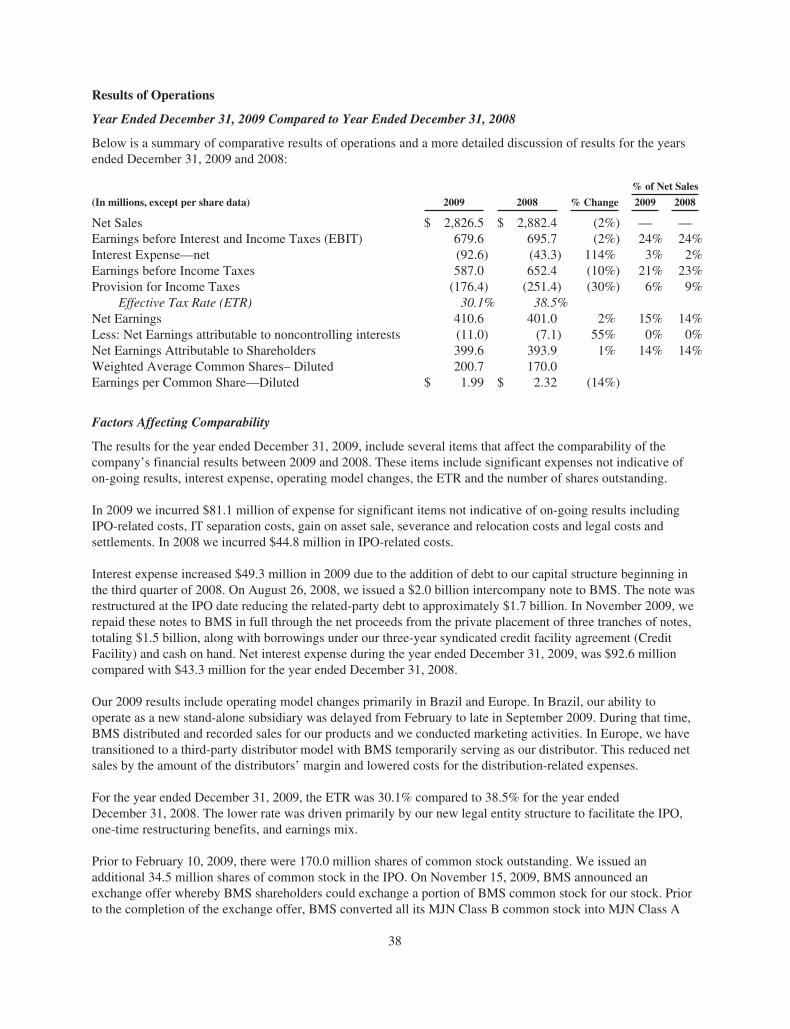
Results of Operations
Year Ended December 31, 2009 Compared to Year Ended December 31, 2008
Below is a summary of comparative results of operations and a more detailed discussion of results for the yearsended December 31, 2009 and 2008:
% of Net Sales
(In millions, except per share data) 2009 2008 % Change 2009 2008
Net Sales $ 2,826.5 $ 2,882.4 (2%) — —Earnings before Interest and Income Taxes (EBIT) 679.6 695.7 (2%) 24% 24%Interest Expense—net (92.6) (43.3) 114% 3% 2%Earnings before Income Taxes 587.0 652.4 (10%) 21% 23%Provision for Income Taxes (176.4) (251.4) (30%) 6% 9%
Effective Tax Rate (ETR) 30.1% 38.5%Net Earnings 410.6 401.0 2% 15% 14%Less: Net Earnings attributable to noncontrolling interests (11.0) (7.1) 55% 0% 0%Net Earnings Attributable to Shareholders 399.6 393.9 1% 14% 14%Weighted Average Common Shares– Diluted 200.7 170.0Earnings per Common Share—Diluted $ 1.99 $ 2.32 (14%)
Factors Affecting Comparability
The results for the year ended December 31, 2009, include several items that affect the comparability of thecompany’s financial results between 2009 and 2008. These items include significant expenses not indicative ofon-going results, interest expense, operating model changes, the ETR and the number of shares outstanding.
In 2009 we incurred $81.1 million of expense for significant items not indicative of on-going results includingIPO-related costs, IT separation costs, gain on asset sale, severance and relocation costs and legal costs andsettlements. In 2008 we incurred $44.8 million in IPO-related costs.
Interest expense increased $49.3 million in 2009 due to the addition of debt to our capital structure beginning inthe third quarter of 2008. On August 26, 2008, we issued a $2.0 billion intercompany note to BMS. The note wasrestructured at the IPO date reducing the related-party debt to approximately $1.7 billion. In November 2009, werepaid these notes to BMS in full through the net proceeds from the private placement of three tranches of notes,totaling $1.5 billion, along with borrowings under our three-year syndicated credit facility agreement (CreditFacility) and cash on hand. Net interest expense during the year ended December 31, 2009, was $92.6 millioncompared with $43.3 million for the year ended December 31, 2008.
Our 2009 results include operating model changes primarily in Brazil and Europe. In Brazil, our ability tooperate as a new stand-alone subsidiary was delayed from February to late in September 2009. During that time,BMS distributed and recorded sales for our products and we conducted marketing activities. In Europe, we havetransitioned to a third-party distributor model with BMS temporarily serving as our distributor. This reduced netsales by the amount of the distributors’ margin and lowered costs for the distribution-related expenses.
For the year ended December 31, 2009, the ETR was 30.1% compared to 38.5% for the year endedDecember 31, 2008. The lower rate was driven primarily by our new legal entity structure to facilitate the IPO,one-time restructuring benefits, and earnings mix.
Prior to February 10, 2009, there were 170.0 million shares of common stock outstanding. We issued anadditional 34.5 million shares of common stock in the IPO. On November 15, 2009, BMS announced anexchange offer whereby BMS shareholders could exchange a portion of BMS common stock for our stock. Priorto the completion of the exchange offer, BMS converted all its MJN Class B common stock into MJN Class A
38
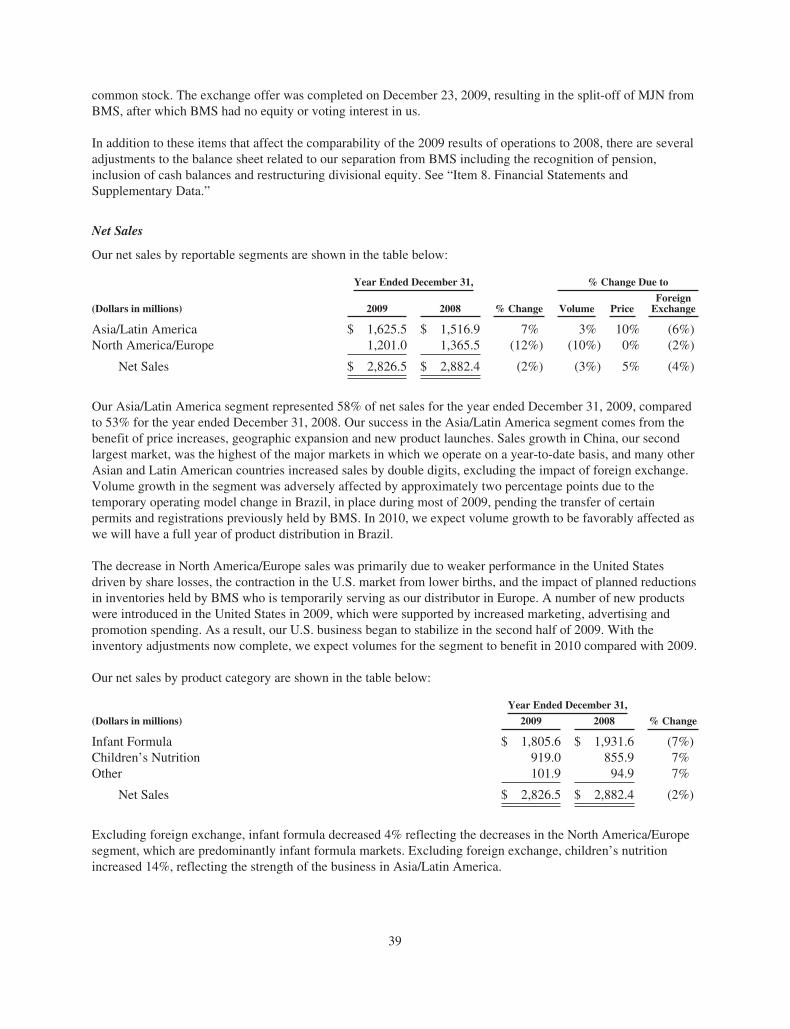
common stock. The exchange offer was completed on December 23, 2009, resulting in the split-off of MJN fromBMS, after which BMS had no equity or voting interest in us.
In addition to these items that affect the comparability of the 2009 results of operations to 2008, there are severaladjustments to the balance sheet related to our separation from BMS including the recognition of pension,inclusion of cash balances and restructuring divisional equity. See “Item 8. Financial Statements andSupplementary Data.”
Net Sales
Our net sales by reportable segments are shown in the table below:
Year Ended December 31,
% Change
% Change Due to
(Dollars in millions) 2009 2008 Volume PriceForeign
Exchange
Asia/Latin America $ 1,625.5 $ 1,516.9 7% 3% 10% (6%)North America/Europe 1,201.0 1,365.5 (12%) (10%) 0% (2%)
Net Sales $ 2,826.5 $ 2,882.4 (2%) (3%) 5% (4%)
Our Asia/Latin America segment represented 58% of net sales for the year ended December 31, 2009, comparedto 53% for the year ended December 31, 2008. Our success in the Asia/Latin America segment comes from thebenefit of price increases, geographic expansion and new product launches. Sales growth in China, our secondlargest market, was the highest of the major markets in which we operate on a year-to-date basis, and many otherAsian and Latin American countries increased sales by double digits, excluding the impact of foreign exchange.Volume growth in the segment was adversely affected by approximately two percentage points due to thetemporary operating model change in Brazil, in place during most of 2009, pending the transfer of certainpermits and registrations previously held by BMS. In 2010, we expect volume growth to be favorably affected aswe will have a full year of product distribution in Brazil.
The decrease in North America/Europe sales was primarily due to weaker performance in the United Statesdriven by share losses, the contraction in the U.S. market from lower births, and the impact of planned reductionsin inventories held by BMS who is temporarily serving as our distributor in Europe. A number of new productswere introduced in the United States in 2009, which were supported by increased marketing, advertising andpromotion spending. As a result, our U.S. business began to stabilize in the second half of 2009. With theinventory adjustments now complete, we expect volumes for the segment to benefit in 2010 compared with 2009.
Our net sales by product category are shown in the table below:
Year Ended December 31,
% Change(Dollars in millions) 2009 2008
Infant Formula $ 1,805.6 $ 1,931.6 (7%)Children’s Nutrition 919.0 855.9 7%Other 101.9 94.9 7%
Net Sales $ 2,826.5 $ 2,882.4 (2%)
Excluding foreign exchange, infant formula decreased 4% reflecting the decreases in the North America/Europesegment, which are predominantly infant formula markets. Excluding foreign exchange, children’s nutritionincreased 14%, reflecting the strength of the business in Asia/Latin America.
39
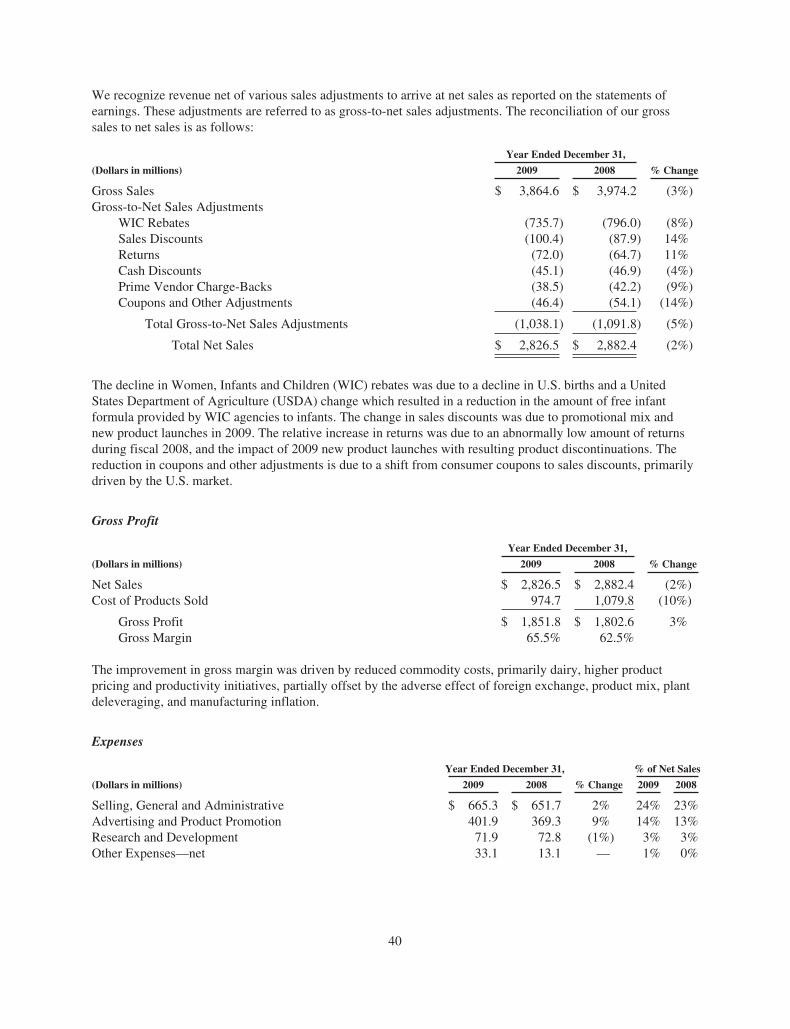
We recognize revenue net of various sales adjustments to arrive at net sales as reported on the statements ofearnings. These adjustments are referred to as gross-to-net sales adjustments. The reconciliation of our grosssales to net sales is as follows:
Year Ended December 31,
% Change(Dollars in millions) 2009 2008
Gross Sales $ 3,864.6 $ 3,974.2 (3%)Gross-to-Net Sales Adjustments
WIC Rebates (735.7) (796.0) (8%)Sales Discounts (100.4) (87.9) 14%Returns (72.0) (64.7) 11%Cash Discounts (45.1) (46.9) (4%)Prime Vendor Charge-Backs (38.5) (42.2) (9%)Coupons and Other Adjustments (46.4) (54.1) (14%)
Total Gross-to-Net Sales Adjustments (1,038.1) (1,091.8) (5%)
Total Net Sales $ 2,826.5 $ 2,882.4 (2%)
The decline in Women, Infants and Children (WIC) rebates was due to a decline in U.S. births and a UnitedStates Department of Agriculture (USDA) change which resulted in a reduction in the amount of free infantformula provided by WIC agencies to infants. The change in sales discounts was due to promotional mix andnew product launches in 2009. The relative increase in returns was due to an abnormally low amount of returnsduring fiscal 2008, and the impact of 2009 new product launches with resulting product discontinuations. Thereduction in coupons and other adjustments is due to a shift from consumer coupons to sales discounts, primarilydriven by the U.S. market.
Gross Profit
Year Ended December 31,
% Change(Dollars in millions) 2009 2008
Net Sales $ 2,826.5 $ 2,882.4 (2%)Cost of Products Sold 974.7 1,079.8 (10%)
Gross Profit $ 1,851.8 $ 1,802.6 3%Gross Margin 65.5% 62.5%
The improvement in gross margin was driven by reduced commodity costs, primarily dairy, higher productpricing and productivity initiatives, partially offset by the adverse effect of foreign exchange, product mix, plantdeleveraging, and manufacturing inflation.
Expenses
Year Ended December 31,
% Change
% of Net Sales
(Dollars in millions) 2009 2008 2009 2008
Selling, General and Administrative $ 665.3 $ 651.7 2% 24% 23%Advertising and Product Promotion 401.9 369.3 9% 14% 13%Research and Development 71.9 72.8 (1%) 3% 3%Other Expenses—net 33.1 13.1 — 1% 0%
40
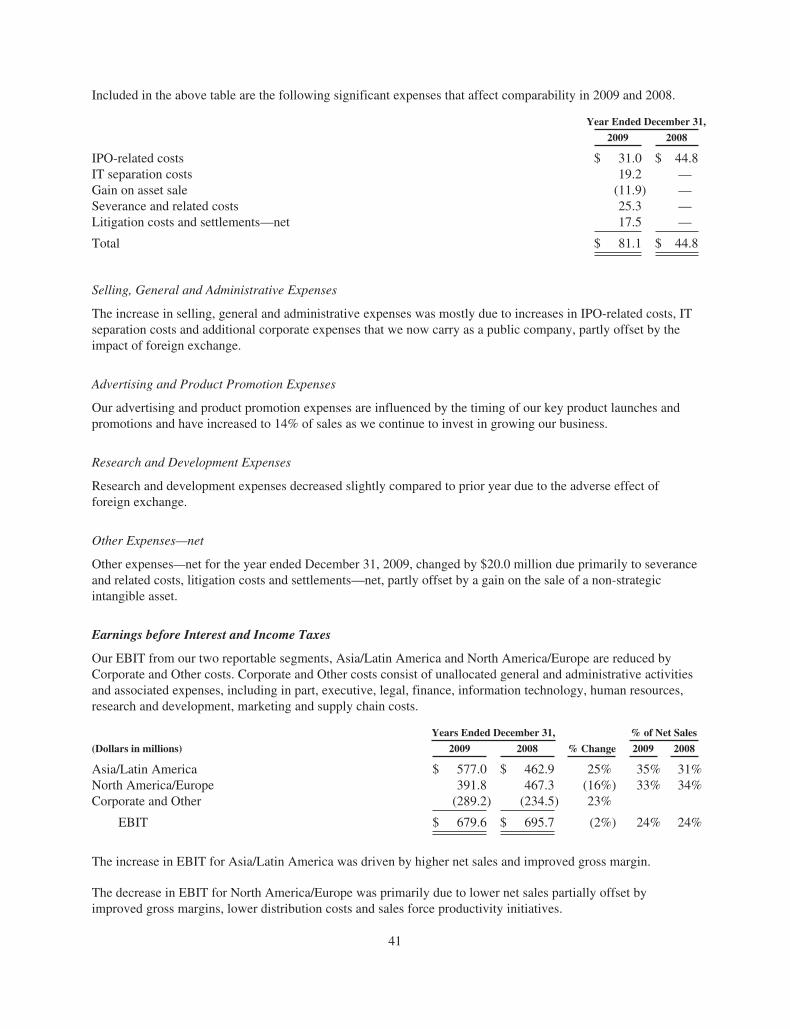
Included in the above table are the following significant expenses that affect comparability in 2009 and 2008.
Year Ended December 31,
2009 2008
IPO-related costs $ 31.0 $ 44.8IT separation costs 19.2 —Gain on asset sale (11.9) —Severance and related costs 25.3 —Litigation costs and settlements—net 17.5 —
Total $ 81.1 $ 44.8
Selling, General and Administrative Expenses
The increase in selling, general and administrative expenses was mostly due to increases in IPO-related costs, ITseparation costs and additional corporate expenses that we now carry as a public company, partly offset by theimpact of foreign exchange.
Advertising and Product Promotion Expenses
Our advertising and product promotion expenses are influenced by the timing of our key product launches andpromotions and have increased to 14% of sales as we continue to invest in growing our business.
Research and Development Expenses
Research and development expenses decreased slightly compared to prior year due to the adverse effect offoreign exchange.
Other Expenses—net
Other expenses—net for the year ended December 31, 2009, changed by $20.0 million due primarily to severanceand related costs, litigation costs and settlements—net, partly offset by a gain on the sale of a non-strategicintangible asset.
Earnings before Interest and Income Taxes
Our EBIT from our two reportable segments, Asia/Latin America and North America/Europe are reduced byCorporate and Other costs. Corporate and Other costs consist of unallocated general and administrative activitiesand associated expenses, including in part, executive, legal, finance, information technology, human resources,research and development, marketing and supply chain costs.
Years Ended December 31,
% Change
% of Net Sales
(Dollars in millions) 2009 2008 2009 2008
Asia/Latin America $ 577.0 $ 462.9 25% 35% 31%North America/Europe 391.8 467.3 (16%) 33% 34%Corporate and Other (289.2) (234.5) 23%
EBIT $ 679.6 $ 695.7 (2%) 24% 24%
The increase in EBIT for Asia/Latin America was driven by higher net sales and improved gross margin.
The decrease in EBIT for North America/Europe was primarily due to lower net sales partially offset byimproved gross margins, lower distribution costs and sales force productivity initiatives.
41
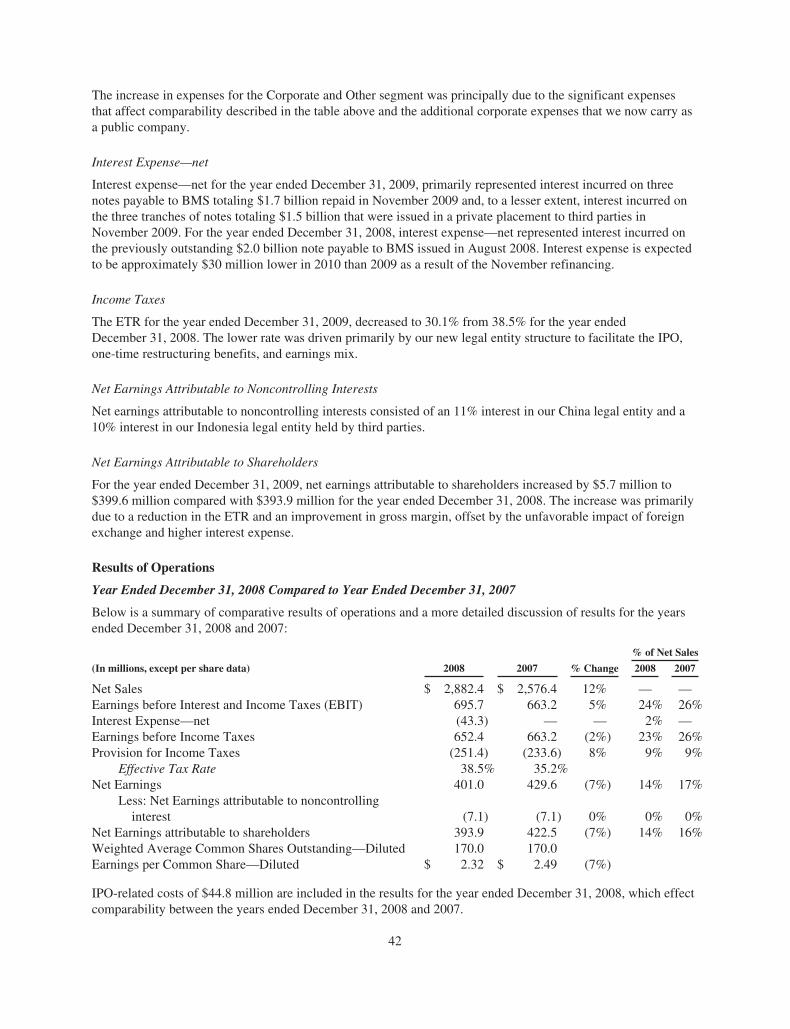
The increase in expenses for the Corporate and Other segment was principally due to the significant expensesthat affect comparability described in the table above and the additional corporate expenses that we now carry asa public company.
Interest Expense—net
Interest expense—net for the year ended December 31, 2009, primarily represented interest incurred on threenotes payable to BMS totaling $1.7 billion repaid in November 2009 and, to a lesser extent, interest incurred onthe three tranches of notes totaling $1.5 billion that were issued in a private placement to third parties inNovember 2009. For the year ended December 31, 2008, interest expense—net represented interest incurred onthe previously outstanding $2.0 billion note payable to BMS issued in August 2008. Interest expense is expectedto be approximately $30 million lower in 2010 than 2009 as a result of the November refinancing.
Income Taxes
The ETR for the year ended December 31, 2009, decreased to 30.1% from 38.5% for the year endedDecember 31, 2008. The lower rate was driven primarily by our new legal entity structure to facilitate the IPO,one-time restructuring benefits, and earnings mix.
Net Earnings Attributable to Noncontrolling Interests
Net earnings attributable to noncontrolling interests consisted of an 11% interest in our China legal entity and a10% interest in our Indonesia legal entity held by third parties.
Net Earnings Attributable to Shareholders
For the year ended December 31, 2009, net earnings attributable to shareholders increased by $5.7 million to$399.6 million compared with $393.9 million for the year ended December 31, 2008. The increase was primarilydue to a reduction in the ETR and an improvement in gross margin, offset by the unfavorable impact of foreignexchange and higher interest expense.
Results of Operations
Year Ended December 31, 2008 Compared to Year Ended December 31, 2007
Below is a summary of comparative results of operations and a more detailed discussion of results for the yearsended December 31, 2008 and 2007:
% of Net Sales
(In millions, except per share data) 2008 2007 % Change 2008 2007
Net Sales $ 2,882.4 $ 2,576.4 12% — —Earnings before Interest and Income Taxes (EBIT) 695.7 663.2 5% 24% 26%Interest Expense—net (43.3) — — 2% —Earnings before Income Taxes 652.4 663.2 (2%) 23% 26%Provision for Income Taxes (251.4) (233.6) 8% 9% 9%
Effective Tax Rate 38.5% 35.2%Net Earnings 401.0 429.6 (7%) 14% 17%
Less: Net Earnings attributable to noncontrollinginterest (7.1) (7.1) 0% 0% 0%
Net Earnings attributable to shareholders 393.9 422.5 (7%) 14% 16%Weighted Average Common Shares Outstanding—Diluted 170.0 170.0Earnings per Common Share—Diluted $ 2.32 $ 2.49 (7%)
IPO-related costs of $44.8 million are included in the results for the year ended December 31, 2008, which effectcomparability between the years ended December 31, 2008 and 2007.
42
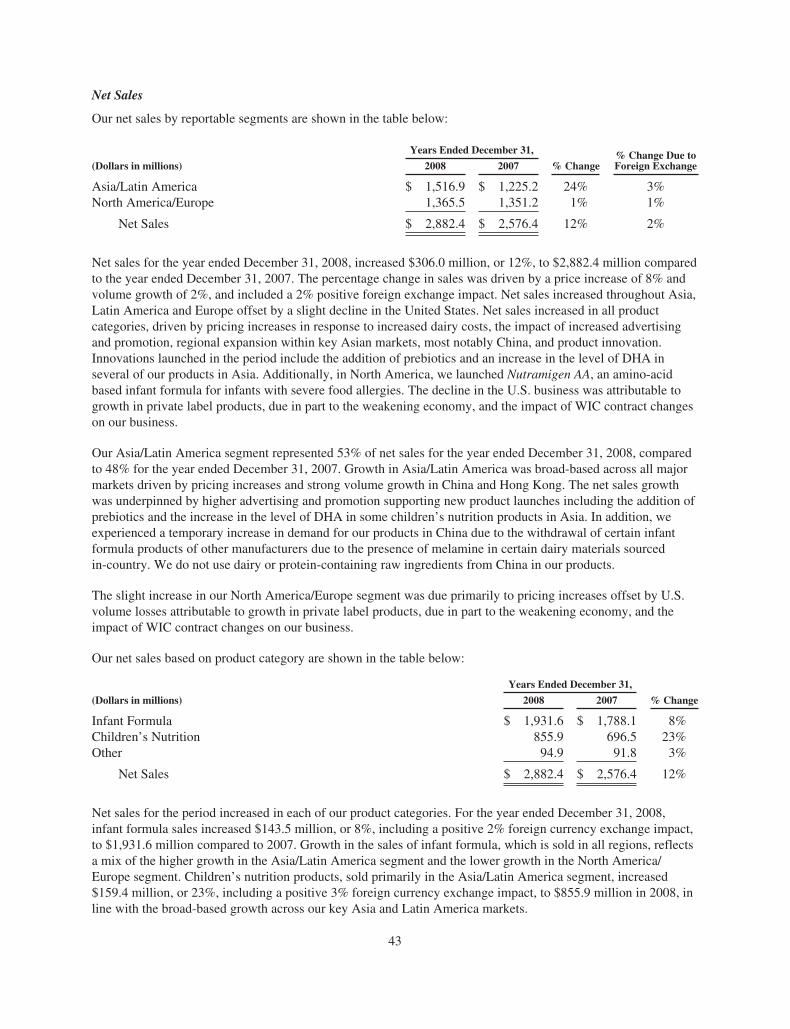
Net Sales
Our net sales by reportable segments are shown in the table below:
Years Ended December 31,
% Change% Change Due toForeign Exchange(Dollars in millions) 2008 2007
Asia/Latin America $ 1,516.9 $ 1,225.2 24% 3%North America/Europe 1,365.5 1,351.2 1% 1%
Net Sales $ 2,882.4 $ 2,576.4 12% 2%
Net sales for the year ended December 31, 2008, increased $306.0 million, or 12%, to $2,882.4 million comparedto the year ended December 31, 2007. The percentage change in sales was driven by a price increase of 8% andvolume growth of 2%, and included a 2% positive foreign exchange impact. Net sales increased throughout Asia,Latin America and Europe offset by a slight decline in the United States. Net sales increased in all productcategories, driven by pricing increases in response to increased dairy costs, the impact of increased advertisingand promotion, regional expansion within key Asian markets, most notably China, and product innovation.Innovations launched in the period include the addition of prebiotics and an increase in the level of DHA inseveral of our products in Asia. Additionally, in North America, we launched Nutramigen AA, an amino-acidbased infant formula for infants with severe food allergies. The decline in the U.S. business was attributable togrowth in private label products, due in part to the weakening economy, and the impact of WIC contract changeson our business.
Our Asia/Latin America segment represented 53% of net sales for the year ended December 31, 2008, comparedto 48% for the year ended December 31, 2007. Growth in Asia/Latin America was broad-based across all majormarkets driven by pricing increases and strong volume growth in China and Hong Kong. The net sales growthwas underpinned by higher advertising and promotion supporting new product launches including the addition ofprebiotics and the increase in the level of DHA in some children’s nutrition products in Asia. In addition, weexperienced a temporary increase in demand for our products in China due to the withdrawal of certain infantformula products of other manufacturers due to the presence of melamine in certain dairy materials sourcedin-country. We do not use dairy or protein-containing raw ingredients from China in our products.
The slight increase in our North America/Europe segment was due primarily to pricing increases offset by U.S.volume losses attributable to growth in private label products, due in part to the weakening economy, and theimpact of WIC contract changes on our business.
Our net sales based on product category are shown in the table below:
Years Ended December 31,
% Change(Dollars in millions) 2008 2007
Infant Formula $ 1,931.6 $ 1,788.1 8%Children’s Nutrition 855.9 696.5 23%Other 94.9 91.8 3%
Net Sales $ 2,882.4 $ 2,576.4 12%
Net sales for the period increased in each of our product categories. For the year ended December 31, 2008,infant formula sales increased $143.5 million, or 8%, including a positive 2% foreign currency exchange impact,to $1,931.6 million compared to 2007. Growth in the sales of infant formula, which is sold in all regions, reflectsa mix of the higher growth in the Asia/Latin America segment and the lower growth in the North America/Europe segment. Children’s nutrition products, sold primarily in the Asia/Latin America segment, increased$159.4 million, or 23%, including a positive 3% foreign currency exchange impact, to $855.9 million in 2008, inline with the broad-based growth across our key Asia and Latin America markets.
43
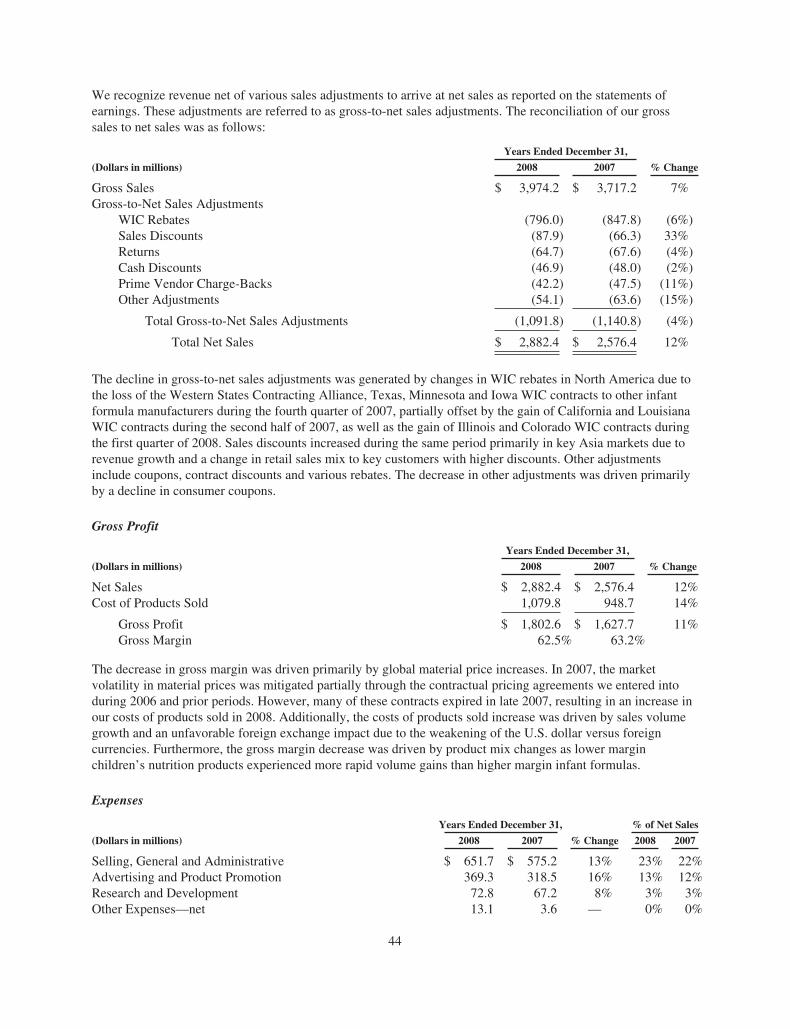
We recognize revenue net of various sales adjustments to arrive at net sales as reported on the statements ofearnings. These adjustments are referred to as gross-to-net sales adjustments. The reconciliation of our grosssales to net sales was as follows:
Years Ended December 31,
% Change(Dollars in millions) 2008 2007
Gross Sales $ 3,974.2 $ 3,717.2 7%Gross-to-Net Sales Adjustments
WIC Rebates (796.0) (847.8) (6%)Sales Discounts (87.9) (66.3) 33%Returns (64.7) (67.6) (4%)Cash Discounts (46.9) (48.0) (2%)Prime Vendor Charge-Backs (42.2) (47.5) (11%)Other Adjustments (54.1) (63.6) (15%)
Total Gross-to-Net Sales Adjustments (1,091.8) (1,140.8) (4%)
Total Net Sales $ 2,882.4 $ 2,576.4 12%
The decline in gross-to-net sales adjustments was generated by changes in WIC rebates in North America due tothe loss of the Western States Contracting Alliance, Texas, Minnesota and Iowa WIC contracts to other infantformula manufacturers during the fourth quarter of 2007, partially offset by the gain of California and LouisianaWIC contracts during the second half of 2007, as well as the gain of Illinois and Colorado WIC contracts duringthe first quarter of 2008. Sales discounts increased during the same period primarily in key Asia markets due torevenue growth and a change in retail sales mix to key customers with higher discounts. Other adjustmentsinclude coupons, contract discounts and various rebates. The decrease in other adjustments was driven primarilyby a decline in consumer coupons.
Gross Profit
Years Ended December 31,
% Change(Dollars in millions) 2008 2007
Net Sales $ 2,882.4 $ 2,576.4 12%Cost of Products Sold 1,079.8 948.7 14%
Gross Profit $ 1,802.6 $ 1,627.7 11%Gross Margin 62.5% 63.2%
The decrease in gross margin was driven primarily by global material price increases. In 2007, the marketvolatility in material prices was mitigated partially through the contractual pricing agreements we entered intoduring 2006 and prior periods. However, many of these contracts expired in late 2007, resulting in an increase inour costs of products sold in 2008. Additionally, the costs of products sold increase was driven by sales volumegrowth and an unfavorable foreign exchange impact due to the weakening of the U.S. dollar versus foreigncurrencies. Furthermore, the gross margin decrease was driven by product mix changes as lower marginchildren’s nutrition products experienced more rapid volume gains than higher margin infant formulas.
Expenses
Years Ended December 31, % of Net Sales
(Dollars in millions) 2008 2007 % Change 2008 2007
Selling, General and Administrative $ 651.7 $ 575.2 13% 23% 22%Advertising and Product Promotion 369.3 318.5 16% 13% 12%Research and Development 72.8 67.2 8% 3% 3%Other Expenses—net 13.1 3.6 — 0% 0%
44
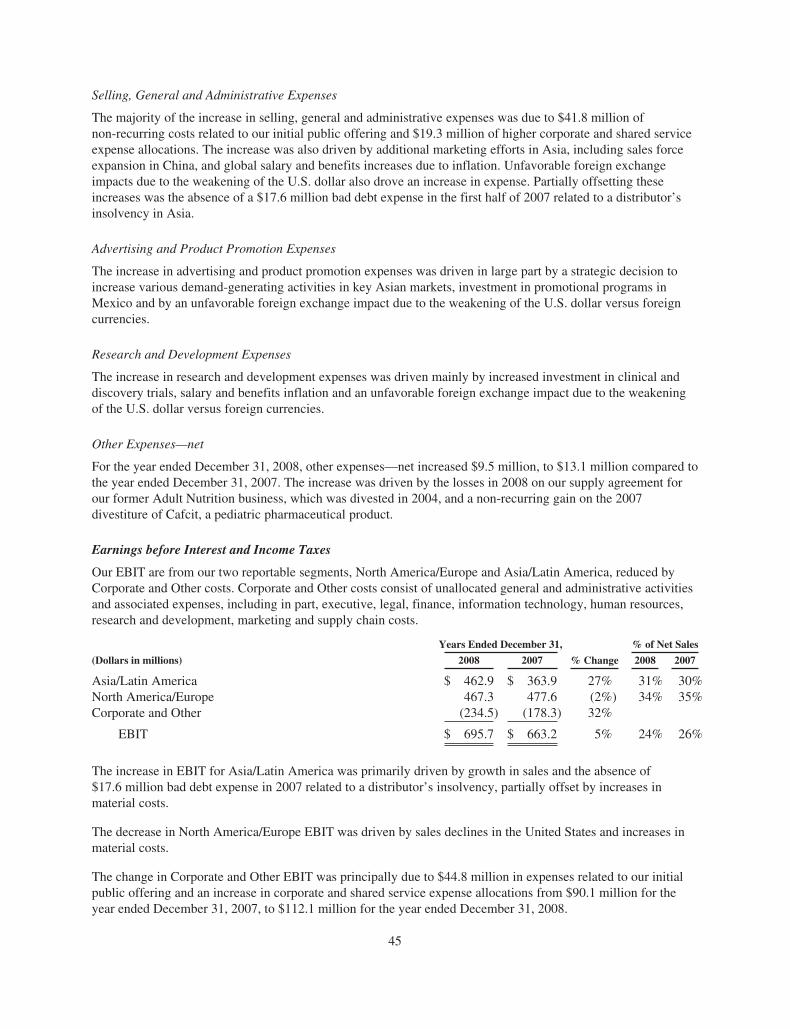
Selling, General and Administrative Expenses
The majority of the increase in selling, general and administrative expenses was due to $41.8 million ofnon-recurring costs related to our initial public offering and $19.3 million of higher corporate and shared serviceexpense allocations. The increase was also driven by additional marketing efforts in Asia, including sales forceexpansion in China, and global salary and benefits increases due to inflation. Unfavorable foreign exchangeimpacts due to the weakening of the U.S. dollar also drove an increase in expense. Partially offsetting theseincreases was the absence of a $17.6 million bad debt expense in the first half of 2007 related to a distributor’sinsolvency in Asia.
Advertising and Product Promotion Expenses
The increase in advertising and product promotion expenses was driven in large part by a strategic decision toincrease various demand-generating activities in key Asian markets, investment in promotional programs inMexico and by an unfavorable foreign exchange impact due to the weakening of the U.S. dollar versus foreigncurrencies.
Research and Development Expenses
The increase in research and development expenses was driven mainly by increased investment in clinical anddiscovery trials, salary and benefits inflation and an unfavorable foreign exchange impact due to the weakeningof the U.S. dollar versus foreign currencies.
Other Expenses—net
For the year ended December 31, 2008, other expenses—net increased $9.5 million, to $13.1 million compared tothe year ended December 31, 2007. The increase was driven by the losses in 2008 on our supply agreement forour former Adult Nutrition business, which was divested in 2004, and a non-recurring gain on the 2007divestiture of Cafcit, a pediatric pharmaceutical product.
Earnings before Interest and Income Taxes
Our EBIT are from our two reportable segments, North America/Europe and Asia/Latin America, reduced byCorporate and Other costs. Corporate and Other costs consist of unallocated general and administrative activitiesand associated expenses, including in part, executive, legal, finance, information technology, human resources,research and development, marketing and supply chain costs.
Years Ended December 31,
% Change
% of Net Sales
(Dollars in millions) 2008 2007 2008 2007
Asia/Latin America $ 462.9 $ 363.9 27% 31% 30%North America/Europe 467.3 477.6 (2%) 34% 35%Corporate and Other (234.5) (178.3) 32%
EBIT $ 695.7 $ 663.2 5% 24% 26%
The increase in EBIT for Asia/Latin America was primarily driven by growth in sales and the absence of$17.6 million bad debt expense in 2007 related to a distributor’s insolvency, partially offset by increases inmaterial costs.
The decrease in North America/Europe EBIT was driven by sales declines in the United States and increases inmaterial costs.
The change in Corporate and Other EBIT was principally due to $44.8 million in expenses related to our initialpublic offering and an increase in corporate and shared service expense allocations from $90.1 million for theyear ended December 31, 2007, to $112.1 million for the year ended December 31, 2008.
45
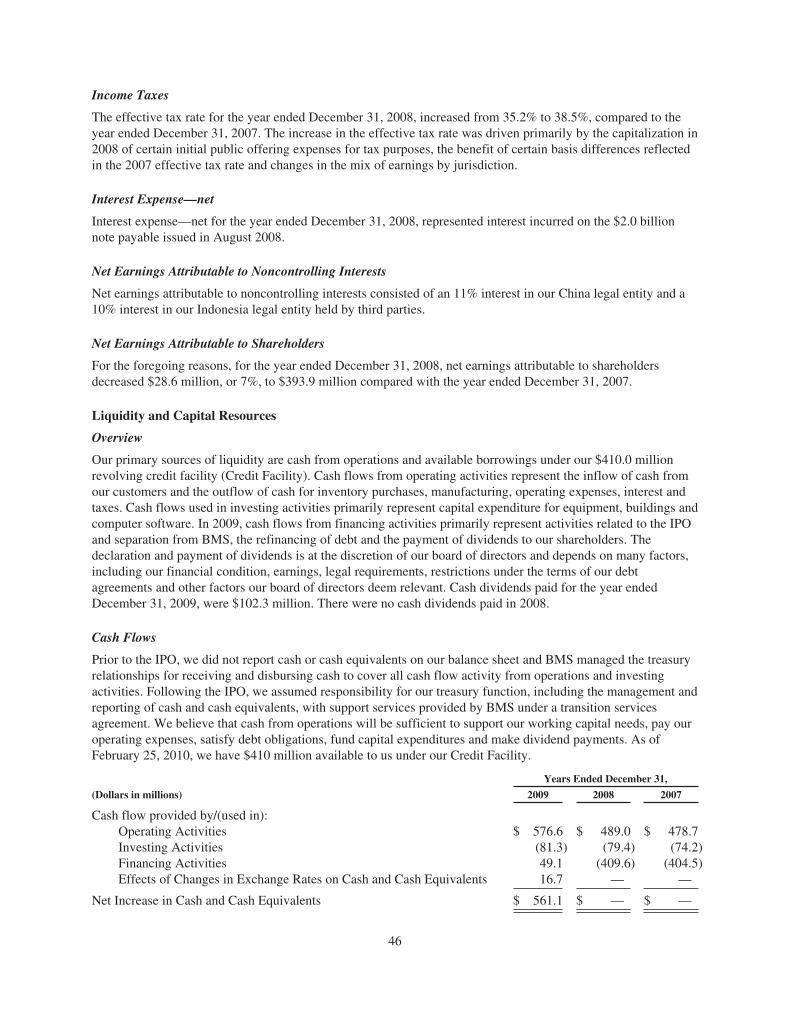
Income Taxes
The effective tax rate for the year ended December 31, 2008, increased from 35.2% to 38.5%, compared to theyear ended December 31, 2007. The increase in the effective tax rate was driven primarily by the capitalization in2008 of certain initial public offering expenses for tax purposes, the benefit of certain basis differences reflectedin the 2007 effective tax rate and changes in the mix of earnings by jurisdiction.
Interest Expense—net
Interest expense—net for the year ended December 31, 2008, represented interest incurred on the $2.0 billionnote payable issued in August 2008.
Net Earnings Attributable to Noncontrolling Interests
Net earnings attributable to noncontrolling interests consisted of an 11% interest in our China legal entity and a10% interest in our Indonesia legal entity held by third parties.
Net Earnings Attributable to Shareholders
For the foregoing reasons, for the year ended December 31, 2008, net earnings attributable to shareholdersdecreased $28.6 million, or 7%, to $393.9 million compared with the year ended December 31, 2007.
Liquidity and Capital Resources
Overview
Our primary sources of liquidity are cash from operations and available borrowings under our $410.0 millionrevolving credit facility (Credit Facility). Cash flows from operating activities represent the inflow of cash fromour customers and the outflow of cash for inventory purchases, manufacturing, operating expenses, interest andtaxes. Cash flows used in investing activities primarily represent capital expenditure for equipment, buildings andcomputer software. In 2009, cash flows from financing activities primarily represent activities related to the IPOand separation from BMS, the refinancing of debt and the payment of dividends to our shareholders. Thedeclaration and payment of dividends is at the discretion of our board of directors and depends on many factors,including our financial condition, earnings, legal requirements, restrictions under the terms of our debtagreements and other factors our board of directors deem relevant. Cash dividends paid for the year endedDecember 31, 2009, were $102.3 million. There were no cash dividends paid in 2008.
Cash Flows
Prior to the IPO, we did not report cash or cash equivalents on our balance sheet and BMS managed the treasuryrelationships for receiving and disbursing cash to cover all cash flow activity from operations and investingactivities. Following the IPO, we assumed responsibility for our treasury function, including the management andreporting of cash and cash equivalents, with support services provided by BMS under a transition servicesagreement. We believe that cash from operations will be sufficient to support our working capital needs, pay ouroperating expenses, satisfy debt obligations, fund capital expenditures and make dividend payments. As ofFebruary 25, 2010, we have $410 million available to us under our Credit Facility.
Years Ended December 31,
(Dollars in millions) 2009 2008 2007
Cash flow provided by/(used in):Operating Activities $ 576.6 $ 489.0 $ 478.7Investing Activities (81.3) (79.4) (74.2)Financing Activities 49.1 (409.6) (404.5)Effects of Changes in Exchange Rates on Cash and Cash Equivalents 16.7 — —
Net Increase in Cash and Cash Equivalents $ 561.1 $ — $ —
46
Year Ended December 31, 2009 Compared to Year Ended December 31, 2008
Cash flow provided by operating activities increased $87.6 million for the year ended December 31, 2009compared with the year ended December 31, 2008. The improvement primarily reflected a decline in ourinventories during 2009 compared with an increase during 2008 due to lower commodity costs. The impact of thechange in inventories was partially offset by an increase in receivables and changes in other current assets andliabilities as well as working capital management initiatives which also resulted in some extension in accountspayable terms.
Cash used in investing activities increased $1.9 million due to an increase in payments for capital expenditures,partially offset by the cash inflow before taxes from the sale of a non-strategic intangible asset.
Cash provided by financing activities totaled $49.1 million in 2009 comprised of $1,495.3 million from theprivate placement of notes in the fourth quarter, $782.3 million net cash proceeds from the IPO, $120 millionfrom net short-term borrowings and $137.7 million net transfers from BMS partly offset by $2,348.1 millionrepayment of BMS debt, $30.0 million promissory note from BMS, dividend payments of $102.3 million anddistributions to noncontrolling interests of $5.8 million. The net transfer from BMS included in financingactivities during 2009 consisted mainly of $316.0 million cash contribution from BMS made in connection withour separation from BMS offset by $166.8 million settlement of related party payables. This compares to cashused in financing activities of $409.6 million in 2008 comprised of net transfers to BMS of $397.9 million anddistributions to noncontrolling interests of $11.7 million.
Year Ended December 31, 2008 Compared to Year Ended December 31, 2007
Net cash provided by operating activities increased $10.3 million to $489.0 million for the year endedDecember 31, 2008, compared to the year ended December 31, 2007. This increase was due to a reduction inworking capital in 2008 as compared to an increase in 2007, offset by a decline in net earnings attributable toshareholders of $28.6 million, which was driven by IPO expenses and interest costs. The favorable change inworking capital is due to increases in accounts payable and accrued expenses. Net cash used in investingactivities increased $5.2 million to $79.4 million for the same period due to an increase in capital expendituresand a decrease in the proceeds from the sale of equipment and a non-strategic intangible asset.
Capital Expenditures
Capital expenditures were $122.3 million for the year ended December 31, 2009, of which $95.8 million was acash outflow. The cash outflow for capital expenditures was $81.1 million for the year ended December 31, 2008and $78.4 million for the year ended December 31, 2007. We expect capital expenditures in 2010 to beapproximately $140 million with the increase primarily driven by IT separation costs and investment in growthand innovation.
Short-Term Borrowings
On February 17, 2009, we entered into a Credit Facility. The Credit Facility is unsecured and repayable onmaturity in February 2012, subject to annual extensions if sufficient lenders agree. The maximum amount ofoutstanding borrowings and letters of credit permitted at any one time under the Credit Facility is $410.0 million,which amount may be increased from time to time up to $500.0 million at our request and with the consent of thelenders, subject to customary conditions. The proceeds of the Credit Facility are to be used for working capitaland other general corporate purposes. In November 2009, we amended the Credit Facility to include the ability touse proceeds to repay amounts owed to BMS. On December 16, 2009, we further amended the Credit Facility to,among other things, release our subsidiary Mead Johnson & Company as a guarantor of our obligations under theCredit Facility. If, however, our corporate credit rating is no longer (i) at least BBB- by Standard & Poor’sRatings Service (S&P) or (ii) at least Baa3 by Moody’s Investors Service, Inc. (Moody’s), then Mead Johnson &Company shall automatically be deemed to guarantee the obligations under the Credit Facility.
47
Borrowings under the Credit Facility bear interest either at (a) LIBOR for specified interest periods plus a margindetermined with reference to our consolidated leverage ratio, or (b) a floating rate based upon JPMorgan ChaseBank’s prime rate, the Federal Funds rate or LIBOR plus, in each case, a margin determined with reference toour consolidated leverage ratio. The margin on the borrowings can range from 1.125% to 2.65% over theapplicable base. In addition, we incur an annual 0.2% facility fee on the entire facility commitment of$410.0 million.
Our subsidiaries may become borrowers under the Credit Facility.
The Credit Facility contains customary covenants, including covenants applicable to limiting liens, substantialasset sales and mergers. Most of these restrictions are subject to certain minimum thresholds and exceptions. TheCredit Facility also contains the following financial covenants:
• We are required to maintain a ratio of (a) consolidated total debt to (b) consolidated Earnings BeforeInterest, Income Taxes, Depreciation and Amortization (EBITDA) of not greater than 3.25 to 1.0.Compliance with this covenant is tested on the last day of each fiscal quarter and as a conditionprecedent to each credit extension under the Credit Facility.
• We are required to maintain a ratio of (a) consolidated EBITDA to (b) consolidated interest expense ofat least 3.0 to 1.0. Compliance with this covenant is tested on the last day of each fiscal quarter for thepreceding four consecutive fiscal quarters.
In addition, the Credit Facility has customary events of default, including (subject to certain materialitythresholds and grace periods) payment default, failure to comply with covenants, material inaccuracy ofrepresentation or warranty, bankruptcy or insolvency proceedings, change of control, ERISA matters and cross-default to other debt agreements. We were in compliance with all debt covenants as of December 31, 2009. Thebalance of $120.0 million is classified as short-term borrowings as of December 31, 2009, and was paid in full inJanuary 2010.
Long-Term Debt
On August 26, 2008, we declared and issued a dividend in the form of a 10-year note to BMS in the amount of$2.0 billion, which was recorded as a reduction of equity. The note had an annual interest rate of 6.1% withinterest payments settled no less than annually. On February 17, 2009, this note payable was amended andrestructured into three separate notes in the amounts of $744.2 million, $500.0 million and $500.0 million (BMSNotes). In November 2009, we repaid the BMS Notes in full through the net proceeds from the private placementof three tranches of notes (the Notes), totaling $1.5 billion, along with borrowings under the Credit Facility andcash on hand. The issuance of the Notes lowered our interest expense and extended the weighted averagematurity date. The Notes are detailed in the table below:
Description Principal Amount Interest Rate Terms
2014 Notes $ 500.0 million 3.50% fixed Interest due semi-annually, not subject to amortization,aggregate principal due on November 1, 2014
2019 Notes $ 700.0 million 4.90% fixed Interest due semi-annually, not subject to amortization,aggregate principal due on November 1, 2019
2039 Notes $ 300.0 million 5.90% fixed Interest due semi-annually, not subject to amortization,aggregate principal due on November 1, 2039
The Notes are our senior unsecured obligations and rank equally in right of payment with each other and withall of our existing and future senior indebtedness. In addition, the Notes are structurally subordinated to allliabilities of our subsidiaries, including trade payables. The Notes may be prepaid at any time, in whole or inpart, at a redemption price equal to the greater of par value or an amount calculated based upon the sum of thepresent values of the remaining scheduled payments as set forth in a First Supplemental Indenture datedNovember 5, 2009. Upon a change of control, we may be required to repurchase the notes in an amount equal to101% of the then outstanding principal amount plus accrued and unpaid interest.
48
In connection with issuance of the Notes, we entered into a registration rights agreement with the representativesof the initial purchasers of the Notes (Registration Rights Agreement). Under the Registration Rights Agreement,we have agreed to use our reasonable best efforts to cause to become effective a registration statement withrespect to an offer to exchange the Notes for freely tradable notes issued by us that are registered with theSecurities and Exchange Commission and that have terms substantially identical in all material respects to theNotes. If we are unable to effect the exchange offer, we have agreed to use our reasonable best efforts to file andcause to become effective a shelf registration statement relating to resales of the Notes. We will be obligated topay additional interest on the Notes if the exchange offer is not completed (or, if required, the shelf registration isnot declared effective) by August 2, 2010.
In November 2009, we entered into interest rate swap agreements with a notional amount of $700.0 million. Theinterest rate swap agreements effectively swap fixed interest rate obligations for floating interest rate obligationswith respect to (i) the entire $500.0 million in aggregate principal amount of the 2014 Notes and (ii)$200.0 million out of the $700.0 million in aggregate principal amount of the 2019 Notes.
The following tables summarize the interest rate swaps outstanding at December 31, 2009:
(Dollars in millions)
NotionalAmount ofUnderlying
Debt Variable Rate PaidYear of
Transaction MaturityFair
Value
Swaps associated with:3.50% Notes due 2014 $ 500.0 1 month U.S. $ LIBOR + 0.890% 2009 2014 $ (4.2)4.90% Notes due 2019 200.0 1 month U.S. $ LIBOR + 1.381% 2009 2019 (6.2)
$ 700.0 $ (10.4)
For additional information on our long-term debt and interest rate swaps, see “Item 8. Financial Statements.”
On January 31, 2009, one of our subsidiaries, Mead Johnson Nutricionales de Mexico, S. De R.L. de C.V.,entered into an agreement with BMS to lease all of the property, plant and equipment assets at the manufacturingfacility in Delicias, Mexico, for 20 years. The lease qualified as a capital lease, and the property, plant andequipment is included in our financial statements for all periods. As part of the split-off from BMS, we purchasedthese assets for $48.7 million plus applicable taxes in December 2009, and the lease was terminated. The liabilityrelated to this purchase was paid in full in January 2010.
Credit Ratings
The Moody’s credit ratings for MJN and for our senior unsecured notes are both currently Baa1. S&P’s creditratings for MJN and for our senior unsecured notes are currently BBB and BBB-, respectively. Both Moody’sand S&P issued their first credit ratings for MJN and our notes during the fourth quarter of 2009.
Recent Developments
We have a subsidiary in Venezuela. As of January 1, 2010, this subsidiary will be accounted for underhyperinflationary accounting rules, and the functional currency will be changed from the bolivar to the U.S.dollar. Effective January 11, 2010, the Venezuelan government devalued the bolivar by resetting the officialexchange rate from BsF 2.15 per dollar to a two-tier exchange rate — “the essentials rate” at BsF 2.60 per dollarand “the non-essentials rate” at BsF 4.30 per dollar. While the imports of the majority of our products intoVenezuela qualify for the essentials rate, the rate applicable to repatriation of earnings is not yet determined.Based on a potential translation rate of BsF 4.30 per dollar, we estimate the negative impact of the balance sheetremeasurement on our 2010 first quarter earnings to be approximately $0.03 per share and the negative impact ofthe rate change on our operating results to be an additional $0.05 per share spread throughout 2010.
49
Contractual Obligations
As of December 31, 2009, our significant contractual obligations and other commitments were as follows:
Payments due by December 31,
(In millions) 2010 2011 2012 2013 2014 Thereafter Total
Operating lease obligations $ 19.6 $ 16.5 $ 14.9 $ 12.5 $ 7.1 $ 28.9 $ 99.5Capital lease obligations 0.4 0.3 0.3 0.3 0.3 0.3 1.9Purchase obligations 149.2 111.9 72.3 57.8 55.4 201.7 648.3Long-term debt — — — — 497.8 997.5 1,495.3Interest on long-term debt 55.7 66.2 74.8 80.4 79.4 611.5 968.0
Total $ 224.9 $ 194.9 $ 162.3 $ 151.0 $ 640.0 $ 1,839.9 $ 3,213.0
Our operating lease obligations are generally related to real estate leases for offices, vehicle leases andmanufacturing-related leases. Capital lease obligations relate to assets utilized for interplant transportation ofmaterials and finished goods. Purchase obligations are for unconditional commitments related to a master serviceagreement with IBM for information technology, accounting and indirect procurement services, including thedesign and implementation of a global enterprise resource planning system, the purchase of materials used inmanufacturing and for promotional services, and a transition services agreement for various corporate supportservices provided between us and BMS. The table above does not include $16.9 million in uncertain tax positionsdue to the uncertainty related to the timing of the reversal of the positions. The future interest payments on long-term debt, including the effect of our interest rate swaps, are estimated based on implied forward LIBOR ratesused in the valuation of our interest rate swaps.
Off-Balance Sheet Arrangements
Pursuant to an Amended and Restated Tax Matters Agreement with BMS, we have agreed to indemnify BMS for(i) any tax payable with respect to any separate tax return that we are required to file or cause to be filed, (ii) anytax incurred as a result of any gain that may be recognized by a member of the BMS affiliated group with respectto a transfer of certain foreign affiliates by us in preparation for the IPO, and (iii) any tax arising from the failureor breach of any representation or covenant made by us which failure or breach results in the intended taxconsequences of the split-off transaction not being achieved.
We do not use off-balance sheet derivative financial instruments to hedge or partially hedge interest rateexposure nor do we maintain any other off-balance sheet arrangements for the purpose of credit enhancement,hedging transactions or other financial or investment purposes.
Significant Accounting Estimates
In presenting our financial statements in accordance with accounting principles generally accepted in the UnitedStates (GAAP), we are required to make estimates and assumptions that affect the reported amounts of assets,liabilities, revenues, costs and expenses and related disclosures.
Some of the estimates and assumptions that we are required to make relate to matters that are inherentlyuncertain as they pertain to future events. We base these estimates and assumptions on historical experience or onvarious other factors that we believe to be reasonable and appropriate under the circumstances. On an on-goingbasis, we reconsider and evaluate our estimates and assumptions. Actual results may differ significantly fromthese estimates. Future results may differ from our estimates under different assumptions or conditions.
We believe that the significant accounting estimates listed below involve our more significant judgments,assumptions and estimates and, therefore, could have the greatest potential impact on our financial statements.
50
For information on our accounting policies, see “Item 8. Financial Statements.”
Revenue Recognition – WIC Rebates
We participate on a competitive bidding basis in nutrition programs sponsored by states, tribal governments, theCommonwealth of Puerto Rico, and U.S. territories for WIC. Under these programs, we reimburse these entitiesfor the difference between our wholesaler list price and the contract price on eligible products. We account forWIC contract rebates by establishing an accrual in an amount equal to our estimate of WIC rebate claimsattributable to a sale. We determine our estimate of the WIC rebate accrual primarily based on historicalexperience regarding WIC rebates and current contract prices under the WIC programs. We consider levels ofinventory in the distribution channel, new WIC contracts, terminated WIC contracts, changes in existing WICcontracts and WIC participation, and adjust the accrual quarterly to reflect actual expense. WIC rebate accrualswere $199.9 million and $194.7 million at December 31, 2009 and 2008, respectively, and are included inaccrued rebates and returns on our balance sheet. Rebates under the WIC program reduced revenues by$735.7 million, $796.0 million, and $847.8 million in the years ended December 31, 2009, 2008 and 2007,respectively.
Revenue Recognition – Sales Returns
We account for sales returns by establishing an accrual in an amount equal to our estimate of sales recorded forwhich the related products are expected to be returned. We determine our estimate of the sales return accrualprimarily based on historical experience regarding sales returns, but also consider other factors that could impactsales returns such as new product introductions. Sales return accruals were $33.9 million and $29.3 million atDecember 31, 2009 and 2008, respectively, and are included in accrued rebates and returns on our balance sheet.Returns reduced sales by $72.0 million, $64.7 million and $67.6 million for the years ended December 31, 2009,2008 and 2007, respectively.
Income Taxes
The effective tax rate reflects statutory tax rates, tax planning opportunities available in the various jurisdictionsin which we operate, including tax holidays, and management’s estimate of appropriate reserves againstuncertain tax positions. Significant judgment is required in determining the effective tax rate and in evaluatingthe uncertainty in tax positions.
The income tax provision prepared in the period following the IPO but preceding the split-off reflects a separatereturn methodology based on the actual legal entity structure as if we were a separate taxpayer in the respectivejurisdictions with certain accommodations pursuant to a tax matters agreement as noted below. This is in contrastto the pre-IPO period in which the income tax provision was prepared on a separate return stand-alonemethodology reflecting a hypothetical legal entity structure in which we were included in the tax grouping ofother BMS entities within the respective entity’s tax jurisdiction. The income tax provision prepared in the postsplit-off period reflects a separate return methodology based on the actual legal entity structure where we are aseparate taxpayer in the respective jurisdictions.
The provision for income taxes has been determined using the asset and liability approach of accounting forincome taxes. Under this approach, deferred taxes represent the future tax consequences expected to occur whenthe reported amounts of assets and liabilities are recovered or paid. The provision for income taxes representsincome taxes paid or payable for the current year plus the change in deferred taxes during the year. Deferredtaxes result from differences between the financial and tax basis of our assets and liabilities. Deferred tax assetsand liabilities are measured using the currently enacted tax rates that apply to taxable earnings in effect for theyears in which those tax attributes are expected to be recovered or paid, and are adjusted for changes in tax ratesand tax laws when changes are enacted. The ultimate liability incurred by us may differ from the provisionestimates based on a number of factors, including interpretations of tax laws and the resolution of examinationsby the taxing authorities.
51
Valuation allowances are recorded to reduce deferred tax assets when it is more likely than not that a tax benefitwill not be realized. The assessment of whether or not a valuation allowance is required often requires significantjudgment including the long-range forecast of future taxable earnings and the evaluation of tax planninginitiatives. Adjustments to the deferred tax valuation allowances are made to earnings in the period when suchassessments are made.
Changes in recognized tax benefits and changes in valuation allowances could be material to our results ofoperations for any period, but are not expected to be material to our financial position.
On February 10, 2009, we entered into a tax matters agreement with BMS. This agreement governs the taxrelationship between us and BMS for the tax periods through our December 23, 2009 split-off from BMS. Underthis agreement, responsibility is allocated between BMS and its subsidiaries, and us for the payment of taxesresulting from filing (i) tax returns on a combined, consolidated or unitary basis and (ii) single entity tax returnsfor entities that have both MJN and non-MJN operations. Accordingly, BMS prepares returns for us for allperiods during which we are included in a combined, consolidated or unitary group with BMS or any of itssubsidiaries for federal, state, local or foreign tax purposes, as if we ourselves were filing as a combined,consolidated or unitary group. BMS also prepares returns for us for all periods during which a single-entity taxreturn is filed for an entity that has both MJN and non-MJN operations. We make payments to BMS and BMSmakes payments to us with respect to such returns, as if such returns were actually required to be filed under thelaws of the applicable taxing jurisdiction and BMS were the relevant taxing authority of such jurisdiction.
On December 18, 2009, we entered into an Amended and Restated Tax Matters Agreement with BMS. Withrespect to the period before the split-off, the Amended and Restated Tax Matters Agreement allocates theresponsibility of BMS and its subsidiaries, and us for the payment of taxes in the same manner as discussedabove with respect to the tax matters agreement. Pursuant to the Amended and Restated Tax Matters Agreement,we have consented to join BMS in electing to allocate items ratably between the portion of the taxable year inwhich we were included in the BMS consolidated tax group, and the short period beginning after the split-off andending on December 31, 2009 when we are a separate taxpayer. Additionally under the Amended and RestatedTax Matters Agreement, BMS has agreed to indemnify us for (i) any tax attributable to a Mead Johnson legalentity for any taxable period ending on or before December 31, 2008, (ii) any tax arising solely as a result of theIPO and the restructuring which preceded the IPO, and (iii) any transaction tax associated with the split-offtransaction. We have agreed to indemnify BMS for (i) any tax payable with respect to any separate return that weare required to file or cause to be filed, (ii) any tax incurred as a result of any gain which may be recognized by amember of the BMS affiliated group with respect to a transfer of certain foreign affiliates by us in preparation forthe IPO, and (iii) any tax arising from the failure or breach of any representation or covenant made by us whichfailure or breach results in the intended tax consequences of the split-off transaction not being achieved. Werecorded as an equity contribution certain deferred tax assets recorded from BMS as a result of the split-off.
As of December 31, 2009, based upon the terms of the tax matters agreement discussed above, we hold a netpayable of $12.0 million to BMS. This payable is recorded in U.S. and foreign income taxes payable on ourbalance sheet. Effective with the split-off from BMS, we no longer are included in BMS’ consolidated tax return.
Goodwill
Goodwill is tested for impairment using a two-step process on an annual basis or when current facts orcircumstances indicate that a potential impairment may exist. The first step is to identify a potential impairment,and the second step measures the amount of the impairment loss, if any. Goodwill is deemed to be impaired if thecarrying amount of a reporting unit’s goodwill exceeds its estimated fair value. We complete our annual goodwillimpairment assessment during the first quarter and monitor for any potential impairment in the remainingquarters, neither of which indicated an impairment of goodwill in 2009, 2008 or 2007.
52
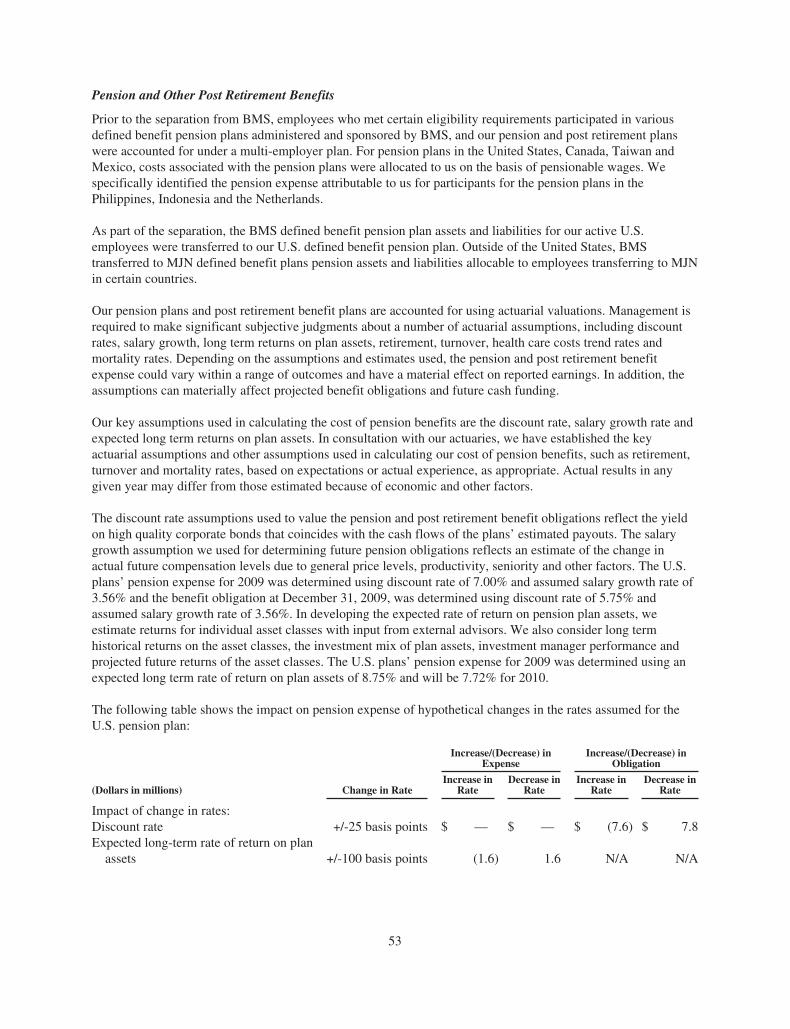
Pension and Other Post Retirement Benefits
Prior to the separation from BMS, employees who met certain eligibility requirements participated in variousdefined benefit pension plans administered and sponsored by BMS, and our pension and post retirement planswere accounted for under a multi-employer plan. For pension plans in the United States, Canada, Taiwan andMexico, costs associated with the pension plans were allocated to us on the basis of pensionable wages. Wespecifically identified the pension expense attributable to us for participants for the pension plans in thePhilippines, Indonesia and the Netherlands.
As part of the separation, the BMS defined benefit pension plan assets and liabilities for our active U.S.employees were transferred to our U.S. defined benefit pension plan. Outside of the United States, BMStransferred to MJN defined benefit plans pension assets and liabilities allocable to employees transferring to MJNin certain countries.
Our pension plans and post retirement benefit plans are accounted for using actuarial valuations. Management isrequired to make significant subjective judgments about a number of actuarial assumptions, including discountrates, salary growth, long term returns on plan assets, retirement, turnover, health care costs trend rates andmortality rates. Depending on the assumptions and estimates used, the pension and post retirement benefitexpense could vary within a range of outcomes and have a material effect on reported earnings. In addition, theassumptions can materially affect projected benefit obligations and future cash funding.
Our key assumptions used in calculating the cost of pension benefits are the discount rate, salary growth rate andexpected long term returns on plan assets. In consultation with our actuaries, we have established the keyactuarial assumptions and other assumptions used in calculating our cost of pension benefits, such as retirement,turnover and mortality rates, based on expectations or actual experience, as appropriate. Actual results in anygiven year may differ from those estimated because of economic and other factors.
The discount rate assumptions used to value the pension and post retirement benefit obligations reflect the yieldon high quality corporate bonds that coincides with the cash flows of the plans’ estimated payouts. The salarygrowth assumption we used for determining future pension obligations reflects an estimate of the change inactual future compensation levels due to general price levels, productivity, seniority and other factors. The U.S.plans’ pension expense for 2009 was determined using discount rate of 7.00% and assumed salary growth rate of3.56% and the benefit obligation at December 31, 2009, was determined using discount rate of 5.75% andassumed salary growth rate of 3.56%. In developing the expected rate of return on pension plan assets, weestimate returns for individual asset classes with input from external advisors. We also consider long termhistorical returns on the asset classes, the investment mix of plan assets, investment manager performance andprojected future returns of the asset classes. The U.S. plans’ pension expense for 2009 was determined using anexpected long term rate of return on plan assets of 8.75% and will be 7.72% for 2010.
The following table shows the impact on pension expense of hypothetical changes in the rates assumed for theU.S. pension plan:
Increase/(Decrease) inExpense
Increase/(Decrease) inObligation
(Dollars in millions) Change in RateIncrease in
RateDecrease in
RateIncrease in
RateDecrease in
Rate
Impact of change in rates:Discount rate +/-25 basis points $ — $ — $ (7.6) $ 7.8Expected long-term rate of return on plan
assets +/-100 basis points (1.6) 1.6 N/A N/A
53
See “Item 8. Financial Statements” for additional information on our pension and post retirement benefits.
Issued but not yet Effective Accounting Standards
Effective January 1, 2010, Accounting Standards Codification (ASC) No. 810, Consolidation, will requirecompanies to identify the primary beneficiary of a variable interest entity as the enterprise that has both thepower to direct the activities of a variable interest entity that most significantly impacts the entity’s economicperformance, and the obligation to absorb losses or the right to receive benefits of the entity that could potentiallybe significant to the variable interest entity. Also effective January 1, 2010, ASC No. 810 will require on-goingreassessments of whether an enterprise is the primary beneficiary and eliminates the quantitative approachpreviously required for determining the primary beneficiary. We do not expect these requirements to have amaterial effect on the consolidated financial statements.
Special Note Regarding Forward-Looking Statements
This Annual Report on Form 10-K and other written and oral statements we make from time to time containcertain “forward-looking” statements within the meaning of Section 27A of the Securities Act of 1933 andSection 21E of the Securities Exchange Act of 1934. You can identify these forward-looking statements by thefact they use words such as “should,” “expect,” “anticipate,” “estimate,” “target,” “may,” “project,” “guidance,”“intend,” “plan,” “believe” and other words and terms of similar meaning and expression in connection with anydiscussion of future operating or financial performance. You can also identify forward-looking statements by thefact that they do not relate strictly to historical or current facts. Such forward-looking statements are based oncurrent expectations and involve inherent risks and uncertainties, including factors that could delay, divert orchange any of them, and could cause actual outcomes to differ materially from current expectations. Thesestatements are likely to relate to, among other things, our goals, plans and projections regarding its financialposition, results of operations, cash flows, market position, product development, product approvals, salesefforts, expenses, performance or results of current and anticipated products and the outcome of contingenciessuch as legal proceedings and financial results, which are based on current expectations that involve inherentrisks and uncertainties, including internal or external factors that could delay, divert or change any of them in thenext several years. We have included important factors in the cautionary statements included in “Item 1A. RiskFactors,” that we believe could cause actual results to differ materially from any forward-looking statement.
Although we believe we have been prudent in our plans and assumptions, we can give no assurance that any goalor plan set forth in forward-looking statements can be achieved and we caution readers not to place unduereliance on such statements, which speak only as of the date made. We undertake no obligation to releasepublicly any revisions to forward-looking statements as a result of new information, future events or otherwise.
54
Item 7A. QUANTITATIVE AND QUALITATIVE DISCLOSURES ABOUT MARKET RISK.
We are exposed to certain market risks which exist as part of our on-going business operations. As a policy, wedo not engage in speculative or leveraged transactions, nor do we hold or issue financial instruments for tradingpurposes.
Inflation
Our materials costs are influenced by inflation and fluctuations in global commodity prices, principally dairy,agricultural oils and tinplate. In addition, costs for construction, taxes, repairs, maintenance, insurance and mediaare all subject to inflationary pressures.
Foreign Exchange Risk
We are exposed to market risk due to changes in currency exchange rates. Our primary net foreign currencytranslation exposures are the Chinese renminbi, the Hong Kong dollar, the Philippine peso, the Mexican peso, theeuro, the Malaysian ringitt and the Canadian dollar. In addition to these primary exposures, as a global business,we are exposed to foreign currency translation risk in all countries in which we do business whose local reportingcurrency is not the U.S. dollar. For example, in Venezuela, the application of hyperinflationary accountingcoupled with the government-directed devaluation of the local currency and prohibitive currency controls willnegatively impact our 2010 results as discussed within the Recent Development section of “Item 7.Management’s Discussion and Analysis of Financial Condition and Results of Operations.” Prior to theseparation from BMS, we used derivative financial instruments indirectly through participation in the centralizedhedging functions of BMS, which were designed primarily to minimize exposure to foreign currency risk, and wehave continued to use derivative financial instruments for this purpose. We do not hold or issue derivativefinancial instruments for speculative purposes.
We use foreign currency contracts to hedge anticipated transactions on certain foreign currencies and designatethese derivative instruments as foreign currency cash flow hedges when appropriate. If the derivative isdesignated as a cash flow hedge, the change in the fair value of the derivative is initially recorded in othercomprehensive income and then recognized in our statement of earnings when the corresponding hedged itemimpacts our earnings. The foreign currency derivatives resulted in losses of $5.0 million, $0.9 million, and$2.6 million in the years ended December 31, 2009, 2008 and 2007, respectively. The impact of hedgeineffectiveness on our earnings was not material.
We enter into hedging and other foreign exchange management arrangements to reduce the risk of foreigncurrency exchange rate fluctuations to the extent that cost-effective derivative financial instruments or othernon-derivative financial instrument approaches are available. Derivative financial instruments will not be usedfor speculative purposes. The intent of gains and losses on hedging transactions is to offset the respective gainsand losses on the underlying exposures being hedged. While we attempt to mitigate some of this risk withhedging and other activities, our business will nevertheless remain subject to substantial foreign exchange riskfrom foreign currency translation exposures that we will not be able to manage through effective hedging or theuse of other financial instruments.
The total notional amount of foreign currency derivative instruments at year-end 2009 was $64.2 million,representing a net settlement payable of approximately $3.3 million. All of these derivatives were hedges ofanticipated transactions, transaction exposure, or existing assets or liabilities, and mature within 14 months.Assuming an unfavorable 10% change in year-end exchange rates, the settlement payable would have increasedby approximately $7.5 million. The unfavorable changes would generally have been offset by favorable changesin the values of the underlying exposures.
Commodity Risk
We purchase certain products in the normal course of business, including dairy and agricultural oils, the costs ofwhich are affected by global commodity changes. Therefore, we are exposed to some price volatility related tomarket conditions outside of our control.
55
We employ various purchasing and pricing contract techniques in an effort to minimize volatility. Generally,these techniques include unit pricing that is based on an average of commodity prices over a contractuallydefined period of time and setting fixed prices with suppliers. We do not generally make use of financialinstruments to hedge commodity prices, partially because of these contract pricing techniques. As ofDecember 31, 2009, we had no outstanding commodity derivative instruments.
Interest Rate Risk
We are exposed to changes in interest rates primarily as a result of our borrowing and investing activities used tomaintain liquidity and fund business operations. Primary exposures include movements in U.S Treasury rates,London Interbank Offered Rates (LIBOR), and commercial paper rates. The nature and amount of our short-termand long-term debt can be expected to vary as a result of future business requirements, market conditions andother factors. Our debt obligations totaled $1.6 billion (including $10.4 million relating to the fair value ofinterest rate swaps adjustment). For information on our debt obligations, see Item 8. “Financial Statements.”
In order to manage interest rate expense and to achieve a desired proportion of variable versus fixed rate debt, wehave entered into interest rate swaps agreements. These derivatives are primarily accounted for as fair valuehedges. Accordingly, changes in the fair value of these derivatives, along with changes in the fair value of thehedged debt obligations that are attributed to the hedged risk, are recognized in current period earnings. We hadinterest rate contracts with a total notional amount of $700.0 million at December 31, 2009. Assuming averagevariable debt levels during the year, a one percentage point increase in LIBOR would have increased interestexpense by approximately $7 million in 2009.
56
Item 8. FINANCIAL STATEMENTS AND SUPPLEMENTARY DATA.
INDEX TO FINANCIAL STATEMENTS
REPORTS OF INDEPENDENT REGISTERED PUBLIC ACCOUNTING FIRM 58
Audited Consolidated Financial Statements of Mead Johnson Nutrition Company:
Consolidated Statements of Earnings for the Years Ended December 31, 2009, 2008 and 2007 60
Consolidated Balance Sheets as of December 31, 2009 and 2008 61
Consolidated Statements of Comprehensive Income and Equity (Deficit) for the Years EndedDecember 31, 2009, 2008 and 2007 62
Consolidated Statements of Cash Flows for the Years Ended December 31, 2009, 2008 and 2007 63
Notes to Financial Statements 64
Schedule II—Valuation and Qualifying Accounts 94
57
REPORT OF INDEPENDENT REGISTERED PUBLIC ACCOUNTING FIRM
To the Board of Directors and Stockholders ofMead Johnson Nutrition CompanyGlenview, Illinois
We have audited the accompanying consolidated balance sheets of Mead Johnson Nutrition Company andsubsidiaries (the “Company”) as of December 31, 2009 and 2008, and the related consolidated statements ofearnings, comprehensive income and equity (deficit), and cash flows for each of the three years in the periodended December 31, 2009. Our audits also included the financial statement schedule listed in the Index at Item 8.These financial statements and financial statement schedule are the responsibility of the Company’smanagement. Our responsibility is to express an opinion on the financial statements and financial statementschedule based on our audits.
We conducted our audits in accordance with the standards of the Public Company Accounting Oversight Board(United States). Those standards require that we plan and perform the audit to obtain reasonable assurance aboutwhether the financial statements are free of material misstatement. An audit includes examining, on a test basis,evidence supporting the amounts and disclosures in the financial statements. An audit also includes assessing theaccounting principles used and significant estimates made by management, as well as evaluating the overallfinancial statement presentation. We believe that our audits provide a reasonable basis for our opinion.
In our opinion, such consolidated financial statements present fairly, in all material respects, the financialposition of Mead Johnson Nutrition Company and subsidiaries as of December 31, 2009 and 2008, and theresults of their operations and their cash flows for each of the three years in the period ended December 31, 2009,in conformity with accounting principles generally accepted in the United States of America. Also, in ouropinion, such financial statement schedule, when considered in relation to the basic consolidated financialstatements taken as a whole, presents fairly, in all material respects, the information set forth therein.
As discussed in Note 4 to the consolidated financial statements, the financial statements include allocations ofexpenses from Bristol-Myers Squibb Company for the years ended 2008 and 2007. These allocations may not bereflective of the actual level of costs or debt which would have been incurred had the Company operated as aseparate entity apart from Bristol-Myers Squibb Company.
We have also audited, in accordance with the standards of the Public Company Accounting Oversight Board(United States), the Company’s internal control over financial reporting as of December 31, 2009, based on thecriteria established in Internal Control—Integrated Framework issued by the Committee of SponsoringOrganizations of the Treadway Commission and our report dated February 25, 2010 expressed an unqualifiedopinion on the Company’s internal control over financial reporting.
/s/ DELOITTE & TOUCHE LLP
Parsippany, New JerseyFebruary 25, 2010
58
REPORT OF INDEPENDENT REGISTERED PUBLIC ACCOUNTING FIRM
To the Board of Directors and Stockholders ofMead Johnson Nutrition CompanyGlenview, Illinois
We have audited the internal control over financial reporting of Mead Johnson Nutrition Company andsubsidiaries (the “Company”) as of December 31, 2009, based on criteria established in Internal Control —Integrated Framework issued by the Committee of Sponsoring Organizations of the Treadway Commission. TheCompany’s management is responsible for maintaining effective internal control over financial reporting and forits assessment of the effectiveness of internal control over financial reporting, included in the accompanyingManagement’s Report on Internal Controls Over Financial Reporting. Our responsibility is to express an opinionon the Company’s internal control over financial reporting based on our audit.
We conducted our audit in accordance with the standards of the Public Company Accounting Oversight Board(United States). Those standards require that we plan and perform the audit to obtain reasonable assurance aboutwhether effective internal control over financial reporting was maintained in all material respects. Our auditincluded obtaining an understanding of internal control over financial reporting, assessing the risk that a materialweakness exists, testing and evaluating the design and operating effectiveness of internal control based on theassessed risk, and performing such other procedures as we considered necessary in the circumstances. We believethat our audit provides a reasonable basis for our opinion.
A company’s internal control over financial reporting is a process designed by, or under the supervision of, thecompany’s principal executive and principal financial officers, or persons performing similar functions, andeffected by the company’s board of directors, management, and other personnel to provide reasonable assuranceregarding the reliability of financial reporting and the preparation of financial statements for external purposes inaccordance with generally accepted accounting principles. A company’s internal control over financial reportingincludes those policies and procedures that (1) pertain to the maintenance of records that, in reasonable detail,accurately and fairly reflect the transactions and dispositions of the assets of the company; (2) provide reasonableassurance that transactions are recorded as necessary to permit preparation of financial statements in accordancewith generally accepted accounting principles, and that receipts and expenditures of the company are being madeonly in accordance with authorizations of management and directors of the company; and (3) provide reasonableassurance regarding prevention or timely detection of unauthorized acquisition, use, or disposition of thecompany’s assets that could have a material effect on the financial statements.
Because of the inherent limitations of internal control over financial reporting, including the possibility ofcollusion or improper management override of controls, material misstatements due to error or fraud may not beprevented or detected on a timely basis. Also, projections of any evaluation of the effectiveness of the internalcontrol over financial reporting to future periods are subject to the risk that the controls may become inadequatebecause of changes in conditions, or that the degree of compliance with the policies or procedures maydeteriorate.
In our opinion, the Company maintained, in all material respects, effective internal control over financialreporting as of December 31, 2009, based on the criteria established in Internal Control — Integrated Frameworkissued by the Committee of Sponsoring Organizations of the Treadway Commission.
We have also audited, in accordance with the standards of the Public Company Accounting Oversight Board(United States), the consolidated financial statements and financial statement schedule as of and for the yearended December 31, 2009 of the Company and our report dated February 25, 2010 expressed an unqualifiedopinion on those financial statements and financial statement schedule.
/s/ DELOITTE & TOUCHE LLP
Parsippany, New JerseyFebruary 25, 2010
59
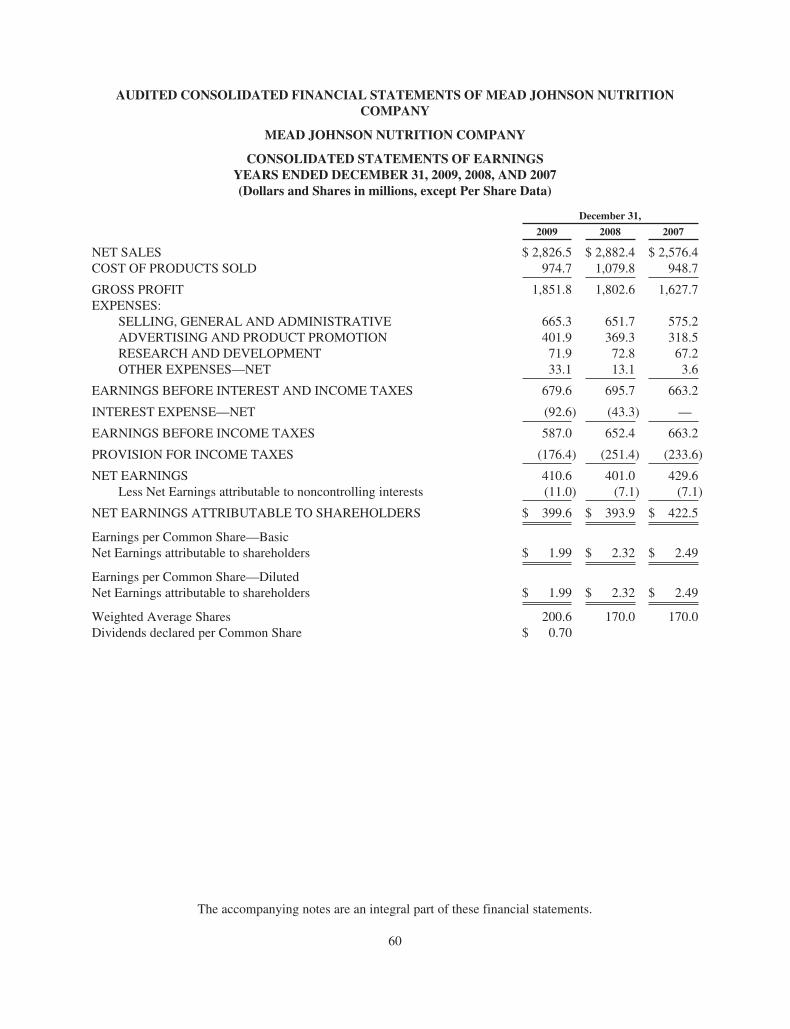
AUDITED CONSOLIDATED FINANCIAL STATEMENTS OF MEAD JOHNSON NUTRITIONCOMPANY
MEAD JOHNSON NUTRITION COMPANY
CONSOLIDATED STATEMENTS OF EARNINGSYEARS ENDED DECEMBER 31, 2009, 2008, AND 2007(Dollars and Shares in millions, except Per Share Data)
December 31,
2009 2008 2007
NET SALES $ 2,826.5 $ 2,882.4 $ 2,576.4COST OF PRODUCTS SOLD 974.7 1,079.8 948.7
GROSS PROFIT 1,851.8 1,802.6 1,627.7EXPENSES:
SELLING, GENERAL AND ADMINISTRATIVE 665.3 651.7 575.2ADVERTISING AND PRODUCT PROMOTION 401.9 369.3 318.5RESEARCH AND DEVELOPMENT 71.9 72.8 67.2OTHER EXPENSES—NET 33.1 13.1 3.6
EARNINGS BEFORE INTEREST AND INCOME TAXES 679.6 695.7 663.2
INTEREST EXPENSE—NET (92.6) (43.3) —
EARNINGS BEFORE INCOME TAXES 587.0 652.4 663.2
PROVISION FOR INCOME TAXES (176.4) (251.4) (233.6)
NET EARNINGS 410.6 401.0 429.6Less Net Earnings attributable to noncontrolling interests (11.0) (7.1) (7.1)
NET EARNINGS ATTRIBUTABLE TO SHAREHOLDERS $ 399.6 $ 393.9 $ 422.5
Earnings per Common Share—BasicNet Earnings attributable to shareholders $ 1.99 $ 2.32 $ 2.49
Earnings per Common Share—DilutedNet Earnings attributable to shareholders $ 1.99 $ 2.32 $ 2.49
Weighted Average Shares 200.6 170.0 170.0Dividends declared per Common Share $ 0.70
The accompanying notes are an integral part of these financial statements.
60
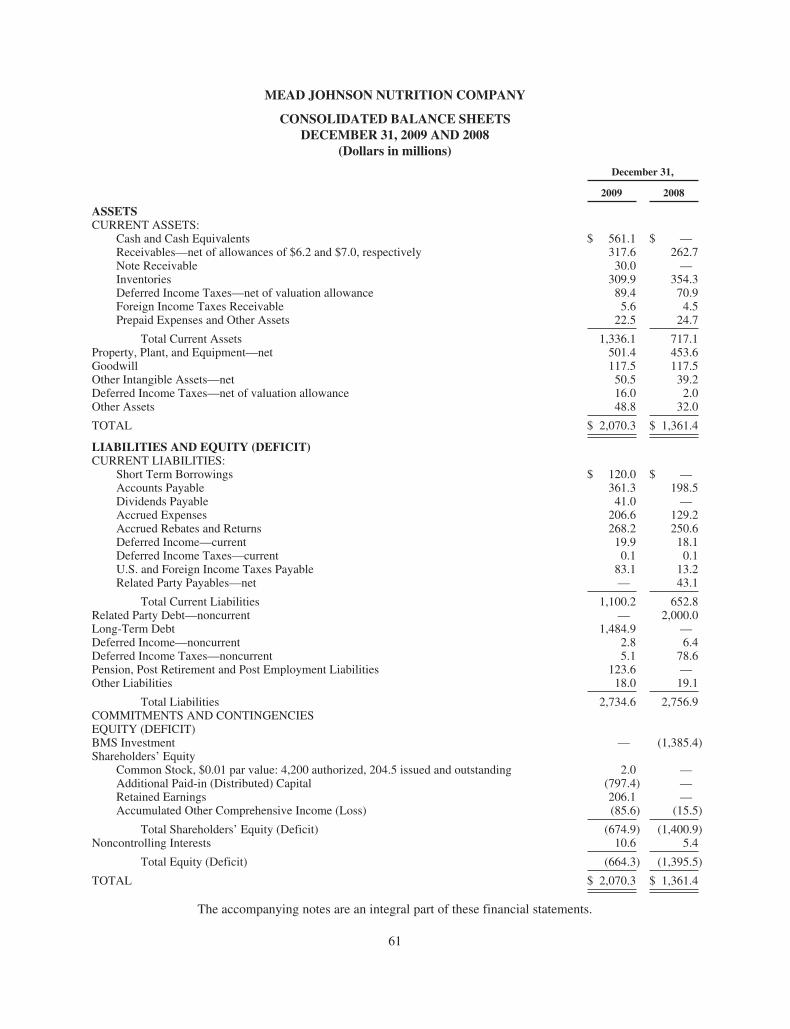
MEAD JOHNSON NUTRITION COMPANY
CONSOLIDATED BALANCE SHEETSDECEMBER 31, 2009 AND 2008
(Dollars in millions)
December 31,
2009 2008
ASSETSCURRENT ASSETS:
Cash and Cash Equivalents $ 561.1 $ —Receivables—net of allowances of $6.2 and $7.0, respectively 317.6 262.7Note Receivable 30.0 —Inventories 309.9 354.3Deferred Income Taxes—net of valuation allowance 89.4 70.9Foreign Income Taxes Receivable 5.6 4.5Prepaid Expenses and Other Assets 22.5 24.7
Total Current Assets 1,336.1 717.1Property, Plant, and Equipment—net 501.4 453.6Goodwill 117.5 117.5Other Intangible Assets—net 50.5 39.2Deferred Income Taxes—net of valuation allowance 16.0 2.0Other Assets 48.8 32.0
TOTAL $ 2,070.3 $ 1,361.4
LIABILITIES AND EQUITY (DEFICIT)CURRENT LIABILITIES:
Short Term Borrowings $ 120.0 $ —Accounts Payable 361.3 198.5Dividends Payable 41.0 —Accrued Expenses 206.6 129.2Accrued Rebates and Returns 268.2 250.6Deferred Income—current 19.9 18.1Deferred Income Taxes—current 0.1 0.1U.S. and Foreign Income Taxes Payable 83.1 13.2Related Party Payables—net — 43.1
Total Current Liabilities 1,100.2 652.8Related Party Debt—noncurrent — 2,000.0Long-Term Debt 1,484.9 —Deferred Income—noncurrent 2.8 6.4Deferred Income Taxes—noncurrent 5.1 78.6Pension, Post Retirement and Post Employment Liabilities 123.6 —Other Liabilities 18.0 19.1
Total Liabilities 2,734.6 2,756.9COMMITMENTS AND CONTINGENCIESEQUITY (DEFICIT)BMS Investment — (1,385.4)Shareholders’ Equity
Common Stock, $0.01 par value: 4,200 authorized, 204.5 issued and outstanding 2.0 —Additional Paid-in (Distributed) Capital (797.4) —Retained Earnings 206.1 —Accumulated Other Comprehensive Income (Loss) (85.6) (15.5)
Total Shareholders’ Equity (Deficit) (674.9) (1,400.9)Noncontrolling Interests 10.6 5.4
Total Equity (Deficit) (664.3) (1,395.5)
TOTAL $ 2,070.3 $ 1,361.4
The accompanying notes are an integral part of these financial statements.
61
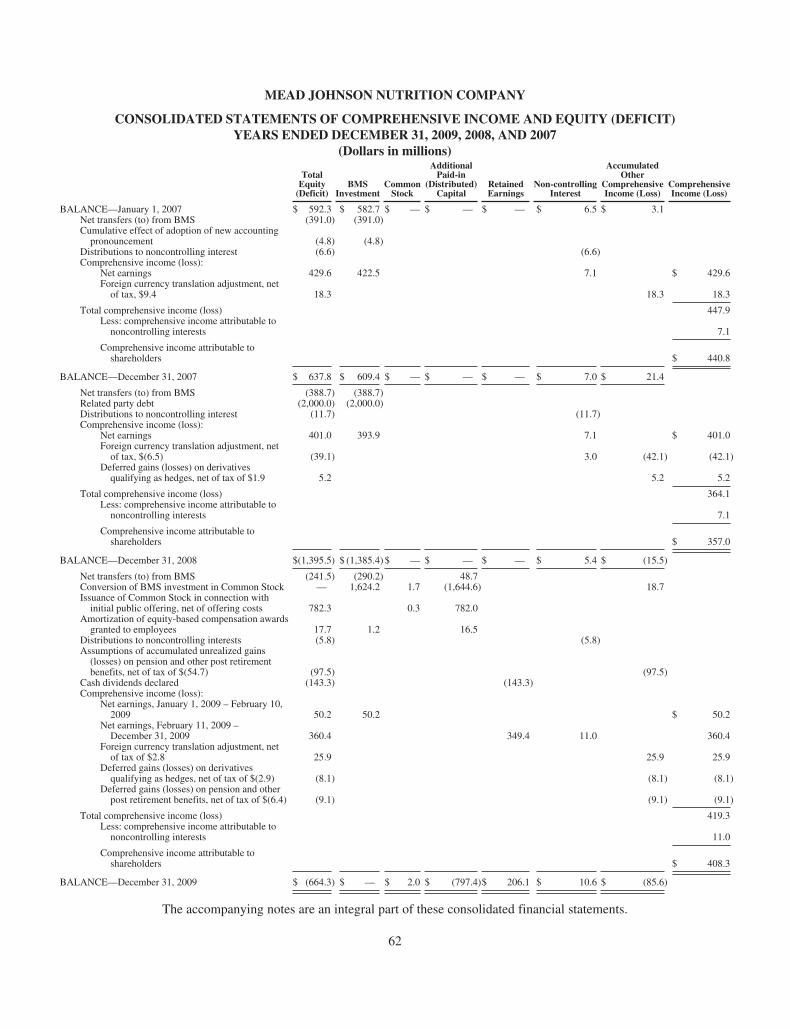
MEAD JOHNSON NUTRITION COMPANY
CONSOLIDATED STATEMENTS OF COMPREHENSIVE INCOME AND EQUITY (DEFICIT)YEARS ENDED DECEMBER 31, 2009, 2008, AND 2007
(Dollars in millions)
TotalEquity
(Deficit)BMS
InvestmentCommon
Stock
AdditionalPaid-in
(Distributed)Capital
RetainedEarnings
Non-controllingInterest
AccumulatedOther
ComprehensiveIncome (Loss)
ComprehensiveIncome (Loss)
BALANCE—January 1, 2007 $ 592.3 $ 582.7 $ — $ — $ — $ 6.5 $ 3.1Net transfers (to) from BMS (391.0) (391.0)Cumulative effect of adoption of new accounting
pronouncement (4.8) (4.8)Distributions to noncontrolling interest (6.6) (6.6)Comprehensive income (loss):
Net earnings 429.6 422.5 7.1 $ 429.6Foreign currency translation adjustment, net
of tax, $9.4 18.3 18.3 18.3
Total comprehensive income (loss) 447.9Less: comprehensive income attributable to
noncontrolling interests 7.1
Comprehensive income attributable toshareholders $ 440.8
BALANCE—December 31, 2007 $ 637.8 $ 609.4 $ — $ — $ — $ 7.0 $ 21.4
Net transfers (to) from BMS (388.7) (388.7)Related party debt (2,000.0) (2,000.0)Distributions to noncontrolling interest (11.7) (11.7)Comprehensive income (loss):
Net earnings 401.0 393.9 7.1 $ 401.0Foreign currency translation adjustment, net
of tax, $(6.5) (39.1) 3.0 (42.1) (42.1)Deferred gains (losses) on derivatives
qualifying as hedges, net of tax of $1.9 5.2 5.2 5.2
Total comprehensive income (loss) 364.1Less: comprehensive income attributable to
noncontrolling interests 7.1
Comprehensive income attributable toshareholders $ 357.0
BALANCE—December 31, 2008 $(1,395.5) $ (1,385.4) $ — $ — $ — $ 5.4 $ (15.5)
Net transfers (to) from BMS (241.5) (290.2) 48.7Conversion of BMS investment in Common Stock — 1,624.2 1.7 (1,644.6) 18.7Issuance of Common Stock in connection with
initial public offering, net of offering costs 782.3 0.3 782.0Amortization of equity-based compensation awards
granted to employees 17.7 1.2 16.5Distributions to noncontrolling interests (5.8) (5.8)Assumptions of accumulated unrealized gains
(losses) on pension and other post retirementbenefits, net of tax of $(54.7) (97.5) (97.5)
Cash dividends declared (143.3) (143.3)Comprehensive income (loss):
Net earnings, January 1, 2009 – February 10,2009 50.2 50.2 $ 50.2
Net earnings, February 11, 2009 –December 31, 2009 360.4 349.4 11.0 360.4
Foreign currency translation adjustment, netof tax of $2.8 25.9 25.9 25.9
Deferred gains (losses) on derivativesqualifying as hedges, net of tax of $(2.9) (8.1) (8.1) (8.1)
Deferred gains (losses) on pension and otherpost retirement benefits, net of tax of $(6.4) (9.1) (9.1) (9.1)
Total comprehensive income (loss) 419.3Less: comprehensive income attributable to
noncontrolling interests 11.0
Comprehensive income attributable toshareholders $ 408.3
BALANCE—December 31, 2009 $ (664.3) $ — $ 2.0 $ (797.4)$ 206.1 $ 10.6 $ (85.6)
The accompanying notes are an integral part of these consolidated financial statements.
62
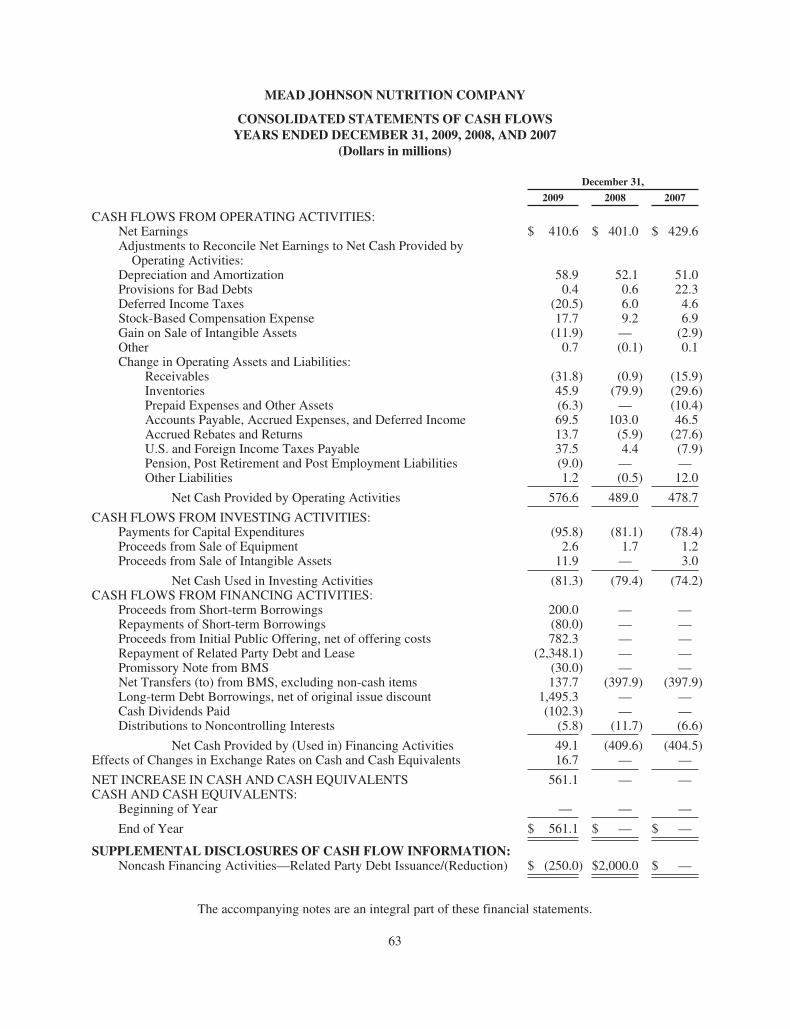
MEAD JOHNSON NUTRITION COMPANY
CONSOLIDATED STATEMENTS OF CASH FLOWSYEARS ENDED DECEMBER 31, 2009, 2008, AND 2007
(Dollars in millions)
December 31,
2009 2008 2007
CASH FLOWS FROM OPERATING ACTIVITIES:Net Earnings $ 410.6 $ 401.0 $ 429.6Adjustments to Reconcile Net Earnings to Net Cash Provided by
Operating Activities:Depreciation and Amortization 58.9 52.1 51.0Provisions for Bad Debts 0.4 0.6 22.3Deferred Income Taxes (20.5) 6.0 4.6Stock-Based Compensation Expense 17.7 9.2 6.9Gain on Sale of Intangible Assets (11.9) — (2.9)Other 0.7 (0.1) 0.1Change in Operating Assets and Liabilities:
Receivables (31.8) (0.9) (15.9)Inventories 45.9 (79.9) (29.6)Prepaid Expenses and Other Assets (6.3) — (10.4)Accounts Payable, Accrued Expenses, and Deferred Income 69.5 103.0 46.5Accrued Rebates and Returns 13.7 (5.9) (27.6)U.S. and Foreign Income Taxes Payable 37.5 4.4 (7.9)Pension, Post Retirement and Post Employment Liabilities (9.0) — —Other Liabilities 1.2 (0.5) 12.0
Net Cash Provided by Operating Activities 576.6 489.0 478.7
CASH FLOWS FROM INVESTING ACTIVITIES:Payments for Capital Expenditures (95.8) (81.1) (78.4)Proceeds from Sale of Equipment 2.6 1.7 1.2Proceeds from Sale of Intangible Assets 11.9 — 3.0
Net Cash Used in Investing Activities (81.3) (79.4) (74.2)CASH FLOWS FROM FINANCING ACTIVITIES:
Proceeds from Short-term Borrowings 200.0 — —Repayments of Short-term Borrowings (80.0) — —Proceeds from Initial Public Offering, net of offering costs 782.3 — —Repayment of Related Party Debt and Lease (2,348.1) — —Promissory Note from BMS (30.0) — —Net Transfers (to) from BMS, excluding non-cash items 137.7 (397.9) (397.9)Long-term Debt Borrowings, net of original issue discount 1,495.3 — —Cash Dividends Paid (102.3) — —Distributions to Noncontrolling Interests (5.8) (11.7) (6.6)
Net Cash Provided by (Used in) Financing Activities 49.1 (409.6) (404.5)Effects of Changes in Exchange Rates on Cash and Cash Equivalents 16.7 — —
NET INCREASE IN CASH AND CASH EQUIVALENTS 561.1 — —CASH AND CASH EQUIVALENTS:
Beginning of Year — — —
End of Year $ 561.1 $ — $ —
SUPPLEMENTAL DISCLOSURES OF CASH FLOW INFORMATION:Noncash Financing Activities—Related Party Debt Issuance/(Reduction) $ (250.0) $2,000.0 $ —
The accompanying notes are an integral part of these financial statements.
63
MEAD JOHNSON NUTRITION COMPANY
NOTES TO CONSOLIDATED FINANCIAL STATEMENTSAS OF DECEMBER 31, 2009 AND 2008 AND FOR THE YEARS ENDED
DECEMBER 31, 2009, 2008, AND 2007
1. ORGANIZATION
Mead Johnson Nutrition Company (MJN or the Company) manufactures, distributes and sells infant formulas,children’s nutrition and other nutritional products. MJN has a broad product portfolio, which extends acrossroutine and specialty infant formulas, children’s milks and milk modifiers, pediatric vitamins, dietarysupplements for pregnant and breastfeeding mothers, and products for metabolic disorders. These products aregenerally sold to wholesalers and retailers and are promoted to healthcare professionals, and, where permitted byregulation or policy, directly to consumers.
2. INITIAL PUBLIC OFFERING AND SEPARATION ACTIVITIES
MJN historically operated as a wholly owned subsidiary of Bristol-Myers Squibb Company (BMS). OnJanuary 31, 2009, BMS transferred to MJN the non-U.S. businesses of MJN through a sale of shares, sale ofassets and contributions of stock with some exceptions as described below. The consideration for these transferswas in the form of cash, which was contributed or otherwise provided by BMS, and the issuance by MJN’ssubsidiaries of foreign notes to BMS subsidiaries related to the purchase of assets or shares in Indonesia,Malaysia, the Netherlands and the Philippines. The terms of these foreign notes were substantially similar, exceptthat the principal amount of each note varied by jurisdiction. The aggregate principal amount of the foreign noteswas $597.0 million and the rate of interest per annum on each note was equal to LIBOR plus 0.75%.
Also on January 31, 2009, MJN entered into an employee matters agreement with BMS that included theallocation of assets and liabilities related to certain employee benefit, pension, welfare, compensation,employment, severance and termination-related matters.
On February 17, 2009, MJN completed the initial public offering (IPO) of 34.5 million shares of Class Acommon stock at a price of $24.00 per share. The net proceeds from the IPO, after deducting a total of$45.7 million of underwriting discounts, commissions and offering expenses, totaled $782.3 million. All of thenet proceeds of the IPO were paid to BMS and were used to (i) repay in full $597.0 million of the foreign notespayable to subsidiaries of BMS and (ii) satisfy payables and other obligations owing to one or more subsidiariesof BMS.
Immediately following the IPO, there were 76.8 million outstanding shares of Class A common stock and127.7 million outstanding shares of Class B common stock. The holders of Class A common stock and Class Bcommon stock generally had identical rights, except that holders of Class A common stock were entitled to onevote per share while holders of Class B common stock were entitled to 10 votes per share on all matters votedupon by stockholders (including the election and removal of directors). Of the Class A and Class B commonstock outstanding immediately following the IPO, BMS beneficially owned 42.3 million shares of Class Acommon stock and all of the Class B common stock. This represented 83.1% of the total outstanding shares ofcombined common stock, and 97.5% of the combined voting power. MJN sold 34.5 million shares of Class Acommon stock, or 16.9% of the total outstanding shares of combined common stock, to the public.
On November 15, 2009, BMS announced an exchange offer whereby BMS shareholders could exchange aportion of BMS common stock for MJN stock. Prior to the completion of the exchange offer, BMS converted allits MJN Class B common stock into MJN Class A common stock. The exchange offer was completed onDecember 23, 2009, resulting in the split-off of MJN and the disposal of BMS’s entire ownership and votinginterest in MJN.
64
Expensed transaction costs for the IPO recorded within selling, general, and administrative expense for the yearsended December 31, 2009 and 2008, were $31.0 million and $41.8 million, respectively.
3. ACCOUNTING POLICIES
Basis of Presentation—The financial statements present the results of operations, financial position, and cashflows of Mead Johnson Nutrition Company and its majority-owned and controlled subsidiaries. Intercompanytransactions and accounts are eliminated in consolidation. Prior to the IPO, the financial statements were derivedfrom the consolidated financial statements and records of BMS, principally from statements and recordsrepresenting the MJN business. The Company prepared the accompanying consolidated financial statements inaccordance with accounting principles generally accepted in the United States of America (GAAP).
Certain prior-year amounts have been reclassified to conform to the current-year presentation, including accruedinterest payable to BMS of $43.1 million as of December 31, 2008, that was reclassified from accrued expensesto related party payables-net.
Use of Estimates—The preparation of financial statements in conformity with GAAP requires the use ofestimates and assumptions that affect the reported amounts of assets and liabilities and disclosure of contingentassets and contingent liabilities at the date of the financial statements and the reported amounts of revenues andexpenses during the reporting period. The most significant assumptions are employed in estimates used indetermining values of sales rebate and return accruals, income tax assets, income tax liabilities, income taxexpense and legal liabilities, as well as in estimates used in applying the revenue recognition policy andaccounting for stock-based compensation costs and retirement and post retirement benefits (including theactuarial assumptions). Actual results may or may not differ from estimated results.
Revenue Recognition—MJN recognizes revenue when substantially all the risks and rewards of ownership havetransferred to the customer. Revenue is recognized on the date of receipt by the purchaser. Revenues are reducedat the time of recognition to reflect expected returns that are estimated based on historical experience andbusiness trends. Additionally, provisions are made at the time of revenue recognition for discounts, Women,Infants and Children (WIC) rebates and estimated sales allowances based on historical experience, updated forchanges in facts and circumstances, as appropriate. Such provisions are recorded as a reduction of revenue. TheCompany offers sales incentives to customers and consumers through various programs consisting primarily ofcustomer pricing allowances, merchandising funds and consumer coupons. The cost of these programs isrecognized as incurred and recorded as a reduction of revenue.
WIC rebate accruals were $199.9 million and $194.7 million at December 31, 2009 and 2008, respectively, andare included in accrued rebates and returns on the Company’s balance sheet. MJN participates on a competitivebidding basis in nutrition programs sponsored by states, tribal governments, the Commonwealth of Puerto Rico,and U.S. territories for WIC. Under these programs, MJN reimburses these entities for the difference betweenwholesaler list price and the contract price on eligible products. The Company accounts for WIC rebates byestablishing an accrual in an amount equal to the Company’s estimate of WIC rebate claims attributable to a sale.MJN determines its estimate of the WIC rebate accrual primarily based on historical experience regarding WICrebates and current contract prices under the WIC programs. The Company considers levels of inventory in thedistribution channel, new WIC contracts, terminated WIC contracts, changes in existing WIC contracts and WICparticipation, and adjusts the accrual periodically throughout the year to reflect actual expense. Rebates under theWIC program reduced revenues by $735.7 million, $796.0 million, and $847.8 million in the years endedDecember 31, 2009, 2008, and 2007, respectively.
Sales return accruals were $33.9 million and $29.3 million at December 31, 2009 and 2008, respectively, and areincluded in accrued rebates and returns on the Company’s balance sheet. The Company accounts for salesreturns by establishing an accrual in an amount equal to its estimate of sales recorded for which the related
65
products are expected to be returned. The Company determines its estimate of the sales return accrual primarilybased on historical experience regarding sales returns, but also considers other factors that could impact salesreturns such as new product introductions.
Income Taxes—The income tax provision prepared in the period following the IPO but preceding the split-offreflects a separate return methodology based on the actual legal entity structure as if the Company were aseparate taxpayer in the respective jurisdictions with certain accommodations pursuant to a tax matters agreementas noted below. This is in contrast to the pre-IPO period in which the income tax provision was prepared on aseparate return stand-alone methodology reflecting a hypothetical legal entity structure in which the Companywas included in the tax grouping of other BMS entities within the respective entity’s tax jurisdiction. The incometax provision prepared in the post split-off period reflects a separate return methodology based on the actual legalentity structure where we are a separate taxpayer in the respective jurisdictions.
The provision for income taxes has been determined using the asset and liability approach of accounting forincome taxes. Under this approach, deferred taxes represent the future tax consequences expected to occur whenthe reported amounts of assets and liabilities are recovered or paid. The provision for income taxes representsincome taxes paid or payable for the current year plus the change in deferred taxes during the year. Deferredtaxes result from differences between the financial and tax basis of the Company’s assets and liabilities. Deferredtax assets and liabilities are measured using the currently enacted tax rates that apply to taxable earnings in effectfor the years in which those tax attributes are expected to be recovered or paid, and are adjusted for changes intax rates and tax laws when changes are enacted.
Valuation allowances are recorded to reduce deferred tax assets when it is more likely than not that a tax benefitwill not be realized. The assessment of whether or not a valuation allowance is required often requires significantjudgment including the long-range forecast of future taxable earnings and the evaluation of tax planninginitiatives. Adjustments to the deferred tax valuation allowances are made to earnings in the period when suchassessments are made.
In the pre-IPO period, with the exception of Mead Johnson-dedicated entities, the Company did not maintaintaxes payable to or from BMS as the Company was deemed to settle the annual current tax balances immediatelywith the tax paying legal entities in the respective jurisdictions. These settlements were reflected as changes inequity (deficit).
On January 1, 2007, the Company adopted a new pronouncement for the accounting for uncertain tax provisionsresulting in the derecognition of $4.8 million of previously recognized tax benefits; this was accounted for as adecrease to equity.
Interest and penalties are classified as a component of provision for income taxes.
On February 10, 2009, MJN entered into a tax matters agreement with BMS. This agreement governs the taxrelationship between the Company and BMS for the tax periods through the December 23, 2009 split-off of theCompany from BMS. Under this agreement, responsibility is allocated between BMS and its subsidiaries, andMJN for the payment of taxes resulting from filing (i) tax returns on a combined, consolidated or unitary basisand (ii) single entity tax returns for entities that have both MJN and non-MJN operations. Accordingly, BMSprepares returns for MJN for all periods during which MJN is included in a combined, consolidated or unitarygroup with BMS or any of its subsidiaries for federal, state, local or foreign tax purposes, as if MJN itself werefiling as a combined, consolidated or unitary group. BMS also prepares returns for the Company for all periodsduring which a single-entity tax return is filed for an entity that has both MJN and non-MJN operations. MJNmakes payments to BMS and BMS makes payments to the Company with respect to such returns, as if suchreturns were actually required to be filed under the laws of the applicable taxing jurisdiction and BMS were therelevant taxing authority of such jurisdiction.
66
On December 18, 2009, the Company and BMS entered into an Amended and Restated Tax Matters Agreement.With respect to the period before the split-off, the Amended and Restated Tax Matters Agreement allocates theresponsibility of BMS and its subsidiaries, and MJN for the payment of taxes in the same manner as discussedabove with respect to the tax matters agreement. Pursuant to the Amended and Restated Tax Matters Agreement,the Company has consented to join BMS in electing to allocate items ratably between the portion of the taxableyear in which the Company was included in the BMS consolidated tax group, and the short period beginningafter the split-off and ending December 31, 2009 when the Company is a separate taxpayer. Additionally underthe Amended and Restated Tax Matters Agreement, BMS has agreed to indemnify the Company for (i) any taxattributable to a Mead Johnson legal entity for any taxable period ending on or before December 31, 2008,(ii) any tax arising solely as a result of the IPO and the restructuring which preceded the IPO, and (iii) anytransaction tax associated with the split-off transaction. The Company has agreed to indemnify BMS for (i) anytax payable with respect to any separate return that the Company is required to file or cause to be filed, (ii) anytax incurred as a result of any gain which may be recognized by a member of the BMS affiliated group withrespect to a transfer of certain foreign affiliates by the Company in preparation for the IPO, and (iii) any taxarising from the failure or breach of any representation or covenant made by the Company which failure orbreach results in the intended tax consequences of the split-off transaction not being achieved. The Companyrecorded as an equity contribution certain deferred tax assets received from BMS as a result of the split-off.
As of December 31, 2009, based upon the terms of the tax matters agreement discussed above, the Companyholds a net payable of $12.0 million to BMS. This payable is recorded in U.S. and foreign income taxes payableon the Company’s balance sheet. Effective with the split-off of the Company from BMS, the Company no longeris included in BMS’ consolidated tax return.
Cash and Cash Equivalents—Cash and cash equivalents consist of bank deposits, time deposits and moneymarket funds. Cash equivalents are primarily highly liquid investments with original maturities of three monthsor less at the time of purchase and are recorded at cost, which approximates fair value. The Company maintainscash and cash equivalent balances in U.S. dollars and foreign currencies which are subject to currency rate risk.
Inventory Valuation—Inventories are stated at average cost, not in excess of market.
Capital Assets and Depreciation—Expenditures for additions and improvements are capitalized at cost.Depreciation is generally computed on a straight-line method based on the estimated useful lives of the relatedassets. The estimated useful lives of the major classes of depreciable assets are 50 years for buildings and 3 to 40years for machinery, equipment, and fixtures. Maintenance and repair costs are expensed as incurred.
Impairment of Long-Lived Assets—The Company periodically evaluates whether current facts orcircumstances indicate that the carrying value of its depreciable assets to be held and used may not berecoverable. If such circumstances are determined to exist, an estimate of undiscounted future cash flowsproduced by the long-lived asset, or the appropriate grouping of assets, is compared to the carrying value todetermine whether impairment exists. If an asset is determined to be impaired, the loss is measured based on thedifference between the asset’s fair value and its carrying value. An estimate of the asset’s fair value is based onquoted market prices in active markets, if available. If quoted market prices are not available, the estimate of fairvalue is based on various valuation techniques, including a discounted value of estimated future cash flows. TheCompany reports an asset to be disposed of at the lower of its carrying value or its estimated net realizable value.
Capitalized Software—Certain costs to obtain internal use software for significant systems projects arecapitalized and amortized over the estimated useful life of the software, which ranges from 3 to 7 years. Costs toobtain software for projects that are not significant are expensed as incurred.
Goodwill—Goodwill is tested for impairment using a two-step process on an annual basis or when current factsor circumstances indicate that a potential impairment may exist. The first step is to identify a potentialimpairment, and the second step measures the amount of the impairment loss, if any. Goodwill is deemed to beimpaired if the carrying amount of a reporting unit’s goodwill exceeds its estimated fair value. The Company
67
completes its annual goodwill impairment assessment during the first quarter and monitors for any potentialimpairment in the remaining quarters, neither of which indicated an impairment of goodwill in 2009, 2008 or2007.
Contingencies—In the normal course of business, the Company is subject to loss contingencies, such as legalproceedings and claims arising out of its business, that cover a wide range of matters, including, among others,government investigations, product and/or environmental, health, and safety liabilities, and tax matters. TheCompany records accruals for such loss contingencies when it is probable that a liability will be incurred and theamount of loss can be reasonably estimated. The Company does not recognize gain contingencies until realized.For a discussion of contingencies, see Note 7 on “Income Taxes” and Note 20 on “Contingencies.”
Derivative Financial Instruments—Derivative financial instruments are used by the Company principally inthe management of its interest rate and foreign currency exposures. The Company does not hold or issuederivative financial instruments for speculative purposes.
The Company records all derivative instruments on the balance sheet at fair value. If the derivative is designatedas a fair value hedge, both the changes in the fair value of the derivative and of the hedged item attributable tothe hedged risk are recognized in the consolidated statements of earnings; cash flows are classified consistentwith the underlying hedged item. If the derivative is designated as a cash flow hedge, the effective portions ofchanges in the fair value of the derivative are recorded in accumulated other comprehensive income (loss) andare subsequently recognized in the consolidated statements of earnings when the hedged item affects earnings;cash flows are classified consistent with the underlying hedged item. For purchased foreign currency options, theentire change in fair value is included in the measurement of hedge effectiveness for cash flow hedges.Ineffective portions of changes in the fair value of cash flow hedges, if any, are recognized as a charge or creditto earnings. If the specific hedge criteria are not met, changes in a derivative’s fair value are recognized inearnings.
The Company designates and assigns derivatives as hedges of forecasted transactions, specific assets or specificliabilities. When hedged assets or liabilities are sold or extinguished or the forecasted transactions being hedgedare no longer expected to occur, the Company immediately recognizes the gain or loss on the designated hedgingfinancial instruments in the consolidated statements of earnings.
Pension and Other Post Retirement Benefits—The funded status of the Company’s defined pension and postretirement benefits is measured as the difference between the fair value of plan assets and the benefit obligation.For the defined benefit plans, the benefit obligation is the projected benefit obligation; for any other definedbenefit post retirement plan, the benefit obligation is the accumulated post retirement benefit obligation. The netover- or under-funded status is recognized as an asset or a liability on the balance sheet. Any unrecognizedactuarial gain or loss, or service cost or benefit is reported as a component of the accumulated othercomprehensive income in equity.
Shipping and Handling Costs—The Company typically does not charge customers for shipping and handlingcosts. Shipping and handling costs, including warehousing expenses, were $68.5 million, $82.9 million, and$76.2 million in the years ended December 31, 2009, 2008, and 2007, respectively, and are included in selling,general and administrative expenses.
Advertising Costs—Advertising costs are expensed as incurred and were $136.9 million, $115.3 million, and$92.9 million in the years ended December 31, 2009, 2008, and 2007, respectively.
Research and Development—Research and development costs are expensed as incurred.
Foreign Currency Translation—The statements of earnings of the Company’s foreign subsidiaries aretranslated into U.S. dollars using average exchange rates for the period. The net assets of the Company’s foreignsubsidiaries are translated into U.S. dollars using exchange rates as of the balance sheet date. The U.S. dollareffects that arise from translating the net assets of these subsidiaries at changing rates are recorded in the foreigncurrency translation adjustment account, which is included in accumulated other comprehensive income (loss).
68
Recently Issued Accounting Standards—In June 2009, the Financial Accounting Standards Board (FASB)issued the FASB Accounting Standards Codification and the Hierarchy of GAAP (Codification). TheCodification is the single official source of authoritative U.S. accounting and reporting standards applicable forall nongovernmental entities, with the exception of guidance issued by the Securities and Exchange Commission.The Codification did not change GAAP, but organized it into an online research system sorted by individualaccounting topics, which are further divided into subtopics. The FASB now issues new standards in the form ofAccounting Standards Updates (ASC). The Codification is effective for financial statements issued for periodsending after September 15, 2009. The adoption of the Codification did not have a material impact on theCompany’s financial statements.
Effective January 1, 2009, the Company retrospectively adopted ASC No. 810, Consolidation. ASC No. 810requires the ownership interests in subsidiaries held by parties other than the parent be clearly identified, labeledand presented in the consolidated statement of financial position within equity, but separate from the parent’sequity. This topic also requires the amount of consolidated net earnings attributable to the parent and to thenoncontrolling interest be clearly identified and presented on the face of the consolidated statement of earnings.Changes in a parent’s ownership interest while the parent retains its controlling financial interest in its subsidiarymust be accounted for consistently, and when a subsidiary is deconsolidated, any retained noncontrolling equityinvestment in the former subsidiary must be initially measured at fair value. This topic also requires entities toprovide sufficient disclosures that clearly identify and distinguish between the interests of the parent and theinterests of the noncontrolling owners.
Effective January 1, 2009, the Company adopted ASC No. 815-10-65-1, Derivatives and Hedging, requiring thatobjectives for using derivative instruments be disclosed in terms of underlying risk and accounting designation.The fair value of derivative instruments and their gains and losses are presented in tabular format in order topresent a more complete picture of the effects of using derivative instruments.
Effective June 30, 2009, the Company adopted ASC No. 855, Subsequent Events. ASC No. 855 includesguidance for the accounting and disclosure of events that happen after the date of the balance sheet but before therelease of the financial statements. The adoption of this topic did not have a material effect on the Company’sconsolidated financial statements. In February 2010, the FASB issued Accounting Standards Update No. 2010-09, Subsequent Events (Topic 855): Amendments to Certain Recognition and Disclosure Requirements. TheCompany adopted the amendments upon issuance with no material impact on the consolidated financialstatements.
4. ACTIVITIES WITH FORMER PARENT, BMS
MJN entered into transactions with BMS and its subsidiaries for the sale of inventory and services provided toand received from BMS pharmaceutical divisions in various markets worldwide, as well as corporate servicesprovided by BMS for the financial statement periods presented. Product transfers from BMS to MJN were madeat various transfer prices. For the year ended December 31, 2009, MJN had sales to BMS of $84.2 million. Therewere no sales to BMS in 2008 and 2007. Purchases of goods from BMS and its subsidiaries were $13.6 million,$27.0 million, and $23.2 million for the years ended December 31, 2009, 2008, and 2007, respectively.
Prior to the IPO, the Company was allocated costs for various services from BMS. Management considers suchallocations have been made on a reasonable basis, but may not, however, reflect the expense MJN would haveincurred as a stand-alone company.
On January 31, 2009, MJN entered into a transition services agreement (TSA) with BMS whereby BMS agreed toprovide MJN with various corporate support services (the BMS Services) and MJN agreed to provide BMS withcertain services (the MJN Services). The TSA was amended and restated on December 18, 2009. The BMS Servicesand the MJN Services will continue for a specified initial term, which will vary with the types of services to beprovided, unless earlier terminated or extended according to the terms of the TSA, none of which extend beyondDecember 31, 2011. MJN will pay BMS mutually agreed-upon fees for the BMS Services and BMS will pay MJN
69
mutually agreed-upon fees for the MJN Services. The statement of earnings for the year ended December 31, 2009,includes expenses related to the TSA. Total net costs for the year ended December 31, 2009, were $58.3 million.For the years ended December 31, 2008, and 2007, total net costs to MJN were $112.1 million and $90.1 million,respectively, as allocated from BMS based on either the ratio of MJN’s annual net sales or headcount to BMS’comparable consolidated net sales or headcount. Additionally, MJN allocated charges of $19.6 and $21.6 million forthe years ended December 31, 2008 and 2007, respectively to BMS in various markets worldwide, and wasallocated charges of $20.2 million and $18.4 million for the years ended December 31, 2008 and 2007 respectively,from BMS.
On August 26, 2008, MJN declared and issued a dividend in the form of a 10-year intercompany note to BMS inthe amount of $2.0 billion, which was recorded as a reduction of equity. The note had an annual interest rate of6.1% with interest payments settled no less than annually.
On February 17, 2009, this note payable was amended and restructured into three separate notes in the amountsof $744.2 million, $500.0 million and $500.0 million. In November 2009, the Company repaid these notes toBMS in full. See Note 13 for discussion on the Company’s short-term borrowings and long-term debt.
During the years ended December 31, 2009 and 2008, interest expense on the notes with BMS was $87.4 million and$43.1 million, respectively. For the year ended December 31, 2009, cash interest paid to BMS was $130.5 million.
On January 31, 2009, Mead Johnson Nutricionales de Mexico, S. De R.L. de C.V., a subsidiary of MJN, enteredinto an agreement with BMS to lease all of the property, plant and equipment assets at the manufacturing facilityin Delicias, Mexico, for 20 years. The lease qualified as a capital lease, and is included in the Company’sfinancial statements for all periods. As part of the split from BMS, MJN purchased these assets for $48.7 millionplus the applicable taxes in December 2009, and the lease was terminated. The liability related to this purchase isincluded in accounts payable and was paid in full in January 2010.
On December 15, 2009, the China services agreement with BMS was terminated and the 89% ownership interestof Mead Nutritionals (China) Ltd. was transferred from BMS to MJN.
With the exception of the net proceeds from the IPO and the split from BMS, the impact of the separationactivities and IPO, as described above, on equity are captured in net transfers (to) from BMS on the consolidatedstatements of comprehensive income and equity (deficit). The components of net transfers (to) from BMS on theconsolidated statements of comprehensive income and equity (deficit) and the related cash flows for the yearended December 31, 2009, were as follows:
(In millions)
Statement of ComprehensiveIncome and Equity (Deficit) –
Changes in EquityStatement of Cash Flows –
Financing Activities
Establishment of foreign notes/repayment of related partydebt to BMS $ (597.0) $ (597.0)
Repayment of related party notes payable (1,751.1)
$ (2,348.1)
Promissory note from BMS $ (30.0)
Cash contribution by BMS 316.0 $ 316.0Debt reduction 250.0Establishment/settlement of related party payable (166.8) (166.8)Mexico asset purchase (48.7)Other activity 5.0 (11.5)
Net transfers (to) from BMS $ (241.5) $ 137.7
70
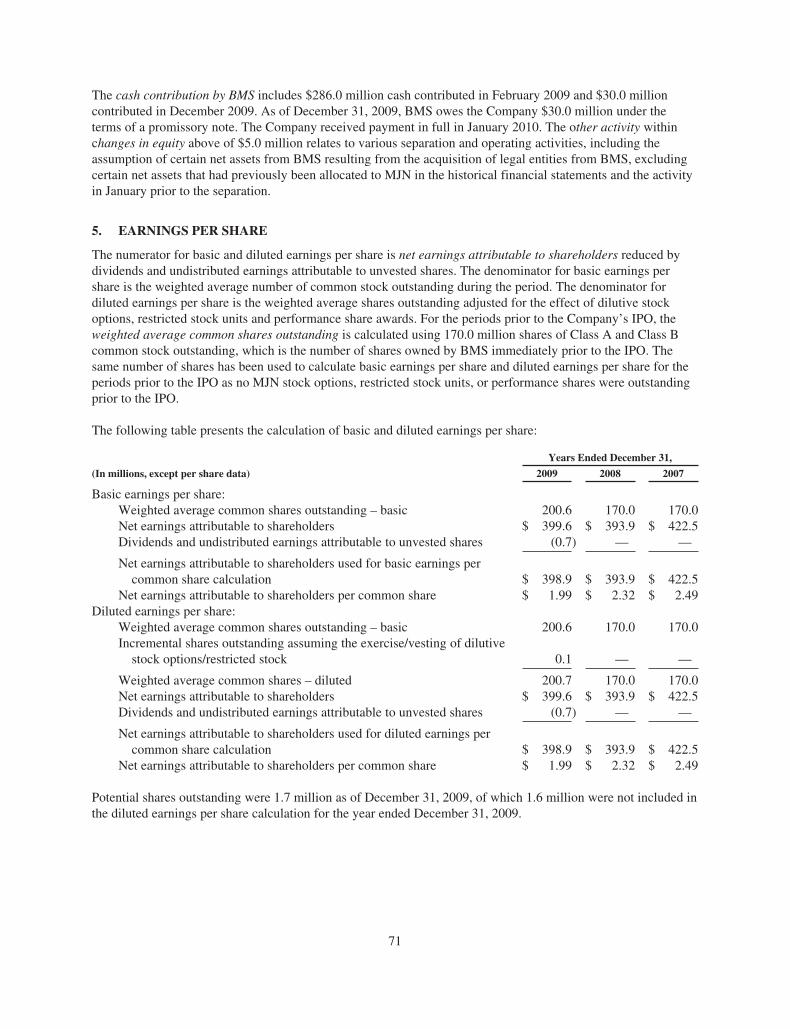
The cash contribution by BMS includes $286.0 million cash contributed in February 2009 and $30.0 millioncontributed in December 2009. As of December 31, 2009, BMS owes the Company $30.0 million under theterms of a promissory note. The Company received payment in full in January 2010. The other activity withinchanges in equity above of $5.0 million relates to various separation and operating activities, including theassumption of certain net assets from BMS resulting from the acquisition of legal entities from BMS, excludingcertain net assets that had previously been allocated to MJN in the historical financial statements and the activityin January prior to the separation.
5. EARNINGS PER SHARE
The numerator for basic and diluted earnings per share is net earnings attributable to shareholders reduced bydividends and undistributed earnings attributable to unvested shares. The denominator for basic earnings pershare is the weighted average number of common stock outstanding during the period. The denominator fordiluted earnings per share is the weighted average shares outstanding adjusted for the effect of dilutive stockoptions, restricted stock units and performance share awards. For the periods prior to the Company’s IPO, theweighted average common shares outstanding is calculated using 170.0 million shares of Class A and Class Bcommon stock outstanding, which is the number of shares owned by BMS immediately prior to the IPO. Thesame number of shares has been used to calculate basic earnings per share and diluted earnings per share for theperiods prior to the IPO as no MJN stock options, restricted stock units, or performance shares were outstandingprior to the IPO.
The following table presents the calculation of basic and diluted earnings per share:
Years Ended December 31,
(In millions, except per share data) 2009 2008 2007
Basic earnings per share:Weighted average common shares outstanding – basic 200.6 170.0 170.0Net earnings attributable to shareholders $ 399.6 $ 393.9 $ 422.5Dividends and undistributed earnings attributable to unvested shares (0.7) — —
Net earnings attributable to shareholders used for basic earnings percommon share calculation $ 398.9 $ 393.9 $ 422.5
Net earnings attributable to shareholders per common share $ 1.99 $ 2.32 $ 2.49Diluted earnings per share:
Weighted average common shares outstanding – basic 200.6 170.0 170.0Incremental shares outstanding assuming the exercise/vesting of dilutive
stock options/restricted stock 0.1 — —
Weighted average common shares – diluted 200.7 170.0 170.0Net earnings attributable to shareholders $ 399.6 $ 393.9 $ 422.5Dividends and undistributed earnings attributable to unvested shares (0.7) — —
Net earnings attributable to shareholders used for diluted earnings percommon share calculation $ 398.9 $ 393.9 $ 422.5
Net earnings attributable to shareholders per common share $ 1.99 $ 2.32 $ 2.49
Potential shares outstanding were 1.7 million as of December 31, 2009, of which 1.6 million were not included inthe diluted earnings per share calculation for the year ended December 31, 2009.
71
6. OTHER EXPENSES—NET
The components of other expenses—net were:
Years Ended December 31,
(In millions) 2009 2008 2007
Loss from third-party contract manufacturing $ 7.7 $ 6.0 $ 0.9Foreign exchange transaction losses 11.4 1.8 4.3Gain on sale of non-strategic intangible asset (11.9) — (2.9)Severance and related costs 25.3 — —Other—net 0.6 5.3 1.3
Other expenses—net $ 33.1 $ 13.1 $ 3.6
7. INCOME TAXES
The Company operates under a new legal entity structure created to facilitate the IPO. As such, adjustments havebeen made to the income tax accounts and equity (deficit) during the year ended December 31, 2009, to reflectthe impact of this restructuring.
In the pre-IPO period, with the exception of Mead Johnson-dedicated entities, we did not maintain taxes payableto or from BMS as we were deemed to settle the annual current tax balances immediately with the tax payinglegal entities in the respective jurisdictions. These settlements were reflected as changes in equity (deficit).
On February 10, 2009, the Company entered into a tax matters agreement with BMS. This agreement governs thetax relationship between the Company and BMS for the tax periods through the December 23, 2009, split-off ofthe Company from BMS. Under this agreement responsibility is allocated between BMS and its subsidiaries, andMJN for the payment of taxes resulting from filing (i) tax returns on a combined, consolidated or unitary basisand (ii) single entity tax returns for entities that have both MJN and non-MJN operations. Accordingly, BMSprepares returns for MJN for all periods during which MJN is included in a combined, consolidated or unitarygroup with BMS or any of its subsidiaries for federal, state, local or foreign tax purposes, as if MJN itself werefiling as a combined, consolidated or unitary group. BMS also prepares returns for the Company for all periodsduring which a single-entity tax return is filed for an entity that has both MJN and non-MJN operations. MJNmakes payments to BMS and BMS makes payments to the Company with respect to such returns, as if suchreturns were actually required to be filed under the laws of the applicable taxing jurisdiction and BMS were therelevant taxing authority of such jurisdiction. As of December 31, 2009, based upon the terms of the tax mattersagreement discussed above, the Company holds a net payable of $12.0 million to BMS. This payable is recordedin U.S. and foreign income taxes payable on the Company’s balance sheet. Effective with the split-off of theCompany from BMS, the Company no longer is included in BMS’ consolidated tax return.
On December 18, 2009, the Company and BMS entered into an Amended and Restated Tax Matters Agreement inanticipation of the split-off from BMS. With respect to the period before the split-off, the Amended and RestatedTax Matters Agreement allocates the responsibility of BMS and its subsidiaries, and MJN for the payment of taxesin the same manner as discussed above with respect to the tax matters agreement. Pursuant to the Amended andRestated Tax Matters Agreement, the Company has consented to join BMS in electing to allocate items ratablybetween the portion of the taxable year in which the Company was included in the BMS consolidated tax group, andthe short period beginning after the split off and ending on December 31, 2009, when the Company is a separatetaxpayer. Additionally under the Amended and Restated Tax Matters Agreement, BMS has agreed to indemnify theCompany for (i) any tax attributable to a Mead Johnson legal entity for any taxable period ending on or beforeDecember 31, 2008, (ii) any tax arising solely as a result of the IPO and the restructuring preceding the IPO, and(iii) any transaction tax associated with the split-off transaction. The Company has agreed to indemnify BMS for(i) any tax payable with respect to any separate return that the Company is required to file or cause to be filed,(ii) any tax incurred as a result of any gain which may be recognized by a member of the BMS affiliated group withrespect to a transfer of certain foreign affiliates by the Company in preparation for the IPO, and (iii) any tax arising
72
from the failure or breach of any representation or covenant made by the Company which failure or breach results inthe intended tax consequences of the split-off transaction not being achieved.
The components of earnings before income taxes were:
Years Ended December 31,
(In millions) 2009 2008 2007
U.S. $ 134.0 $ 154.7 $ 306.8Non-U.S. 453.0 497.7 356.4
$ 587.0 $ 652.4 $ 663.2
The above amounts are categorized based on the location of the taxing authorities.
The provision (benefit) for income taxes attributable to operations consisted of:
Years Ended December 31,
(In millions) 2009 2008 2007
Current:U.S. federal $ 79.2 $ 102.6 $ 106.2U.S. states 13.5 18.1 19.1Non-U.S. 104.2 124.7 103.7
196.9 245.4 229.0
Deferred:U.S. federal (12.2) 1.2 7.7U.S. states (0.9) — 1.4Non-U.S. (7.4) 4.8 (4.5)
(20.5) 6.0 4.6
$ 176.4 $ 251.4 $ 233.6
Effective Tax Rate—MJN’s provision for income taxes in the years ended December 31, 2009, 2008 and 2007was different from the amount computed by applying the statutory U.S. federal income tax rate to earningsbefore income taxes as a result of the following:
(Dollars in millions) 2009 2008 2007
U.S. statutory rate $ 205.4 35.0% $ 228.3 35.0% $ 232.1 35.0%State and local taxes 8.9 1.5 10.8 1.7 13.3 2.0Foreign income taxed at different rates (49.9) (8.5) (23.3) (3.6) (20.6) (3.1)Repatriation of foreign income 29.3 5.0 37.4 5.7 24.5 3.7Tax holidays (21.5) (3.7) (4.5) (0.7) (3.5) (0.5)Disallowed transaction cost 4.0 0.7 8.8 1.4 — —U.S. manufacturing deduction (4.3) (0.7) (3.7) (0.6) (4.5) (0.7)Other 4.5 0.8 (2.4) (0.4) (7.7) (1.2)
Total provision / effective tax rate $ 176.4 30.1% $ 251.4 38.5% $ 233.6 35.2%
The effective tax rate for the year ended December 31, 2009, decreased to 30.1% from 38.5% compared to theyear ended December 31, 2008. The decrease in the effective tax rate was driven primarily by the Company’snew legal entity structure to facilitate the IPO, one-time restructuring benefits, and earnings mix.
The Company has negotiated a tax holiday effective from January 1, 2010, under which certain profits in theNetherlands are exempt from taxation through the year ending December 31, 2019; this agreement succeeds aprior agreement which expired on December 31, 2009.
73
Deferred Taxes and Valuation Allowance—The components of current and noncurrent deferred income taxassets (liabilities) were:
December 31,
(In millions) 2009 2008
Accrued rebates and returns $ 38.7 $ 38.2Intercompany profit and other inventory items 21.8 18.1Accruals 22.2 13.7Net operating loss carryforwards 1.6 16.8Pension, post retirement and post employment benefits 43.1 7.9Deferred income 1.8 2.9Stock options 8.0 8.1Provisions for bad debts 0.2 0.2Others—net 8.0 3.2
Total deferred tax assets 145.4 109.1
Depreciation/amortization (38.2) (49.3)Outside basis (7.0) (49.0)
Total deferred tax liabilities (45.2) (98.3)
Valuation allowance — (16.6)
Deferred tax assets (liabilities)—net $ 100.2 $ (5.8)
Recognized as:Deferred income taxes—current—net $ 89.3 $ 70.8Deferred income taxes—noncurrent—net 10.9 (76.6)
Total $ 100.2 $ (5.8)
As of December 31, 2009, the Company had gross foreign net operating loss (NOL) carryforwards of $7.2 million.These NOL carryforwards will begin to expire in 2014. The valuation allowance increased (decreased) by$(16.6) million, $(1.6) million, and $8.0 million in the years ended December 31, 2009, 2008 and 2007,respectively. In the years ended December 31, 2008 and 2007, the valuation allowance relates to foreign NOLcarryforwards that are not expected to be realized because they are based upon a hypothetical stand-alone carve-outstructure that does not exist after restructuring for the IPO. In the year ended December 31, 2009, the valuationallowance relates to foreign NOL carryforwards incurred in the post-IPO period that are not more likely than not tobe realized.
Current and noncurrent deferred income tax assets (liabilities) totaled $100.2 million and $(5.8) million as ofDecember 31, 2009 and 2008, respectively. The change in the balance between periods includes the impact of therestructuring undertaken to facilitate the IPO, which has been recorded as an adjustment to equity.
Income taxes paid were $167.1 million, $227.8 million, and $228.0 million in the years ended December 31, 2009,2008, and 2007, respectively. The income taxes were paid pursuant to the terms of the tax matters agreement andtaxes paid to federal, state and foreign taxing authorities, as well as taxes deemed paid to BMS prior to the date ofthe IPO.
Cumulative translation adjustments on foreign subsidiaries with a functional currency other than U.S. dollarresulted in deferred tax liabilities of $0.7 million and $16.6 million at December 31, 2009 and 2008, respectively.For the year ended December 31, 2008, further basis differences arose due to the qualification of repatriatedearnings as return of capital for tax purposes.
74
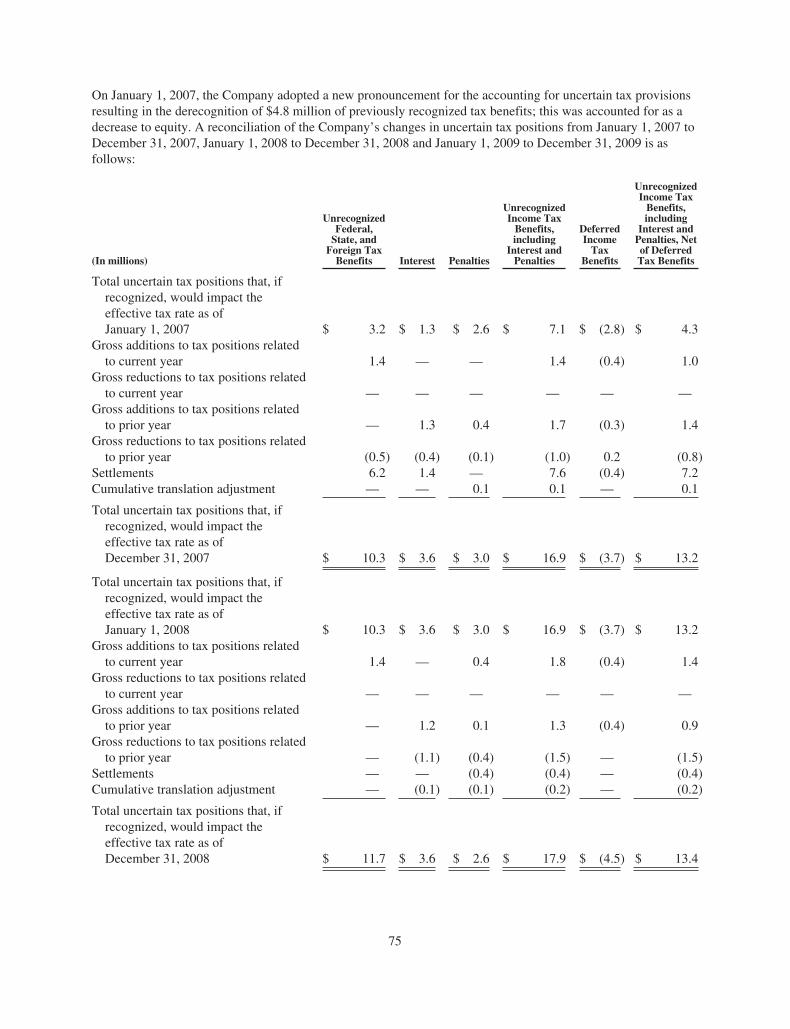
On January 1, 2007, the Company adopted a new pronouncement for the accounting for uncertain tax provisionsresulting in the derecognition of $4.8 million of previously recognized tax benefits; this was accounted for as adecrease to equity. A reconciliation of the Company’s changes in uncertain tax positions from January 1, 2007 toDecember 31, 2007, January 1, 2008 to December 31, 2008 and January 1, 2009 to December 31, 2009 is asfollows:
(In millions)
UnrecognizedFederal,
State, andForeign Tax
Benefits Interest Penalties
UnrecognizedIncome Tax
Benefits,including
Interest andPenalties
DeferredIncome
TaxBenefits
UnrecognizedIncome Tax
Benefits,including
Interest andPenalties, Netof DeferredTax Benefits
Total uncertain tax positions that, ifrecognized, would impact theeffective tax rate as ofJanuary 1, 2007 $ 3.2 $ 1.3 $ 2.6 $ 7.1 $ (2.8) $ 4.3
Gross additions to tax positions relatedto current year 1.4 — — 1.4 (0.4) 1.0
Gross reductions to tax positions relatedto current year — — — — — —
Gross additions to tax positions relatedto prior year — 1.3 0.4 1.7 (0.3) 1.4
Gross reductions to tax positions relatedto prior year (0.5) (0.4) (0.1) (1.0) 0.2 (0.8)
Settlements 6.2 1.4 — 7.6 (0.4) 7.2Cumulative translation adjustment — — 0.1 0.1 — 0.1
Total uncertain tax positions that, ifrecognized, would impact theeffective tax rate as ofDecember 31, 2007 $ 10.3 $ 3.6 $ 3.0 $ 16.9 $ (3.7) $ 13.2
Total uncertain tax positions that, ifrecognized, would impact theeffective tax rate as ofJanuary 1, 2008 $ 10.3 $ 3.6 $ 3.0 $ 16.9 $ (3.7) $ 13.2
Gross additions to tax positions relatedto current year 1.4 — 0.4 1.8 (0.4) 1.4
Gross reductions to tax positions relatedto current year — — — — — —
Gross additions to tax positions relatedto prior year — 1.2 0.1 1.3 (0.4) 0.9
Gross reductions to tax positions relatedto prior year — (1.1) (0.4) (1.5) — (1.5)
Settlements — — (0.4) (0.4) — (0.4)Cumulative translation adjustment — (0.1) (0.1) (0.2) — (0.2)
Total uncertain tax positions that, ifrecognized, would impact theeffective tax rate as ofDecember 31, 2008 $ 11.7 $ 3.6 $ 2.6 $ 17.9 $ (4.5) $ 13.4
75
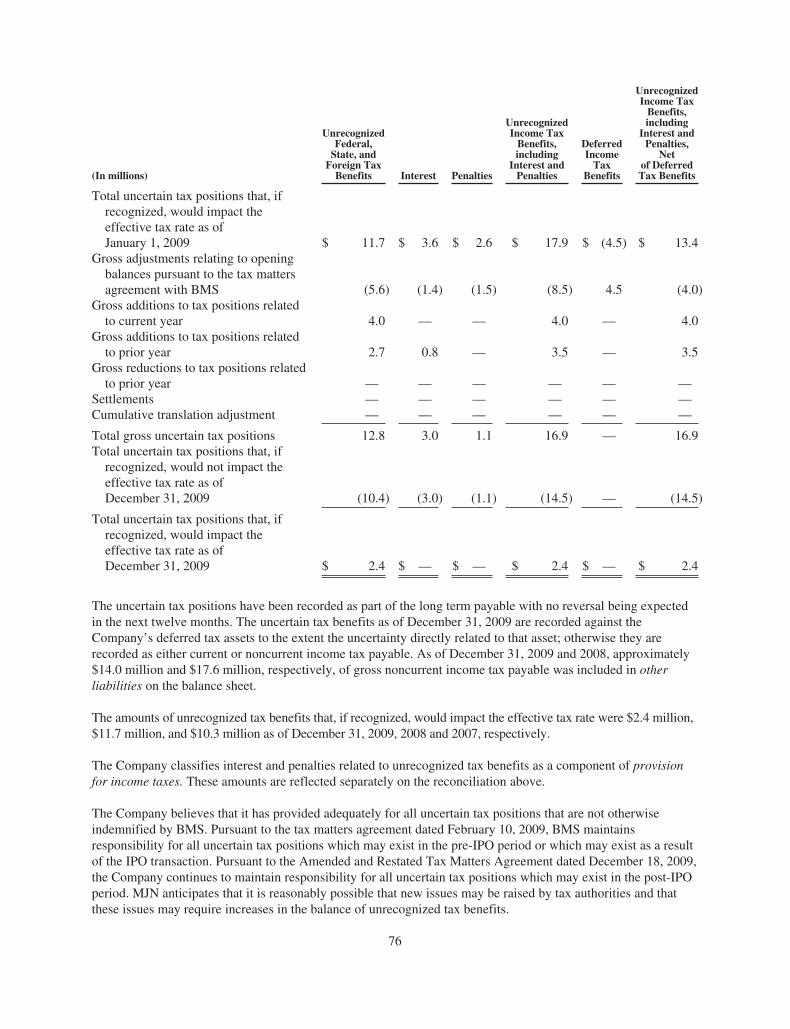
(In millions)
UnrecognizedFederal,
State, andForeign Tax
Benefits Interest Penalties
UnrecognizedIncome Tax
Benefits,including
Interest andPenalties
DeferredIncome
TaxBenefits
UnrecognizedIncome Tax
Benefits,including
Interest andPenalties,
Netof DeferredTax Benefits
Total uncertain tax positions that, ifrecognized, would impact theeffective tax rate as ofJanuary 1, 2009 $ 11.7 $ 3.6 $ 2.6 $ 17.9 $ (4.5) $ 13.4
Gross adjustments relating to openingbalances pursuant to the tax mattersagreement with BMS (5.6) (1.4) (1.5) (8.5) 4.5 (4.0)
Gross additions to tax positions relatedto current year 4.0 — — 4.0 — 4.0
Gross additions to tax positions relatedto prior year 2.7 0.8 — 3.5 — 3.5
Gross reductions to tax positions relatedto prior year — — — — — —
Settlements — — — — — —Cumulative translation adjustment — — — — — —
Total gross uncertain tax positions 12.8 3.0 1.1 16.9 — 16.9Total uncertain tax positions that, if
recognized, would not impact theeffective tax rate as ofDecember 31, 2009 (10.4) (3.0) (1.1) (14.5) — (14.5)
Total uncertain tax positions that, ifrecognized, would impact theeffective tax rate as ofDecember 31, 2009 $ 2.4 $ — $ — $ 2.4 $ — $ 2.4
The uncertain tax positions have been recorded as part of the long term payable with no reversal being expectedin the next twelve months. The uncertain tax benefits as of December 31, 2009 are recorded against theCompany’s deferred tax assets to the extent the uncertainty directly related to that asset; otherwise they arerecorded as either current or noncurrent income tax payable. As of December 31, 2009 and 2008, approximately$14.0 million and $17.6 million, respectively, of gross noncurrent income tax payable was included in otherliabilities on the balance sheet.
The amounts of unrecognized tax benefits that, if recognized, would impact the effective tax rate were $2.4 million,$11.7 million, and $10.3 million as of December 31, 2009, 2008 and 2007, respectively.
The Company classifies interest and penalties related to unrecognized tax benefits as a component of provisionfor income taxes. These amounts are reflected separately on the reconciliation above.
The Company believes that it has provided adequately for all uncertain tax positions that are not otherwiseindemnified by BMS. Pursuant to the tax matters agreement dated February 10, 2009, BMS maintainsresponsibility for all uncertain tax positions which may exist in the pre-IPO period or which may exist as a resultof the IPO transaction. Pursuant to the Amended and Restated Tax Matters Agreement dated December 18, 2009,the Company continues to maintain responsibility for all uncertain tax positions which may exist in the post-IPOperiod. MJN anticipates that it is reasonably possible that new issues may be raised by tax authorities and thatthese issues may require increases in the balance of unrecognized tax benefits.
76
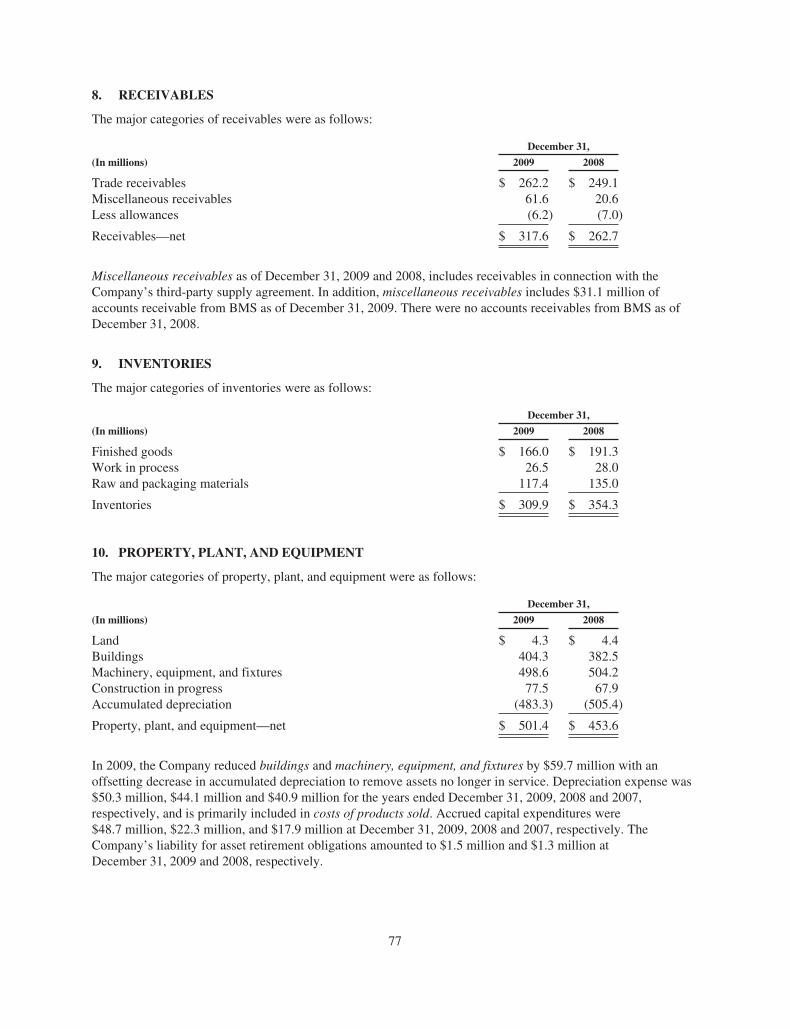
8. RECEIVABLES
The major categories of receivables were as follows:
December 31,
(In millions) 2009 2008
Trade receivables $ 262.2 $ 249.1Miscellaneous receivables 61.6 20.6Less allowances (6.2) (7.0)
Receivables—net $ 317.6 $ 262.7
Miscellaneous receivables as of December 31, 2009 and 2008, includes receivables in connection with theCompany’s third-party supply agreement. In addition, miscellaneous receivables includes $31.1 million ofaccounts receivable from BMS as of December 31, 2009. There were no accounts receivables from BMS as ofDecember 31, 2008.
9. INVENTORIES
The major categories of inventories were as follows:
December 31,
(In millions) 2009 2008
Finished goods $ 166.0 $ 191.3Work in process 26.5 28.0Raw and packaging materials 117.4 135.0
Inventories $ 309.9 $ 354.3
10. PROPERTY, PLANT, AND EQUIPMENT
The major categories of property, plant, and equipment were as follows:
December 31,
(In millions) 2009 2008
Land $ 4.3 $ 4.4Buildings 404.3 382.5Machinery, equipment, and fixtures 498.6 504.2Construction in progress 77.5 67.9Accumulated depreciation (483.3) (505.4)
Property, plant, and equipment—net $ 501.4 $ 453.6
In 2009, the Company reduced buildings and machinery, equipment, and fixtures by $59.7 million with anoffsetting decrease in accumulated depreciation to remove assets no longer in service. Depreciation expense was$50.3 million, $44.1 million and $40.9 million for the years ended December 31, 2009, 2008 and 2007,respectively, and is primarily included in costs of products sold. Accrued capital expenditures were$48.7 million, $22.3 million, and $17.9 million at December 31, 2009, 2008 and 2007, respectively. TheCompany’s liability for asset retirement obligations amounted to $1.5 million and $1.3 million atDecember 31, 2009 and 2008, respectively.
77
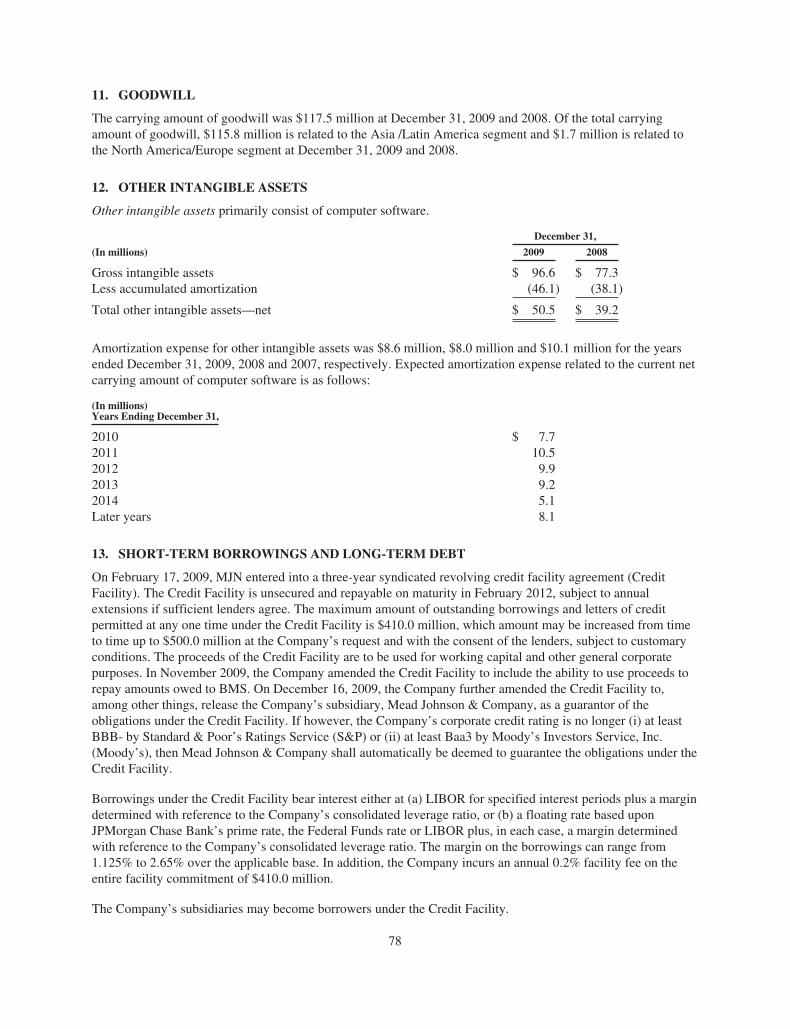
11. GOODWILL
The carrying amount of goodwill was $117.5 million at December 31, 2009 and 2008. Of the total carryingamount of goodwill, $115.8 million is related to the Asia /Latin America segment and $1.7 million is related tothe North America/Europe segment at December 31, 2009 and 2008.
12. OTHER INTANGIBLE ASSETS
Other intangible assets primarily consist of computer software.
December 31,
(In millions) 2009 2008
Gross intangible assets $ 96.6 $ 77.3Less accumulated amortization (46.1) (38.1)
Total other intangible assets—net $ 50.5 $ 39.2
Amortization expense for other intangible assets was $8.6 million, $8.0 million and $10.1 million for the yearsended December 31, 2009, 2008 and 2007, respectively. Expected amortization expense related to the current netcarrying amount of computer software is as follows:
(In millions)Years Ending December 31,
2010 $ 7.72011 10.52012 9.92013 9.22014 5.1Later years 8.1
13. SHORT-TERM BORROWINGS AND LONG-TERM DEBT
On February 17, 2009, MJN entered into a three-year syndicated revolving credit facility agreement (CreditFacility). The Credit Facility is unsecured and repayable on maturity in February 2012, subject to annualextensions if sufficient lenders agree. The maximum amount of outstanding borrowings and letters of creditpermitted at any one time under the Credit Facility is $410.0 million, which amount may be increased from timeto time up to $500.0 million at the Company’s request and with the consent of the lenders, subject to customaryconditions. The proceeds of the Credit Facility are to be used for working capital and other general corporatepurposes. In November 2009, the Company amended the Credit Facility to include the ability to use proceeds torepay amounts owed to BMS. On December 16, 2009, the Company further amended the Credit Facility to,among other things, release the Company’s subsidiary, Mead Johnson & Company, as a guarantor of theobligations under the Credit Facility. If however, the Company’s corporate credit rating is no longer (i) at leastBBB- by Standard & Poor’s Ratings Service (S&P) or (ii) at least Baa3 by Moody’s Investors Service, Inc.(Moody’s), then Mead Johnson & Company shall automatically be deemed to guarantee the obligations under theCredit Facility.
Borrowings under the Credit Facility bear interest either at (a) LIBOR for specified interest periods plus a margindetermined with reference to the Company’s consolidated leverage ratio, or (b) a floating rate based uponJPMorgan Chase Bank’s prime rate, the Federal Funds rate or LIBOR plus, in each case, a margin determinedwith reference to the Company’s consolidated leverage ratio. The margin on the borrowings can range from1.125% to 2.65% over the applicable base. In addition, the Company incurs an annual 0.2% facility fee on theentire facility commitment of $410.0 million.
The Company’s subsidiaries may become borrowers under the Credit Facility.
78
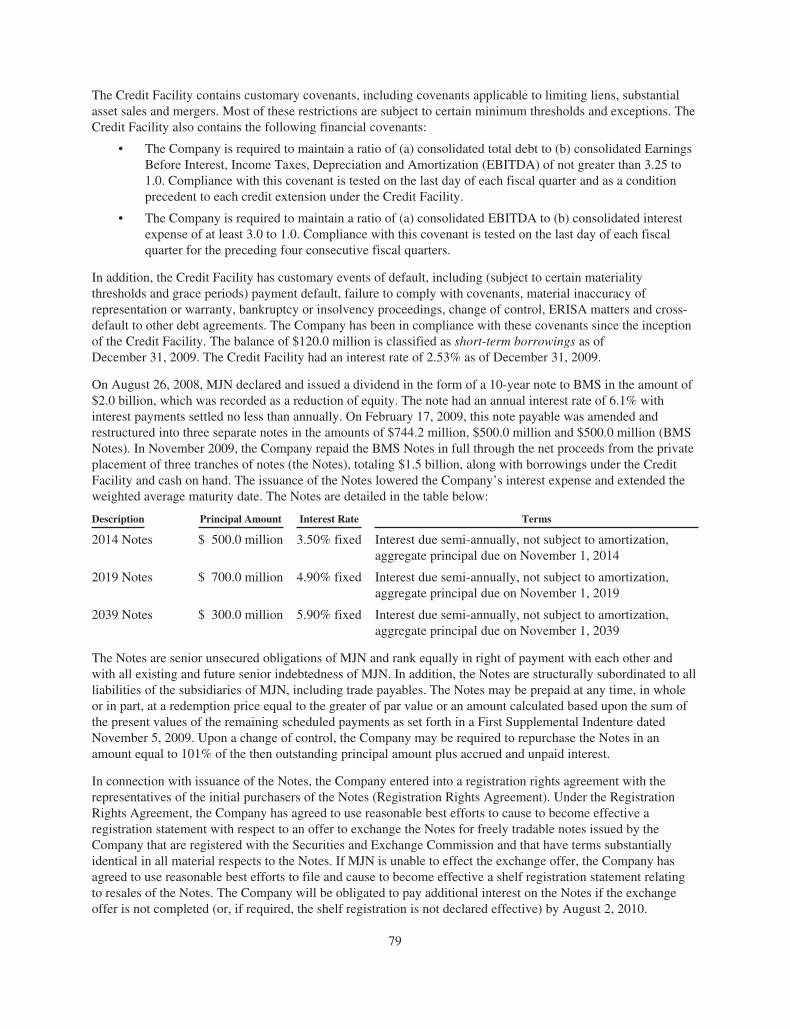
The Credit Facility contains customary covenants, including covenants applicable to limiting liens, substantialasset sales and mergers. Most of these restrictions are subject to certain minimum thresholds and exceptions. TheCredit Facility also contains the following financial covenants:
• The Company is required to maintain a ratio of (a) consolidated total debt to (b) consolidated EarningsBefore Interest, Income Taxes, Depreciation and Amortization (EBITDA) of not greater than 3.25 to1.0. Compliance with this covenant is tested on the last day of each fiscal quarter and as a conditionprecedent to each credit extension under the Credit Facility.
• The Company is required to maintain a ratio of (a) consolidated EBITDA to (b) consolidated interestexpense of at least 3.0 to 1.0. Compliance with this covenant is tested on the last day of each fiscalquarter for the preceding four consecutive fiscal quarters.
In addition, the Credit Facility has customary events of default, including (subject to certain materialitythresholds and grace periods) payment default, failure to comply with covenants, material inaccuracy ofrepresentation or warranty, bankruptcy or insolvency proceedings, change of control, ERISA matters and cross-default to other debt agreements. The Company has been in compliance with these covenants since the inceptionof the Credit Facility. The balance of $120.0 million is classified as short-term borrowings as ofDecember 31, 2009. The Credit Facility had an interest rate of 2.53% as of December 31, 2009.
On August 26, 2008, MJN declared and issued a dividend in the form of a 10-year note to BMS in the amount of$2.0 billion, which was recorded as a reduction of equity. The note had an annual interest rate of 6.1% withinterest payments settled no less than annually. On February 17, 2009, this note payable was amended andrestructured into three separate notes in the amounts of $744.2 million, $500.0 million and $500.0 million (BMSNotes). In November 2009, the Company repaid the BMS Notes in full through the net proceeds from the privateplacement of three tranches of notes (the Notes), totaling $1.5 billion, along with borrowings under the CreditFacility and cash on hand. The issuance of the Notes lowered the Company’s interest expense and extended theweighted average maturity date. The Notes are detailed in the table below:
Description Principal Amount Interest Rate Terms
2014 Notes $ 500.0 million 3.50% fixed Interest due semi-annually, not subject to amortization,aggregate principal due on November 1, 2014
2019 Notes $ 700.0 million 4.90% fixed Interest due semi-annually, not subject to amortization,aggregate principal due on November 1, 2019
2039 Notes $ 300.0 million 5.90% fixed Interest due semi-annually, not subject to amortization,aggregate principal due on November 1, 2039
The Notes are senior unsecured obligations of MJN and rank equally in right of payment with each other andwith all existing and future senior indebtedness of MJN. In addition, the Notes are structurally subordinated to allliabilities of the subsidiaries of MJN, including trade payables. The Notes may be prepaid at any time, in wholeor in part, at a redemption price equal to the greater of par value or an amount calculated based upon the sum ofthe present values of the remaining scheduled payments as set forth in a First Supplemental Indenture datedNovember 5, 2009. Upon a change of control, the Company may be required to repurchase the Notes in anamount equal to 101% of the then outstanding principal amount plus accrued and unpaid interest.
In connection with issuance of the Notes, the Company entered into a registration rights agreement with therepresentatives of the initial purchasers of the Notes (Registration Rights Agreement). Under the RegistrationRights Agreement, the Company has agreed to use reasonable best efforts to cause to become effective aregistration statement with respect to an offer to exchange the Notes for freely tradable notes issued by theCompany that are registered with the Securities and Exchange Commission and that have terms substantiallyidentical in all material respects to the Notes. If MJN is unable to effect the exchange offer, the Company hasagreed to use reasonable best efforts to file and cause to become effective a shelf registration statement relatingto resales of the Notes. The Company will be obligated to pay additional interest on the Notes if the exchangeoffer is not completed (or, if required, the shelf registration is not declared effective) by August 2, 2010.
79
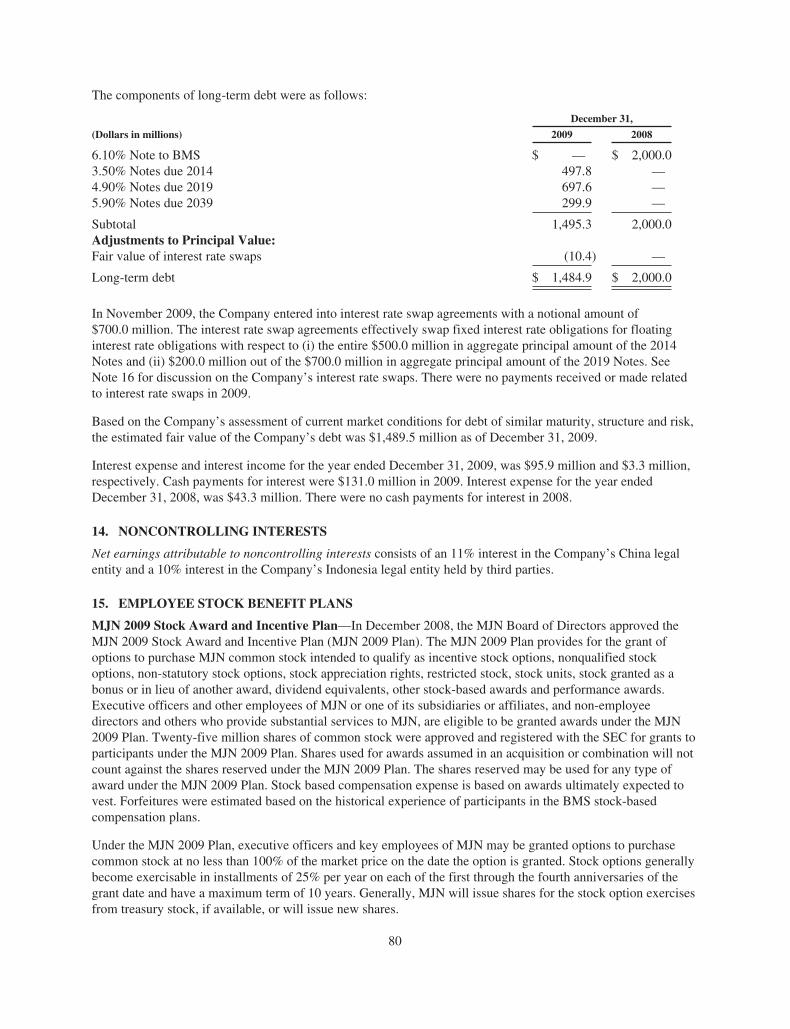
The components of long-term debt were as follows:
December 31,
(Dollars in millions) 2009 2008
6.10% Note to BMS $ — $ 2,000.03.50% Notes due 2014 497.8 —4.90% Notes due 2019 697.6 —5.90% Notes due 2039 299.9 —
Subtotal 1,495.3 2,000.0Adjustments to Principal Value:Fair value of interest rate swaps (10.4) —
Long-term debt $ 1,484.9 $ 2,000.0
In November 2009, the Company entered into interest rate swap agreements with a notional amount of$700.0 million. The interest rate swap agreements effectively swap fixed interest rate obligations for floatinginterest rate obligations with respect to (i) the entire $500.0 million in aggregate principal amount of the 2014Notes and (ii) $200.0 million out of the $700.0 million in aggregate principal amount of the 2019 Notes. SeeNote 16 for discussion on the Company’s interest rate swaps. There were no payments received or made relatedto interest rate swaps in 2009.
Based on the Company’s assessment of current market conditions for debt of similar maturity, structure and risk,the estimated fair value of the Company’s debt was $1,489.5 million as of December 31, 2009.
Interest expense and interest income for the year ended December 31, 2009, was $95.9 million and $3.3 million,respectively. Cash payments for interest were $131.0 million in 2009. Interest expense for the year endedDecember 31, 2008, was $43.3 million. There were no cash payments for interest in 2008.
14. NONCONTROLLING INTERESTS
Net earnings attributable to noncontrolling interests consists of an 11% interest in the Company’s China legalentity and a 10% interest in the Company’s Indonesia legal entity held by third parties.
15. EMPLOYEE STOCK BENEFIT PLANS
MJN 2009 Stock Award and Incentive Plan—In December 2008, the MJN Board of Directors approved theMJN 2009 Stock Award and Incentive Plan (MJN 2009 Plan). The MJN 2009 Plan provides for the grant ofoptions to purchase MJN common stock intended to qualify as incentive stock options, nonqualified stockoptions, non-statutory stock options, stock appreciation rights, restricted stock, stock units, stock granted as abonus or in lieu of another award, dividend equivalents, other stock-based awards and performance awards.Executive officers and other employees of MJN or one of its subsidiaries or affiliates, and non-employeedirectors and others who provide substantial services to MJN, are eligible to be granted awards under the MJN2009 Plan. Twenty-five million shares of common stock were approved and registered with the SEC for grants toparticipants under the MJN 2009 Plan. Shares used for awards assumed in an acquisition or combination will notcount against the shares reserved under the MJN 2009 Plan. The shares reserved may be used for any type ofaward under the MJN 2009 Plan. Stock based compensation expense is based on awards ultimately expected tovest. Forfeitures were estimated based on the historical experience of participants in the BMS stock-basedcompensation plans.
Under the MJN 2009 Plan, executive officers and key employees of MJN may be granted options to purchasecommon stock at no less than 100% of the market price on the date the option is granted. Stock options generallybecome exercisable in installments of 25% per year on each of the first through the fourth anniversaries of thegrant date and have a maximum term of 10 years. Generally, MJN will issue shares for the stock option exercisesfrom treasury stock, if available, or will issue new shares.
80
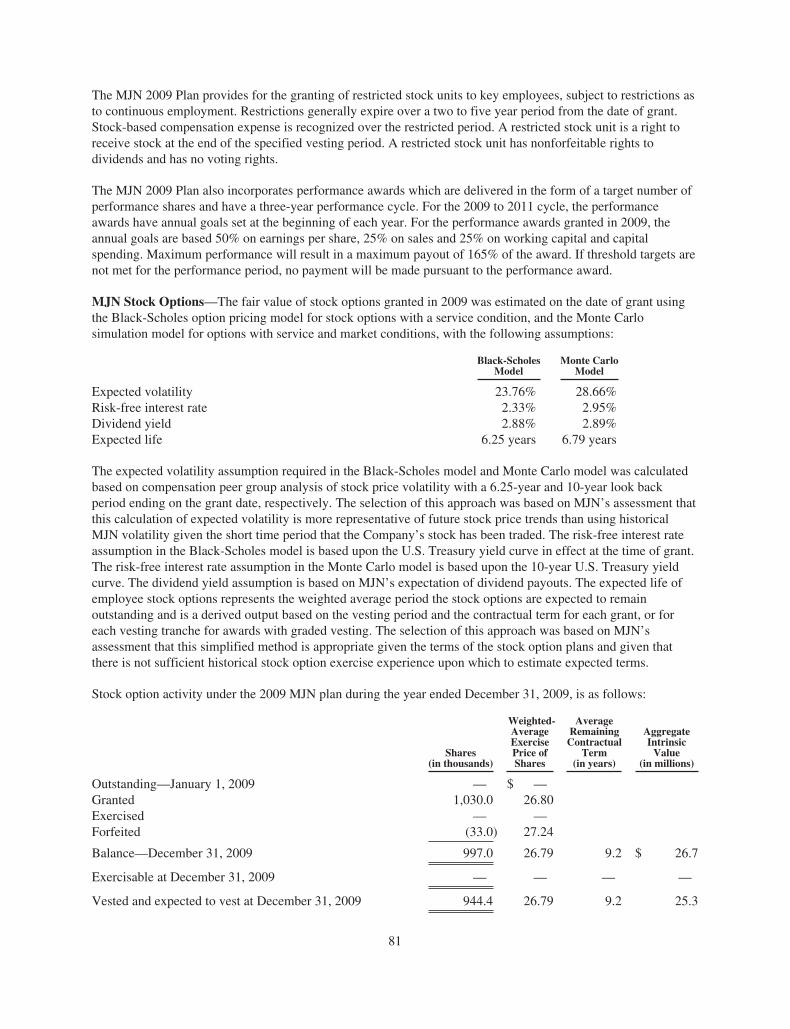
The MJN 2009 Plan provides for the granting of restricted stock units to key employees, subject to restrictions asto continuous employment. Restrictions generally expire over a two to five year period from the date of grant.Stock-based compensation expense is recognized over the restricted period. A restricted stock unit is a right toreceive stock at the end of the specified vesting period. A restricted stock unit has nonforfeitable rights todividends and has no voting rights.
The MJN 2009 Plan also incorporates performance awards which are delivered in the form of a target number ofperformance shares and have a three-year performance cycle. For the 2009 to 2011 cycle, the performanceawards have annual goals set at the beginning of each year. For the performance awards granted in 2009, theannual goals are based 50% on earnings per share, 25% on sales and 25% on working capital and capitalspending. Maximum performance will result in a maximum payout of 165% of the award. If threshold targets arenot met for the performance period, no payment will be made pursuant to the performance award.
MJN Stock Options—The fair value of stock options granted in 2009 was estimated on the date of grant usingthe Black-Scholes option pricing model for stock options with a service condition, and the Monte Carlosimulation model for options with service and market conditions, with the following assumptions:
Black-ScholesModel
Monte CarloModel
Expected volatility 23.76% 28.66%Risk-free interest rate 2.33% 2.95%Dividend yield 2.88% 2.89%Expected life 6.25 years 6.79 years
The expected volatility assumption required in the Black-Scholes model and Monte Carlo model was calculatedbased on compensation peer group analysis of stock price volatility with a 6.25-year and 10-year look backperiod ending on the grant date, respectively. The selection of this approach was based on MJN’s assessment thatthis calculation of expected volatility is more representative of future stock price trends than using historicalMJN volatility given the short time period that the Company’s stock has been traded. The risk-free interest rateassumption in the Black-Scholes model is based upon the U.S. Treasury yield curve in effect at the time of grant.The risk-free interest rate assumption in the Monte Carlo model is based upon the 10-year U.S. Treasury yieldcurve. The dividend yield assumption is based on MJN’s expectation of dividend payouts. The expected life ofemployee stock options represents the weighted average period the stock options are expected to remainoutstanding and is a derived output based on the vesting period and the contractual term for each grant, or foreach vesting tranche for awards with graded vesting. The selection of this approach was based on MJN’sassessment that this simplified method is appropriate given the terms of the stock option plans and given thatthere is not sufficient historical stock option exercise experience upon which to estimate expected terms.
Stock option activity under the 2009 MJN plan during the year ended December 31, 2009, is as follows:
Shares(in thousands)
Weighted-AverageExercisePrice ofShares
AverageRemainingContractual
Term(in years)
AggregateIntrinsic
Value(in millions)
Outstanding—January 1, 2009 — $ —Granted 1,030.0 26.80Exercised — —Forfeited (33.0) 27.24
Balance—December 31, 2009 997.0 26.79 9.2 $ 26.7
Exercisable at December 31, 2009 — — — —
Vested and expected to vest at December 31, 2009 944.4 26.79 9.2 25.3
81
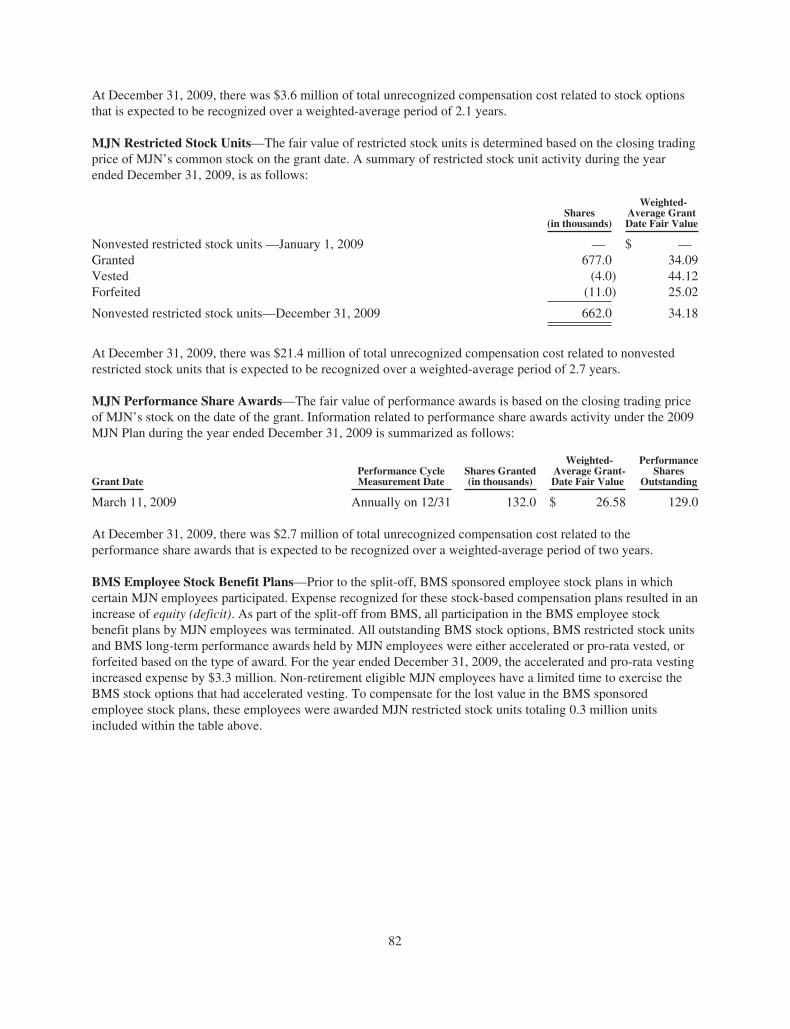
At December 31, 2009, there was $3.6 million of total unrecognized compensation cost related to stock optionsthat is expected to be recognized over a weighted-average period of 2.1 years.
MJN Restricted Stock Units—The fair value of restricted stock units is determined based on the closing tradingprice of MJN’s common stock on the grant date. A summary of restricted stock unit activity during the yearended December 31, 2009, is as follows:
Shares(in thousands)
Weighted-Average GrantDate Fair Value
Nonvested restricted stock units —January 1, 2009 — $ —Granted 677.0 34.09Vested (4.0) 44.12Forfeited (11.0) 25.02
Nonvested restricted stock units—December 31, 2009 662.0 34.18
At December 31, 2009, there was $21.4 million of total unrecognized compensation cost related to nonvestedrestricted stock units that is expected to be recognized over a weighted-average period of 2.7 years.
MJN Performance Share Awards—The fair value of performance awards is based on the closing trading priceof MJN’s stock on the date of the grant. Information related to performance share awards activity under the 2009MJN Plan during the year ended December 31, 2009 is summarized as follows:
Grant DatePerformance CycleMeasurement Date
Shares Granted(in thousands)
Weighted-Average Grant-Date Fair Value
PerformanceShares
Outstanding
March 11, 2009 Annually on 12/31 132.0 $ 26.58 129.0
At December 31, 2009, there was $2.7 million of total unrecognized compensation cost related to theperformance share awards that is expected to be recognized over a weighted-average period of two years.
BMS Employee Stock Benefit Plans—Prior to the split-off, BMS sponsored employee stock plans in whichcertain MJN employees participated. Expense recognized for these stock-based compensation plans resulted in anincrease of equity (deficit). As part of the split-off from BMS, all participation in the BMS employee stockbenefit plans by MJN employees was terminated. All outstanding BMS stock options, BMS restricted stock unitsand BMS long-term performance awards held by MJN employees were either accelerated or pro-rata vested, orforfeited based on the type of award. For the year ended December 31, 2009, the accelerated and pro-rata vestingincreased expense by $3.3 million. Non-retirement eligible MJN employees have a limited time to exercise theBMS stock options that had accelerated vesting. To compensate for the lost value in the BMS sponsoredemployee stock plans, these employees were awarded MJN restricted stock units totaling 0.3 million unitsincluded within the table above.
82
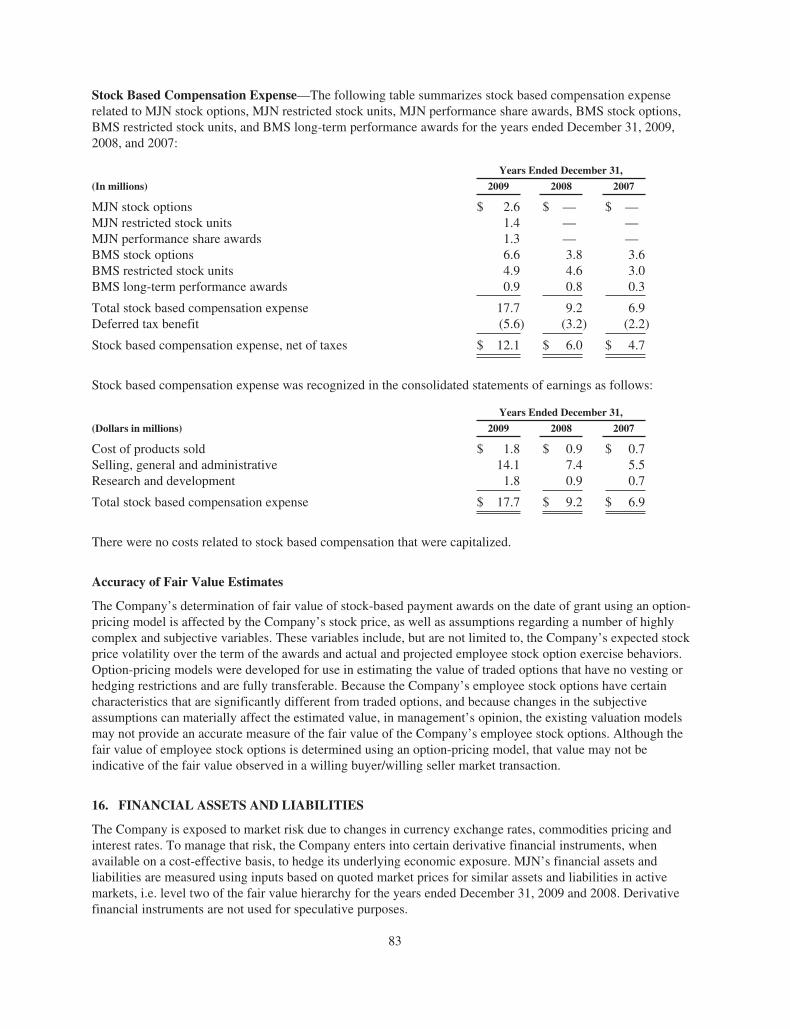
Stock Based Compensation Expense—The following table summarizes stock based compensation expenserelated to MJN stock options, MJN restricted stock units, MJN performance share awards, BMS stock options,BMS restricted stock units, and BMS long-term performance awards for the years ended December 31, 2009,2008, and 2007:
Years Ended December 31,
(In millions) 2009 2008 2007
MJN stock options $ 2.6 $ — $ —MJN restricted stock units 1.4 — —MJN performance share awards 1.3 — —BMS stock options 6.6 3.8 3.6BMS restricted stock units 4.9 4.6 3.0BMS long-term performance awards 0.9 0.8 0.3
Total stock based compensation expense 17.7 9.2 6.9Deferred tax benefit (5.6) (3.2) (2.2)
Stock based compensation expense, net of taxes $ 12.1 $ 6.0 $ 4.7
Stock based compensation expense was recognized in the consolidated statements of earnings as follows:
Years Ended December 31,
(Dollars in millions) 2009 2008 2007
Cost of products sold $ 1.8 $ 0.9 $ 0.7Selling, general and administrative 14.1 7.4 5.5Research and development 1.8 0.9 0.7
Total stock based compensation expense $ 17.7 $ 9.2 $ 6.9
There were no costs related to stock based compensation that were capitalized.
Accuracy of Fair Value Estimates
The Company’s determination of fair value of stock-based payment awards on the date of grant using an option-pricing model is affected by the Company’s stock price, as well as assumptions regarding a number of highlycomplex and subjective variables. These variables include, but are not limited to, the Company’s expected stockprice volatility over the term of the awards and actual and projected employee stock option exercise behaviors.Option-pricing models were developed for use in estimating the value of traded options that have no vesting orhedging restrictions and are fully transferable. Because the Company’s employee stock options have certaincharacteristics that are significantly different from traded options, and because changes in the subjectiveassumptions can materially affect the estimated value, in management’s opinion, the existing valuation modelsmay not provide an accurate measure of the fair value of the Company’s employee stock options. Although thefair value of employee stock options is determined using an option-pricing model, that value may not beindicative of the fair value observed in a willing buyer/willing seller market transaction.
16. FINANCIAL ASSETS AND LIABILITIES
The Company is exposed to market risk due to changes in currency exchange rates, commodities pricing andinterest rates. To manage that risk, the Company enters into certain derivative financial instruments, whenavailable on a cost-effective basis, to hedge its underlying economic exposure. MJN’s financial assets andliabilities are measured using inputs based on quoted market prices for similar assets and liabilities in activemarkets, i.e. level two of the fair value hierarchy for the years ended December 31, 2009 and 2008. Derivativefinancial instruments are not used for speculative purposes.
83
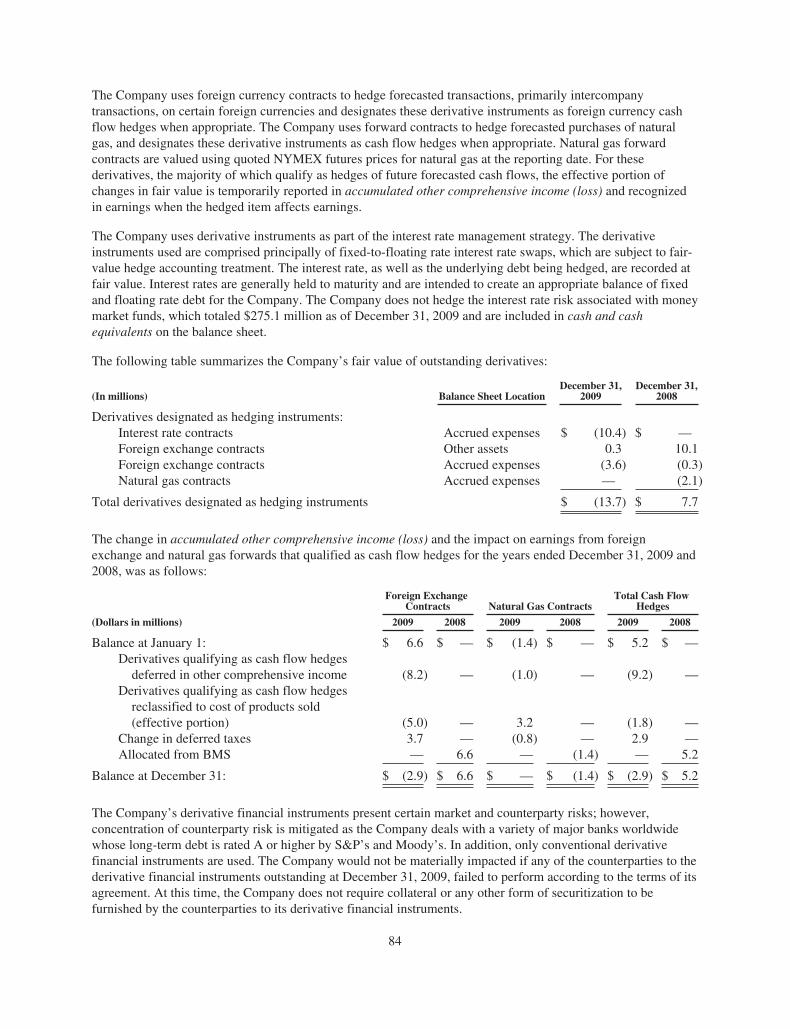
The Company uses foreign currency contracts to hedge forecasted transactions, primarily intercompanytransactions, on certain foreign currencies and designates these derivative instruments as foreign currency cashflow hedges when appropriate. The Company uses forward contracts to hedge forecasted purchases of naturalgas, and designates these derivative instruments as cash flow hedges when appropriate. Natural gas forwardcontracts are valued using quoted NYMEX futures prices for natural gas at the reporting date. For thesederivatives, the majority of which qualify as hedges of future forecasted cash flows, the effective portion ofchanges in fair value is temporarily reported in accumulated other comprehensive income (loss) and recognizedin earnings when the hedged item affects earnings.
The Company uses derivative instruments as part of the interest rate management strategy. The derivativeinstruments used are comprised principally of fixed-to-floating rate interest rate swaps, which are subject to fair-value hedge accounting treatment. The interest rate, as well as the underlying debt being hedged, are recorded atfair value. Interest rates are generally held to maturity and are intended to create an appropriate balance of fixedand floating rate debt for the Company. The Company does not hedge the interest rate risk associated with moneymarket funds, which totaled $275.1 million as of December 31, 2009 and are included in cash and cashequivalents on the balance sheet.
The following table summarizes the Company’s fair value of outstanding derivatives:
(In millions) Balance Sheet LocationDecember 31,
2009December 31,
2008
Derivatives designated as hedging instruments:Interest rate contracts Accrued expenses $ (10.4) $ —Foreign exchange contracts Other assets 0.3 10.1Foreign exchange contracts Accrued expenses (3.6) (0.3)Natural gas contracts Accrued expenses — (2.1)
Total derivatives designated as hedging instruments $ (13.7) $ 7.7
The change in accumulated other comprehensive income (loss) and the impact on earnings from foreignexchange and natural gas forwards that qualified as cash flow hedges for the years ended December 31, 2009 and2008, was as follows:
Foreign ExchangeContracts Natural Gas Contracts
Total Cash FlowHedges
(Dollars in millions) 2009 2008 2009 2008 2009 2008
Balance at January 1: $ 6.6 $ — $ (1.4) $ — $ 5.2 $ —Derivatives qualifying as cash flow hedges
deferred in other comprehensive income (8.2) — (1.0) — (9.2) —Derivatives qualifying as cash flow hedges
reclassified to cost of products sold(effective portion) (5.0) — 3.2 — (1.8) —
Change in deferred taxes 3.7 — (0.8) — 2.9 —Allocated from BMS — 6.6 — (1.4) — 5.2
Balance at December 31: $ (2.9) $ 6.6 $ — $ (1.4) $ (2.9) $ 5.2
The Company’s derivative financial instruments present certain market and counterparty risks; however,concentration of counterparty risk is mitigated as the Company deals with a variety of major banks worldwidewhose long-term debt is rated A or higher by S&P’s and Moody’s. In addition, only conventional derivativefinancial instruments are used. The Company would not be materially impacted if any of the counterparties to thederivative financial instruments outstanding at December 31, 2009, failed to perform according to the terms of itsagreement. At this time, the Company does not require collateral or any other form of securitization to befurnished by the counterparties to its derivative financial instruments.
84
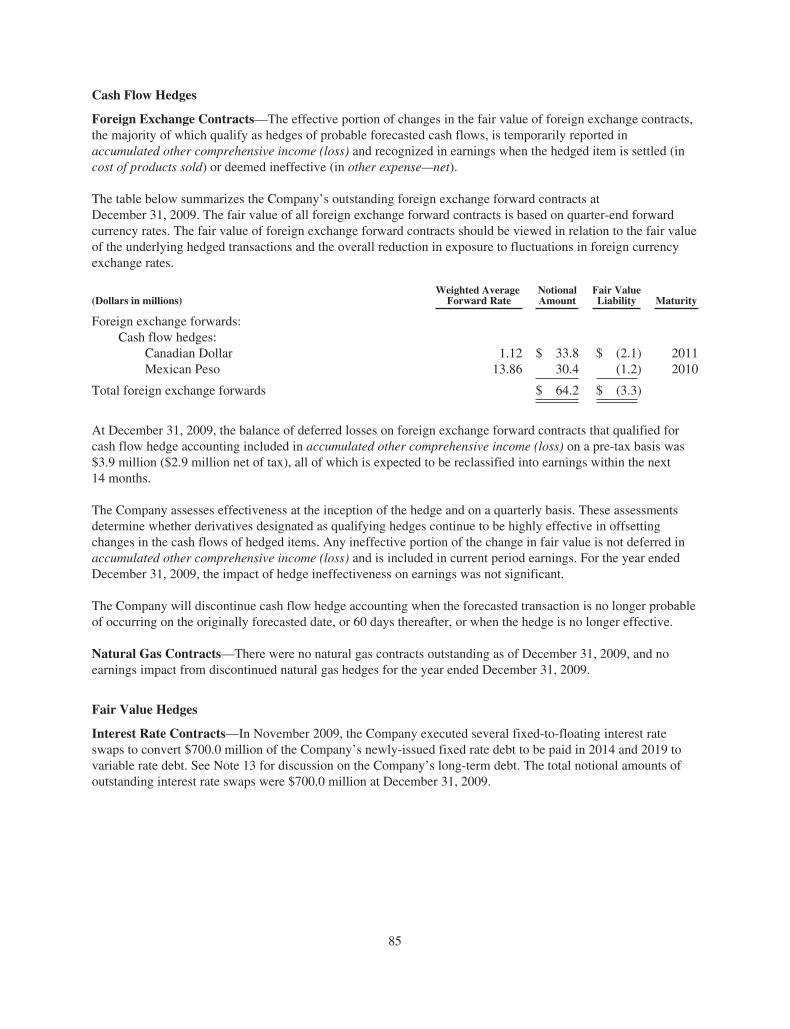
Cash Flow Hedges
Foreign Exchange Contracts—The effective portion of changes in the fair value of foreign exchange contracts,the majority of which qualify as hedges of probable forecasted cash flows, is temporarily reported inaccumulated other comprehensive income (loss) and recognized in earnings when the hedged item is settled (incost of products sold) or deemed ineffective (in other expense—net).
The table below summarizes the Company’s outstanding foreign exchange forward contracts atDecember 31, 2009. The fair value of all foreign exchange forward contracts is based on quarter-end forwardcurrency rates. The fair value of foreign exchange forward contracts should be viewed in relation to the fair valueof the underlying hedged transactions and the overall reduction in exposure to fluctuations in foreign currencyexchange rates.
(Dollars in millions)Weighted Average
Forward RateNotionalAmount
Fair ValueLiability Maturity
Foreign exchange forwards:Cash flow hedges:
Canadian Dollar 1.12 $ 33.8 $ (2.1) 2011Mexican Peso 13.86 30.4 (1.2) 2010
Total foreign exchange forwards $ 64.2 $ (3.3)
At December 31, 2009, the balance of deferred losses on foreign exchange forward contracts that qualified forcash flow hedge accounting included in accumulated other comprehensive income (loss) on a pre-tax basis was$3.9 million ($2.9 million net of tax), all of which is expected to be reclassified into earnings within the next14 months.
The Company assesses effectiveness at the inception of the hedge and on a quarterly basis. These assessmentsdetermine whether derivatives designated as qualifying hedges continue to be highly effective in offsettingchanges in the cash flows of hedged items. Any ineffective portion of the change in fair value is not deferred inaccumulated other comprehensive income (loss) and is included in current period earnings. For the year endedDecember 31, 2009, the impact of hedge ineffectiveness on earnings was not significant.
The Company will discontinue cash flow hedge accounting when the forecasted transaction is no longer probableof occurring on the originally forecasted date, or 60 days thereafter, or when the hedge is no longer effective.
Natural Gas Contracts—There were no natural gas contracts outstanding as of December 31, 2009, and noearnings impact from discontinued natural gas hedges for the year ended December 31, 2009.
Fair Value Hedges
Interest Rate Contracts—In November 2009, the Company executed several fixed-to-floating interest rateswaps to convert $700.0 million of the Company’s newly-issued fixed rate debt to be paid in 2014 and 2019 tovariable rate debt. See Note 13 for discussion on the Company’s long-term debt. The total notional amounts ofoutstanding interest rate swaps were $700.0 million at December 31, 2009.
85
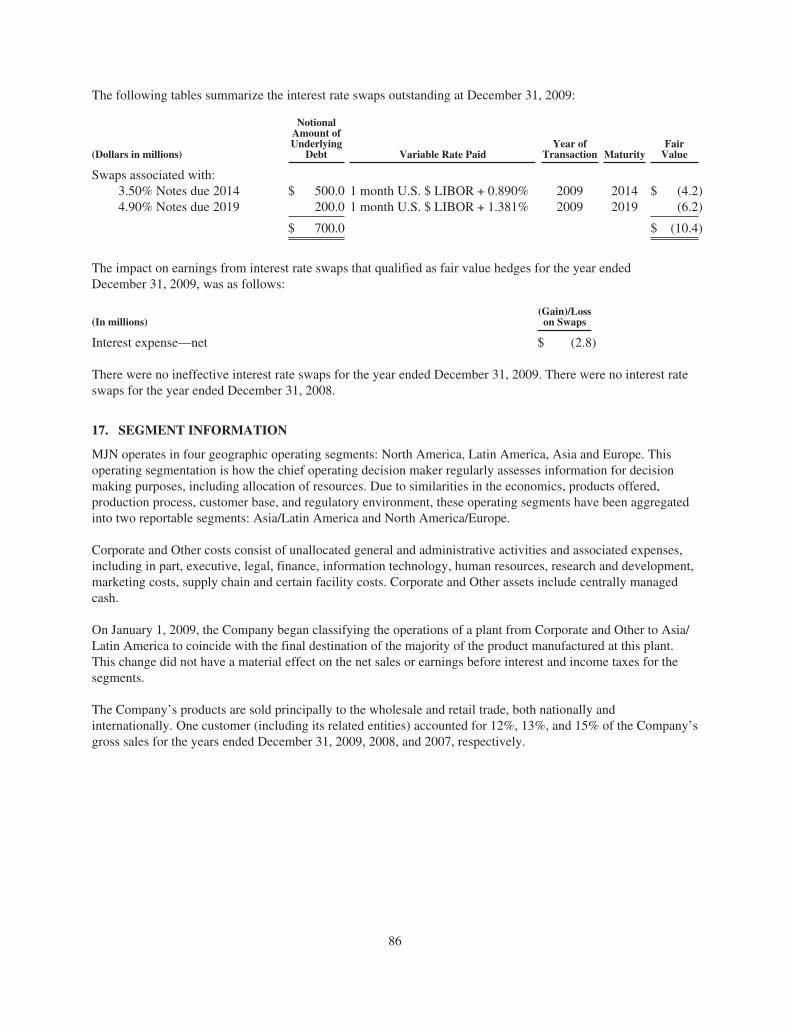
The following tables summarize the interest rate swaps outstanding at December 31, 2009:
(Dollars in millions)
NotionalAmount ofUnderlying
Debt Variable Rate PaidYear of
Transaction MaturityFair
Value
Swaps associated with:3.50% Notes due 2014 $ 500.0 1 month U.S. $ LIBOR + 0.890% 2009 2014 $ (4.2)4.90% Notes due 2019 200.0 1 month U.S. $ LIBOR + 1.381% 2009 2019 (6.2)
$ 700.0 $ (10.4)
The impact on earnings from interest rate swaps that qualified as fair value hedges for the year endedDecember 31, 2009, was as follows:
(In millions)(Gain)/Losson Swaps
Interest expense—net $ (2.8)
There were no ineffective interest rate swaps for the year ended December 31, 2009. There were no interest rateswaps for the year ended December 31, 2008.
17. SEGMENT INFORMATION
MJN operates in four geographic operating segments: North America, Latin America, Asia and Europe. Thisoperating segmentation is how the chief operating decision maker regularly assesses information for decisionmaking purposes, including allocation of resources. Due to similarities in the economics, products offered,production process, customer base, and regulatory environment, these operating segments have been aggregatedinto two reportable segments: Asia/Latin America and North America/Europe.
Corporate and Other costs consist of unallocated general and administrative activities and associated expenses,including in part, executive, legal, finance, information technology, human resources, research and development,marketing costs, supply chain and certain facility costs. Corporate and Other assets include centrally managedcash.
On January 1, 2009, the Company began classifying the operations of a plant from Corporate and Other to Asia/Latin America to coincide with the final destination of the majority of the product manufactured at this plant.This change did not have a material effect on the net sales or earnings before interest and income taxes for thesegments.
The Company’s products are sold principally to the wholesale and retail trade, both nationally andinternationally. One customer (including its related entities) accounted for 12%, 13%, and 15% of the Company’sgross sales for the years ended December 31, 2009, 2008, and 2007, respectively.
86
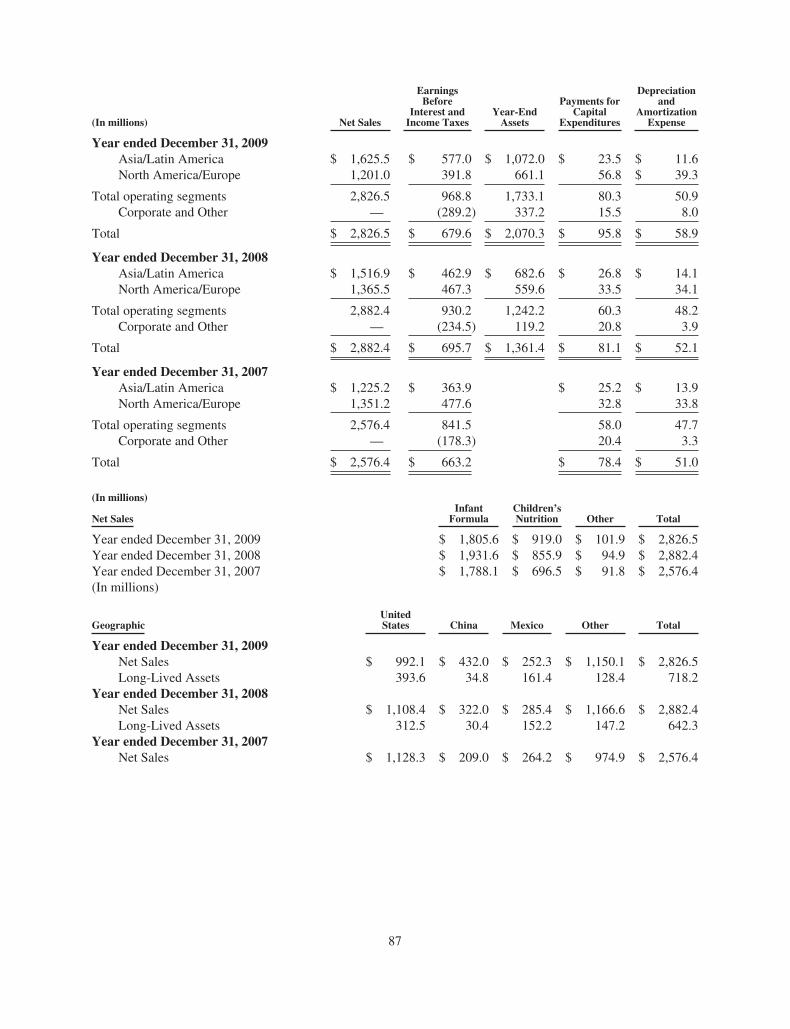
(In millions) Net Sales
EarningsBefore
Interest andIncome Taxes
Year-EndAssets
Payments forCapital
Expenditures
Depreciationand
AmortizationExpense
Year ended December 31, 2009Asia/Latin America $ 1,625.5 $ 577.0 $ 1,072.0 $ 23.5 $ 11.6North America/Europe 1,201.0 391.8 661.1 56.8 $ 39.3
Total operating segments 2,826.5 968.8 1,733.1 80.3 50.9Corporate and Other — (289.2) 337.2 15.5 8.0
Total $ 2,826.5 $ 679.6 $ 2,070.3 $ 95.8 $ 58.9
Year ended December 31, 2008Asia/Latin America $ 1,516.9 $ 462.9 $ 682.6 $ 26.8 $ 14.1North America/Europe 1,365.5 467.3 559.6 33.5 34.1
Total operating segments 2,882.4 930.2 1,242.2 60.3 48.2Corporate and Other — (234.5) 119.2 20.8 3.9
Total $ 2,882.4 $ 695.7 $ 1,361.4 $ 81.1 $ 52.1
Year ended December 31, 2007Asia/Latin America $ 1,225.2 $ 363.9 $ 25.2 $ 13.9North America/Europe 1,351.2 477.6 32.8 33.8
Total operating segments 2,576.4 841.5 58.0 47.7Corporate and Other — (178.3) 20.4 3.3
Total $ 2,576.4 $ 663.2 $ 78.4 $ 51.0
(In millions)
Net SalesInfant
FormulaChildren’sNutrition Other Total
Year ended December 31, 2009 $ 1,805.6 $ 919.0 $ 101.9 $ 2,826.5Year ended December 31, 2008 $ 1,931.6 $ 855.9 $ 94.9 $ 2,882.4Year ended December 31, 2007 $ 1,788.1 $ 696.5 $ 91.8 $ 2,576.4(In millions)
GeographicUnitedStates China Mexico Other Total
Year ended December 31, 2009Net Sales $ 992.1 $ 432.0 $ 252.3 $ 1,150.1 $ 2,826.5Long-Lived Assets 393.6 34.8 161.4 128.4 718.2
Year ended December 31, 2008Net Sales $ 1,108.4 $ 322.0 $ 285.4 $ 1,166.6 $ 2,882.4Long-Lived Assets 312.5 30.4 152.2 147.2 642.3
Year ended December 31, 2007Net Sales $ 1,128.3 $ 209.0 $ 264.2 $ 974.9 $ 2,576.4
87
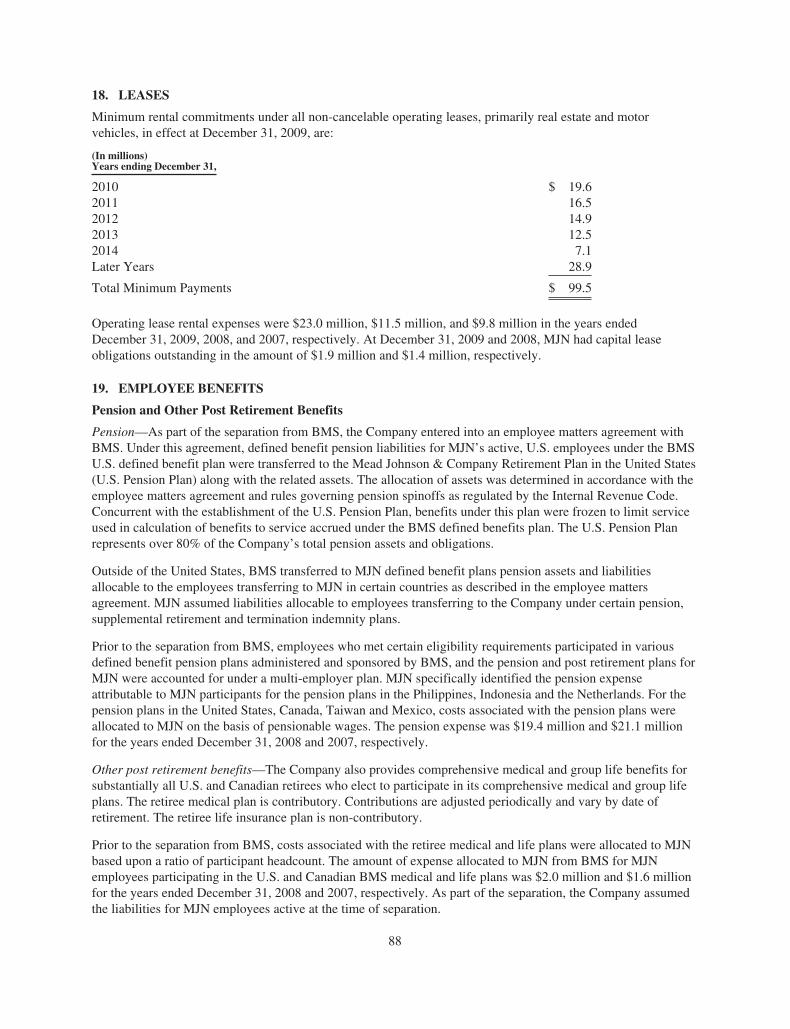
18. LEASES
Minimum rental commitments under all non-cancelable operating leases, primarily real estate and motorvehicles, in effect at December 31, 2009, are:
(In millions)Years ending December 31,
2010 $ 19.62011 16.52012 14.92013 12.52014 7.1Later Years 28.9
Total Minimum Payments $ 99.5
Operating lease rental expenses were $23.0 million, $11.5 million, and $9.8 million in the years endedDecember 31, 2009, 2008, and 2007, respectively. At December 31, 2009 and 2008, MJN had capital leaseobligations outstanding in the amount of $1.9 million and $1.4 million, respectively.
19. EMPLOYEE BENEFITS
Pension and Other Post Retirement Benefits
Pension—As part of the separation from BMS, the Company entered into an employee matters agreement withBMS. Under this agreement, defined benefit pension liabilities for MJN’s active, U.S. employees under the BMSU.S. defined benefit plan were transferred to the Mead Johnson & Company Retirement Plan in the United States(U.S. Pension Plan) along with the related assets. The allocation of assets was determined in accordance with theemployee matters agreement and rules governing pension spinoffs as regulated by the Internal Revenue Code.Concurrent with the establishment of the U.S. Pension Plan, benefits under this plan were frozen to limit serviceused in calculation of benefits to service accrued under the BMS defined benefits plan. The U.S. Pension Planrepresents over 80% of the Company’s total pension assets and obligations.
Outside of the United States, BMS transferred to MJN defined benefit plans pension assets and liabilitiesallocable to the employees transferring to MJN in certain countries as described in the employee mattersagreement. MJN assumed liabilities allocable to employees transferring to the Company under certain pension,supplemental retirement and termination indemnity plans.
Prior to the separation from BMS, employees who met certain eligibility requirements participated in variousdefined benefit pension plans administered and sponsored by BMS, and the pension and post retirement plans forMJN were accounted for under a multi-employer plan. MJN specifically identified the pension expenseattributable to MJN participants for the pension plans in the Philippines, Indonesia and the Netherlands. For thepension plans in the United States, Canada, Taiwan and Mexico, costs associated with the pension plans wereallocated to MJN on the basis of pensionable wages. The pension expense was $19.4 million and $21.1 millionfor the years ended December 31, 2008 and 2007, respectively.
Other post retirement benefits—The Company also provides comprehensive medical and group life benefits forsubstantially all U.S. and Canadian retirees who elect to participate in its comprehensive medical and group lifeplans. The retiree medical plan is contributory. Contributions are adjusted periodically and vary by date ofretirement. The retiree life insurance plan is non-contributory.
Prior to the separation from BMS, costs associated with the retiree medical and life plans were allocated to MJNbased upon a ratio of participant headcount. The amount of expense allocated to MJN from BMS for MJNemployees participating in the U.S. and Canadian BMS medical and life plans was $2.0 million and $1.6 millionfor the years ended December 31, 2008 and 2007, respectively. As part of the separation, the Company assumedthe liabilities for MJN employees active at the time of separation.
88
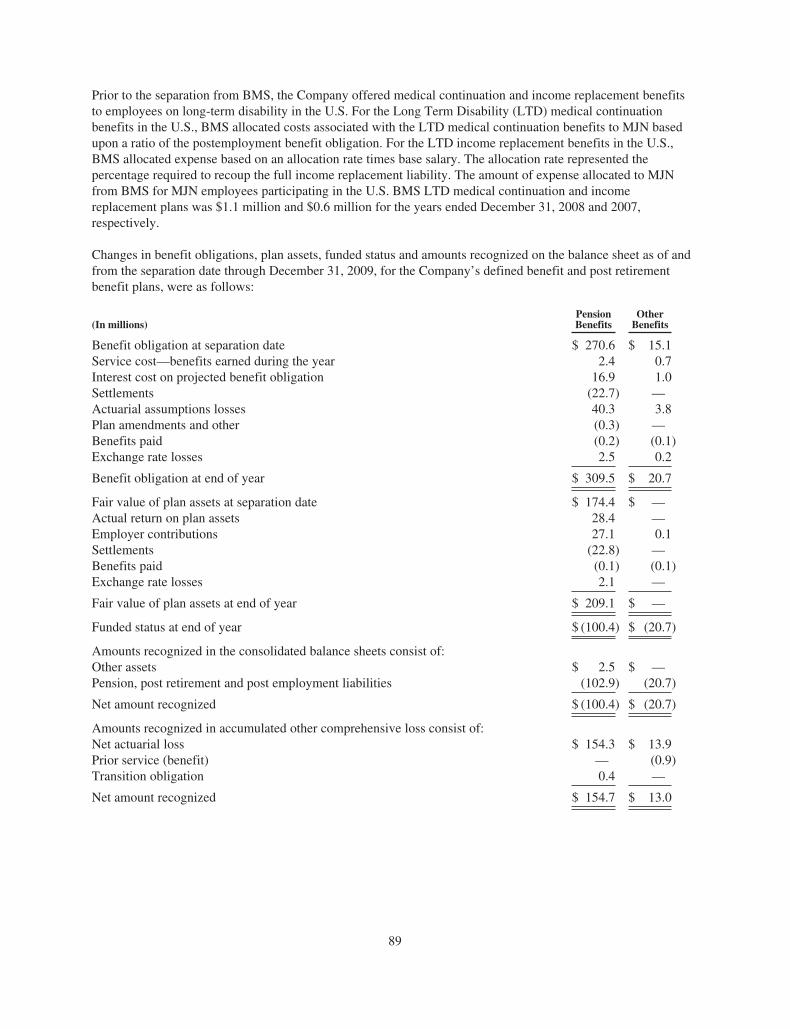
Prior to the separation from BMS, the Company offered medical continuation and income replacement benefitsto employees on long-term disability in the U.S. For the Long Term Disability (LTD) medical continuationbenefits in the U.S., BMS allocated costs associated with the LTD medical continuation benefits to MJN basedupon a ratio of the postemployment benefit obligation. For the LTD income replacement benefits in the U.S.,BMS allocated expense based on an allocation rate times base salary. The allocation rate represented thepercentage required to recoup the full income replacement liability. The amount of expense allocated to MJNfrom BMS for MJN employees participating in the U.S. BMS LTD medical continuation and incomereplacement plans was $1.1 million and $0.6 million for the years ended December 31, 2008 and 2007,respectively.
Changes in benefit obligations, plan assets, funded status and amounts recognized on the balance sheet as of andfrom the separation date through December 31, 2009, for the Company’s defined benefit and post retirementbenefit plans, were as follows:
(In millions)PensionBenefits
OtherBenefits
Benefit obligation at separation date $ 270.6 $ 15.1Service cost—benefits earned during the year 2.4 0.7Interest cost on projected benefit obligation 16.9 1.0Settlements (22.7) —Actuarial assumptions losses 40.3 3.8Plan amendments and other (0.3) —Benefits paid (0.2) (0.1)Exchange rate losses 2.5 0.2
Benefit obligation at end of year $ 309.5 $ 20.7
Fair value of plan assets at separation date $ 174.4 $ —Actual return on plan assets 28.4 —Employer contributions 27.1 0.1Settlements (22.8) —Benefits paid (0.1) (0.1)Exchange rate losses 2.1 —
Fair value of plan assets at end of year $ 209.1 $ —
Funded status at end of year $ (100.4) $ (20.7)
Amounts recognized in the consolidated balance sheets consist of:Other assets $ 2.5 $ —Pension, post retirement and post employment liabilities (102.9) (20.7)
Net amount recognized $ (100.4) $ (20.7)
Amounts recognized in accumulated other comprehensive loss consist of:Net actuarial loss $ 154.3 $ 13.9Prior service (benefit) — (0.9)Transition obligation 0.4 —
Net amount recognized $ 154.7 $ 13.0
89
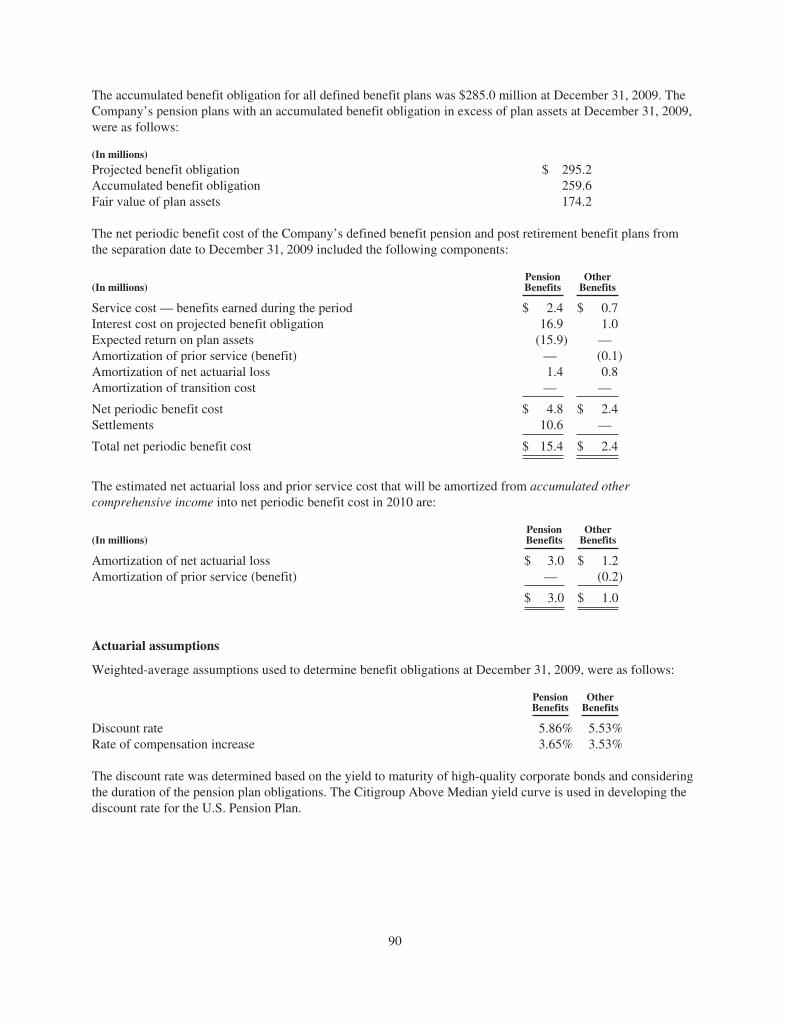
The accumulated benefit obligation for all defined benefit plans was $285.0 million at December 31, 2009. TheCompany’s pension plans with an accumulated benefit obligation in excess of plan assets at December 31, 2009,were as follows:
(In millions)
Projected benefit obligation $ 295.2Accumulated benefit obligation 259.6Fair value of plan assets 174.2
The net periodic benefit cost of the Company’s defined benefit pension and post retirement benefit plans fromthe separation date to December 31, 2009 included the following components:
(In millions)PensionBenefits
OtherBenefits
Service cost — benefits earned during the period $ 2.4 $ 0.7Interest cost on projected benefit obligation 16.9 1.0Expected return on plan assets (15.9) —Amortization of prior service (benefit) — (0.1)Amortization of net actuarial loss 1.4 0.8Amortization of transition cost — —
Net periodic benefit cost $ 4.8 $ 2.4Settlements 10.6 —
Total net periodic benefit cost $ 15.4 $ 2.4
The estimated net actuarial loss and prior service cost that will be amortized from accumulated othercomprehensive income into net periodic benefit cost in 2010 are:
(In millions)PensionBenefits
OtherBenefits
Amortization of net actuarial loss $ 3.0 $ 1.2Amortization of prior service (benefit) — (0.2)
$ 3.0 $ 1.0
Actuarial assumptions
Weighted-average assumptions used to determine benefit obligations at December 31, 2009, were as follows:
PensionBenefits
OtherBenefits
Discount rate 5.86% 5.53%Rate of compensation increase 3.65% 3.53%
The discount rate was determined based on the yield to maturity of high-quality corporate bonds and consideringthe duration of the pension plan obligations. The Citigroup Above Median yield curve is used in developing thediscount rate for the U.S. Pension Plan.
90
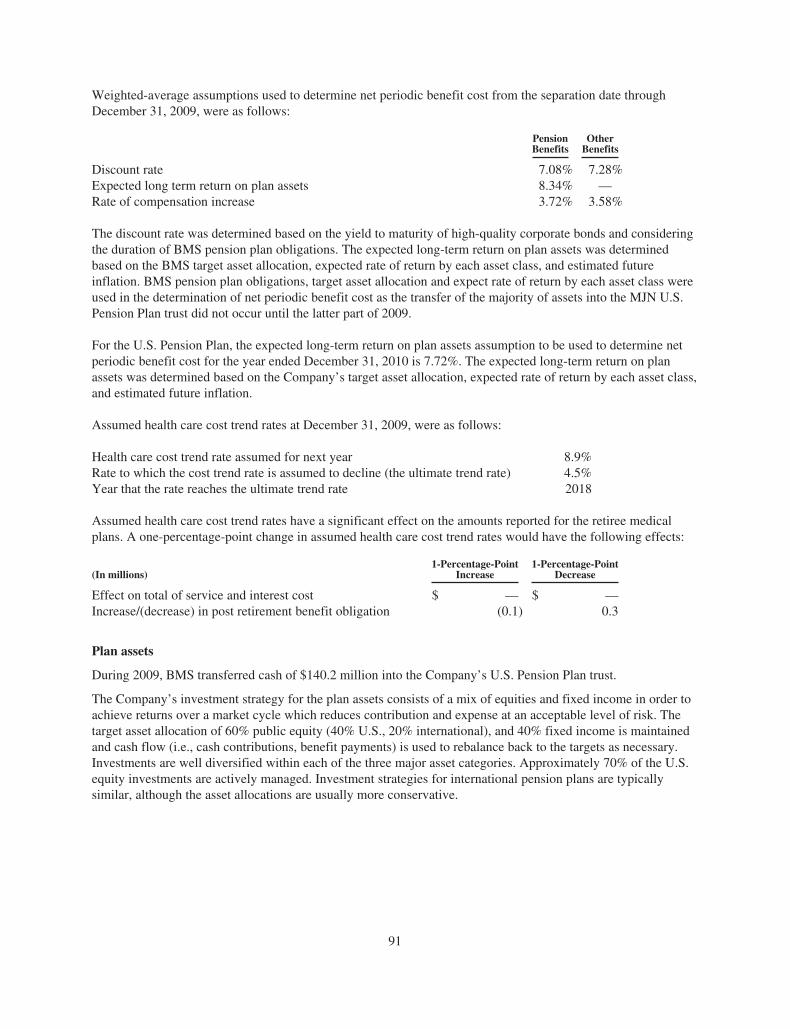
Weighted-average assumptions used to determine net periodic benefit cost from the separation date throughDecember 31, 2009, were as follows:
PensionBenefits
OtherBenefits
Discount rate 7.08% 7.28%Expected long term return on plan assets 8.34% —Rate of compensation increase 3.72% 3.58%
The discount rate was determined based on the yield to maturity of high-quality corporate bonds and consideringthe duration of BMS pension plan obligations. The expected long-term return on plan assets was determinedbased on the BMS target asset allocation, expected rate of return by each asset class, and estimated futureinflation. BMS pension plan obligations, target asset allocation and expect rate of return by each asset class wereused in the determination of net periodic benefit cost as the transfer of the majority of assets into the MJN U.S.Pension Plan trust did not occur until the latter part of 2009.
For the U.S. Pension Plan, the expected long-term return on plan assets assumption to be used to determine netperiodic benefit cost for the year ended December 31, 2010 is 7.72%. The expected long-term return on planassets was determined based on the Company’s target asset allocation, expected rate of return by each asset class,and estimated future inflation.
Assumed health care cost trend rates at December 31, 2009, were as follows:
Health care cost trend rate assumed for next year 8.9%Rate to which the cost trend rate is assumed to decline (the ultimate trend rate) 4.5%Year that the rate reaches the ultimate trend rate 2018
Assumed health care cost trend rates have a significant effect on the amounts reported for the retiree medicalplans. A one-percentage-point change in assumed health care cost trend rates would have the following effects:
(In millions)1-Percentage-Point
Increase1-Percentage-Point
Decrease
Effect on total of service and interest cost $ — $ —Increase/(decrease) in post retirement benefit obligation (0.1) 0.3
Plan assets
During 2009, BMS transferred cash of $140.2 million into the Company’s U.S. Pension Plan trust.
The Company’s investment strategy for the plan assets consists of a mix of equities and fixed income in order toachieve returns over a market cycle which reduces contribution and expense at an acceptable level of risk. Thetarget asset allocation of 60% public equity (40% U.S., 20% international), and 40% fixed income is maintainedand cash flow (i.e., cash contributions, benefit payments) is used to rebalance back to the targets as necessary.Investments are well diversified within each of the three major asset categories. Approximately 70% of the U.S.equity investments are actively managed. Investment strategies for international pension plans are typicallysimilar, although the asset allocations are usually more conservative.
91
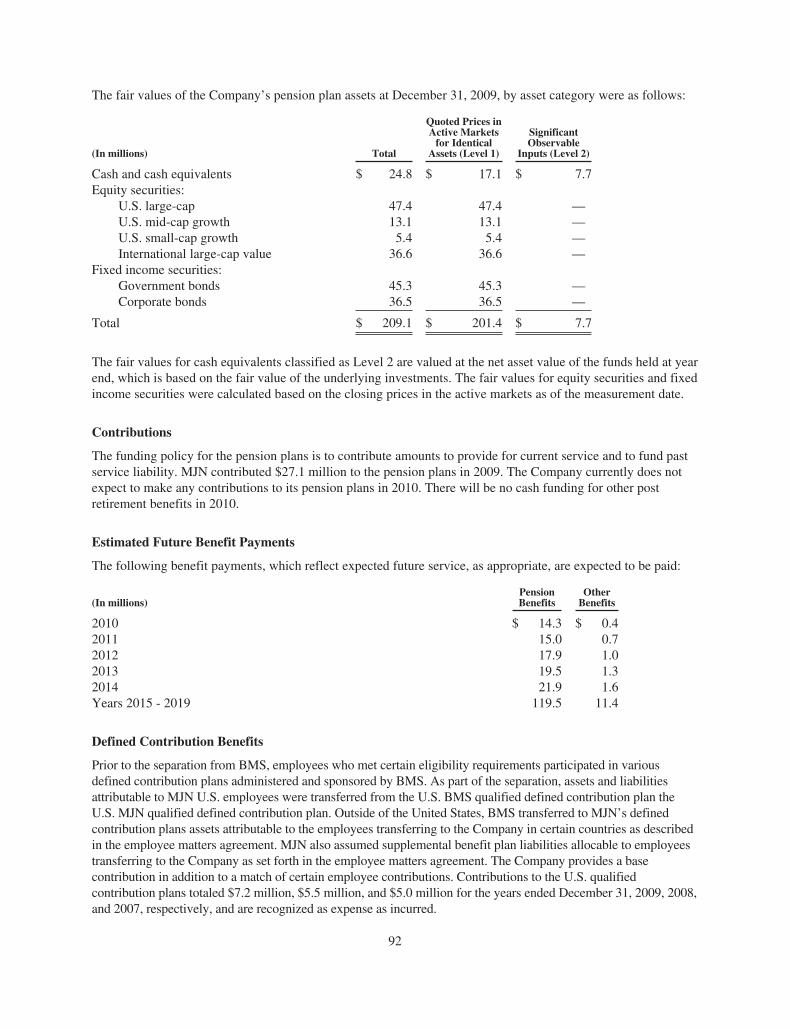
The fair values of the Company’s pension plan assets at December 31, 2009, by asset category were as follows:
(In millions) Total
Quoted Prices inActive Markets
for IdenticalAssets (Level 1)
SignificantObservable
Inputs (Level 2)
Cash and cash equivalents $ 24.8 $ 17.1 $ 7.7Equity securities:
U.S. large-cap 47.4 47.4 —U.S. mid-cap growth 13.1 13.1 —U.S. small-cap growth 5.4 5.4 —International large-cap value 36.6 36.6 —
Fixed income securities:Government bonds 45.3 45.3 —Corporate bonds 36.5 36.5 —
Total $ 209.1 $ 201.4 $ 7.7
The fair values for cash equivalents classified as Level 2 are valued at the net asset value of the funds held at yearend, which is based on the fair value of the underlying investments. The fair values for equity securities and fixedincome securities were calculated based on the closing prices in the active markets as of the measurement date.
Contributions
The funding policy for the pension plans is to contribute amounts to provide for current service and to fund pastservice liability. MJN contributed $27.1 million to the pension plans in 2009. The Company currently does notexpect to make any contributions to its pension plans in 2010. There will be no cash funding for other postretirement benefits in 2010.
Estimated Future Benefit Payments
The following benefit payments, which reflect expected future service, as appropriate, are expected to be paid:
(In millions)PensionBenefits
OtherBenefits
2010 $ 14.3 $ 0.42011 15.0 0.72012 17.9 1.02013 19.5 1.32014 21.9 1.6Years 2015 - 2019 119.5 11.4
Defined Contribution Benefits
Prior to the separation from BMS, employees who met certain eligibility requirements participated in variousdefined contribution plans administered and sponsored by BMS. As part of the separation, assets and liabilitiesattributable to MJN U.S. employees were transferred from the U.S. BMS qualified defined contribution plan theU.S. MJN qualified defined contribution plan. Outside of the United States, BMS transferred to MJN’s definedcontribution plans assets attributable to the employees transferring to the Company in certain countries as describedin the employee matters agreement. MJN also assumed supplemental benefit plan liabilities allocable to employeestransferring to the Company as set forth in the employee matters agreement. The Company provides a basecontribution in addition to a match of certain employee contributions. Contributions to the U.S. qualifiedcontribution plans totaled $7.2 million, $5.5 million, and $5.0 million for the years ended December 31, 2009, 2008,and 2007, respectively, and are recognized as expense as incurred.
92
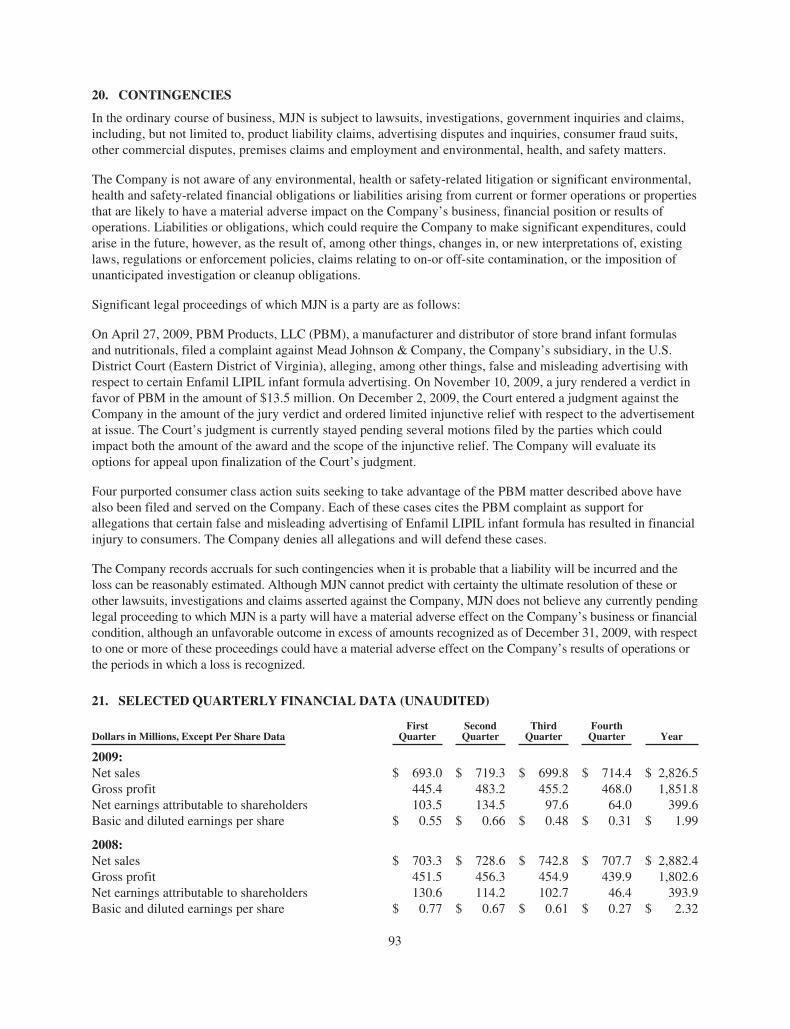
20. CONTINGENCIES
In the ordinary course of business, MJN is subject to lawsuits, investigations, government inquiries and claims,including, but not limited to, product liability claims, advertising disputes and inquiries, consumer fraud suits,other commercial disputes, premises claims and employment and environmental, health, and safety matters.
The Company is not aware of any environmental, health or safety-related litigation or significant environmental,health and safety-related financial obligations or liabilities arising from current or former operations or propertiesthat are likely to have a material adverse impact on the Company’s business, financial position or results ofoperations. Liabilities or obligations, which could require the Company to make significant expenditures, couldarise in the future, however, as the result of, among other things, changes in, or new interpretations of, existinglaws, regulations or enforcement policies, claims relating to on-or off-site contamination, or the imposition ofunanticipated investigation or cleanup obligations.
Significant legal proceedings of which MJN is a party are as follows:
On April 27, 2009, PBM Products, LLC (PBM), a manufacturer and distributor of store brand infant formulasand nutritionals, filed a complaint against Mead Johnson & Company, the Company’s subsidiary, in the U.S.District Court (Eastern District of Virginia), alleging, among other things, false and misleading advertising withrespect to certain Enfamil LIPIL infant formula advertising. On November 10, 2009, a jury rendered a verdict infavor of PBM in the amount of $13.5 million. On December 2, 2009, the Court entered a judgment against theCompany in the amount of the jury verdict and ordered limited injunctive relief with respect to the advertisementat issue. The Court’s judgment is currently stayed pending several motions filed by the parties which couldimpact both the amount of the award and the scope of the injunctive relief. The Company will evaluate itsoptions for appeal upon finalization of the Court’s judgment.
Four purported consumer class action suits seeking to take advantage of the PBM matter described above havealso been filed and served on the Company. Each of these cases cites the PBM complaint as support forallegations that certain false and misleading advertising of Enfamil LIPIL infant formula has resulted in financialinjury to consumers. The Company denies all allegations and will defend these cases.
The Company records accruals for such contingencies when it is probable that a liability will be incurred and theloss can be reasonably estimated. Although MJN cannot predict with certainty the ultimate resolution of these orother lawsuits, investigations and claims asserted against the Company, MJN does not believe any currently pendinglegal proceeding to which MJN is a party will have a material adverse effect on the Company’s business or financialcondition, although an unfavorable outcome in excess of amounts recognized as of December 31, 2009, with respectto one or more of these proceedings could have a material adverse effect on the Company’s results of operations orthe periods in which a loss is recognized.
21. SELECTED QUARTERLY FINANCIAL DATA (UNAUDITED)
Dollars in Millions, Except Per Share DataFirst
QuarterSecondQuarter
ThirdQuarter
FourthQuarter Year
2009:Net sales $ 693.0 $ 719.3 $ 699.8 $ 714.4 $ 2,826.5Gross profit 445.4 483.2 455.2 468.0 1,851.8Net earnings attributable to shareholders 103.5 134.5 97.6 64.0 399.6Basic and diluted earnings per share $ 0.55 $ 0.66 $ 0.48 $ 0.31 $ 1.99
2008:Net sales $ 703.3 $ 728.6 $ 742.8 $ 707.7 $ 2,882.4Gross profit 451.5 456.3 454.9 439.9 1,802.6Net earnings attributable to shareholders 130.6 114.2 102.7 46.4 393.9Basic and diluted earnings per share $ 0.77 $ 0.67 $ 0.61 $ 0.27 $ 2.32
93
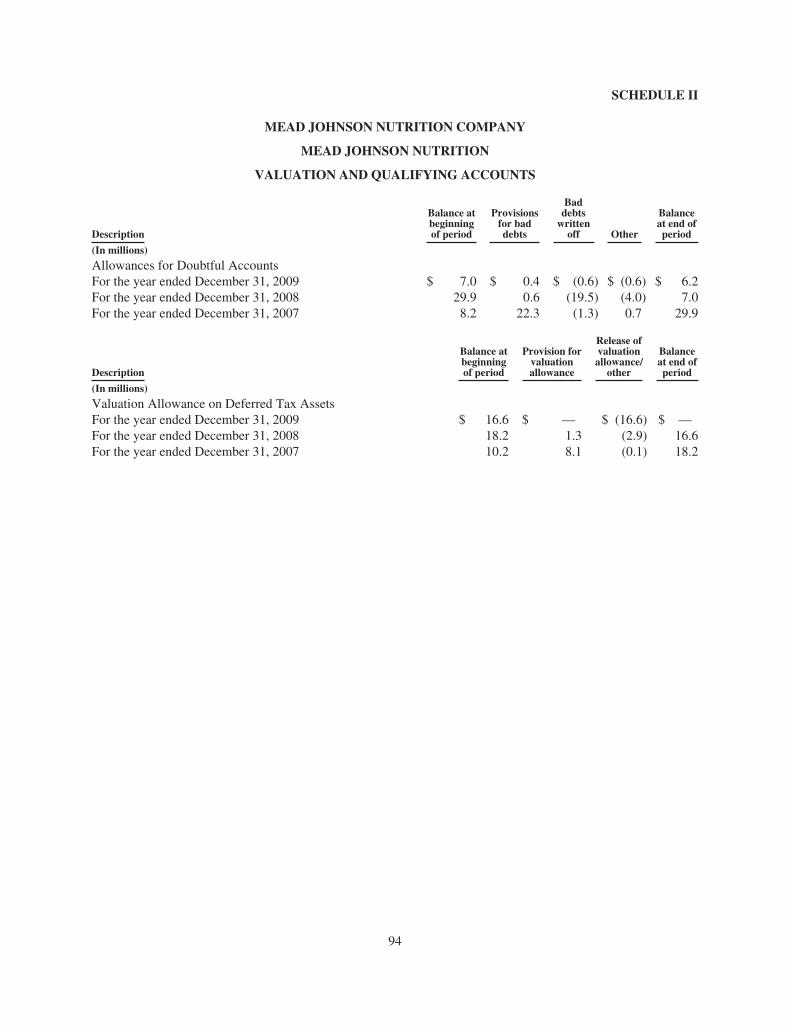
SCHEDULE II
MEAD JOHNSON NUTRITION COMPANY
MEAD JOHNSON NUTRITION
VALUATION AND QUALIFYING ACCOUNTS
Description
Balance atbeginningof period
Provisionsfor baddebts
Baddebts
writtenoff Other
Balanceat end ofperiod
(In millions)
Allowances for Doubtful AccountsFor the year ended December 31, 2009 $ 7.0 $ 0.4 $ (0.6) $ (0.6) $ 6.2For the year ended December 31, 2008 29.9 0.6 (19.5) (4.0) 7.0For the year ended December 31, 2007 8.2 22.3 (1.3) 0.7 29.9
Description
Balance atbeginningof period
Provision forvaluationallowance
Release ofvaluationallowance/
other
Balanceat end ofperiod
(In millions)
Valuation Allowance on Deferred Tax AssetsFor the year ended December 31, 2009 $ 16.6 $ — $ (16.6) $ —For the year ended December 31, 2008 18.2 1.3 (2.9) 16.6For the year ended December 31, 2007 10.2 8.1 (0.1) 18.2
94
Item 9. CHANGES IN AND DISAGREEMENTS WITH ACCOUNTANTS ON ACCOUNTING ANDFINANCIAL DISCLOSURE
None.
Item 9A. CONTROLS AND PROCEDURES
Conclusion Regarding the Effectiveness of Disclosure Controls and Procedures
Under the supervision and with the participation of our management, including the Chief Executive Officer andthe Chief Financial Officer of the company (its principal executive officer and principal financial officer,respectively), we have evaluated our disclosure controls and procedures (as defined in the Securities ExchangeAct of 1934 Rule 13a -15(e) and 15d-15(e)) as of December 31, 2009. Based upon that evaluation, the ChiefExecutive Officer and Chief Financial Officer have concluded that our disclosure controls and procedures wereeffective.
Management’s Report on Internal Control Over Financial Reporting
Management is responsible for establishing and maintaining adequate internal control over financial reporting.Under the supervision and with the participation of management, including the Chief Executive Officer andChief Financial Officer, management assessed the effectiveness of internal control over financial reporting as ofDecember 31, 2009, based on the framework in “Internal Control-Integrated Framework” issued by theCommittee of Sponsoring Organizations of the Treadway Commission. Based on that assessment, managementhas concluded that our internal control over financial reporting was effective at December 31, 2009, to providereasonable assurance regarding the reliability of our financial reporting and the preparation of our financialstatements for external purposes in accordance with U.S. generally accepted accounting principles. Due to itsinherent limitations, internal control over financial reporting may not prevent or detect misstatements.
Deloitte & Touche LLP, an independent registered public accounting firm, has audited our financial statementsincluded in this Annual Report on Form 10-K and issued its report on the effectiveness of our internal controlover financial reporting as of December 31, 2009, which is included herein.
Changes in Internal Control Over Financial Reporting
There has been no change in our internal control over financial reporting during the fourth quarter endedDecember 31, 2009, that has materially affected, or is reasonably likely to materially affect, our internal controlover financial reporting.
Item 9B. OTHER INFORMATION
None.
95
PART III
Item 10. DIRECTORS, EXECUTIVE OFFICERS AND CORPORATE GOVERNANCE
Code of Ethics
Information relating to corporate governance at Mead Johnson, including our Standards of Business Conduct andEthics, Code of Ethics for Senior Financial Officers, Code of Business Conduct and Ethics for Directors(collectively, the Codes), Corporate Governance Guidelines, and information concerning our Executive Officers,Board of Directors, including Board Committees and Committee charters, and transactions in Mead Johnsonsecurities by directors and executive officers, is available on our web site, www.meadjohnson.com, under the“Investors” caption and in print to any stockholder upon request. Any waivers to the Codes that may be grantedto directors or executive officers and any material amendments to the Code of Business Conduct and Ethics forDirectors and Code of Ethics for Senior Financial Officers will be posted promptly on our web site. You mayalso obtain a copy of our Codes by following the instructions in the section of this Annual Report on Form 10-Kentitled “Item 1. Business—Available Information.”
Reference is also made to the 2010 Proxy Statement to be filed on or about April 2, 2010, with respect to ourdirectors and corporate governance, which is incorporated herein by reference and made a part hereof in responseto information requested by Item 10.
The information required by Item 10 with respect to our executive officers has been included in Part IA of thisAnnual Report on Form 10-K in reliance on General Instruction G of Form 10-K and Instruction 3 to Item 401(b)of Regulation S-K.
Item 11. EXECUTIVE COMPENSATION
Reference is made to the 2010 Proxy Statement to be filed on or about April 2, 2010, with respect to ExecutiveCompensation, which is incorporated herein by reference and made a part hereof in response to informationrequested by Item 11.
Item 12. SECURITY OWNERSHIP OF CERTAIN BENEFICIAL OWNERS AND MANAGEMENTAND RELATED STOCKHOLDER MATTERS
Reference is made to the 2010 Proxy Statement to be filed on or about April 2, 2010, with respect to the securityownership of certain beneficial owners and management, which is incorporated herein by reference and made apart hereof in response to the information required by Item 12.
Reference is also made to the 2010 Proxy Statement to be filed on or about April 2, 2010, with respect to thenumber of shares of our common stock that could be issued under equity compensation plans as ofDecember 31, 2009, which is incorporated herein by reference and made a part hereof in response to theinformation required by Item 12.
Item 13. CERTAIN RELATIONSHIPS AND RELATED TRANSACTIONS, AND DIRECTORINDEPENDENCE
Reference is made to the 2010 Proxy Statement to be filed on or about April 2, 2010, with respect to certainrelationships and related transactions, and director independence, which is incorporated herein by reference andmade a part hereof in response to the information required by Item 13.
Item 14. PRINCIPAL ACCOUNTING FEES AND SERVICES
Reference is made to the 2010 Proxy Statement to be filed on or about April 2, 2010, with respect to principalaccounting fees and services, which is incorporated herein by reference and made a part hereof in response to theinformation required by Item 14.
96

PART IV
Item 15. EXHIBITS AND FINANCIAL STATEMENT SCHEDULE
The financial statements and schedule filed as part of this Annual Report on Form 10-K are listed in theaccompanying Index to Financial Statements and Financial Statement Schedule on page 57. The exhibits filed asa part of this Annual Report on Form 10-K are listed in the accompanying Exhibit Index on page 99.
97
SIGNATURES
Pursuant to the requirements of Section 13 or 15(d) of the Securities Exchange Act of 1934, the registranthas duly caused this report to be signed on its behalf by the undersigned, thereunto duly authorized.
MEAD JOHNSON NUTRITION COMPANY
Date: February 25, 2010 By: /S/ STANLEY D. BURHANS
Stanley D. BurhansVice President and Controller
Pursuant to the requirements of the Securities Exchange Act of 1934, this report has been signed below bythe following persons on behalf of the registrant and in the capacities and on the date indicated.
Date: February 25, 2010 By: /S/ STEPHEN W. GOLSBY
Stephen W. GolsbyPresident and Chief Executive Officer
(Principal Executive Officer)
Date: February 25, 2010 By: /S/ PETER G. LEEMPUTTE
Peter G. LeemputteSenior Vice President and Chief Financial Officer
(Principal Financial Officer)
Date: February 25, 2010 By: /S/ STANLEY D. BURHANS
Stanley D. BurhansVice President and Controller(Principal Accounting Officer)
Date: February 25, 2010 By: /S/ JAMES M. CORNELIUS
James M. CorneliusChairman of the Board of Directors
Date: February 25, 2010 By: /S/ STEVEN M. ALTSCHULER, M.D.Steven M. Altschuler, M.D.
Director
Date: February 25, 2010 By: /S/ HOWARD B. BERNICK
Howard B. BernickDirector
Date: February 25, 2010 By: /S/ PETER G. RATCLIFFE
Peter G. RatcliffeDirector
Date: February 25, 2010 By: /S/ ELLIOTT SIGAL, M.D., PH.D.Elliott Sigal, M.D., Ph.D.
Director
Date: February 25, 2010 By: /S/ ROBERT S. SINGER
Robert S. SingerDirector
98
EXHIBIT INDEX
ExhibitNumber Description
3 Articles of Incorporation and Bylaws
3.1 Second Amended and Restated Certificate of Incorporation of Mead Johnson Nutrition Company(incorporated by reference to Exhibit 3.1 to current report on Form 8-K filed on January 8, 2010)
3.2 Amended and Restated By-laws of Mead Johnson Nutrition Company (incorporated by reference toExhibit 3.1 to current report on Form 8-K filed on December 23, 2009)
4 Instruments defining the rights of the security holders, including indentures
4.1 Specimen Common Stock Certificate
4.2 Indenture, dated as of November 1, 2009, by and between Mead Johnson Nutrition Company andThe Bank of New York Mellon Trust Company, N.A., as trustee (incorporated by reference toExhibit 4.1 to current report on Form 8-K filed on November 12, 2009)
4.3 First Supplemental Indenture, dated as of November 5, 2009, by and among Mead Johnson NutritionCompany, Mead Johnson & Company and The Bank of New York Mellon Trust Company, N.A., astrustee (including forms of the 3.50% Notes due 2014, 4.90% Notes due 2019 and 5.90% Notes due2039 Notes) (incorporated by reference to Exhibit 4.2 to current report on Form 8-K filed onNovember 12, 2009)
4.4 Registration Rights Agreement, dated as of November 5, 2009, by and among Mead JohnsonNutrition Company, Mead Johnson & Company and Citigroup Global Markets Inc. and MorganStanley & Co. Incorporated, as representatives of the initial purchasers named therein (incorporatedby reference to Exhibit 4.3 to current report on Form 8-K filed on November 12, 2009)
4.5 Mead Johnson & Company Retirement Savings Plan (incorporated by reference to Exhibit 4.3 toregistration statement on Form S-8 (Registration No. 333-164606) filed on January 29, 2010)
4.6 First Amendment of Mead Johnson & Company Retirement Savings Plan (incorporated by referenceto Exhibit 4.4 to registration statement on Form S-8 (Registration No. 333-164606) filed onJanuary 29, 2010)
4.7 Mead Johnson Nutrition (Puerto Rico) Inc. Retirement Savings Plan (incorporated by reference toExhibit 4.5 to registration statement on Form S-8 (Registration No. 333-164606) filed on January 29,2010)
4.8 First Amendment of Mead Johnson Nutrition (Puerto Rico) Inc. Retirement Savings Plan(incorporated by reference to Exhibit 4.6 to registration statement on Form S-8 (Registration No.333-164606) filed on January 29, 2010)
10 Material Contracts
10.1 Separation Agreement by and between Bristol-Myers Squibb Company and Mead Johnson NutritionCompany, dated January 31, 2009 (incorporated by reference to Exhibit 10.1 to annual report onForm 10-K for the fiscal year ended December 31, 2008 filed on March 27, 2009)
10.2 Employee Matters Agreement between Bristol-Myers Squibb Company and Mead Johnson NutritionCompany, dated January 31, 2009 (incorporated by reference to Exhibit 10.2 to annual report onForm 10-K for the fiscal year ended December 31, 2008 filed on March 27, 2009)
10.3 First Amended and Restated Transitional Services Agreement between Bristol-Myers SquibbCompany and Mead Johnson Nutrition Company, dated December 18, 2009
10.4 Second Amended and Restated Transitional Services Agreement between Bristol-Myers SquibbCompany and Mead Johnson Nutrition, dated December 18, 2009
99
ExhibitNumber Description
10.5 Registration Rights Agreement between Mead Johnson Nutrition Company and Bristol-MyersSquibb Company, dated February 17, 2009 (incorporated by reference to Exhibit 10.4 to annualreport on Form 10-K for the fiscal year ended December 31, 2008 filed on March 27, 2009)
10.6 Amended and Restated Tax Matters Agreement between Bristol-Myers Squibb Company and MeadJohnson Nutrition Company dated December 18, 2009 (incorporated by reference to Exhibit 10.1 tocurrent report on Form 8-K filed on December 23, 2009)
10.7 Amended and Restated China Services Agreement between Bristol-Myers Squibb Company andMead Johnson Nutrition Company, dated December 18, 2009 (incorporated by reference to Exhibit10.2 to current report on Form 8-K filed on December 23, 2009)
10.8 Three Year Revolving Credit Facility Agreement, dated February 17, 2009 (incorporated byreference to Exhibit 10.1 to current report on Form 8-K filed on February 20, 2009)
10.9 First Amendment and Consent to the Three Year Revolving Credit Facility Agreement, dated as ofNovember 5, 2009, among Mead Johnson Nutrition Company, Mead Johnson & Company, variousfinancial institutions and JPMorgan Chase Bank, N.A., as Administrative Agent (incorporated byreference to Exhibit 4.4 to current report on Form 8-K filed on November 12, 2009)
10.10 Third Amendment to the Three Year Revolving Credit Facility, dated as of December 17, 2009,among Mead Johnson Nutrition Company, Mead Johnson & Company, various financial institutionsand JPMorgan Chase Bank, N.A., as Administrative Agent (incorporated by reference to Exhibit 10.1to current report on Form 8-K filed on December 17, 2009)
10.11† Supply Agreement by and between Mead Johnson & Company and Martek Biosciences Corporation,dated as of January 1, 2006 (incorporated by reference to Exhibit 10.18 to registration statement onForm S-1 (Registration No. 333-156298) filed on December 19, 2008)
10.12* Retention Agreement between Bristol-Myers Squibb Company and Stephen W. Golsby, dated as ofNovember 12, 2007, and as amended August 5, 2008 (incorporated by reference to Exhibit 10.1 toregistration statement on Form S-1 (Registration No. 333-156298) filed on December 19, 2008)
10.13* Retention Agreement between Bristol-Myers Squibb Company and Charles M. Urbain, dated as ofNovember 7, 2007, and as amended August 11, 2008 (incorporated by reference to Exhibit 10.2 toregistration statement on Form S-1 (Registration No. 333-156298) filed on December 19, 2008)
10.14* Retention Agreement between Bristol-Myers Squibb Company and Peter Kasper Jakobsen, dated asof November 5, 2007, and as amended August 11, 2008 (incorporated by reference to Exhibit 10.3 toregistration statement on Form S-1 (Registration No. 333-156298) filed on December 19, 2008)
10.15* Retention Agreement between Bristol-Myers Squibb Company and Dirk H. Hondmann, dated as ofOctober 30, 2007, and as amended August 11, 2008 (incorporated by reference to Exhibit 10.24 toAmendment No. 1 to registration statement on Form S-1 (Registration No. 333-156298) filed onJanuary 14, 2009)
10.16* Offer Letter to Peter G. Leemputte, dated September 2, 2008 (incorporated by reference toExhibit 10.11 to registration statement on Form S-1 (Registration No. 333-156298) filed onDecember 19, 2008)
10.17* Bristol-Myers Squibb Company 2007 Stock Award and Incentive Plan, as amended and restated,effective as of June 10, 2008 (incorporated by reference to Exhibit 10.14 to registration statement onForm S-1 (Registration No. 333-156298) filed on December 19, 2008)
10.18* Bristol-Myers Squibb Company 2002 Stock Incentive Plan, as amended and restated, effectiveJune 10, 2008 (incorporated by reference to Exhibit 10.15 to registration statement on Form S-1(Registration No. 333-156298) filed on December 19, 2008)
100
ExhibitNumber Description
10.19* Bristol-Myers Squibb Company TeamShare Stock Option Plan, as amended and restated, effectiveSeptember 10, 2002 (incorporated by reference to Exhibit 10.16 to registration statement on Form S-1 (Registration No. 333-156298) filed on December 19, 2008)
10.20* Bristol-Myers Squibb Company 1997 Stock Incentive Plan, effective as of May 6, 1997 as amendedand restated, effective July 16, 2002 (incorporated by reference to Exhibit 10.17 to registrationstatement on Form S-1 (Registration No. 333-156298) filed on December 19, 2008)
10.21* Mead Johnson Nutrition Company 2009 Stock Award and Incentive Plan (incorporated by referenceto Exhibit 10.28 to annual report on Form 10-K for the fiscal year ended December 31, 2008 filed onMarch 27, 2009)
10.22* Mead Johnson Nutrition Company 2009 Senior Executive Performance Incentive Plan (incorporatedby reference to Exhibit 10.29 to annual report on Form 10-K for the fiscal year ended December 31,2008 filed on March 27, 2009)
10.23* Mead Johnson & Company Benefit Equalization Plan-Retirement Plan (incorporated by reference toExhibit 10.31 to annual report on Form 10-K for the fiscal year ended December 31, 2008 filed onMarch 27, 2009)
10.24* Mead Johnson & Company Benefit Equalization Plan-Retirement Savings Plan (incorporated byreference to Exhibit 10.32 to annual report on Form 10-K for the fiscal year ended December 31,2008 filed on March 27, 2009)
10.25* Mead Johnson & Company Key International Pension Plan (incorporated by reference toExhibit 10.33 to annual report on Form 10-K for the fiscal year ended December 31, 2008 filed onMarch 27, 2009)
10.26* Mead Johnson & Company LLC Senior Executive Severance Plan (incorporated by reference toExhibit 10.3 to current report on Form 8-K filed on December 23, 2009)
10.27* Mead Johnson & Company LLC Senior Executive Change In Control Severance Plan (incorporatedby reference to Exhibit 10.4 to current report on Form 8-K filed on December 23, 2009)
10.28* Form of Nonqualified Stock Option Agreement (incorporated by reference to Exhibit 10.34 to annualreport on Form 10-K for the fiscal year ended December 31, 2008 filed on March 27, 2009)
10.29* Form of Performance Shares Agreement (incorporated by reference to Exhibit 10.35 to annual reporton Form 10-K for the fiscal year ended December 31, 2008 filed on March 27, 2009)
10.30* Form of Director Restricted Stock Units Agreement (incorporated by reference to Exhibit 10.36 toannual report on Form 10-K for the fiscal year ended December 31, 2008 filed on March 27, 2009)
10.31* Form of Employee Restricted Stock Units Agreement (incorporated by reference to Exhibit 10.37 toannual report on Form 10-K for the fiscal year ended December 31, 2008 filed on March 27, 2009)
10.32* Form of Restricted Stock Units Agreement (incorporated by reference to Exhibit 10.5 to currentreport on Form 8-K filed on December 23, 2009)
21 Subsidiaries of the Registrant
21.1 Subsidiaries of the Registrant
23 Consents of experts and counsel
23.1 Consent of Deloitte & Touche LLP
31 Rule 13a-15(c) and 15(d) - 15(e) Certifications
101
ExhibitNumber Description
31.1 Certification of the Chief Executive Officer
31.2 Certification of the Chief Financial Officer
32 Section 1350 Certifications pursuant to 18 U.S.C. Section 1350, as adopted pursuant to Section906 of the Sarbanes-Oxley Act of 2002
32.1 Certification of the Chief Executive Officer
32.2 Certification of the Chief Financial Officer
† Confidential treatment has been granted for certain portions which are omitted in the copy of the exhibitelectronically filed with the SEC. The omitted information has been filed separately with the SEC pursuant toour application for confidential treatment.
* Compensatory plan or arrangement
102
Exhibit 31.1
Certification of the Chief Executive Officer
I, Stephen W. Golsby, certify that:
1. I have reviewed this Annual Report on Form 10-K of Mead Johnson Nutrition Company;
2. Based on my knowledge, this report does not contain any untrue statement of a material fact or omit to statea material fact necessary to make the statements made, in light of the circumstances under which suchstatements were made, not misleading with respect to the period covered by this report;
3. Based on my knowledge, the financial statements, and other financial information included in this report,fairly present in all material respects the financial condition, results of operations and cash flows of theregistrant as of, and for, the periods presented in this report;
4. The registrant’s other certifying officer(s) and I are responsible for establishing and maintaining disclosurecontrols and procedures (as defined in Exchange Act Rules 13a-15(e) and 15d-15(e)) for the registrant andhave:
(a) designed such disclosure controls and procedures, or caused such disclosure controls and procedures tobe designed under our supervision, to ensure that material information relating to the registrant,including its consolidated subsidiaries, is made known to us by others within those entities, particularlyduring the period in which this report is being prepared;
(b) designed such internal control over financial reporting, or caused such internal control over financialreporting to be designed under our supervision, to provide reasonable assurance regarding thereliability of financial reporting and the preparation of financial statements for external purposes inaccordance with generally accepted accounting principles;
(c) evaluated the effectiveness of the registrant’s disclosure controls and procedures and presented in thisreport our conclusions about the effectiveness of the disclosure controls and procedures, as of the endof the period covered by this report based on such evaluation; and
(d) disclosed in this report any change in the registrant’s internal control over financial reporting thatoccurred during the registrant’s most recent fiscal quarter (the registrant’s fourth fiscal quarter in thecase of an annual report) that has materially affected, or is reasonably likely to materially affect, theregistrant’s internal control over financial reporting; and
5. The registrant’s other certifying officer(s) and I have disclosed, based on our most recent evaluation ofinternal control over financial reporting, to the registrant’s auditors and the audit committee of theregistrant’s board of directors (or persons performing the equivalent functions):
(a) all significant deficiencies and material weaknesses in the design or operation of internal control overfinancial reporting which are reasonably likely to adversely affect the registrant’s ability to record,process, summarize and report financial information; and
(b) any fraud, whether or not material, that involves management or other employees who have asignificant role in the registrant’s internal control over financial reporting.
Date: February 25, 2010 By: /S/ STEPHEN W. GOLSBY
Stephen W. Golsby
President and Chief Executive Officer
Exhibit 31.2
Certification of the Chief Financial Officer
I, Peter G. Leemputte, certify that:
1. I have reviewed this Annual Report on Form 10-K of Mead Johnson Nutrition Company;
2. Based on my knowledge, this report does not contain any untrue statement of a material fact or omit to statea material fact necessary to make the statements made, in light of the circumstances under which suchstatements were made, not misleading with respect to the period covered by this report;
3. Based on my knowledge, the financial statements, and other financial information included in this report,fairly present in all material respects the financial condition, results of operations and cash flows of theregistrant as of, and for, the periods presented in this report;
4. The registrant’s other certifying officer(s) and I are responsible for establishing and maintaining disclosurecontrols and procedures (as defined in Exchange Act Rules 13a-15(e) and 15d-15(e)) for the registrant andhave:
(a) designed such disclosure controls and procedures, or caused such disclosure controls and procedures tobe designed under our supervision, to ensure that material information relating to the registrant,including its consolidated subsidiaries, is made known to us by others within those entities, particularlyduring the period in which this report is being prepared;
(b) designed such internal control over financial reporting, or caused such internal control over financialreporting to be designed under our supervision, to provide reasonable assurance regarding thereliability of financial reporting and the preparation of financial statements for external purposes inaccordance with generally accepted accounting principles;
(c) evaluated the effectiveness of the registrant’s disclosure controls and procedures and presented in thisreport our conclusions about the effectiveness of the disclosure controls and procedures, as of the endof the period covered by this report based on such evaluation; and
(d) disclosed in this report any change in the registrant’s internal control over financial reporting thatoccurred during the registrant’s most recent fiscal quarter (the registrant’s fourth fiscal quarter in thecase of an annual report) that has materially affected, or is reasonably likely to materially affect, theregistrant’s internal control over financial reporting; and
5. The registrant’s other certifying officer(s) and I have disclosed, based on our most recent evaluation ofinternal control over financial reporting, to the registrant’s auditors and the audit committee of theregistrant’s board of directors (or persons performing the equivalent functions):
(a) all significant deficiencies and material weaknesses in the design or operation of internal control overfinancial reporting which are reasonably likely to adversely affect the registrant’s ability to record,process, summarize and report financial information; and
(b) any fraud, whether or not material, that involves management or other employees who have asignificant role in the registrant’s internal control over financial reporting.
Date: February 25, 2010 By: /S/ PETER G. LEEMPUTTE
Peter G. Leemputte
Senior Vice President and Chief Financial Officer
Exhibit 32.1
Certification Pursuant to Section 1350 of Chapter 63of Title 18 of the United States Code
I, Stephen W. Golsby, Chief Executive Officer of Mead Johnson Nutrition Company, certify that (i) MeadJohnson Nutrition Company’s Annual Report on Form 10-K for the fiscal year ended December 31, 2009, fullycomplies with the requirements of Section 13(a) or 15(d) of the Securities Exchange Act of 1934 and (ii) theinformation contained in Mead Johnson Nutrition Company’s Annual Report on Form 10-K for the fiscal yearended December 31, 2009, fairly presents, in all material respects, the financial condition and results ofoperations of Mead Johnson Nutrition Company.
Date: February 25, 2010 By: /S/ STEPHEN W. GOLSBY
Stephen W. Golsby
President and Chief Executive Officer
Exhibit 32.2
Certification Pursuant to Section 1350 of Chapter 63of Title 18 of the United States Code
I, Peter G. Leemputte, Chief Financial Officer of Mead Johnson Nutrition Company, certify that (i) MeadJohnson Nutrition Company’s Annual Report on Form 10-K for the fiscal year ended December 31, 2009, fullycomplies with the requirements of Section 13(a) or 15(d) of the Securities Exchange Act of 1934 and (ii) theinformation contained in Mead Johnson Nutrition Company’s Annual Report on Form 10-K for the fiscal yearended December 31, 2009, fairly presents, in all material respects, the financial condition and results ofoperations of Mead Johnson Nutrition Company.
Date: February 25, 2010 By: /S/ PETER G. LEEMPUTTE
Peter G. Leemputte
Senior Vice President and Chief Financial Officer