
MDOT US-23 Improvements EA Traffic Report€¦ · 3 2. Existing Traffic Conditions Study Area The...
56
US-23 Improvements Traffic Report US-23/M-14 to Silver Lake Road Ann Arbor Charter Township and Northfield Township, Washtenaw County and Green Oak Township, Livingston County JN 123214 CS 81075 and 47013 Prepared by the Michigan Department of Transportation January 2015
Transcript of MDOT US-23 Improvements EA Traffic Report€¦ · 3 2. Existing Traffic Conditions Study Area The...
US-23 Improvements Traffic Report
US-23/M-14 to Silver Lake Road Ann Arbor Charter Township and Northfield Township,
Washtenaw County and Green Oak Township, Livingston County
JN 123214 CS 81075 and 47013
Prepared by the Michigan Department of Transportation
January 2015

i
ii
1. Background ........................................................................................................................................... 1
2. Existing Traffic Conditions ..................................................................................................................... 3
Study Area ................................................................................................................................................. 3
Peak Hour Conditions ............................................................................................................................... 4
Incident Management ............................................................................................................................... 5
Crash History ............................................................................................................................................. 5
US-23 Freeway ...................................................................................................................................... 5
US-23 Ramps ......................................................................................................................................... 6
US-23 Ramp Terminals .......................................................................................................................... 6
Existing Traffic Volumes ............................................................................................................................ 7
Methodology ............................................................................................................................................. 7
Freeway Analysis ....................................................................................................................................... 8
Signalized and Unsignalized Intersection Analysis .................................................................................. 11
US-23 and 6 Mile Rd. Interchange ...................................................................................................... 12
US-23 and 8 Mile Rd. Interchange ...................................................................................................... 12
US-23 and North Territorial Rd. Interchange ...................................................................................... 12
Other US-23 Interchanges ................................................................................................................... 12
3. No-Build (2040) Traffic Conditions ...................................................................................................... 15
Traffic Forecast ....................................................................................................................................... 15
Freeway Analysis ..................................................................................................................................... 15
Signalized and Unsignalized Intersection Analysis .................................................................................. 17
US-23 and 6 Mile Rd. Interchange ...................................................................................................... 18
US-23 and 8 Mile Rd. Interchange ...................................................................................................... 18
US-23 and North Territorial Rd. Interchange ...................................................................................... 18
Other US-23 Interchanges ................................................................................................................... 18
4. Build Alternatives ................................................................................................................................ 21
Transportation System Management (TSM) .......................................................................................... 21
Traffic Forecast.................................................................................................................................... 21
Freeway Analysis ................................................................................................................................. 21
Signalized and Unsignalized Intersection Analysis .............................................................................. 23
Ramp Metering ....................................................................................................................................... 25
Traffic Forecast ................................................................................................................................... 25

iii
Freeway Analysis ................................................................................................................................ 25
Signalized and Unsignalized Intersection Analysis .............................................................................. 27
Active Traffic Management (ATM) with General Purpose Dynamic Shoulder Use ................................ 28
Traffic Forecast.................................................................................................................................... 28
Freeway Analysis ................................................................................................................................. 28
Signalized and Unsignalized Intersection Analysis .............................................................................. 32
Active Traffic Management with High Occupancy Vehicle (ATM-HOV) Dynamic Shoulder Use ............ 33
Traffic Forecast.................................................................................................................................... 33
Freeway Analysis ................................................................................................................................. 33
Signalized and Unsignalized Intersection Analysis .............................................................................. 37
US-23/M-14 Mitigation ........................................................................................................................... 38
5. Comparative Analysis .......................................................................................................................... 41
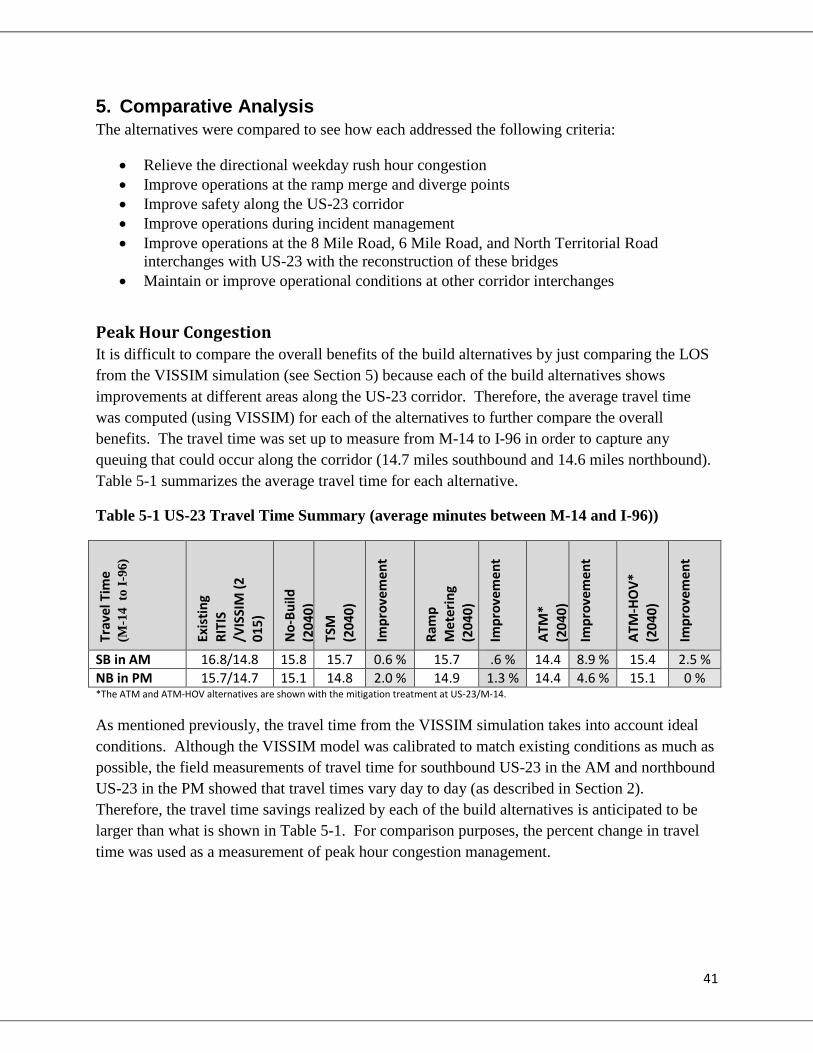
Peak Hour Congestion ............................................................................................................................. 41
Ramp Operation ...................................................................................................................................... 42
Safety ...................................................................................................................................................... 43
Incident Management ............................................................................................................................. 44
Interchange Operations (Intersection Analysis) ..................................................................................... 44
6. Summary ............................................................................................................................................. 49

iv

v

1
1. Background The Michigan Department of Transportation (MDOT) has proposed a project within the US-23 corridor between the west US-23/M-14 interchange and Silver Lake Road interchange to address the need to upgrade the operational and structural conditions of the roads and bridges.
The purpose and need of this project is described within the “Purpose and Need” section of the US-23 Improvements Environmental Assessment.
Several alternatives were considered to address the Purpose and Need. Descriptions of the alternatives that were dismissed prior to detailed traffic analysis can also be found in the Environmental Assessment. The following alternatives were considered for further study and are included in the detailed traffic analysis:
• No-Build • Transportation System Management (TSM) • Ramp Metering • Active Traffic Management (ATM) with General Purpose Dynamic Shoulder Use • Active Traffic Management with HOV Dynamic Shoulder Use (ATM-HOV)
No-Build The No-Build alternative is used as a baseline for the future year (2040) in which to compare each of the build alternatives. The No-Build alternative assumes that there are no physical or operational improvements made within the study area. Transportation System Management (TSM) The TSM alternative assumes that minor operational improvement or traffic management techniques are applied within the study area. Intersection signal timing changes and extension of storage lanes are examples of TSM techniques. Also, as part of the TSM alternative, operational studies were performed for the three bridges that would be reconstructed. Any improvements needed for these interchange were a result of the bridge capacity study. These improvements are also a part of this alternative. Ramp Metering The Ramp Metering alternative would also consist of all of the improvements proposed under the TSM alternative. In addition, this alternative would include metering of the following on-ramps:
• 6 Mile Road On-Ramp to southbound (SB) US-23 • 8 Mile Road On-ramp to southbound (SB) US-23 • M-36 On-Ramp to southbound (SB) US-23 • M-36 On-Ramp to northbound (NB) US-23
2
Active Traffic Management (ATM) with General Purpose Dynamic Shoulder Use The ATM with General Purpose Dynamic Shoulder Use, referred to in this report as ATM, would consist of all of the improvements included in the TSM alternative and:
• Lane control signals and dynamic messaging at gantries spaced ½ to 1 mile apart • Median shoulder use for all drivers in the southbound direction during the morning peak • Median shoulder use for all drivers in the northbound direction during the afternoon peak • Median shoulder use for all drivers during incidents • Crash investigation sites at several locations along the freeway
Active Traffic Management with High Occupancy Vehicle (ATM-HOV) Dynamic Shoulder Use The ATM-HOV alternative would be constructed the same as the ATM-General Purpose alternative, but during the directional peaks, the shoulder would only be open to vehicles that had two or more passengers. During incident management, the shoulder would be open to all users. This traffic reports summarizes the methodology and results of the traffic analysis for each of these alternatives.
3
2. Existing Traffic Conditions
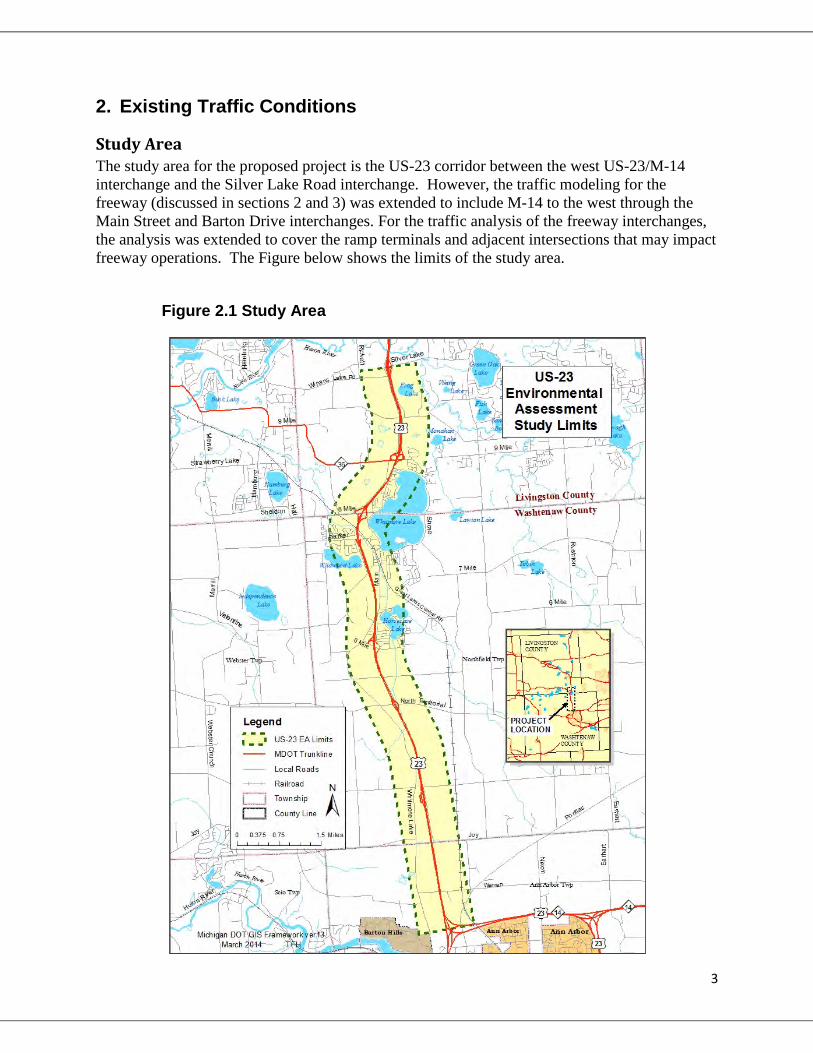
Study Area The study area for the proposed project is the US-23 corridor between the west US-23/M-14 interchange and the Silver Lake Road interchange. However, the traffic modeling for the freeway (discussed in sections 2 and 3) was extended to include M-14 to the west through the Main Street and Barton Drive interchanges. For the traffic analysis of the freeway interchanges, the analysis was extended to cover the ramp terminals and adjacent intersections that may impact freeway operations. The Figure below shows the limits of the study area.
Figure 2.1 Study Area

4
Peak Hour Conditions US-23 is a north/south rural freeway with two lanes in each direction. The Average Daily Traffic (ADT) on US-23 between the west US-23/M-14 interchange and Silver Lake Road interchange ranges from about 60,000 to 65,0000 vehicles per day. In addition, it experiences heavy directional traffic volumes during the weekday peak commuting hours with a directional peak for southbound in the morning and northbound in the late afternoon. Based on field observations and congestion scans created using the Regional Integrated Transportation Information Software (RITIS) that tracks vehicle speeds along the corridor, it was observed that typical commuting traffic heading southbound in the morning and northbound in the afternoon experiences recurring congestion. Figure 2.2 demonstrates the occurrence of peak hour congestion along this corridor during the morning peak hour in the southbound direction during the fall. This condition is at its worse from the fall to the spring, when the University of Michigan and public schools are in session.
Figure 2.2: Existing Congestion on US-23 for Southbound Traffic

5
Figure 2.3 demonstrates the congestion that occurs in the northbound direction in the afternoon on a typical summer weekday. This condition is worse during the summer months because of the addition of recreational traffic to and from northern Michigan. Additional RITIS output that demonstrates the seasonal fluctuations in directional congestion is included in Appendix A-1.
Figure 2.3: Existing Congestion on US-23 for Northbound Traffic
Incident Management According to the MDOT’s Freeway Courtesy Patrol reports, the section of US-23 between the cities of Ann Arbor and Brighton experiences approximately 4 traffic incidents per day that cause traffic congestion. Mechanical failure is the typical incident with the occasional minor collision due to the bumper-to-bumper traffic experienced during the periods of congestion. These incidents and a lack of redundancy in the local road network adjacent to this segment create traffic flow delays. The traffic delays are exacerbated by the lack of areas (such as emergency pull-of areas) for those involved in the incident to safely pull off the roadway.
Crash History
US-23 Freeway US-23 crash data was collected for a three year period from January 1, 2009 through December 31, 2010 and from January 1, 2013 through December 31, 2013. The years of 2011 and 2012 were omitted from the data since construction was taking place along the corridor. For the three year period, there were 845 crashes, with thirty-three percent of the crashes occurring during

6
icy/wet conditions and 31% during dark conditions. There were two fatalities and 13 severe injuries during the three year period.
The predominant crash pattern along the US-23 corridor was rear-end crashes due to slowing or stopped traffic during the AM peak for SB US-23 and during the PM peak for NB US-23. Approximately 46% of the fixed object crashes occurred during snowy/icy conditions.
US-23 Freeway Crash Countermeasures A variety of countermeasures should be considered to decrease the potential for traffic crashes for the entire US-23 corridor. These countermeasures include:
• Making operational improvements to reduce freeway congestion and other unexpected traffic backups
• Improving the enforcement area by providing wider shoulders and/or providing crash investigation sites to provide the needed storage for disabled vehicles. This would consequently alleviate the potential congestion due to incidents
• Lengthening of acceleration lanes at ramps to increase ramp-freeway merge capacity and reduce conflicts on mainline US-23
• Improve drainage and increase surface friction
US-23 Ramps Within the US-23 ramp areas, the predominant pattern was rear-end crashes due to slowing or stopped traffic during the peak periods. There were also clusters of fixed object type crashes within the ramp areas and crashes associated with merging traffic at the US-23 entrance ramps and the west US-23/M-14 interchange. The US-23 at North Territorial Road ramp terminals experienced a cluster of rear-end type crashes.
US-23 Ramp Crash Countermeasures Various countermeasures should be considered which will decrease the potential for traffic crashes in the ramp areas. These countermeasures include:
• Increased storage for off-ramp approaches • Lengthening of acceleration lanes at some ramps to increase ramp-freeway merge
capacity and reduce conflicts on mainline US-23 • Improved signing and attenuation for all ramp movements which require a significant
decrease in speed in order to navigate the ramp • Improve drainage and increase surface friction.
US-23 Ramp Terminals Crashes were also analyzed for the three interchanges that are being reconstructed: 8 Mile Rd., North Territorial Rd., and 6 Mile Rd.
7
There were a total of 13 crashes on 8 Mile Road between Whitmore Lake Road and the NB US-23 interchange ramps. The predominant crash type consisted of rear-ends due to motorists not being able to stop in time. There were a total of 14 crashes on North Territorial Road between the US-23 interchange ramps. The predominant crash types consisted of rear-end and head-on left-turn crashes. There were a total of four crashes on 6 Mile Road between the US-23 interchange ramps. There were no fatalities during the three year period.
Ramp Terminal Intersection Countermeasures: Various countermeasures should be considered which would decrease the potential for traffic crashes for the entire study area. These countermeasures include:
• Optimized traffic signal timing • Improve the operation and potentially reduce crashes with the construction of
roundabouts • Increase the sight distance over the bridges at 8 Mile Road and North Territorial Road • Improve lane definition through pavement markings
The full crash analysis along with a crash location map can be found in Appendix A-2.
Existing Traffic Volumes Traffic volumes were collected in November 2012, January 2013, and February and May 2014. All volumes were seasonally adjusted using MDOT’s memorandum “2013 Day of Week (DOW) Factors for Annual Average Daily Traffic (ADT) Calculation”. Since the traffic volumes were not all collected on the same day, minor vehicle balancing was necessary throughout the study area.
The peak hours for US-23 were from 7:00 to 8:00 AM and from 5:00 to 6:00 PM. In order to analyze the worst case scenario at the ramp terminal intersections, the highest collected AM and PM peak hours were analyzed, even if they differed from the mainline peak period. The ramp terminal intersection peak period varied between 7:00 to 8:15 AM and 3:30 to 6:15 PM. This is why the peak hour for the freeway does not necessarily correspond with the peak hour for interchange terminals.
Appendix A-3, Figures 1a through 1d, show the existing traffic volumes for the study area.
Methodology The study area was analyzed based on the procedures set forth in the 2000 Highway Capacity Manual (HCM) and with the VISSIM microscopic traffic simulation software i Conventional analysis of basic freeway segments, freeway ramps, weave sections, signalized intersections and unsignalized intersections involves the determination of a “Level of Service” (LOS). Levels of Service range from “A” to “F”, similar to an alphabetic grading system, with each level describing a different set of operational characteristics. LOS “A” describes operational
8
performance under light traffic volumes and minimal delay. LOS “F” describes a high degree of congestion with extensive delays and queuing. LOS “D” is commonly considered to be acceptable for peak-hour traffic operations in urbanized areas. As shown in Table 2-1, density is the performance measure used to define the limits of each Level of Service for basic freeway segments, ramp-freeway junctions and weave sections. The freeway was analyzed using VISSIM to determine the density of each location and then a LOS was applied using the HCM procedures. VISSIM was chosen as the preferred method for analysis because of its ability to analyze traffic management techniques such as ATM and HOV use. Traditional methods for freeway analysis such as the Highway Capacity Softwareii were not developed to analyze these types of special use lanes. Therefore, in order to compare all of the alternatives to each other, VISSIM was chosen as the preferred analytical tool (although HCS was performed where applicable and the results are presented in Appendix A-4). In addition to determining the LOS for the freeway, the travel time along US-23 was also calculated for each alternative.
As also demonstrated in Table 2-1, control delay is the performance measure used for signalized intersections and unsignalized intersections. Control delay includes all delay caused by traffic signal control, including deceleration delay, time spent waiting for the traffic signal to turn green, and acceleration delay. All signalized and stop-controlled intersections within the study area were analyzed using the Synchroiii traffic modeling software which utilizes the procedures outlined in the HCM. All proposed roundabouts were analyzed using the RODEL V1-WIN Interactive Roundabout Design software. Table 2-1 Peak Hour Level-of-Service Definitions
LOS Basic Freeway
Segments Freeway
Weave Sections Ramp-Freeway
Junctions Signalized
Intersections Unsignalized Intersections
Maximum density (pc/mi/ln)
Maximum density (pc/mi/ln)
Maximum density (pc/mi/ln)
Max. stopped-time delay(sec/veh)
Max. average total delay (sec/veh)
A 10.0 10 10 10.0 10 B 16.0 20 20 20.0 15 C 24.0 28 28 35.0 25 D 32.0 35 35 55.0 35 E 45.0 43 >35 80.0 50.0 F <45.0 >43 Demand flow exceed
limits >80.0 >50.0 Source: Highway Capacity Manual
Freeway Analysis Table 2-2 and 2-3 summarize the results of the VISSIM analysis for the US-23 corridor under the base conditions (year 2015). The results were compared to field observations and the existing model was calibrated to reflect the existing conditions as closely as possible. It is important to note that because this corridor has areas that are at or near capacity during the peak hours, the operations are unstable and are difficult to replicate on a given day. However, the existing
9
VISSIM model demonstrates how the corridor operates under average weekday traffic volumes and a controlled environment (no debris in the road, shoulder blockages, etc.).
Table 2-2 and 2-3 summarize the results of the VISSIM model for the existing conditions. Since the congestion along US-23 is directional, the results are presented for the southbound direction in the morning and the northbound direction in the afternoon. The opposite direction of US-23 during the peak periods operate at acceptable LOSs.
The results of the VISSIM model show that during the AM peak hour, SB US-23, under ideal conditions, operates at LOS D. Further south, the SB US-23 entrance ramp at N. Territorial Rd. operates at LOS F. The freeway being at or near capacity is why the southbound morning commute often experiences stop-and-go traffic whenever there is a shoulder blockage or an unexpected traffic condition occurs.
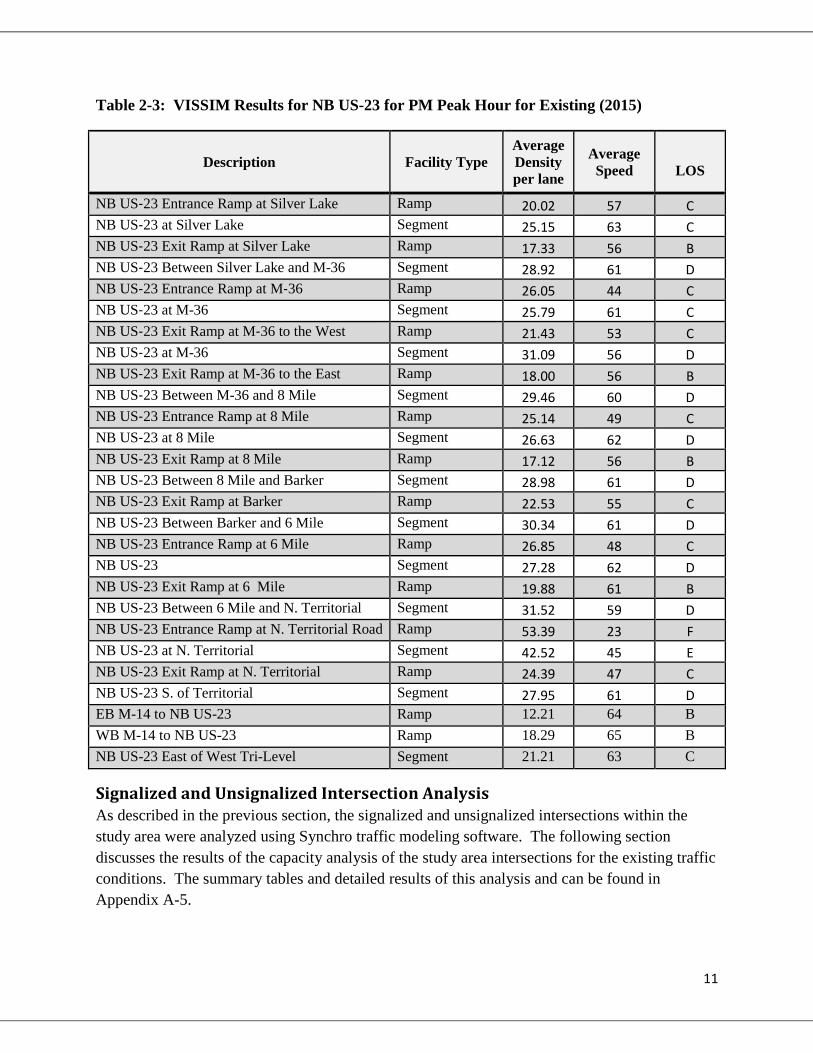
In the PM peak hour, NB US-23 reaches capacity near N. Territorial Rd. as indicated by the LOS E conditions for this segment. This condition is worsened at the N. Territorial Rd. entrance ramp (LOS F) which often causes stopped traffic on NB US-23 that extends through the western US-23/M-14 freeway to freeway junction (West Tri-Level).
The weave movement between Barton Rd. and Main St. on westbound (WB) M-14 operates at LOS F. This is due primarily to the heavy Main St. off-ramp volume and the short weave distance (under 900 feet) between the Main St. off-ramp and the Barton Rd. on-ramp.

10
Table 2-2: VISSIM Results for SB US-23 for AM Peak Hour for Existing (2015)
Description Facility Type
Ave Density per lane
Ave. Speed
LOS
SB US-23 Exit Ramp at Silver Lake Road Ramp 13.3 60 B SB US-23 at Silver Lake Segment 16.8 64 B SB US-23 Entrance Ramp at Silver Lake Road Ramp 13.8 58 C SB US-23 N. of M-36 Segment 19.3 63 B SB US-23 Exit Ramp at M-36 Ramp 13.7 58 B SB US-23 at M-36 Segment 18.0 63 B SB US-23 Exit Ramp at M-36 Ramp 15.4 59 C SB US-23 between M-36 and 8 8 Mile Segment 22.5 62 C SB US-23 Exit Ramp at 8 8 Mile Ramp 15.9 59 B SB US-23 at 8 Mile Segment 21.4 62 C SB US‐23 Entrance Ramp at 8 Mile Road Ramp 19.1 58 B SB US-23 Between 8 Mile and Barker Segment 30.0 55 D SB US‐23 Entrance Ramp at Barker Road Ramp 27.8 41 C SB US‐23 Between Barker and 6 Mile Segment 28.2 60 D SB US‐23 Exit Ramp at 6 Mile Road Ramp 19.0 58 B SB US‐23 at 6 Mile Segment 26.8 61 D SB US‐23 Entrance Ramp at 6 Mile Road Ramp 22.1 55 C SB US‐23 between 6 Mile and Territorial Segment 32.1 57 D SB US‐23 Exit Ramp at N. Territorial Road Ramp 26.6 45 C SB US‐23 at N. Territorial Segment 42.6 44 D SB US‐23Entrance Ramp at N. Territorial Road Ramp 49.0 26 F SB US‐23 Between N. Territorial and M-14 Segment 31.1 59 D SB US-23 to WB M-14 Ramp 10.28 62 B SB US-23 to EB M-14/(SB US-23) Ramp 19.08 63 B WB M-14 at Barton/Main Weave 120.26 14 F
11
Table 2-3: VISSIM Results for NB US-23 for PM Peak Hour for Existing (2015)
Description Facility Type Average Density per lane
Average Speed
LOS
NB US‐23 Entrance Ramp at Silver Lake Ramp 20.02 57 C NB US‐23 at Silver Lake Segment 25.15 63 C NB US‐23 Exit Ramp at Silver Lake Ramp 17.33 56 B NB US‐23 Between Silver Lake and M-36 Segment 28.92 61 D NB US‐23 Entrance Ramp at M‐36 Ramp 26.05 44 C NB US‐23 at M-36 Segment 25.79 61 C NB US‐23 Exit Ramp at M‐36 to the West Ramp 21.43 53 C NB US‐23 at M-36 Segment 31.09 56 D NB US‐23 Exit Ramp at M‐36 to the East Ramp 18.00 56 B NB US‐23 Between M-36 and 8 Mile Segment 29.46 60 D NB US‐23 Entrance Ramp at 8 Mile Ramp 25.14 49 C NB US‐23 at 8 Mile Segment 26.63 62 D NB US‐23 Exit Ramp at 8 Mile Ramp 17.12 56 B NB US‐23 Between 8 Mile and Barker Segment 28.98 61 D NB US‐23 Exit Ramp at Barker Ramp 22.53 55 C NB US‐23 Between Barker and 6 Mile Segment 30.34 61 D NB US‐23 Entrance Ramp at 6 Mile Ramp 26.85 48 C NB US‐23 Segment 27.28 62 D NB US‐23 Exit Ramp at 6 Mile Ramp 19.88 61 B NB US‐23 Between 6 Mile and N. Territorial Segment 31.52 59 D NB US‐23 Entrance Ramp at N. Territorial Road Ramp 53.39 23 F NB US‐23 at N. Territorial Segment 42.52 45 E NB US‐23 Exit Ramp at N. Territorial Ramp 24.39 47 C NB US‐23 S. of Territorial Segment 27.95 61 D EB M-14 to NB US-23 Ramp 12.21 64 B WB M-14 to NB US-23 Ramp 18.29 65 B NB US-23 East of West Tri-Level Segment 21.21 63 C
Signalized and Unsignalized Intersection Analysis As described in the previous section, the signalized and unsignalized intersections within the study area were analyzed using Synchro traffic modeling software. The following section discusses the results of the capacity analysis of the study area intersections for the existing traffic conditions. The summary tables and detailed results of this analysis and can be found in Appendix A-5.
12
Since the 6 Mile Rd., 8 Mile Rd., and Territorial Rd. bridges are being reconstructed over US-23, these interchanges were analyzed to determine if operational improvements were needed within the interchange area.
For the rest of the US-23 interchanges within the study area, the interchange terminals and nearby intersections were analyzed to determine if there were any operational deficiencies at these interchanges that impact US-23 traffic.
The results for all the signalized and unsignalized intersections are summarized below. The detailed LOS summary is presented in Appendix A-5.
US-23 and 6 Mile Rd. Interchange Under the existing conditions, both the northbound and southbound off-ramp intersections with 6 Mile Rd. were analyzed. The intersection of the SB US-23 off-ramp with 6 Mile Rd. operates with all movements at acceptable LOSs during both peaks. However, the left turn from the northbound off-ramp operates at LOS E during the AM peak hour. During the PM peak, all movements at the northbound and southbound approaches operate at LOS F with a 250-foot queue on the northbound off ramp.
US-23 and 8 Mile Rd. Interchange Currently, the eastbound through movement at the intersection of 8 Mile Rd. and Whitmore Lake Rd. operates at LOS F during the AM peak hour. However, it should be noted that this movement does not impact the operation of US-23 since the queuing is outside of the interchange area. During the PM peak hour, all movements at this intersection operate at acceptable LOSs.
The intersection of the SB US-23 off-ramp with 8 Mile Rd. is in close proximity to Whitmore Lake Rd. and is controlled by the same traffic signal. However, all movements at the SB off-ramp operate at acceptable LOSs during both the AM and PM peak hour.
US-23 and North Territorial Rd. Interchange The intersection of North Territorial Rd. and Whitmore Lake Rd. operates with the eastbound through movement at LOS E during the AM peak hour. However, this movement does not impact the operation of the US-23 corridor.
The intersections of the SB US-23 off-ramp with North Territorial Rd. and the NB US-23 off- ramp with North Territorial Rd. operate with acceptable LOSs when analyzed as isolated intersections. However, during the PM peak, the eastbound left turn onto the NB US-23 ramp backs up over the bridge and through the southbound US-23 ramp terminal.
Other US-23 Interchanges Although the rest of the US-23 interchange bridges are not being reconstructed, the interchange operations were analyzed to identify any operational issues that could impact the safety or operation of US-23.

13
US-23 and Silver Lake Rd. During the AM peak hour, the intersection of the NB US-23 off-ramp with Silver Lake Rd. operates with the left and right turn movements at LOS F. However, the maximum queue for this movement is only about 70 feet. The SB US-23 off-ramp at Silver Lake Rd. operates at LOS E with a maximum queue of approximately 220 feet.
During the PM peak, the NB US-23 off-ramp operates at LOS F with a maximum queue of approximately 250 feet.
Also during the PM peak, at the intersection of Silver Lake Rd. and Whitmore Lake Rd., the westbound left and right turn movements operate at LOS F which occasionally backs up past the SB US-23 off-ramp intersection.
US-23 and M-36 Although the SB US-23 ramps operate at acceptable LOSs for both peak hours, the exiting approach of the park-and-ride operates at LOS E during the AM peak hour. However, the queue for this movement is about 25 feet (or approximately one vehicle).
The southbound movement at the intersection of M-36 at Fieldcrest operates at LOS F during the AM peak but the queuing does not affect the interchange operation.
During the AM peak hour, the eastbound movement at the intersection of M-36 at Whitmore Lake Rd. operates at LOS F. In addition, the westbound and southbound movements operate at LOS E. During the PM peak the westbound movement at this intersection operates at LOS F and the eastbound left turn and through movements operates at LOS E. However, the operations of these movements do not interfere with traffic exiting US-23 so they do not cause operational concerns on US-23.
US-23 and Barker Rd. At the intersections of both the NB US-23 off-ramps and the SB US-23 off-ramps with Barker Rd., all movements operate at acceptable LOSs during both the AM and PM peak hours.

14

15
3. No-Build (2040) Traffic Conditions
Traffic Forecast Projected traffic volumes for the No Build scenario considered the regional travel demand forecasting models generated by the Southeast Michigan Council of Governments (SEMCOG), Washtenaw Area Transportation Study (WATS) and historical projections. Based on the analysis of all of this information, an annual growth rate of 0.3 percent was applied to the traffic volumes within the study area to arrive at the 2040 No-Build traffic volumes. This section provides an analysis of forecasted year (2040) traffic operations, assuming no improvements are made to the US-23 corridor within the study limits. The No-Build traffic volume forecast is presented in Appendix A-3, Figures 2a – 2d.
Freeway Analysis The results of the capacity analysis for the No-Build conditions are presented in Tables 3-1 and 3-2.
With the traffic volume increase that is anticipated in 2040, the No-Build conditions would worsen with the operational issues extending further to the north. The SB US-23 segment between 8 Mile Rd. and Barker Rd. is expected to be at LOS E with several segments and ramps to the south also operating at LOS E or F conditions.
The weave movement between Barton Rd. and Main St. on WB M-14 would continue to operate at LOS F and the queue would increase over what is happening under existing conditions.
During the PM peak hour, the operation of NB US-23 would also degrade. The bottleneck is anticipated to move further south and cause more backups at the West Tri-Level. This can be seen in Table 3-2 by examining the averages speeds around N. Territorial Rd.

16
Table 3-1: VISSIM Results for SB US-23 for AM Peak Hour for No-Build (2040)
Description Facility Type
Ave Density per
lane
Ave. Speed
LOS
SB US-23 Exit Ramp at Silver Lake Road Ramp 14.7 59 B SB US-23 at Silver Lake Segment 18.5 63 C SB US-23 Entrance Ramp at Silver Lake Road Ramp 15.4 57 B SB US-23 N. of M-36 Segment 21.2 62 C SB US-23 Exit Ramp at M-36 Ramp 15.3 57 B SB US-23 at M-36 Segment 19.8 62 C SB US-23 Entrance Ramp at M-36 Ramp 17.1 58 B SB US-23 between M-36 and 8 Mile Segment 24.8 61 C SB US-23 Exit Ramp at 8 Mile Ramp 17.4 58 B SB US-23 at 8 Mile Segment 23.7 61 C SB US‐23 Entrance Ramp at 8 Mile Road Ramp 24.6 52 C SB US-23 Between 8 Mile and Barker Segment 38.3 49 E SB US‐23 Entrance Ramp at Barker Road Ramp 34.5 36 D SB US‐23 Between Barker and 6 Mile Segment 32.7 57 D SB US‐23 Exit Ramp at 6 Mile Road Ramp 25.8 51 C SB US‐23 at 6 Mile Segment 38.0 52 E SB US‐23 Entrance Ramp at 6 Mile Road Ramp 34.4 42 D SB US‐23 between 6 Mile and Territorial Segment 48.4 44 F SB US‐23 Exit Ramp at N. Territorial Road Ramp 41.3 32 E SB US‐23 at N. Territorial Segment 69.9 28 F SB US‐23 Entrance Ramp at N. Territorial Road Ramp 56.9 23 F SB US‐23 Between N. Territorial and M-14 Segment 32.7 58 D SB US-23 to WB M-14 Ramp 12.0 60 B SB US-23 to EB M-14/(SB US-23) Ramp 19.9 63 B WB M-14 at Barton/Main Weave 123.4 13 F

17
Table 3-2: VISSIM Results for NB US-23 for PM Peak Hour for No-Build (2040)
Description Facility Type Average Density per lane
Average Speed
LOS
NB US‐23 Entrance Ramp at Silver Lake Ramp 21.96 55 C NB US‐23 at Silver Lake Segment 26.90 62 D NB US‐23 Exit Ramp at Silver Lake Ramp 18.77 57 B NB US‐23 Between Silver Lake and M-36 Segment 30.83 60 D NB US‐23 Entrance Ramp at M‐36 Ramp 31.16 39 D NB US‐23 at M-36 Segment 28.35 60 D NB US‐23 Exit Ramp at M‐36 to the West Ramp 23.25 52 C NB US‐23 at M-36 Segment 33.25 55 D NB US‐23 Exit Ramp at M‐36 to the East Ramp 19.54 57 B NB US‐23 Between M-36 and 8 Mile Segment 31.53 59 D NB US‐23 Entrance Ramp at 8 Mile Ramp 27.79 47 C NB US‐23 at 8 Mile Segment 28.32 62 D NB US‐23 Exit Ramp at 8 Mile Ramp 18.46 55 B NB US‐23 Between 8 Mile and Barker Segment 30.88 61 D NB US‐23 Exit Ramp at Barker Ramp 24.27 53 C NB US‐23 Between Barker and 6 Mile Segment 32.57 60 D NB US‐23 Entrance Ramp at 6 Mile Ramp 31.58 44 D NB US‐23 Segment 29.20 62 D NB US‐23 Exit Ramp at 6 Mile Ramp 21.56 60 C NB US‐23 Between 6 Mile and N. Territorial Segment 33.99 58 D NB US‐23 Entrance Ramp at N. Territorial Road Ramp 61.34 21 F NB US‐23 at N. Territorial Segment 56.60 36 F NB US‐23 Exit Ramp at N. Territorial Ramp 30.64 42 D NB US‐23 S. of Territorial Segment 30.20 60 D EB M-14 to NB US-23 Ramp 12.10 64 B WB M-14 to NB US-23 Ramp 19.91 64 B NB US-23East of West Tri-Level Segment 23.88 62 C
Signalized and Unsignalized Intersection Analysis The following section discusses the results of the capacity analysis of the study area intersections for the No-Build Conditions. The summary tables and detailed results of this analysis and can be found in Appendix A-5.
18
US-23 and 6 Mile Rd. Interchange The intersection of the SB US-23 off-ramp with 6 Mile Rd. would continue to operate with all movements at acceptable LOSs during both peaks. The left turn from the northbound off-ramp is expected to drop from LOS E under existing conditions to a LOS F during the AM peak hour for No-Build conditions. During the PM peak, all movements at the northbound and southbound approaches operate at LOS F with approximately a 350-foot queue on the northbound off ramp (which is approximately 100 feet longer than under existing conditions).
US-23 and 8 Mile Rd. Interchange The eastbound through movement at the intersection of 8 Mile Rd. and Whitmore Lake Rd. would continue to operate at LOS F during the AM peak hour. During the PM peak hour, all movements at this intersection operate at acceptable LOSs. Both the SB US-23 off-ramp and the NB-US-23 off-ramps with 8 Mile Rd. would continue to operate at acceptable LOSs during both the AM and PM peak hour under No-Build conditions.
US-23 and North Territorial Rd. Interchange The intersection of North Territorial Rd. and Whitmore Lake Rd. operates with the eastbound through movement dropping to a LOS F during the AM peak hour (from LOS E under existing conditions). All other movements at this intersection would operate at acceptable LOSs. The intersections of the SB US-23 off-ramp with North Territorial Rd. and the NB US-23 off- ramp with North Territorial Rd. continue to operate with acceptable LOSs when analyzed as isolated intersections. However, during the PM peak, the eastbound left turn onto the NB US-23 ramp continues to back up over the bridge and through the SB US-23 ramp terminal.
Other US-23 Interchanges
US-23 and Silver Lake Rd. During the AM peak hour, the intersection of the NB US-23 off-ramp with Silver Lake Rd. continues to operate with the left and right turn movements at LOS F with a slight increase in the maximum queue. The SB US-23 off-ramp at Silver Lake Rd. continues to operate at LOS E with the maximum queue increasing to approximately 260 feet (from 220 feet under existing conditions). During the PM peak, the NB US-23 off-ramp continues to operate at LOS F with a maximum queue of approximately 270 feet. At the intersection of Silver Lake Rd. and Whitmore Lake Rd., the westbound left and right turn movements operate at LOS F resulting in queueing which extends through the ramp terminals; however the traffic operations do not interfere with the traffic operations of US-23.
US-23 and M-36 Although the SB US-23 ramps operate at acceptable LOSs for both peak hours, the exiting approach of the park-and-ride operates at LOS F during the AM peak hour (as compared to LOS E for existing conditions). However, the queue for this movement remains at about one vehicle.

19
The southbound movement at the intersection of M-36 at Fieldcrest continues to operate at LOS F during the AM peak but the queuing does not affect the interchange operation. During the AM peak hour, the eastbound movement at the intersection of M-36 at Whitmore Lake Rd. continues to operate at a LOS F. In addition, the westbound movements operate at a LOS D and southbound movements operate at LOS F. During the PM peak the westbound movement at this intersection continues to operate at a LOS F and the eastbound left turn and through movements operate at LOS F. However, the operations of these movements do not interfere with traffic exiting US-23 so they do not cause operational concerns on US-23.
US-23 and Barker Rd. At the intersections of both the NB US-23off-ramps and the SB US-23 off-ramps with Barker Rd., all movements operate at acceptable LOSs during both the AM and PM peak hours.

20

21
4. Build Alternatives
Transportation System Management (TSM) The TSM alterative includes the extension of the following on-ramps to increase the length of the acceleration lane:
• SB US-23 entrance ramp at M-36 • NB US-23 entrance ramp at M-36 • NB US-23 entrance ramp at 8 Mile Road • SB US-23 entrance ramp at Barker Road • SB US-23 entrance ramp at 6 Mile Road • NB US-23 entrance ramp at 6 Mile Road • NB US-23 entrance ramp at North Territorial Road • EB M-14 ramp to NB US-23 ramp
The following intersection improvements are also a part of the TSM alternative:
• Signalized intersections were replaced with roundabouts at both the southbound and northbound N. Territorial Rd. off-ramps. The intersection of N. Territorial Rd. and 5 Mile Rd. was realigned to accommodate this change.
• The signal timing at the intersection of North Territorial Road and Whitmore Lake Road was optimized.
• The intersection of northbound US-23 off-ramp at 6 Mile Road is modified from a 2-way to a 4-way stop and the northbound through movement storage lane is extended.
• The signal timing at the intersection of 8 Mile Road with the southbound US-23 ramps and Whitmore Lake Road is optimized and an option of placing roundabouts at the interchange terminals and Whitmore Lake is also being considered.
Traffic Forecast It was assumed that there would not be a traffic volume change for the TSM alternative as compared to the No-Build option so the No-Build traffic volumes were used in the analysis for TSM. These volumes are presented in Appendix A-3, Figures 2a through 2d.
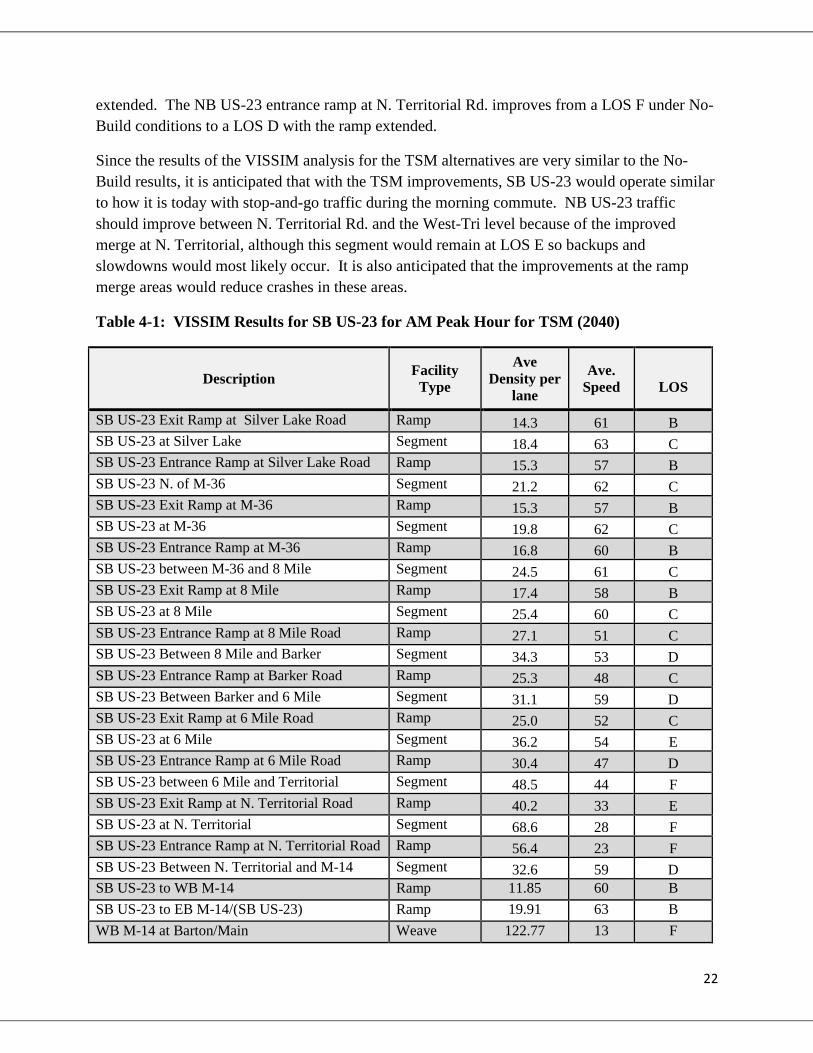
Freeway Analysis The results of the capacity analysis for the TSM alternative are summarized in Tables 4-1 and 4-2. During the AM peak hour, with the ramp extensions described previously, SB US-23 would operate similarly to the No-Build conditions, although slight improvements are anticipated at the ramp merge areas where the ramps were extended. Several ramp areas and segments from 6 Mile Rd. to the south would continue to operate at LOS E or F.
The weave on WB M-14 between Barton Rd. and Main St. would continue to operate at LOS F with queuing similar to the No-Build conditions.
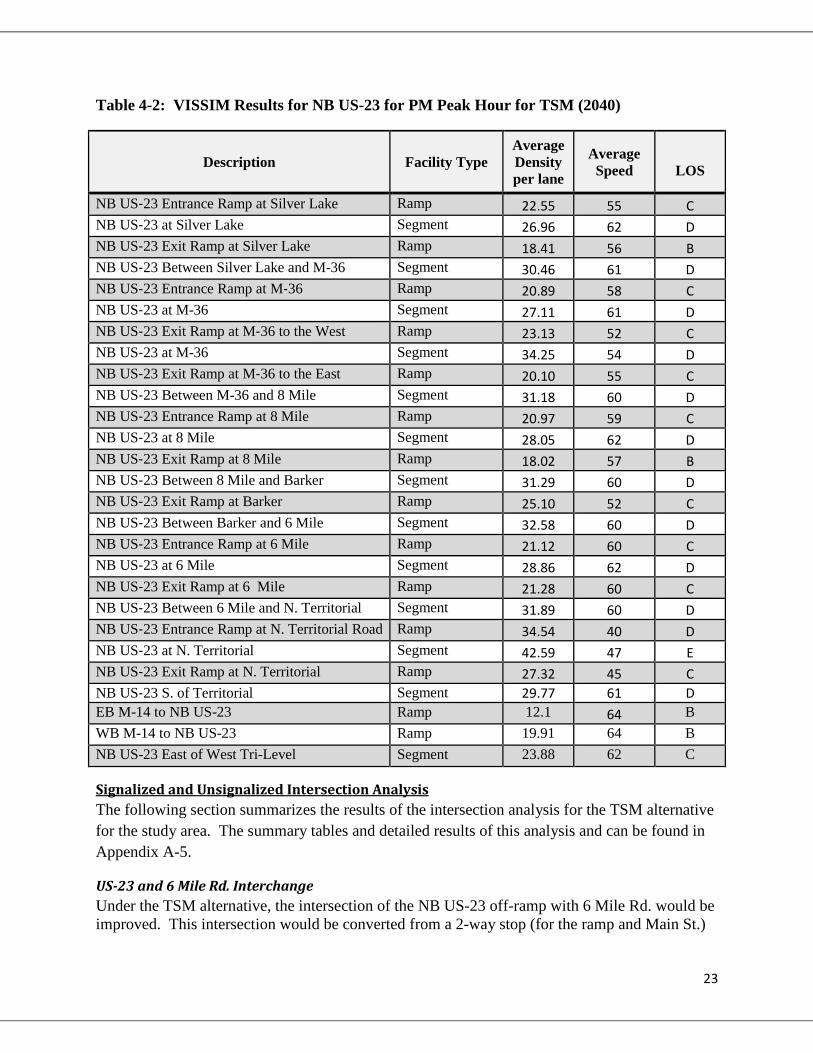
For the NB US-23 in the PM, the results of the VISSIM analysis were similar to the No-Build conditions but with some improvements in flow where the northbound entrance ramps were
22
extended. The NB US-23 entrance ramp at N. Territorial Rd. improves from a LOS F under No-Build conditions to a LOS D with the ramp extended.
Since the results of the VISSIM analysis for the TSM alternatives are very similar to the No-Build results, it is anticipated that with the TSM improvements, SB US-23 would operate similar to how it is today with stop-and-go traffic during the morning commute. NB US-23 traffic should improve between N. Territorial Rd. and the West-Tri level because of the improved merge at N. Territorial, although this segment would remain at LOS E so backups and slowdowns would most likely occur. It is also anticipated that the improvements at the ramp merge areas would reduce crashes in these areas.
Table 4-1: VISSIM Results for SB US-23 for AM Peak Hour for TSM (2040)
Description Facility Type
Ave Density per
lane
Ave. Speed
LOS
SB US-23 Exit Ramp at Silver Lake Road Ramp 14.3 61 B SB US-23 at Silver Lake Segment 18.4 63 C SB US-23 Entrance Ramp at Silver Lake Road Ramp 15.3 57 B SB US-23 N. of M-36 Segment 21.2 62 C SB US-23 Exit Ramp at M-36 Ramp 15.3 57 B SB US-23 at M-36 Segment 19.8 62 C SB US-23 Entrance Ramp at M-36 Ramp 16.8 60 B SB US-23 between M-36 and 8 Mile Segment 24.5 61 C SB US-23 Exit Ramp at 8 Mile Ramp 17.4 58 B SB US-23 at 8 Mile Segment 25.4 60 C SB US‐23 Entrance Ramp at 8 Mile Road Ramp 27.1 51 C SB US-23 Between 8 Mile and Barker Segment 34.3 53 D SB US‐23 Entrance Ramp at Barker Road Ramp 25.3 48 C SB US‐23 Between Barker and 6 Mile Segment 31.1 59 D SB US‐23 Exit Ramp at 6 Mile Road Ramp 25.0 52 C SB US‐23 at 6 Mile Segment 36.2 54 E SB US‐23 Entrance Ramp at 6 Mile Road Ramp 30.4 47 D SB US‐23 between 6 Mile and Territorial Segment 48.5 44 F SB US‐23 Exit Ramp at N. Territorial Road Ramp 40.2 33 E SB US‐23 at N. Territorial Segment 68.6 28 F SB US‐23 Entrance Ramp at N. Territorial Road Ramp 56.4 23 F SB US‐23 Between N. Territorial and M-14 Segment 32.6 59 D SB US-23 to WB M-14 Ramp 11.85 60 B SB US-23 to EB M-14/(SB US-23) Ramp 19.91 63 B WB M-14 at Barton/Main Weave 122.77 13 F
23
Table 4-2: VISSIM Results for NB US-23 for PM Peak Hour for TSM (2040)
Description Facility Type Average Density per lane
Average Speed
LOS
NB US‐23 Entrance Ramp at Silver Lake Ramp 22.55 55 C NB US‐23 at Silver Lake Segment 26.96 62 D NB US‐23 Exit Ramp at Silver Lake Ramp 18.41 56 B NB US‐23 Between Silver Lake and M-36 Segment 30.46 61 D NB US‐23 Entrance Ramp at M‐36 Ramp 20.89 58 C NB US‐23 at M-36 Segment 27.11 61 D NB US‐23 Exit Ramp at M‐36 to the West Ramp 23.13 52 C NB US‐23 at M-36 Segment 34.25 54 D NB US‐23 Exit Ramp at M‐36 to the East Ramp 20.10 55 C NB US‐23 Between M-36 and 8 Mile Segment 31.18 60 D NB US‐23 Entrance Ramp at 8 Mile Ramp 20.97 59 C NB US‐23 at 8 Mile Segment 28.05 62 D NB US‐23 Exit Ramp at 8 Mile Ramp 18.02 57 B NB US‐23 Between 8 Mile and Barker Segment 31.29 60 D NB US‐23 Exit Ramp at Barker Ramp 25.10 52 C NB US‐23 Between Barker and 6 Mile Segment 32.58 60 D NB US‐23 Entrance Ramp at 6 Mile Ramp 21.12 60 C NB US‐23 at 6 Mile Segment 28.86 62 D NB US‐23 Exit Ramp at 6 Mile Ramp 21.28 60 C NB US‐23 Between 6 Mile and N. Territorial Segment 31.89 60 D NB US‐23 Entrance Ramp at N. Territorial Road Ramp 34.54 40 D NB US‐23 at N. Territorial Segment 42.59 47 E NB US‐23 Exit Ramp at N. Territorial Ramp 27.32 45 C NB US‐23 S. of Territorial Segment 29.77 61 D EB M-14 to NB US-23 Ramp 12.1 64 B WB M-14 to NB US-23 Ramp 19.91 64 B NB US-23 East of West Tri-Level Segment 23.88 62 C
Signalized and Unsignalized Intersection Analysis The following section summarizes the results of the intersection analysis for the TSM alternative for the study area. The summary tables and detailed results of this analysis and can be found in Appendix A-5.
US-23 and 6 Mile Rd. Interchange Under the TSM alternative, the intersection of the NB US-23 off-ramp with 6 Mile Rd. would be improved. This intersection would be converted from a 2-way stop (for the ramp and Main St.)
24
to a 4-way stop-controlled intersection (assuming all warrants are met). With this modification, all movements would operate at acceptable LOSs.
US-23 and 8 Mile Rd. Interchange If the current signalized layout remains, both the SB US-23 off-ramp and the NB-US-23 off-ramps with 8 Mile Rd. would continue to operate at acceptable LOSs during both the AM and PM peak hour under No-Build conditions. However, the eastbound through movement at the intersection of 8 Mile Rd. and Whitmore Lake Rd. would continue to operate at LOS F during the AM peak hour causing backups in the eastbound direction. A roundabout option is also being considered for the TSM alternative. This option would consist of constructing tear-drop shaped roundabouts at both ramp terminals and at Whitmore Lake Rd. With this option, all roundabouts would operate at LOS A.
US-23 and North Territorial Rd. Interchange For the TSM alternative, only signal timing adjustments are proposed at the intersection of North Territorial Rd. and Whitmore Lake Rd. With optimized timings, this intersection would operate with the eastbound through movement at LOS F during the AM peak hour. All other movements at this intersection would operate at acceptable LOSs. For the TSM alternative, the intersections of the SB US-23 off-ramp with North Territorial Rd. and the NB US-23 off- ramp with North Territorial Rd. would be reconstructed as roundabouts. With this operational improvement, both the SB US-23 off-ramp and the NB US-23 off-ramp would operate at LOS A.
Other US-23 Interchanges
US-23 and Silver Lake Rd. There are no proposed changes at the interchange of US-23 and Silver Lake Rd. for the TSM alternative and therefore, the operation of these unsignalized intersections would be similar to the No-Build conditions.
US-23 and M-36 There are also no improvements proposed at this interchange for the TSM alternatives. The SB US-23 ramps would operate at acceptable LOSs for both peak hours but some movements on M-36, Whitmore Lake Rd. and Fieldcrest would continue to operate at LOS E and F. However, these movements do not interfere with traffic exiting US-23 so they do not cause operational concerns on US-23.
US-23 and Barker Rd. All movements at the US-23 ramps operate at acceptable LOSs during both peak hours at this interchange and, therefore, no TSM improvements are proposed at this location.
25
Ramp Metering The Ramp Metering Alternative assumed that all of the improvements recommended under the TSM alterative would also be in place before installing ramp metering. For this alternative, ramp metering was considered throughout the corridor where there was sufficient storage for queues and where adequate acceleration lanes could be provided. In addition, Synchro was used to determine if ramp metering could be accommodated without significant impacts and queueing to the upstream ramp terminal. Based on this initial investigation, the following locations warranted further analysis of the impacts of ramp metering:
• 6 Mile Rd. on-ramp to SB US-23 (located 300 feet from the cross street) • 8 Mile Rd. on-ramp to SB US-23 (located 381 feet from the cross street) • M-36 on-ramp to SB US-23 (located 311 feet from the cross street) • M-36 on-ramp to NB US-23 (300 feet from the cross street)
It is anticipated that the southbound and northbound on-ramps from North Territorial Road would also benefit from the addition of ramp metering under the current signalized terminal layout. However, since the recommendation for this intersection is to modify the terminals to replace the signals with roundabouts, the ramp metering for North Territorial Road was not considered any further. Similar to the effects of ramp metering, adding roundabout at the on-ramp terminals would break up the platoons of vehicles that enter the freeway at the merge area.
A roundabout concept is also being considered at the intersection of 8 Mile Rd. and the SB US-23 ramps. If it is determined that the roundabout concept is the best treatment for this intersections, ramp metering would no longer be considered at this location.
Traffic Forecast It was assumed that there would not be a traffic volume change for the ramp metering alternative as compared to the No-Build option so the No-Build traffic volumes were used in the analysis for ramp metering (Appendix A-3, Figures 2 a through 2d).
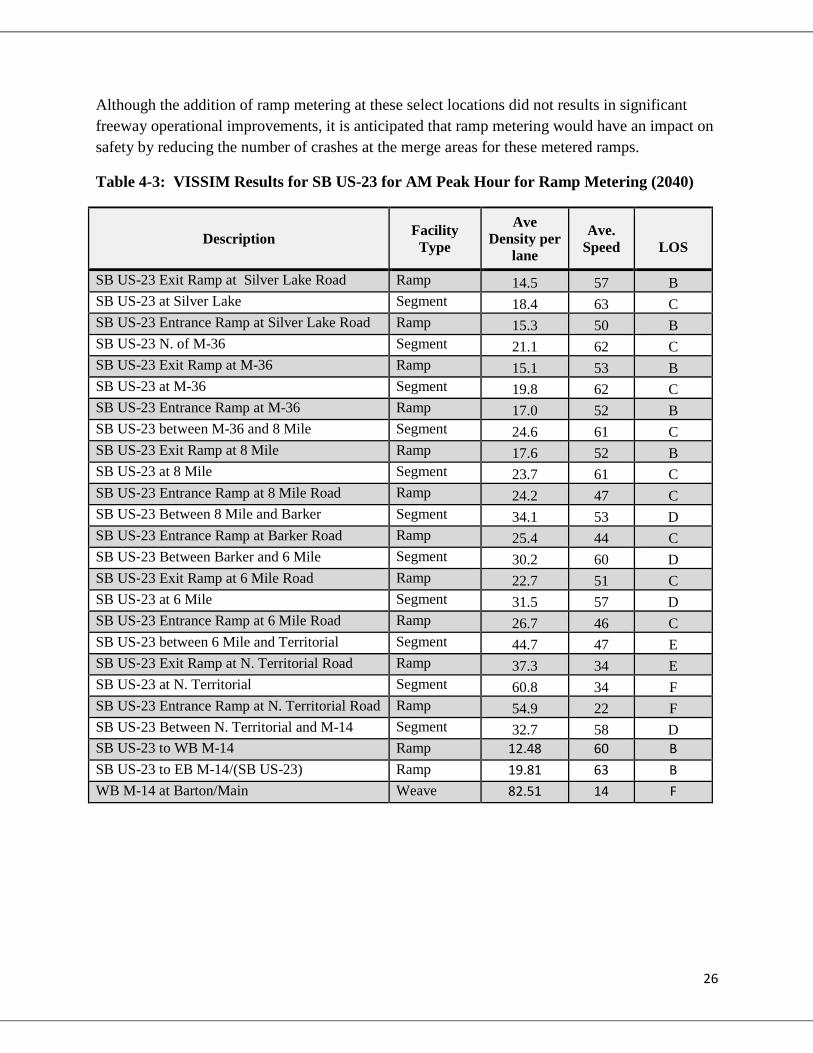
Freeway Analysis The results of the VISSIM analysis are presented in Tables 4-3 and 4-4. For the majority of the study area, the operation of SB US-23 and NB US-23 would operate similar to the TSM alternative. However, with the installation of a ramp meter for the SB US-23 entrance ramp at 6 Mile Rd., the LOS at the merge area is expected to improve to a LOS C (from LOS D for the No-Build and TSM alternatives). There was no improvement in the LOS for the other two ramp meter locations that were considered for SB US-23 on ramps.
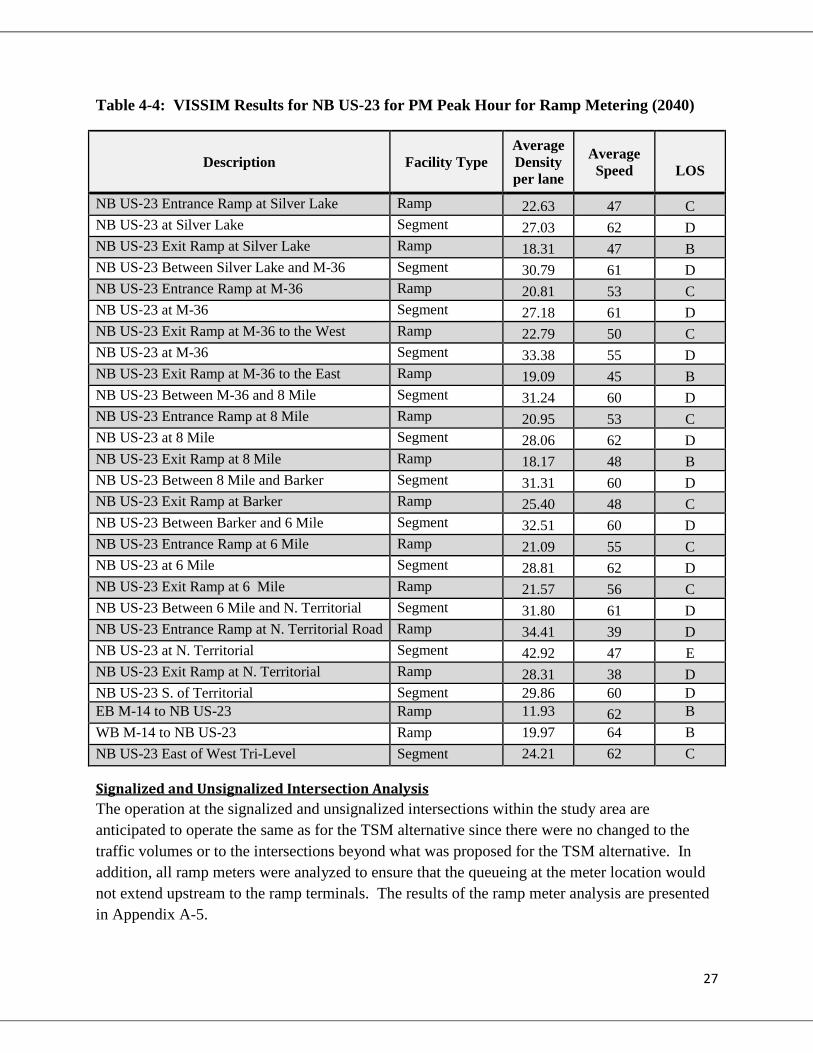
For NB US-23, only the NB US-23 on-ramp from M-36 was considered for ramp metering. With this ramp metered, the LOS at the merge area during the PM peak is expected to improve to LOS C (from LOS D under No-Build conditions). However, there is not an improvement at this location as compared to the TSM alternative.
26
Although the addition of ramp metering at these select locations did not results in significant freeway operational improvements, it is anticipated that ramp metering would have an impact on safety by reducing the number of crashes at the merge areas for these metered ramps.
Table 4-3: VISSIM Results for SB US-23 for AM Peak Hour for Ramp Metering (2040)
Description Facility Type
Ave Density per
lane
Ave. Speed
LOS
SB US-23 Exit Ramp at Silver Lake Road Ramp 14.5 57 B SB US-23 at Silver Lake Segment 18.4 63 C SB US-23 Entrance Ramp at Silver Lake Road Ramp 15.3 50 B SB US-23 N. of M-36 Segment 21.1 62 C SB US-23 Exit Ramp at M-36 Ramp 15.1 53 B SB US-23 at M-36 Segment 19.8 62 C SB US-23 Entrance Ramp at M-36 Ramp 17.0 52 B SB US-23 between M-36 and 8 Mile Segment 24.6 61 C SB US-23 Exit Ramp at 8 Mile Ramp 17.6 52 B SB US-23 at 8 Mile Segment 23.7 61 C SB US‐23 Entrance Ramp at 8 Mile Road Ramp 24.2 47 C SB US-23 Between 8 Mile and Barker Segment 34.1 53 D SB US‐23 Entrance Ramp at Barker Road Ramp 25.4 44 C SB US‐23 Between Barker and 6 Mile Segment 30.2 60 D SB US‐23 Exit Ramp at 6 Mile Road Ramp 22.7 51 C SB US‐23 at 6 Mile Segment 31.5 57 D SB US‐23 Entrance Ramp at 6 Mile Road Ramp 26.7 46 C SB US‐23 between 6 Mile and Territorial Segment 44.7 47 E SB US‐23 Exit Ramp at N. Territorial Road Ramp 37.3 34 E SB US‐23 at N. Territorial Segment 60.8 34 F SB US‐23 Entrance Ramp at N. Territorial Road Ramp 54.9 22 F SB US‐23 Between N. Territorial and M-14 Segment 32.7 58 D SB US-23 to WB M-14 Ramp 12.48 60 B SB US-23 to EB M-14/(SB US-23) Ramp 19.81 63 B WB M-14 at Barton/Main Weave 82.51 14 F
27
Table 4-4: VISSIM Results for NB US-23 for PM Peak Hour for Ramp Metering (2040)
Description Facility Type Average Density per lane
Average Speed
LOS
NB US‐23 Entrance Ramp at Silver Lake Ramp 22.63 47 C NB US‐23 at Silver Lake Segment 27.03 62 D NB US‐23 Exit Ramp at Silver Lake Ramp 18.31 47 B NB US‐23 Between Silver Lake and M-36 Segment 30.79 61 D NB US‐23 Entrance Ramp at M‐36 Ramp 20.81 53 C NB US‐23 at M-36 Segment 27.18 61 D NB US‐23 Exit Ramp at M‐36 to the West Ramp 22.79 50 C NB US‐23 at M-36 Segment 33.38 55 D NB US‐23 Exit Ramp at M‐36 to the East Ramp 19.09 45 B NB US‐23 Between M-36 and 8 Mile Segment 31.24 60 D NB US‐23 Entrance Ramp at 8 Mile Ramp 20.95 53 C NB US‐23 at 8 Mile Segment 28.06 62 D NB US‐23 Exit Ramp at 8 Mile Ramp 18.17 48 B NB US‐23 Between 8 Mile and Barker Segment 31.31 60 D NB US‐23 Exit Ramp at Barker Ramp 25.40 48 C NB US‐23 Between Barker and 6 Mile Segment 32.51 60 D NB US‐23 Entrance Ramp at 6 Mile Ramp 21.09 55 C NB US‐23 at 6 Mile Segment 28.81 62 D NB US‐23 Exit Ramp at 6 Mile Ramp 21.57 56 C NB US‐23 Between 6 Mile and N. Territorial Segment 31.80 61 D NB US‐23 Entrance Ramp at N. Territorial Road Ramp 34.41 39 D NB US‐23 at N. Territorial Segment 42.92 47 E NB US‐23 Exit Ramp at N. Territorial Ramp 28.31 38 D NB US‐23 S. of Territorial Segment 29.86 60 D EB M-14 to NB US-23 Ramp 11.93 62 B WB M-14 to NB US-23 Ramp 19.97 64 B NB US-23 East of West Tri-Level Segment 24.21 62 C
Signalized and Unsignalized Intersection Analysis The operation at the signalized and unsignalized intersections within the study area are anticipated to operate the same as for the TSM alternative since there were no changed to the traffic volumes or to the intersections beyond what was proposed for the TSM alternative. In addition, all ramp meters were analyzed to ensure that the queueing at the meter location would not extend upstream to the ramp terminals. The results of the ramp meter analysis are presented in Appendix A-5.
28
Active Traffic Management (ATM) with General Purpose Dynamic Shoulder Use
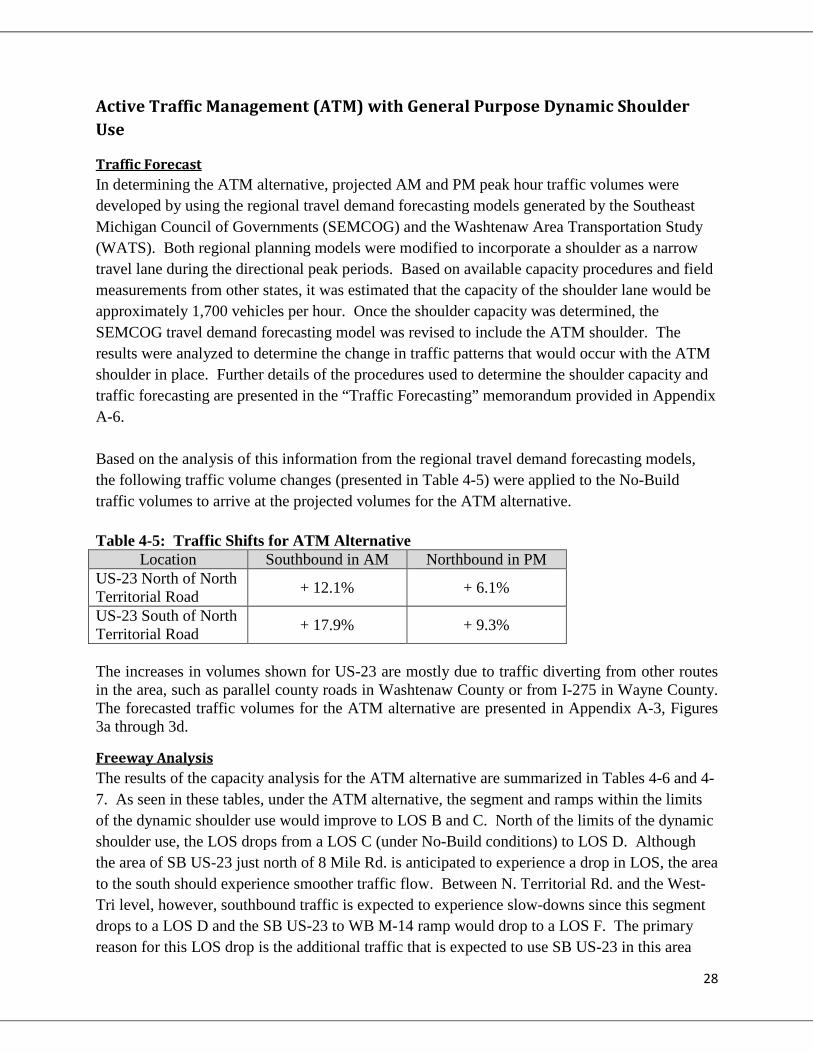
Traffic Forecast In determining the ATM alternative, projected AM and PM peak hour traffic volumes were developed by using the regional travel demand forecasting models generated by the Southeast Michigan Council of Governments (SEMCOG) and the Washtenaw Area Transportation Study (WATS). Both regional planning models were modified to incorporate a shoulder as a narrow travel lane during the directional peak periods. Based on available capacity procedures and field measurements from other states, it was estimated that the capacity of the shoulder lane would be approximately 1,700 vehicles per hour. Once the shoulder capacity was determined, the SEMCOG travel demand forecasting model was revised to include the ATM shoulder. The results were analyzed to determine the change in traffic patterns that would occur with the ATM shoulder in place. Further details of the procedures used to determine the shoulder capacity and traffic forecasting are presented in the “Traffic Forecasting” memorandum provided in Appendix A-6. Based on the analysis of this information from the regional travel demand forecasting models, the following traffic volume changes (presented in Table 4-5) were applied to the No-Build traffic volumes to arrive at the projected volumes for the ATM alternative. Table 4-5: Traffic Shifts for ATM Alternative
Location Southbound in AM Northbound in PM US-23 North of North Territorial Road + 12.1% + 6.1%
US-23 South of North Territorial Road + 17.9% + 9.3%
The increases in volumes shown for US-23 are mostly due to traffic diverting from other routes in the area, such as parallel county roads in Washtenaw County or from I-275 in Wayne County. The forecasted traffic volumes for the ATM alternative are presented in Appendix A-3, Figures 3a through 3d.
Freeway Analysis The results of the capacity analysis for the ATM alternative are summarized in Tables 4-6 and 4-7. As seen in these tables, under the ATM alternative, the segment and ramps within the limits of the dynamic shoulder use would improve to LOS B and C. North of the limits of the dynamic shoulder use, the LOS drops from a LOS C (under No-Build conditions) to LOS D. Although the area of SB US-23 just north of 8 Mile Rd. is anticipated to experience a drop in LOS, the area to the south should experience smoother traffic flow. Between N. Territorial Rd. and the West-Tri level, however, southbound traffic is expected to experience slow-downs since this segment drops to a LOS D and the SB US-23 to WB M-14 ramp would drop to a LOS F. The primary reason for this LOS drop is the additional traffic that is expected to use SB US-23 in this area

29
(approximately 770 vehicles based on the travel demand forecasting model- see the Traffic Forecasting Memorandum in Appendix A-6 and traffic volumes in Appendix A-3). These vehicles were projected to be diverted onto SB US-23 from other less desirable routes in the area (such as N. Territorial Rd. and I-275). If recurring congestion does occur for southbound traffic at the West-Tri level in the future, it is likely that the number of vehicles diverted would be less than this if no improvement was made at this interchange. However, a mitigation treatment was considered for this interchange to alleviate this traffic congestion. A detailed discussion is provided at the end of this section under “US-23/M-14 Mitigation”.
The weave on WB M-14 between Barton Rd. and Main St. would continue to operate at LOS F with the average speed in this weave dropping to about 11 miles per hour (as compared to 13 miles per hour under the No-Build conditions).
Overall, the SB US-23 operations for the AM peak would improve for the corridor. The dynamic shoulder lane (along with the proposed ramp extensions) would help by alleviating some of the traffic in the outside freeway lane which would allow for more gaps for ramp traffic entering SB US-23. The improvements in the segment from 8 Mile Rd. south to N. Territorial Rd. would help reduce the amount of stop-and-go traffic experienced during the morning commute. This improved traffic flow should also result in a reduction in congestion related crashes associated with the slowdowns. However, SB US-23 traffic would experience some slowdowns near M-14 due to the backups associated with the weave movement on M-14 at Barton Drive.
For NB US-23 in the PM peak, the addition of the dynamic shoulder use would provide similar benefits to what was described for the SB US-23 traffic during the AM peak. The use of the shoulder helps alleviate traffic in the outside lane which improves the merge areas for the ramps within the ATM segment. All segments within the study area are anticipated to operate at LOS D or better for this alternative. However, it should be noted that, north of the ATM limits, the NB US-23 corridor would operate similarly to how it does under the No-Build conditions.

30
Table 4-6: VISSIM Results for SB US-23 for AM Peak Hour for ATM (2040)
Description Facility Type
Ave Density per
lane
Ave. Speed
LOS
SB US-23 Exit Ramp at Silver Lake Road Ramp 15.1 56 B SB US-23 at Silver Lake Segment 19.8 63 C SB US-23 Entrance Ramp at Silver Lake Road Ramp 17.1 48 B SB US-23 N. of M-36 Segment 23.0 61 C SB US-23Exit Ramp at M-36 Ramp 16.6 52 B SB US-23 at M-36 Segment 21.7 62 C SB US-23 Entrance Ramp at M-36 Ramp 19.6 51 B SB US-23 between M-36 and 8 Mile Segment 28.0 60 D SB US-23 Exit Ramp at 8 Mile Ramp 14.0 55 B SB US-23 at 8 Mile Segment 17.1 63 B SB US‐23 Entrance Ramp at 8 Mile Road Ramp 15.6 58 B SB US-23 Between 8 Mile and Barker Segment 20.4 63 C SB US‐23 Entrance Ramp at Barker Road Ramp 16.6 53 B SB US‐23 Between Barker and 6 Mile Segment 22.3 60 C SB US‐23 Exit Ramp at 6 Mile Road Ramp 17.6 54 B SB US‐23 at 6 Mile Segment 20.6 63 C SB US‐23 Entrance Ramp at 6 Mile Road Ramp 17.8 55 B SB US‐23 between 6 Mile and Territorial Segment 25.1 59 C SB US‐23 Exit Ramp at N. Territorial Road Ramp 20.7 48 C SB US‐23 at N. Territorial Segment 25.5 56 C SB US‐23 Entrance Ramp at N. Territorial Road Ramp 40.5 31 E SB US‐23 Between N. Territorial and M-14 Segment 29.0 59 D SB US-23 to WB M-14 Ramp 75.5 31 F SB US-23 to EB M-14/(SB US-23) Ramp 25.9 59 C WB M-14 at Barton/Main Weave 92.8 11 F

31
Table 4-7: VISSIM Results for NB US-23 for PM Peak Hour for ATM (2040)
Description Facility Type Average Density per lane
Average Speed
LOS
NB US‐23 Entrance Ramp at Silver Lake Ramp 21.42 49 C NB US‐23 at Silver Lake Segment 26.76 63 D NB US‐23 Exit Ramp at Silver Lake Ramp 19.51 49 B NB US‐23 Between Silver Lake and M-36 Segment 30.91 61 D NB US‐23 Entrance Ramp at M‐36 Ramp 20.71 54 C NB US‐23 at M-36 Segment 27.51 61 D NB US‐23 Exit Ramp at M‐36 to the West Ramp 23.99 48 C NB US‐23 at M-36 Segment 34.07 54 D NB US‐23 Exit Ramp at M‐36 to the East Ramp 19.03 46 B NB US‐23 Between M-36 and 8 Mile Segment 32.91 58 D NB US‐23 Entrance Ramp at 8 Mile Ramp 14.52 57 B NB US‐23 at 8 Mile Segment 18.09 65 C NB US‐23 Exit Ramp at 8 Mile Ramp 13.94 48 B NB US‐23 Between 8 Mile and Barker Segment 19.67 64 C NB US‐23 Exit Ramp at Barker Ramp 16.64 55 B NB US‐23 Between Barker and 6 Mile Segment 21.39 61 C NB US‐23 Entrance Ramp at 6 Mile Ramp 15.84 57 B NB US‐23 at 6 Mile Segment 19.86 62 C NB US‐23 Exit Ramp at 6 Mile Ramp 16.43 58 B NB US‐23 Between 6 Mile and N. Territorial Segment 20.20 65 C NB US‐23 Entrance Ramp at N. Territorial Road Ramp 15.91 57 B NB US‐23 at N. Territorial Segment 17.67 63 B NB US‐23 Exit Ramp at N. Territorial Ramp 16.67 46 B NB US‐23 S. of Territorial Segment 18.97 65 C EB M-14 to NB US-23 Ramp 11.64 62 B WB M-14 to NB US-23 Ramp 21.50 63 C NB US-23 East of West Tri-Level Segment 26.16 61 C
32
Signalized and Unsignalized Intersection Analysis
The following section describes the operation of the signalized and unsignalized intersections at the interchange areas of US-23 within the study area. The summary tables and detailed results of this analysis and can be found in Appendix A-5.
There were some changes in the traffic patterns associated with the ATM alternative, however, since all of the TSM improvements are included in the ATM alternative, the results for the intersections analysis are similar.
US-23 and6 Mile Rd. Interchange Since the improvements associated with this interchanges are the same as what is proposed under the TSM alternative, the results of the analysis are very similar. The NB US-23 off-ramp with 6 Mile Rd. would be converted from a 2-way stop (for the ramp and Main St.) to a 4-way stop-controlled intersection (assuming all warrants are met). With this modification, all movements would operate at acceptable LOS.
US-23 and 8 Mile Rd. Interchange If the current signalized layout remains, both the SB US-23 off-ramp and the NB-US-23 off-ramps with 8 Mile Rd. would continue to operate at acceptable LOSs during both the AM and PM peak hour. However, the eastbound through movement at the intersection of 8 Mile Rd. and Whitmore Lake Rd. would continue to operate at LOS F during the AM peak hour causing backups in the eastbound direction. A roundabout option is also being considered for the ATM alternative. This option would consist of constructing tear-drop shaped roundabouts at both ramp terminals and at Whitmore Lake Rd. With this option, all roundabouts would operate at LOS A.
US-23 and North Territorial Rd. Interchange For the ATM alternative, only signal timing adjustments are proposed at the intersection of North Territorial Rd. and Whitmore Lake Rd. With optimized timings, this intersection would operate with the eastbound through movement at LOS F during the AM peak hour. All other movements at this intersection would operate at acceptable LOSs. For the ATM alternative, the intersections of the SB US-23 off-ramp with North Territorial Rd. and the NB US-23 off- ramp with North Territorial Rd. would be reconstructed as roundabouts. With this operational improvement, both the SB US-23 off-ramp and the NB US-23 off-ramp would operate at LOS A.
Other US-23 Interchanges
US-23 and Silver Lake Rd. There are no proposed changes at the interchange of US-23 and Silver Lake Rd. for the ATM alternative and therefore, the operation of these unsignalized intersections would be similar to the No-Build conditions, but with an improvement to LOS D during the AM peak hour (from LOS E in the No-Build conditions).
33
US-23 and M-36 There are also no improvements proposed at this interchange for the ATM alternative. The SB US-23 ramps would operate at acceptable LOSs for both peak hours but some movements on M-36, Whitmore Lake Rd. and Fieldcrest would continue to operate at LOS E and F. As mentioned previously, these movements do not interfere with traffic exiting US-23 so they do not cause operational concerns on US-23.
US-23 and Barker Rd. All movements at the US-23 ramps operate at acceptable LOSs during both peak hours at this interchange and, therefore, no improvements are proposed at this location.
Active Traffic Management with High Occupancy Vehicle (ATM-HOV) Dynamic Shoulder Use
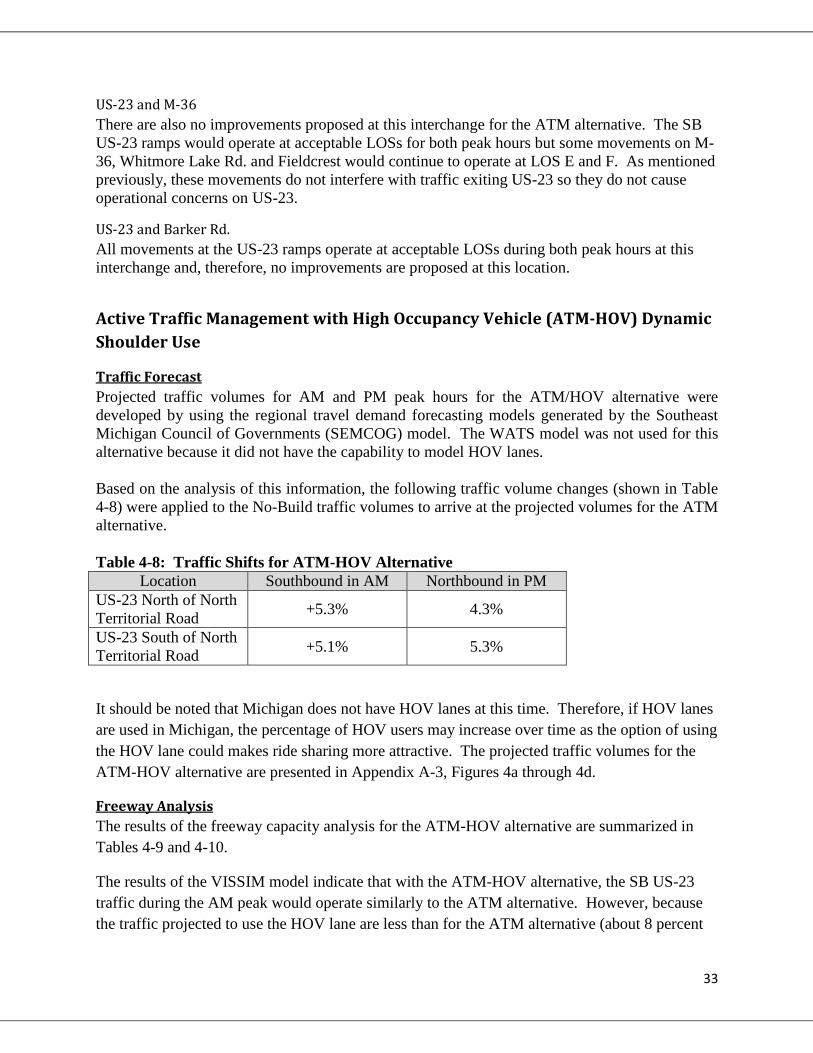
Traffic Forecast Projected traffic volumes for AM and PM peak hours for the ATM/HOV alternative were developed by using the regional travel demand forecasting models generated by the Southeast Michigan Council of Governments (SEMCOG) model. The WATS model was not used for this alternative because it did not have the capability to model HOV lanes. Based on the analysis of this information, the following traffic volume changes (shown in Table 4-8) were applied to the No-Build traffic volumes to arrive at the projected volumes for the ATM alternative. Table 4-8: Traffic Shifts for ATM-HOV Alternative
Location Southbound in AM Northbound in PM US-23 North of North Territorial Road +5.3% 4.3%
US-23 South of North Territorial Road +5.1% 5.3%
It should be noted that Michigan does not have HOV lanes at this time. Therefore, if HOV lanes are used in Michigan, the percentage of HOV users may increase over time as the option of using the HOV lane could makes ride sharing more attractive. The projected traffic volumes for the ATM-HOV alternative are presented in Appendix A-3, Figures 4a through 4d.
Freeway Analysis The results of the freeway capacity analysis for the ATM-HOV alternative are summarized in Tables 4-9 and 4-10.
The results of the VISSIM model indicate that with the ATM-HOV alternative, the SB US-23 traffic during the AM peak would operate similarly to the ATM alternative. However, because the traffic projected to use the HOV lane are less than for the ATM alternative (about 8 percent

34
of the drivers are expected to use the HOV lane), the amount of alleviation of the US-23 mainline traffic is slightly less.
For both SB US-23 and NB US-23, the ramp extensions and the use of the dynamic shoulder would alleviate the mainline US-23 traffic during the peaks and allow for smoother merge operations at the on-ramps. However, for SB US-23 in the AM peak hour, slowdowns are anticipated a little further to the north than for the ATM alternative. The interchange of SB US-23 at M-14 would drop to a LOS E for this alternative if no improvement was made at this location. A detailed discussion of a mitigation treatment for this interchange is provided at the end of this section under “US-23/M-14 Treatment”.
Since the results of the ATM-HOV alternative are similar to the ATM alternative, this alternative should result in similar safety benefits of reducing crashes near the merge areas and reducing other congestion related crashes within the limits of the dynamic shoulder use.

35
Table 4-9: VISSIM Results for SB US-23 for AM Peak Hour for ATM-HOV (2040)
Description Facility Type
Ave Density per
lane
Ave. Speed
LOS
SB US-23 Exit Ramp at Silver Lake Road Ramp 14.4 57 B SB US-23 at Silver Lake Segment 18.3 63 C SB US-23 Entrance Ramp at Silver Lake Road Ramp 15.4 50 B US-23 N. of M-36 Segment 21.2 62 C SB US-23 Exit Ramp at M-36 Ramp 15.3 53 B SB US-23 at M-36 Segment 19.8 62 C SB US-23 Entrance Ramp at M-36 Ramp 17.3 52 B SB US-23 between M-36 and 8 Mile Segment 25.3 61 C SB US-23 Exit Ramp at 8 Mile Ramp 13.3 54 B SB US-23 at 8 Mile Segment 16.3 63 B SB US‐23 Entrance Ramp at 8 Mile Road Ramp 16.9 56 B SB US-23 Between 8 Mile and Barker Segment 22.0 60 C SB US‐23 Entrance Ramp at Barker Road Ramp 19.2 50 B SB US‐23 Between Barker and 6 Mile Segment 20.9 60 C SB US‐23 Exit Ramp at 6 Mile Road Ramp 16.5 55 B SB US‐23 at 6 Mile Segment 22.1 60 C SB US‐23 Entrance Ramp at 6 Mile Road Ramp 23.4 50 C SB US‐23 between 6 Mile and Territorial Segment 34.3 49 D SB US‐23 Exit Ramp at N. Territorial Road Ramp 32.1 38 D SB US‐23 at N. Territorial Segment 49.7 37 F SB US‐23 Entrance Ramp at N. Territorial Road Ramp 46.4 30 F SB US‐23 Between N. Territorial and M-14 Segment 23.3 61 C SB US-23 to WB M-14 Ramp 39.2 47 E SB US-23 to EB M-14/(SB US-23) Ramp 21.5 63 C WB M-14 at Barton/Main Weave 92.2 11 F

36
Table 4-10: VISSIM Results for NB US-23 for PM Peak Hour for ATM-HOV (2040)
Description Facility Type Average Density per lane
Average Speed
LOS
NB US‐23 Entrance Ramp at Silver Lake Ramp 23.98 48 C NB US‐23 at Silver Lake Segment 29.93 61 D NB US‐23 Exit Ramp at Silver Lake Ramp 21.20 47 C NB US‐23 Between Silver Lake and M-36 Segment 34.60 59 D NB US‐23 Entrance Ramp at M‐36 Ramp 25.37 50 C NB US‐23 at M-36 Segment 31.09 60 D NB US‐23 Exit Ramp at M‐36 to the West Ramp 23.02 43 C NB US‐23 at M-36 Segment 34.50 56 D NB US‐23 Exit Ramp at M‐36 to the East Ramp 20.37 45 C NB US‐23 Between M-36 and 8 Mile Segment 35.26 56 E NB US‐23 Entrance Ramp at 8 Mile Ramp 15.78 57 B NB US‐23 at 8 Mile Segment 19.26 64 C NB US‐23 Exit Ramp at 8 Mile Ramp 14.81 48 B NB US‐23 Between 8 Mile and Barker Segment 21.26 62 C NB US‐23 Exit Ramp at Barker Ramp 19.50 51 B NB US‐23 Between Barker and 6 Mile Segment 22.53 60 C NB US‐23 Entrance Ramp at -Mile Ramp 16.66 56 B NB US‐23 at 6 Mile Segment 20.53 61 C NB US‐23 Exit Ramp at 6 Mile Ramp 17.58 57 B NB US‐23 Between 6 Mile and N. Territorial Segment 21.49 64 C NB US‐23 Entrance Ramp at N. Territorial Road Ramp 19.58 53 B NB US‐23 at N. Territorial Segment 20.26 61 C NB US‐23 Exit Ramp at N. Territorial Ramp 19.61 45 B NB US‐23 S. of Territorial Segment 20.43 64 C EB M-14 to NB US-23 Ramp 12.56 61 B WB M-14 to NB US-23 Ramp 21.83 63 C NB US-23 East of West Tri-Level Ramp 26.67 61 C

37
Signalized and Unsignalized Intersection Analysis The following section describes the operation of the signalized and unsignalized intersections at the interchange areas of US-23 within the study area for the ATM-HOV alternative. The summary tables and detailed results of this analysis and can be found in Appendix A-5.
There were some changes in the traffic patterns associated with the ATM-HOV alternative. With the exception of the US-23 interchange at Silver Lake Rd. and 6 Mile Rd., the results for the intersections analysis are similar to those of the other build alternatives.
US-23 and 6 Mile Rd. Interchange The NB US-23 off-ramp with 6 Mile Rd. would be converted from a 2-way stop (for the ramp and Main St.) to a 4-way stop-controlled intersection. With the ATM-HOV traffic volumes that are forecasted, the northbound off-ramp movement improves but the westbound and northbound movements drop to LOS E.
US-23 and 8 Mile Rd. Interchange With traffic signals at both the SB US-23 off-ramp and the NB-US-23 off-ramps with 8 Mile Rd. would continue to operate at acceptable LOSs during both the AM and PM peak hour. The eastbound through movement at the intersection of 8 Mile Rd. and Whitmore Lake Rd. would continue to operate at LOS F during the AM peak hour causing backups in the eastbound direction. A roundabout option is also being considered for the ATM-HOV and all build alternatives. This option would consist of constructing tear-drop shaped roundabouts at both ramp terminals and at Whitmore Lake Rd. resulting in LOS A operations for all of the roundabouts.
US-23 and North Territorial Rd. Interchange As with all the build alternatives, only signal timing adjustments are proposed at the intersection of North Territorial Rd. and Whitmore Lake Rd. With optimized timings, this intersection would operate with the eastbound through movement at LOS F during the AM peak hour. All other movements at this intersection would operate at acceptable LOSs. For the ATM-HOV alternative (and all of the build alternatives), the intersections of the SB US-23 off-ramp with North Territorial Rd. and the NB US-23 off- ramp with North Territorial Rd. would be reconstructed as roundabouts. With this operational improvement, both the SB US-23 off-ramp and the NB US-23 off-ramp would operate at LOS A.
Other US-23 Interchanges
US-23 and Silver Lake Rd. There are no proposed changes at the interchange of US-23 and Silver Lake Rd. However, with the traffic shifts that are expected to occur with the ATM-HOV alternatives, the LOS for the southbound movement remains at LOS E during the AM period (same as for the No-Build conditions).

38
US-23 and M-36 There are also no improvements proposed at this interchange for this alternative. The SB US-23 ramps would operate at acceptable LOSs for both peak hours but some movements on M-36, Whitmore Lake Rd. and Fieldcrest would continue to operate at LOS E and F (without impacting US-23 traffic) .
US-23 and Barker Rd. All movements at the US-23 ramps operate at acceptable LOSs during both peak hours at this interchange and, therefore, no improvements are proposed at this location.
US-23/M-14 Mitigation As described previously, for the ATM and ATM-HOV alternatives, operations along SB US-23 from the northern limits to the N. Territorial Rd. interchange improve. However, because of this improvement in traffic flow along SB US-23, if no improvements are made at the SB US-23/M-14 interchange, the LOS on SB US-23 would be drop in this area.
Because of this drop in LOS, a mitigation treatment was developed for this area as depicted in Figure 4.1. This option would involve extending the outside ramp lane lane for the SB US-23 to WB M-14 ramp approximately 2500 feet and shifting the alignment of SB US-23 to match the existing alignment of the ramp lanes (see the Environmental Assessment for the detailed alignment).
Figure 4.1 Schematic of Mitigation Treatment for at SB US-23/M-14
With this improvement, SB US-23 at the US-23/M-14 interchange is expected to operate at acceptable levels-of-service for both the ATM and ATM-HOV alternatives, as shown in Tables 4-11 and 4-12. This modification helps alleviate the backups caused by the weave movement on M-14 near Barton Drive that impedes the flow of traffic on SB US-23 just north of the M-14 interchange (the average speed will be approximately 60 mph for both alternatives at this

39
location). For the ATM alternative, occasional slowdowns at the N. Territorial Rd. on-ramp would still be anticipated in the outside lane at the merge areas. For the ATM-HOV alternative, the segment north of N. Territorial Rd. is also expected to experience slowdowns to the north along US-23. However, both of these situations are an improvement over the No-Build conditions.
Table 4-11: VISSIM Results for SB US-23 for AM Peak Hour for ATM with US-23/M-14 Treatment (2040)
Description Facility Type Average Density per lane
Average Speed
LOS
SB US-23 at N. Territorial Rd. Segment 25.60 55 C SB US-23 Entrance Ramp at N. Territorial Rd. Ramp 40.29 31 E
SB US-23 Between N. Territorial Rd. and Warren Rd. Segment 26.02 (28.99*)
61 (59*)
D (D*)
SB US-23 Between Warren Rd. and M-14 Segment 25.07 (52.60*)
59 (34*)
C (F*)
SB US-23 to WB M-14 Ramp 77.89 33 F SB US-23 to EB M-14/(SB US-23) Ramp 25.63 61 C WB M-14 at Barton Dr./Main St. Weave 93.41 11 F *indicates performance of this segment without the mitigation treatment.
Table 4-12: VISSIM Results for SB US-23 for AM Peak Hour for ATM-HOV with US-23/M-14 Treatment (2040)
Description Facility Type Average Density per lane
Average Speed
LOS
SB US-23 at N. Territorial Rd. Segment 49.17 37 F SB US-23 Entrance Ramp at N. Territorial Rd. Ramp 46.49 30 F
SB US-23 Between N. Territorial Rd. and Warren Rd. Segment 23.66 (23.33*)
60 (61*)
C (C*)
SB US-23 Between Warren Rd. and M-14 Segment 16.08 (21.88*)
64 (58*)
B (C*)
SB US-23 to WB M-14 Ramp 49.38 44 F
SB US-23 to EB M-14/(SB US-23) Ramp 21.32 63 C
WB M-14 at Barton Dr./Main St. Weave 93.13 11 F *indicates performance of this segment without the mitigation treatment.

40
41
5. Comparative Analysis The alternatives were compared to see how each addressed the following criteria:
• Relieve the directional weekday rush hour congestion • Improve operations at the ramp merge and diverge points • Improve safety along the US-23 corridor • Improve operations during incident management • Improve operations at the 8 Mile Road, 6 Mile Road, and North Territorial Road
interchanges with US-23 with the reconstruction of these bridges • Maintain or improve operational conditions at other corridor interchanges
Peak Hour Congestion It is difficult to compare the overall benefits of the build alternatives by just comparing the LOS from the VISSIM simulation (see Section 5) because each of the build alternatives shows improvements at different areas along the US-23 corridor. Therefore, the average travel time was computed (using VISSIM) for each of the alternatives to further compare the overall benefits. The travel time was set up to measure from M-14 to I-96 in order to capture any queuing that could occur along the corridor (14.7 miles southbound and 14.6 miles northbound). Table 5-1 summarizes the average travel time for each alternative.
Table 5-1 US-23 Travel Time Summary (average minutes between M-14 and I-96))
Trav
el T
ime
(M-1
4 to
I-96
)
Exis
ting
RI
TIS
/VIS
SIM
(2
015)
No-
Build
(2
040)
TS
M
(204
0)
Impr
ovem
ent
Ram
p M
eter
ing
(204
0)
Impr
ovem
ent
ATM
* (2
040)
Impr
ovem
ent
ATM
-HO
V*
(204
0)
Impr
ovem
ent
SB in AM 16.8/14.8 15.8 15.7 0.6 % 15.7 .6 % 14.4 8.9 % 15.4 2.5 % NB in PM 15.7/14.7 15.1 14.8 2.0 % 14.9 1.3 % 14.4 4.6 % 15.1 0 % *The ATM and ATM-HOV alternatives are shown with the mitigation treatment at US-23/M-14.
As mentioned previously, the travel time from the VISSIM simulation takes into account ideal conditions. Although the VISSIM model was calibrated to match existing conditions as much as possible, the field measurements of travel time for southbound US-23 in the AM and northbound US-23 in the PM showed that travel times vary day to day (as described in Section 2). Therefore, the travel time savings realized by each of the build alternatives is anticipated to be larger than what is shown in Table 5-1. For comparison purposes, the percent change in travel time was used as a measurement of peak hour congestion management.

42
The ATM alternative showed the highest percent improvement in travel time for both the AM and PM peak periods. For the AM peak, the ATM-HOV showed the second highest improvement in travel times, and for the PM peak period, the TSM alternative showed the second highest improvement in travel times.
It is important to note that although the travel time results from VISSIM do not show large improvements in peak period travel time for the US-23 corridor, the ATM and ATM-HOV alternative are servicing more people and vehicles during the AM and PM peak. The ATM alternative shows that traffic would be diverted from other slower routes over the next twenty years (8 to 18 percent depending on the location and time period- as shown in the “Traffic Methodology” memo presented in Appendix A-6), and the ATM-HOV alternative shows about a 5 percent increase in vehicular traffic (with the HOV lane carrying vehicles with 2 or more persons). Therefore, it is important to note that although the percent increase in the US-23 travel time is relatively low, there are more people-trips benefiting from the improved travel time.
Ramp Operation As indicated in the purpose and need, it is desirable to improve the operation of the ramp merge and diverge points along US-23. Tables 5-2 and 5-3 shows the LOS results of the ramp merge and diverge points for southbound and northbound US-23.
Although the TSM and Ramp Metering alternatives improve the operation of the ramp merge and diverges along US-23, there is not significant improvement in the ramp performance with these alternatives.
With the ATM and ATM-HOV alternatives, the median shoulder is able to carry some of the heavy US-23 traffic which reduces the amount of traffic in the outside right lane. The VISSIM simulation shows that this creates more gaps in the mainline traffic and improves performance at the on and off-ramps.
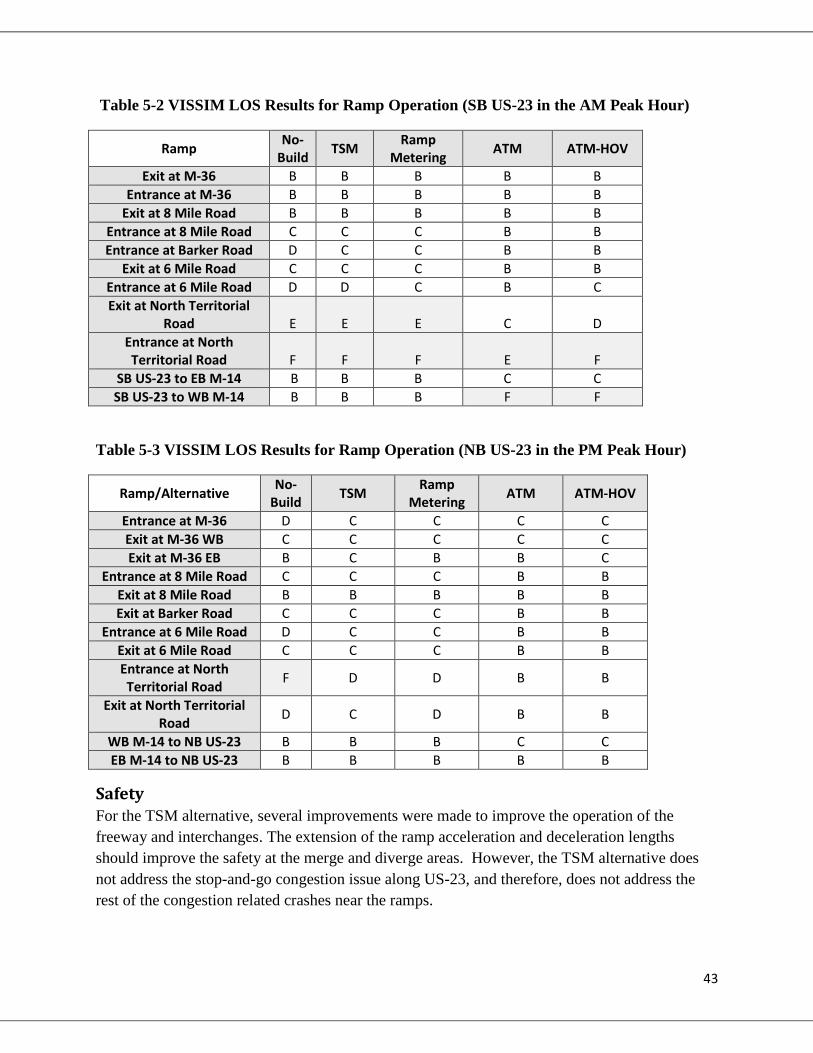
43
Table 5-2 VISSIM LOS Results for Ramp Operation (SB US-23 in the AM Peak Hour)
Ramp No-Build TSM Ramp
Metering ATM ATM-HOV
Exit at M-36 B B B B B Entrance at M-36 B B B B B
Exit at 8 Mile Road B B B B B Entrance at 8 Mile Road C C C B B Entrance at Barker Road D C C B B
Exit at 6 Mile Road C C C B B Entrance at 6 Mile Road D D C B C Exit at North Territorial
Road E E E C D Entrance at North Territorial Road F F F
E F
SB US-23 to EB M-14 B B B C C SB US-23 to WB M-14 B B B F F
Table 5-3 VISSIM LOS Results for Ramp Operation (NB US-23 in the PM Peak Hour)
Ramp/Alternative No-Build TSM Ramp
Metering ATM ATM-HOV
Entrance at M-36 D C C C C Exit at M-36 WB C C C C C Exit at M-36 EB B C B B C
Entrance at 8 Mile Road C C C B B Exit at 8 Mile Road B B B B B Exit at Barker Road C C C B B
Entrance at 6 Mile Road D C C B B Exit at 6 Mile Road C C C B B Entrance at North Territorial Road F D D B B
Exit at North Territorial Road D C D B B
WB M-14 to NB US-23 B B B C C EB M-14 to NB US-23 B B B B B
Safety For the TSM alternative, several improvements were made to improve the operation of the freeway and interchanges. The extension of the ramp acceleration and deceleration lengths should improve the safety at the merge and diverge areas. However, the TSM alternative does not address the stop-and-go congestion issue along US-23, and therefore, does not address the rest of the congestion related crashes near the ramps.
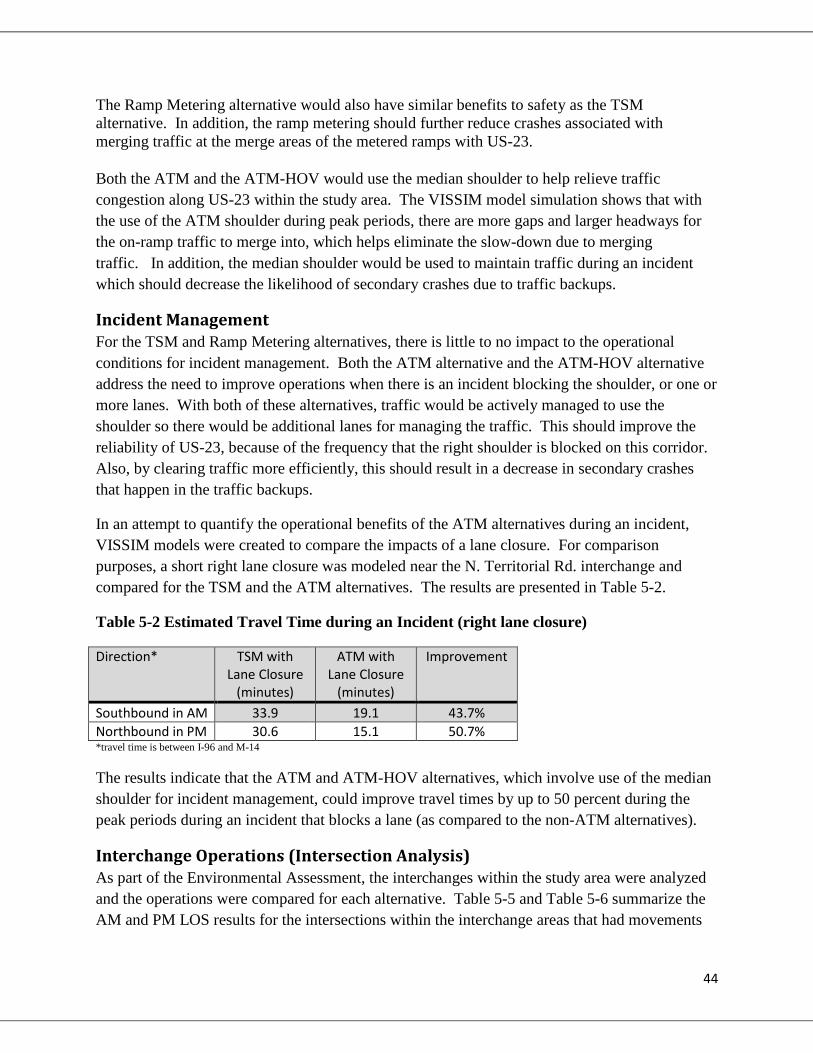
44
The Ramp Metering alternative would also have similar benefits to safety as the TSM alternative. In addition, the ramp metering should further reduce crashes associated with merging traffic at the merge areas of the metered ramps with US-23.
Both the ATM and the ATM-HOV would use the median shoulder to help relieve traffic congestion along US-23 within the study area. The VISSIM model simulation shows that with the use of the ATM shoulder during peak periods, there are more gaps and larger headways for the on-ramp traffic to merge into, which helps eliminate the slow-down due to merging traffic. In addition, the median shoulder would be used to maintain traffic during an incident which should decrease the likelihood of secondary crashes due to traffic backups.
Incident Management For the TSM and Ramp Metering alternatives, there is little to no impact to the operational conditions for incident management. Both the ATM alternative and the ATM-HOV alternative address the need to improve operations when there is an incident blocking the shoulder, or one or more lanes. With both of these alternatives, traffic would be actively managed to use the shoulder so there would be additional lanes for managing the traffic. This should improve the reliability of US-23, because of the frequency that the right shoulder is blocked on this corridor. Also, by clearing traffic more efficiently, this should result in a decrease in secondary crashes that happen in the traffic backups.
In an attempt to quantify the operational benefits of the ATM alternatives during an incident, VISSIM models were created to compare the impacts of a lane closure. For comparison purposes, a short right lane closure was modeled near the N. Territorial Rd. interchange and compared for the TSM and the ATM alternatives. The results are presented in Table 5-2.
Table 5-2 Estimated Travel Time during an Incident (right lane closure)
Direction* TSM with Lane Closure
(minutes)
ATM with Lane Closure
(minutes)
Improvement
Southbound in AM 33.9 19.1 43.7% Northbound in PM 30.6 15.1 50.7% *travel time is between I-96 and M-14
The results indicate that the ATM and ATM-HOV alternatives, which involve use of the median shoulder for incident management, could improve travel times by up to 50 percent during the peak periods during an incident that blocks a lane (as compared to the non-ATM alternatives).
Interchange Operations (Intersection Analysis) As part of the Environmental Assessment, the interchanges within the study area were analyzed and the operations were compared for each alternative. Table 5-5 and Table 5-6 summarize the AM and PM LOS results for the intersections within the interchange areas that had movements
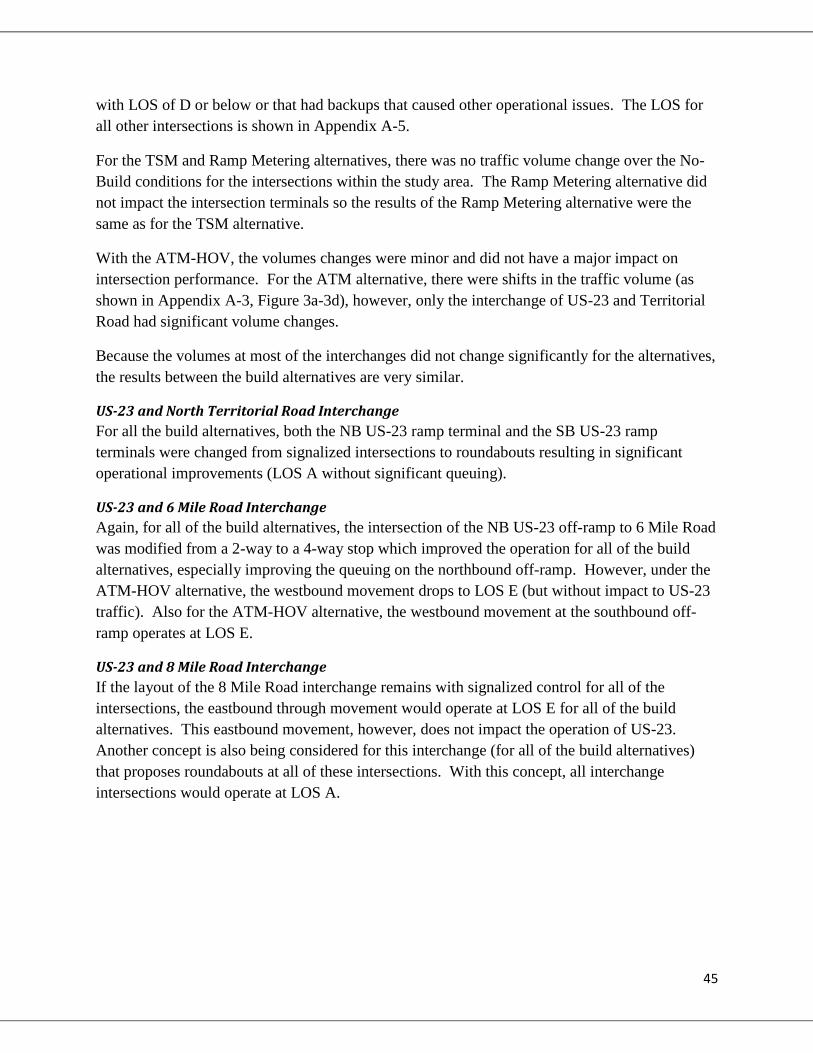
45
with LOS of D or below or that had backups that caused other operational issues. The LOS for all other intersections is shown in Appendix A-5.
For the TSM and Ramp Metering alternatives, there was no traffic volume change over the No-Build conditions for the intersections within the study area. The Ramp Metering alternative did not impact the intersection terminals so the results of the Ramp Metering alternative were the same as for the TSM alternative.
With the ATM-HOV, the volumes changes were minor and did not have a major impact on intersection performance. For the ATM alternative, there were shifts in the traffic volume (as shown in Appendix A-3, Figure 3a-3d), however, only the interchange of US-23 and Territorial Road had significant volume changes.
Because the volumes at most of the interchanges did not change significantly for the alternatives, the results between the build alternatives are very similar.
US-23 and North Territorial Road Interchange For all the build alternatives, both the NB US-23 ramp terminal and the SB US-23 ramp terminals were changed from signalized intersections to roundabouts resulting in significant operational improvements (LOS A without significant queuing).
US-23 and 6 Mile Road Interchange Again, for all of the build alternatives, the intersection of the NB US-23 off-ramp to 6 Mile Road was modified from a 2-way to a 4-way stop which improved the operation for all of the build alternatives, especially improving the queuing on the northbound off-ramp. However, under the ATM-HOV alternative, the westbound movement drops to LOS E (but without impact to US-23 traffic). Also for the ATM-HOV alternative, the westbound movement at the southbound off-ramp operates at LOS E.
US-23 and 8 Mile Road Interchange If the layout of the 8 Mile Road interchange remains with signalized control for all of the intersections, the eastbound through movement would operate at LOS E for all of the build alternatives. This eastbound movement, however, does not impact the operation of US-23. Another concept is also being considered for this interchange (for all of the build alternatives) that proposes roundabouts at all of these intersections. With this concept, all interchange intersections would operate at LOS A.

46
Table 5-5 Intersection Level-of-Service for AM Peak Hour (2040) for Critical Intersections
Alternative
Eastbound Westbound Northbound Southbound
Lef
t
Thr
ough
Rig
ht
Lef
t
Thr
ough
Rig
ht
Lef
t
Thr
ough
Rig
ht
Lef
t
Thr
ough
Rig
ht
SB Ramps at Silver Lake Rd No Build - A A A A - - - - E E E TSM - A A A A - - - - E E E Ramp Metering - A A A A - - - - D - D ATM - A A A A - - - - D - D ATM-HOV - A A A A - - - - E - E
NB Ramps at Silver Lake Road No-Build A A - - A A F - F - - - TSM A A - - A A F - F - - - Ramp Metering A A - - A A F - F - - - ATM A A - - A A F - F - - - ATM-HOV A A - - A A F - F - - -
M-36 at Whitmore Lake Road No-Build - F B D D D E E E F F F TSM - F B D D D E E E F F F Ramp Metering - F B D D D E E E F F F ATM - F B D D D E E E E E E ATM-HOV - F B D D D E E E E E E
SB On Ramp M-36 (and Park and Ride Lot) No-Build A A A A A - F F F - - - TSM A A A A A - F F F - - - Ramp Metering A A A A A - F F F - - - ATM A A A A A - F F F - - - ATM-HOV A A A A A - F F F - - -
M-36 at Fieldcrest No-Build A A - - A A - - - F - F TSM A A - - A A - - - F - F Ramp Metering A A - - A A - - - F - F ATM A A - - A A - - - F - F ATM-HOV A A - - A A - - - F - F
8 Mile Road at Whitmore Lake Road* No-Build - F - - A C - - - D - B TSM* - F - - A C - - - D - B Ramp Metering* - F - - A C - - - D - B ATM* - E - - A C - - - D - B ATM-HOV* - E - - A C - - - D - B
NB Ramps at 6 Mile Road No-Build A A - - A A F C C C - C TSM B B - - C C B B B B - D Ramp Metering B B - - C C B B B B - D ATM B B - - C C B B B B - D ATM-HOV B B - - E E B B B B - E
North Territorial Road at Whitmore Lake No-Build D F - D B - D B - D D - TSM B E - D B - C C - C D B Ramp Metering B E - D B - C C - C D B ATM B E - C B - C C - C D - ATM-HOV B E - D B - C C - C D - *This intersection was analyzed with only signal timing improvements. However, a roundabout option is being considered as presented in the Environmental Assessment. The roundabout option would operate at LOS A for all roundabouts being considered at this interchange. The results of this analysis are presented in Appendix A-5.
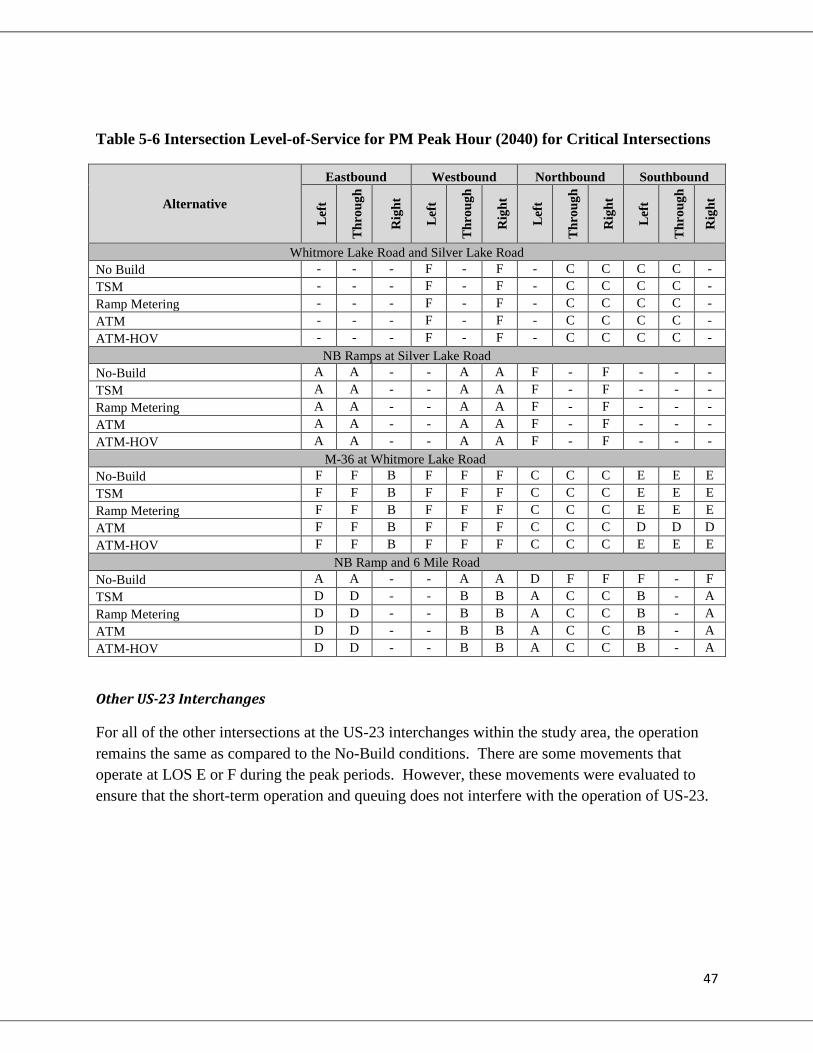
47
Table 5-6 Intersection Level-of-Service for PM Peak Hour (2040) for Critical Intersections
Alternative
Eastbound Westbound Northbound Southbound
Lef
t
Thr
ough
Rig
ht
Lef
t
Thr
ough
Rig
ht
Lef
t
Thr
ough
Rig
ht
Lef
t
Thr
ough
Rig
ht
Whitmore Lake Road and Silver Lake Road No Build - - - F - F - C C C C - TSM - - - F - F - C C C C - Ramp Metering - - - F - F - C C C C - ATM - - - F - F - C C C C - ATM-HOV - - - F - F - C C C C -
NB Ramps at Silver Lake Road No-Build A A - - A A F - F - - - TSM A A - - A A F - F - - - Ramp Metering A A - - A A F - F - - - ATM A A - - A A F - F - - - ATM-HOV A A - - A A F - F - - -
M-36 at Whitmore Lake Road No-Build F F B F F F C C C E E E TSM F F B F F F C C C E E E Ramp Metering F F B F F F C C C E E E ATM F F B F F F C C C D D D ATM-HOV F F B F F F C C C E E E
NB Ramp and 6 Mile Road No-Build A A - - A A D F F F - F TSM D D - - B B A C C B - A Ramp Metering D D - - B B A C C B - A ATM D D - - B B A C C B - A ATM-HOV D D - - B B A C C B - A
Other US-23 Interchanges
For all of the other intersections at the US-23 interchanges within the study area, the operation remains the same as compared to the No-Build conditions. There are some movements that operate at LOS E or F during the peak periods. However, these movements were evaluated to ensure that the short-term operation and queuing does not interfere with the operation of US-23.

48

49
6. Summary Table 6.1 summarizes how each alternative meets the traffic and safety related objectives of the purpose and need on a scale of low to high. As demonstrated in this table, the ATM and ATM-HOV alternatives meet these goals better than the other alternatives. The ATM and ATM-HOV alternatives meet the need of incident management and safety at a “high” level compared to the other alternatives because these alternatives allow the use of the median shoulder to manage traffic during incidents. By managing traffic incidents more efficiently, secondary crashes due to incident congestion should also be reduced. In addition, the ATM and ATM-HOV alternatives allow more people to use the US-23 corridor at an improved travel time by diverting traffic off of other slower routes (such as indirect secondary road routes).
Table 6.1 Alternative Comparison
Need for Improvement TSM Ramp Metering
ATM- General Purpose
ATM- HOV
Peak Hour Congestion Low Low Medium Medium Safety Medium High High High Ramp Operation Medium Medium Medium Medium Incident Management Low Low High High 8 Mile, 6 Mile, and Territorial Interchanges High High High High Other Corridor Interchanges Low Low Low Low
i PTV VISSIM 7, PTV Group ii Highway Capacity Manual 2010, Federal Highway Administration, December 2010 iii Synchro plus SimTraffic7, Traffic Signal Coordination Software, TrafficWare, Ltd., 1993-2007