MDGF 1656 - sdgfund.org
68
MDGF 1656 Strengthening the Philippines Institutional Capacity to Adapt to Climate Change Health Sector Book IV Final Report April 27, 2011 Institute of Health Policy and Development Studies National Institutes of Health UP Manila
Transcript of MDGF 1656 - sdgfund.org

MDGF 1656
Strengthening the Philippines Institutional Capacity to Adapt
to Climate Change
Health Sector
Book IV
Final Report
April 27, 2011
Institute of Health Policy and
Development Studies
National Institutes of Health UP Manila

MDGF 1656: Conduct of Climate Change Vulnerability
and Impact Assessment Framework,
Development of a Monitoring and Evaluation
Framework/System, and Compendium of Good and
Innovative Climate Change Adaptation Practices
(Health Sector)
Book IV
FINAL REPORT
April 27, 2011
Institute of Health Policy and Development Studies
National Institutes of Health
University of the Philippines Manila

Procedural (step by step) Vulnerability Assessment Write-up for Climate Change Adaptation (Health Sector)
Training Manual: Climate Change Vulnerability and Adaptation Project: HEALTH SECTOR UP-NIH November 2010
1
Procedural (step by step) Vulnerability Assessment Write-up (Health Sector)
A component of the Training Manual (Draft 01)
Definition of Vulnerability Vulnerability is defined by the IPCC as ―the degree, to which a system is susceptible to, or unable to cope with, adverse effects of climate change, including climate variability and extremes. Vulnerability is a function of the character, magnitude, and rate of climate change and variation to which a system is exposed, its sensitivity, and its adaptive capacity‖ (McCarthy et al., 2001). Vulnerability of the Health Sector According to the World Health Organization (WHO), climatic changes over recent decades have probably already affected some health outcomes. World Health Report 2002 says that climate change was estimated to be responsible in year 2000 for approximately 2.4% of worldwide diarrhea, and 6% of malaria in some middle-income countries. The first detectable changes in human health may well be alterations in the geographic range (latitude and altitude) and seasonality of certain infectious diseases – including vector-borne infections such as malaria and dengue fever, and food-borne infections, which normally peak in the warmer months. Warmer average temperatures combined with increased variations in climate would alter the pattern of exposure to extreme temperatures and resultant health impacts. The Intergovernmental Panel on Climate Change (IPCC) concluded that overall, climate change is projected to increase threats to human health, particularly in lower income populations and predominantly within tropical/subtropical countries. Three broad categories of health impacts are associated with climatic conditions: (1) impacts that are directly related to weather/climate; (2) impacts that result from environmental changes that occur in response to climatic change; and (3) impacts resulting from consequences of climate-induced economic dislocation, environmental decline, and conflict. The first two categories are often referred to as climate-sensitive diseases; these include changes in the frequency and intensity of thermal extremes and extreme weather events (i.e., floods and droughts) that directly affect population health, and indirect impacts that occur through changes in the range and intensity of infectious diseases and food- and waterborne diseases and changes in the prevalence of diseases associated with air pollutants and aeroallergens. The greater the exposure or sensitivity, the greater the vulnerability: the greater the adaptive capacity, the lower the vulnerability. An assessment of vulnerability must consider all these components to be comprehensive. An impact of climate change is typically the effect of climate change. For biophysical systems it can be change in
Procedural (step by step) Vulnerability Assessment Write-up for Climate Change Adaptation (Health Sector)
Training Manual: Climate Change Vulnerability and Adaptation Project: HEALTH SECTOR UP-NIH November 2010
2
productivity, quality, or population numbers or range. For societal systems, impact can be measured as change in value (e.g., gain or loss of income) or in morbidity, mortality, or other measure of well-being (Parry and Carter, 1998). The vulnerability of human health to climate change is a function of three components namely; sensitivity, exposure, and adaptation:
Sensitivity, which includes the extent to which health or the natural or social systems on which health outcomes depend are sensitive to changes in weather and climate (the exposure–response relationship) and the characteristics of the population, such as the level of development and its demographic structure;
Exposure to the weather or climate-related hazard, including the character, magnitude and rate of climate variation.
Adaptation measures and actions in place to reduce the burden of a specific adverse health outcome (the adaptation baseline), the effectiveness of which determines in part the exposure–response relationship.
Populations, subgroups and systems that cannot or will not adapt are more vulnerable, as are those that are more susceptible to weather and climate changes. Understanding a population‘s capacity to adapt to new climate conditions is crucial to realistically assessing the potential health effects of climate change. In general, the vulnerability of a population to a health risk depends on factors such as population density, level of economic development, food availability, income level and distribution, local environmental conditions, health status, and the quality and availability of health care. These factors are not uniformly distributed across a region or country or across time, and differ based on geography, demography and socio-economic factors. Effectively targeting prevention or adaptation strategies requires understanding which demographic or geographical subpopulations may be most at risk and when that risk is likely to increase. Thus, individual, community and geographical factors determine vulnerability. The cause-and-effect chain from climate change to changing disease patterns can be extremely complex and includes many non-climatic factors, such as distribution of income, provision of medical care, and access to adequate nutrition, clean water and sanitation. Therefore, the severity of impacts actually experienced will be determined not only by changes in climate but also by concurrent changes in non-climatic factors and by the adaptation measures implemented to reduce negative impacts.

Procedural (step by step) Vulnerability Assessment Write-up for Climate Change Adaptation (Health Sector)
Training Manual: Climate Change Vulnerability and Adaptation Project: HEALTH SECTOR UP-NIH November 2010
3
Key Steps in Vulnerability Assessment Vulnerability assessment is a key aspect of streamlining assessments of climate change impacts to present development planning. This includes five key steps and suggests appropriate methods suitable for different levels of analysis. The five tasks link the conceptual framework of health sector vulnerability to identification of vulnerable conditions, analytical tools and stakeholders. Vulnerability varies widely across peoples, sectors and regions. This diversity of the ‗real world‘ is the starting place for vulnerability assessment. Distinguishing between scales helps simplify the conceptual and analytical issues:
International comparisons of vulnerability tend to focus on national indicators, for example to group less developed countries or compare progress in human development among countries with similar economic conditions.
At a national level, vulnerability assessments contribute to setting development priorities and monitoring progress. Sectoral assessments provide more detailed and targets for strategic development plans.
At a local or community level, vulnerable groups can be identified and coping strategies implemented, often employing participatory methods.
Step 1: Vulnerability Frameworks and Definitions The initial task of an interdisciplinary (vulnerability assessment) team is to clarify the conceptual framework and the analytical definitions that form the core of the assessment (see below: Proposed Process Framework for Vulnerability Assessment: Health Sector). A shared language will facilitate new insights and help communicate to key stakeholders. This task has close links with the overall scoping of the project.

Procedural (step by step) Vulnerability Assessment Write-up for Climate Change Adaptation (Health Sector)
Training Manual: Climate Change Vulnerability and Adaptation Project: HEALTH SECTOR UP-NIH November 2010
4
(HUMAN HEALTH)Diseases:MalariaDengue
LeptospirosisCholeraTyphoid
(ENDEMICITY / PREVALENCE)
Health Risk Assessment(Climate Change Vulnerability)(Dengue, Malaria, Leptospirosis,
Cholera, and Typhoid)
Scoping: Health Impact
Analysis
Disease ID, Prevalence, and
Endemicity
PrevalenceAssessment
RiskEvaluation / Estimation
Health
System andInfrastructure
Socio –
EconomicFactors
Env ironmentalFactors
Pathogen /Vector
Factors
Health Policy
Env ironmentalPolicy
Indiv idual /
Family /Community
CLIMATE CHANGE(RAINFALL / TEMPERATURE)
VULNERABILITIES
PROPOSED PROCESSFRAMEWORK FOR CC VULNERABILITY ASSESSMENT (Health Sector)
Project Validation Sites
-Pangasinan- Rizal
- Palawan
ENVIRONMENTAL FACTORS
-Solid Waste
management- Human
Settlements- Land use
Classification
ECOLOGICALFACTORS
-Forest Cover-Water Shed
-Topography- River System
The starting point should be to review existing national or local assessments that relate to vulnerability, such as national development plans, poverty reduction strategy papers, environmental sustainability plans and natural hazards assessments. If there is a common approach already in use—for instance in development planning or mapping hazards—then it makes sense to begin with that framework. It may need to be extended to incorporate climatic risks and climate change side by side with health data. The main output of this task is for the team to level off with the core framework for the vulnerability assessment and relate this with existing local or national assessment or database framework (if available).

Procedural (step by step) Vulnerability Assessment Write-up for Climate Change Adaptation (Health Sector)
Training Manual: Climate Change Vulnerability and Adaptation Project: HEALTH SECTOR UP-NIH November 2010
5
Step 2: Establishing Baseline and Targeting Vulnerable Groups The second step is to review present conditions in order to target vulnerable groups and establish a relevant database. General questions to be address in this stage includes but not limited to the following:
Who are vulnerable? To what particular hazard or risk? Where are they located?
Available secondary data and maps should be maximized before collecting primary data. Some advanced Local Government Units may have already produced related inventories, such as poverty maps, human development indices, and environmental sustainability indices. The development baseline should incorporate two levels of analysis:
A comprehensive set of spatial indicators of vulnerability.
Identification of target vulnerable groups that are priority for adaptation.
Vulnerability is a relative measure; it does not exist as something we can observe and measure. Therefore, indicators can only be selected based on choices by the technical team, stakeholders and the vulnerable communities themselves. Developing and using indicators requires knowledge of several technical issues, including their sensitivity to change, standardizing indicators for comparison, reliability of the data, mapping of indicators, coverage of relevant dimensions of vulnerability, etc. The choice of the target of the vulnerability assessment should be related to the problems identified in scoping the project. The central concern of vulnerability assessment is people—those who should be protected from the adverse consequences of present climatic variations. These might be demographic groups (such as young children), livelihoods (urban poor in the informal economy) or populations at risk from diseases including endemic diseases in certain geographic areas. The main output of this task is a set of vulnerability indicators and identification of vulnerable geographic areas that together form a baseline of present development. The collation of vulnerability indicators underpins the analyses and identification of priorities for adaptation. Step 3: Linking Baseline Information to Climate Impacts and Health Risks
The first two steps establish present conditions of development; the next step is to refine the analysis and link the development baseline explicitly to climate impacts and risks to human health. One of the most important tools in assessing potential health risk is the vulnerability map. If risk maps of present climatic variations are already available at the local regional or national levels this should be incorporated in the vulnerability maps.

Procedural (step by step) Vulnerability Assessment Write-up for Climate Change Adaptation (Health Sector)
Training Manual: Climate Change Vulnerability and Adaptation Project: HEALTH SECTOR UP-NIH November 2010
6
If quantitative impacts assessments are not available, it is possible to develop indicators of present climatic risks. These might be relatively simple climatic thresholds (e.g., probability of drought or flood). Historical episodes, such as the drought of record or extreme rainfall (eg., typhoon Ondoy) during historical storms can help define at-risk regions, provinces or municipalities. In case formal models of (present) climate impacts and data on climatic risks and human health are not available, expert opinion and case examples from similar countries can be used to develop plausible local impacts scenarios. Such scenarios are exploratory—they are difficult to translate into probabilities—but are often useful in revealing potential vulnerabilities and policy responses. For instance, worst case scenarios are commonly used in disaster planning. Generally, the output from this step is an understanding of the present probability of a range of climatic conditions and health hazards. The conjunction of the climatic hazards and development baseline comprises the present climate vulnerability. Step 4: Linking the Present and Future Scenarios At this point the vulnerability database includes climatic risks and identification of target vulnerable groups. It is a useful snapshot of present vulnerability reflected in a range of indicators. The next step is to provide a more qualitative understanding of the drivers of vulnerability—what shapes exposure to climatic risks? At what scales? This analysis links the present (snapshot) with pathways of the future--that may lead to sustainable development or further vulnerabilities. The techniques for ‗mapping‘ the structure of present vulnerability and how it might change in the future are likely to be qualitative in the first instance. Interactive exercises (such as cognitive mapping) amongst experts and stakeholders can help refine the initial VA framework by suggesting linkages between the vulnerable groups, socio-institutional factors (e.g., social networks, regulation and governance), their resources and economic activities, and the kinds of threats (and opportunities) resulting from climatic variations. Extending the drivers of present vulnerability to the future typically is based on a range of socio-economic scenarios. Existing development scenarios (BAU scenario) are the best place to start: are there projections for development targets? Or sectoral scenarios may be relevant (eg., National Water Assessment reports). Otherwise, stakeholder led exercises in creating visions of the future (including worst case scenarios) are worth pursuing. Two technical issues need to be clarified in the VA at this stage:
Most indicators are snapshots of present status, for example GDP per capita. However, vulnerability is dynamic and indicators that foreshadow future vulnerability may be useful. For example, future wealth may be correlated with literacy and governance and only weakly correlated with present rates of growth in GDP per capita.

Procedural (step by step) Vulnerability Assessment Write-up for Climate Change Adaptation (Health Sector)
Training Manual: Climate Change Vulnerability and Adaptation Project: HEALTH SECTOR UP-NIH November 2010
7
The common drivers of development need to be related to the target vulnerable groups. National trends, for example in population and income, may not map directly onto the nuances of marginalization, local land tenure, markets and poverty that characterize vulnerability. Shocks and surprises may have disproportionate effects for the vulnerable population.
Outputs of this task are qualitative descriptions of the present structure of vulnerability, future vulnerabilities and include future scenarios. The last step brings together the indicators into a meaningful vulnerability assessment. Step 5: Outputs of the vulnerability assessment The outputs of a vulnerability assessment include:
A description and analysis of present vulnerability, including representative vulnerable groups (for instance specific community or barangay at-risk of climatic or health hazards).
Descriptions of potential vulnerabilities in the future, including analysis of pathways that relate the present to the future.
Comparison of vulnerability under different socio-economic conditions, climatic changes and adaptive responses.
The final task is to relate the range of outputs to stakeholder decision making, public awareness and further assessments. The guiding concern is to present useful information among various stakeholders that is analytically sound and robust across the inherent uncertainties. The first consideration is whether stakeholders and decision makers already have decision criteria that they apply to strategic and project analyses. For instance, the Millennium Development Targets may have been adopted in a development plan. If so, can the set of vulnerability indicators be related to the MD Targets? Is there an existing map of development status that can be related to the indicators of climate vulnerability? The output should link to further steps in the Adaptation Planning Framework. The focus on representative livelihoods and multiple scales of vulnerability can form the basis of an analysis of coping strategies. The technical team should consider how its outputs can be used over a longer term. A key recommendation is likely to be improved monitoring and collection of specific data on health and socio-economic vulnerability. A final output might be to revisit the conceptual model. Are there new insights that need to be included? Does the monitoring plan capture the range of vulnerabilities and their drivers? Would the framework need to be revised to apply to different regions or vulnerable groups (iterative nature of the vulnerability framework)? Have the priorities for vulnerability assessment changed?

Procedural (step by step) Vulnerability Assessment Write-up for Climate Change Adaptation (Health Sector)
Training Manual: Climate Change Vulnerability and Adaptation Project: HEALTH SECTOR UP-NIH November 2010
8
References
1. Downing, TE and Patwardhan, A., (2002). Vulnerability Assessment for Climate Adaptation. Adaptation Planning Framework Technical Paper 3.
2. Department of Transportation Federal Highway Administration Office of Environment and Planning. (2009). Climate Change Vulnerability Assessment, Risk Assessment, and Adaptation Approaches. Washington DC., USA

Training Manual: Climate Change Vulnerability and Adaptation Project: HEALTH SECTOR UP-NIH November 2010

Manual of Procedures
Monitoring and Evaluation
for
Climate Change and Health

2
TABLE OF CONTENTS
1. Introduction ........................................................................................................................................ 4
1.1 Purpose of the Manual ................................................................................................................. 5
1.1.1 Who should use the manual?................................................................................................ 5
1.2 Framework of Monitoring and Evaluation (M&E) for Health and the Impacts of Climate
Change ............................................................................................................................................... 6
1.3 Policies that support M&E for Health in the light of Climate Change .......................................... 7
1.4 Scope of the M&E on Climate Change and Health ..................................................................... 8
1.5 Goal and Objectives ..................................................................................................................... 9
1.6 Guiding Principles ........................................................................................................................ 9
1.7 Integration of M&E on climate change and health with PIDSR ................................................. 12
1.7.1 Vulnerability assessment and its link to the M&E framework ............................................. 13
1.7.2 Adaptation strategies and relationship with the M&E framework ....................................... 14
2. Reporting procedure under monitoring and evaluation for climate change and health .................. 16
2.1 Sources of reports/information ................................................................................................... 16
2.2 Flow of information ..................................................................................................................... 16
3. Roles and Responsibilities ............................................................................................................... 17
3.1 Department of Health (DOH) ..................................................................................................... 18
3.1.1 National Epidemiology Center (NEC) ................................................................................. 18
3.1.2 National Center for Disease Prevention and Control (NCDPC) ......................................... 19
3.1.3 Health Emergency Management Staff (HEMS) .................................................................. 19
3.1.4 Centers for Health Development (CHDs)............................................................................ 19
3.2 Local Government Units (LGUs) ................................................................................................ 20
3.2.1 Provincial Health Offices (PHOs) ........................................................................................ 20
3.2.2 City/Municipal Health Offices (CHOs/MHOs) ..................................................................... 21
3.3 PAGASA ..................................................................................................................................... 22
3.3.1 PAGASA Headquarters ....................................................................................................... 22
3.3.2 PAGASA Weather Stations ................................................................................................. 22
4. Data Analysis and Interpretation ...................................................................................................... 23

3
4.1 Integration of weather parameters with PIDSR health data ...................................................... 23
4.2 Use of computers for data storage and analysis ....................................................................... 25
4.3 Analysis of data and correlation with weather measurements: ................................................. 25
4.3.1 Analysis of data by time ...................................................................................................... 26
4.3.2 Analysis of data by place .................................................................................................... 27
4.3.3 Analysis of data by person .................................................................................................. 27
4.3.4 Interpretation of surveillance and health data ..................................................................... 27
4.3.5 Using the results of the analysis ......................................................................................... 28
5. Dash board indicators ...................................................................................................................... 29
List of Tables
Table 1 Matrix table showing the monitoring and evaluation principles, responsible actors and
levels, relevant tools, and indicators to be collected ..................................................................... 11
Table 2 Matrix table showing the Climate Change and Health V&A Assessment Flowchart ....... 15
Table 3 Dashboard and Outcome indicators for the Public Health and Health Service Domain .. 31
Table 4 Dashboard and Outcome indicators for the Health System and Infrastructure Domain .. 32
Table 5 Monitoring and Evaluation Indicators ............................................................................... 34
List of Figures
Figure 1 Modified PIDSR framework showing vulnerability assessment on the left panel,
adaptation on the right panel, and the reporting protocol in the middle panel. ............................... 6
Figure 2 Modified reporting systems and information flow, PIDSR with the integration of climate
change ............................................................................................................................................ 17
Figure 3 Summary Table of Notifiable Disease Occurrence by Barangay and Morbidity Week and
Weather Data ................................................................................................................................. 24
Figure 4 Dengue fever cases in city X by month (N = ___ ); January – November, 2010 (Example
only) ................................................................................................................................................ 26
Figure 5 ME system with PIDSR as Core ...................................................................................... 30

4
1. Introduction
Climate change refers to a change in climate that can be identified by changes in the
mean and/or variability of its properties and that persists for an extended period typically
decades or longer, whether due to natural variability or as a result of human activity. There is
increasing scientific evidence that climate change has an impact on human health.
Projections on changes in climate, such as temperature and sea level rise, and more intense
weather events such as more frequent and stronger typhoons, are seen to adversely affect
the health sector.
According to the National Framework Strategy on Climate Change (NFSCC), the “health
sector stands to bear the brunt of climate change, brought about mainly by the country’s high
vulnerability to climate change-related hazards. As diseases, disabilities and deaths are
consequences of these hazards, the health sector is usually left to handle the management
and rehabilitation of victims. Among the most likely impacts of climate change on the health
sector include increases in morbidity and mortality due to diarrheal disease, exacerbation of
the abundance and/or toxicity of cholera due to increases in coastal water temperature, and
an expansion of the natural habitats of vector-borne and water-borne diseases.”
In 2007, the Department of Health, in an effort to strengthen the country’s disease
surveillance and response system, adopted the Philippine Integrated Disease Surveillance
and Response System (PIDSR), through Department Administrative Order No. 2007-0036.
Among others, PIDSR was adopted to address the inadequacies of having too many disease
surveillance systems that are redundant and inefficient, which duplicated efforts, and which
provided inaccurate and delayed reporting that resulted in not being able to realize desired
health outcomes. The adoption of PIDSR was also made in response to the International
Health Regulation of 2005 which required all Member States to strengthen the core
capacities for disease surveillance and response to avert occurrence and international
spread of diseases and other public health threats.
Recognizing the threats posed by climate change on health, it has become imperative to
monitor how the occurrence and spread of diseases are being influenced by climate
parameters. A system needs to be put in place that records, monitors, analyzes and
provides basis for making decisions pertinent to health in the light of projected changes in
temperature, humidity, precipitation and more intense weather disturbances such as
droughts, frequent and stronger typhoons, and excessive rainfall. Fortuitously, the DOH has
already been implementing PIDSR, whose features can be readily adapted for M&E under a
climate change scenario.

5
This manual is designed to provide guidance to users on how PIDSR can be expanded to
increase the capacity in the health sector to make decisions that take into account climate
change. Specifically, the manual will describe the procedure for collecting climate
parameters and their integration with disease surveillance data, the analysis of their
relationships which can be used for the design of public health response systems
appropriate under changing climate scenarios.
1.1 Purpose of the Manual
The manual is a supplement to the PIDSR Manual of Operations in order to provide
guidance to health sector practitioners in making health decisions that take into account the
influence of climate change.
Thus, it will serve as:
(a) a quick reference on surveillance across levels that include recording and analyzing
climate parameters and how they affect disease occurrence and spread;
(b) a resource manual for training health and related personnel on climate change and
health; and
(c) a guide for improving anticipation of health problems and planning adequate
responses.
1.1.1 Who should use the manual?
As with PIDSR, this manual is intended for use by disease surveillance coordinators in all
disease reporting units, and by all other users identified in the PIDSR Manual (2007). In
addition, workers in PAGASA (especially those involved in weather forecasting and climate
projection) as well as those engaged in disaster prevention and control, and government
agencies tasked with environmental management may also benefit from the Manual.

6
1.2 Framework of Monitoring and Evaluation (M&E) for Health and the
Impacts of Climate Change
The framework of the proposed Health Sector Climate Change Monitoring and Evaluation
System is shown in Figure 1. The centerpiece is the conceptual framework for the Philippine
Integrated Disease Surveillance and Response System (PIDSR). PIDSR was adopted by the
Department of Health in 2007 through Department Administrative Order 2007-0036 that was
signed on October 1, 2007 by then Health Secretary Francisco T. Duque III.
Figure 1 Modified PIDSR framework showing vulnerability assessment on the left
panel, adaptation on the right panel, and the reporting protocol in the middle
panel.
One of the driving forces for the integration of disease surveillance systems in the
Philippines under PIDSR was the need for the country to meet its commitment as a member
of the international community, following the adoption on 23 May 2005 of the International
Health Regulations (2005) during the World Health Assembly, where the Philippines is one

7
of the state parties (signatories). IHR 2005 required all state parties “to carry out an
assessment of public health events arising in their territories” and “then to notify WHO of all
qualifying events within 24 hours of such an assessment” ( WHO, 2008). Aligning the
country’s disease surveillance and response system with the requirements of IHR 2005 was
needed in order for the Philippines to be consistent in its application of the assessment and
notification requirements under IHR 2005. Consistency with IHR 2005 was deemed as
“crucial to ensure prompt communication to WHO of those events which may need
coordinated international public health assessment and response” (WHO, 2008). In the light
of global threats to public health such as SARS and avian flu, and given the poor public
health infrastructure in the Philippines, the country could ill afford a disease surveillance and
response system that was out of sync with the rest of the world.
1.3 Policies that support M&E for Health in the light of Climate Change
In addition to the following policies which are mentioned in the 2007 Manual of
Procedures for PIDSR (namely, Republic Act 3573, 1929; DOH Administrative Order 2007-
0036; Resolution WHA48.13, 1995; International Health Regulations of 2005 Article 5-1
Surveillance; DOH Administrative Order 2005-0023; and Department Personnel Order No.
2005-1585), the following legal mandates and policies are supportive of a monitoring and
evaluation in the health sector that integrates climate change:
1. Climate Change Act of 2009 (Republic Act 9729). An Act Mainstreaming Climate
Change into Government Policy Formulations, Establishing the Framework Strategy
and Program on Climate Change, Creating for this Purpose the Climate Change
Commission, and for Other Purposes.
2. Department of Health (DOH) Circular No. 2010-0187 on June 3, 2010 on “Adaptation
of Climate Change Framework for Health,” which mandates all the agencies, regional
offices and hospitals, and programs to “(1) develop and implement national action
plans for health sector on adaptation and mitigation to climate change, (2)
systematically integrate the concept of climate change and health linkage into policy-
relevant instruments, (3) strengthen public health systems and disaster preparedness
and response activities, particularly surveillance and monitoring systems, (4) provide
early warning systems to reduce the current and projected burden of climate-sensitive
diseases, (5) implement adaptation measures specific to local health determinants and

8
outcome concerns, and facilitate community-based resource management, and (6)
support the active participation of the health sector to National Communications to the
UN Framework Convention on Climate Change and encourage inclusion of health
issues in the negotiation process.”
3. Department of Health (DOH) Memorandum 2009-0250. Interim Guidelines on the
Prevention of Leptospirosis through the Use of Prophylaxis in Areas Affected by
Floods. October 16, 2009.
4. National Framework Strategy on Climate Change. 2010-2012. NFSCC acknowledges
the profound impacts of climate change on communicable index diseases as its vectors
adapt, resulting in greater vulnerability of the marginalized sectors. NFSCC mandates
the health sector to “formulate proper climate-sensitive interventions in ensuring a
healthy citizenry, and a disease-resilient community.” The NFSCC likewise includes, as
one of its strategic priorities towards attaining a climate responsive health sector, the
“establishment of mechanisms to identify, monitor, and control diseases brought about
by climate change; and improve surveillance, and emergency response to
communicable diseases, especially climate-sensitive water-borne and vector-borne
diseases.”
1.4 Scope of the M&E on Climate Change and Health
Apart from the health sector identified in the 2007 Manual of Procedures for PIDSR,
which includes public and private, national agencies and local government units, external
development agencies, and the community involved in disease surveillance and response,
the M&E on climate change and health shall also involve the Philippine Atmospheric,
Geophysical and Astronomical Service Agency and all its satellite weather stations (under
the Department of Science and Technology) as data providers and as partners in risk
assessments pertaining to health as influenced by the weather patterns, and in the long
term, by climate change.

9
1.5 Goal and Objectives
The goal of the monitoring and evaluation system that integrates climate change in the
health sector is to help make communities become healthier and more climate-resilient.
Thus, the goal of PIDSR, which is “achieved through the reduction of mortality and morbidity
by an institutionalized, functional, integrated disease surveillance and response system
nationwide” is expanded to enable periodic M&E of climate change trends to mitigate
impacts on the health sector as well as to serve as basis for assessing the effectiveness of
policies and measures for reducing vulnerability and increasing adaptive capacity of
communities and the general population.
The above-mentioned goal for climate change-responsive M&E in the health sector is
aligned with the vision for climate change in the Philippines, as enunciated in the NFSCC
(2009) as follows:
Vision (NFSCC)
“A climate risk resilient Philippines with healthy, safe, prosperous and self-reliant
communities, and thriving and productive ecosystems.”
1.6 Guiding Principles
This manual subscribes to the eleven (11) guiding principles spelt out in the 2007 PIDSR
Manual of Procedures. In view of climate change and the need for the health sector to
provide adequate responses to health risks associated with climate change, the following
additional principles were identified to underpin the M&E Strategy for health as influenced by
climate change:
1.6.1 It shall verify the effectiveness of the implementation of policies, programs, and
projects in terms of changes and/or improvements in the situation of target groups,
their behavior, application and utilization of skills, and how these changes can be
attributed to interventions such as technical assistance and management services
delivered by implementers.

10
1.6.2 The M&E system shall build on existing disease surveillance systems to collect data
for the selected diseases and for tracking temperature and rainfall (precipitation)
and should provide a mechanism for integrating, analyzing and decision-making
involving the two data sets.
1.6.3 The M&E system must be simple, provide quick results, be cost-effective and
operated in a manner that is both transparent and with clearly-defined
accountabilities and responsibilities.
1.6.4 The M&E system must be able to provide a mechanism to facilitate the systematic
communication and/or sharing of results across different levels, to include decision-
makers, implementers, and the general public, especially at the level of the
household, as well as for a feedback mechanism.
1.6.5 The M&E system shall involve a minimum amount of relevant and practical
indicators.
1.6.6 The M&E system shall be subject to review every three years, and may be modified
to take into account the lessons learned and to make it more attuned to the needs
of stakeholders.
1.6.7 The detailed implementation of the M&E strategy shall be described under M&E
operations plan, to be formulated and implemented on an annual basis by the
Department of Health.
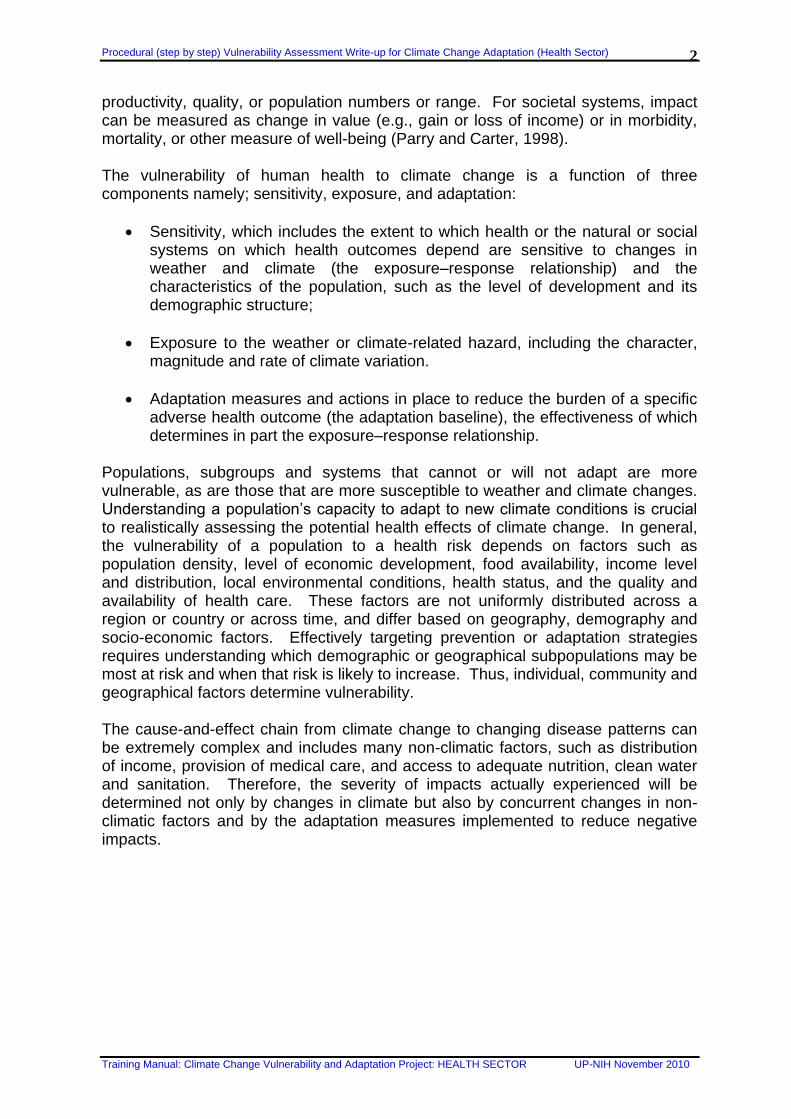
The operationalization of this additional set of principles is summarized in matrix format,
as shown in Table 1. The table assigns responsibility centers, identifies appropriate tools,
and lists relevant indicators that will insure that each of the principles are observed/met in
the implementation of the M&E framework.
11
Table 1 Matrix table showing the monitoring and evaluation principles, responsible
actors and levels, relevant tools, and indicators to be collected
Monitoring and Evaluation Principles
Actors / Levels
Tools Indicators Collected
Indicators to be added
A. Tracking of Implementation of Policy, Programs and Projects
Policy: DOH Field level effectiveness: RHUs, local governments
PIDSR aggregate report incorporated into the Field Health Service Information System (FHSIS) annual morbidity report
Health status statistics, health services coverage, notifiable diseases
Environment / climate indicators
B. Build on Existing Surveillance System by Integrating Environmental Data Collection
Enabling policy: DOH & DOST Data analysis: National, regional and provincial Health Offices
Yearly report showing correlations between notifiable diseases and environmental factors
Same as above Correlation statistics
Capacity building needs on data analysis at different levels
C. Promote transparency and demonstrate clearly-defined accountabilities and responsibilities.
Enabling policy: DOH Field level application: Regional, Provincial, City and Municipal levels
Yearly summaries that can be readily attributed to weekly, monthly, and quarterly reports
Health systems statistics
PAGASA providing data services on climate parameters to health system operators
D. Systematic communication and/or sharing of results across different levels.
ALL levels Reports, bulletins, press releases, radio broadcasts
Capacity building strategies for personnel of DRUs/ESUs; Availability of communication systems
Contact details of relevant media outlets and of health offices in various levels
E. Prudent selection of relevant and practical indicators
DOH, NDCC and Related Agencies
DAOs and other related policy issuances
Measures of usefulness of indicators
F. Systematic review and development of the M&E system every 3 years
Enabling policy: DOH Inputs for system modification: All levels
M&E framework for the health sector
Results of periodic assessments
G. M&E operations plan formulation and implementation
DOH: for integration into overall DOH annual operations plan
DOH annual operations plan
Budget for M&E

12
1.7 Integration of M&E on climate change and health with PIDSR
The M&E framework takes into account the influence of climate change on health is
anchored on the existing M&E framework in the Health sector which is PIDSR. However,
PIDSR per se could not be used due to certain limitations, particularly the absence of a
system to collect climate related data and to relate them to disease parameters. Hence,
PIDSR is being modified to reflect the importance of periodic assessments of vulnerabilities
in the health sector and the monitoring of adaptation systems in the light of climate change.
A common understanding of the meaning of vulnerability and adaptation is important. To
achieve this, the following definitions of these terms and other relevant terminologies have
been adopted, both from the IPCC report and the Climate Change Act of 2009 (GEF, 2008;
Climate Change Act of 2009):
Vulnerability is the degree to which a system is susceptible to, or unable to cope with,
adverse effects of climate change, including variability and extremes. It is a function of the
character, magnitude, and rate of climate change and variation to which a system is
exposed, its sensitivity, and its adaptive capacity.
Adaptive capacity is the ability of a system to adjust to climate change (including climate
variability and extremes) to moderate potential damages, to take advantage of opportunities,
or to cope with the consequences.
Adaptation refers to adjustments in natural or human systems in response to actual or
expected climatic stimuli or their effects that moderates harm or exploits beneficial
opportunities.
As per IPCC, various kinds of adaptation can be distinguished as follows:
Anticipatory adaptation – Adaptation that takes place before impacts of climate
change are observed. This is also referred to as proactive adaptation.
Autonomous adaptation – Adaptation that does not constitute a conscious response
to climatic stimuli but is triggered by ecological changes in natural systems and by
market or welfare changes in human systems. This is also referred to as spontaneous
adaptation.
Planned adaptation – Adaptation that is the result of a deliberate policy decision,
based on awareness that conditions have changed or are about to change and that
action is required to return to, maintain, or achieve a desired state.
GEF (2008) further qualified that climate change impact or vulnerability assessment is ex-
ante evaluation which should be distinguished from monitoring and evaluation of adaptation
interventions which is ex-post evaluation in nature.

13
1.7.1 Vulnerability assessment and its link to the M&E framework
Assessing vulnerabilities is an ex ante analysis, which for the health sector means being
able to measure susceptibility to diseases, determining potential causes that contribute to
more prevalent disease spread, and identifying weaknesses in the health system that can
further deteriorate due to climate change.
The starting point for defining vulnerability relative to the five climate-sensitive diseases
was the epidemiological triad which consists of host, pathogen and environment, and what
contributes to these factors.
Relative to host as a factor, the contributors to this component of the triad have been
broken down to individual and family and/or community related factors. Individual
vulnerabilities can be determined from the following: (a) standard of living, (b) disease
reservoir or the current level of infection, (c) genetic make-up, and (c) personal habits.
Determinants of family community vulnerability include: (a) population density and growth,
(b) unemployment and poverty levels, as well as (c) migration patterns and degree of
urbanization.
On the aspect of pathogen as a factor, the following are deemed as contributory causes:
(a) microbe replication and movement, (b) vector reproduction and movement, (c) microbe
and vector evolution, (d) feeding frequency and longevity, and (e) habitat formation.
Vulnerabilities arising from the environment may be derived from contributions from the
following: (a) the state of watersheds and forest cover, (b) loss of biodiversity, (c) access to
safe water, (d) occurrence of flash floods, and (e) other factors such as sanitation, solid
waste management, agricultural production and government policies and regulations that
impact on human settlements, land use and zoning.
It is also important to know how the health system (including health infrastructure, quality,
and access to health care) and health policy and regulations are making an impact on the
vulnerabilities of individuals and communities relative to the five diseases.
Apart from the disease-related vulnerabilities that emanate from the epidemiological triad
associated with each of the five (5) climate-sensitive diseases, the country’s vulnerability
associated with the occurrence of tropical cyclone is ranked highest in the world, and third in
terms of people exposed to such seasonal event (CCC, 2010). On average, twenty (20)
typhoons hit the country each year. El Niño droughts and La Niña flooding have been
triggered by extreme climate variability. Erosible soils along steep/unstable mountain slopes,

14
degraded forests and watersheds, unplanned settlements, combine with geologic/seismic
dangers to put communities and individuals more prone to climate-related disaster risks.
It will be instructive to mention that the Vulnerability and Adaptation (V&A) Assessment
Toolkit published by the Philippine Rural Reconstruction Movement under the Second
National Communication on Climate Change (2009), identified the following communities as
vulnerable to the effects of climate change on health: (a) far-flung barangays (mountainous
or coastal); (b) populations that have least access to health services and are in
congested/dense urban slum areas; (c) those in areas that are endemic to climate-sensitive
diseases, e.g., malaria, coupled with “bad” health system; and (d) those that are culturally
challenging, i.e., resistant to health education or change in their behavior towards health,
brought about by culture or beliefs.
1.7.2 Adaptation strategies and relationship with the M&E framework
The different categories of proposed adaptation strategies correspond with the identified
vulnerabilities in the health sector relative to climate change. The evaluation of adaptation
interventions takes the form of an ex post analysis, which means that what is going to be
measured is the effectiveness of the proposed strategies in bringing about an improved
capacity of individual and communities to weather the effects of climate change. It should be
evident that strategies that result in improved adaptive capacity actually reduce
vulnerabilities in the long term.
The assessment of vulnerability and the formulation of adaptation strategies are best
undertaken following a continuum that enables the use of the results of vulnerability
assessments as inputs for decisions vis a vis adaptation practices. This relationship is
shown in the following matrix table (Table 2) which outlines the steps in V&A assessment in
the health sector using climate sensitive diseases as the identified vulnerability (PRRM,
2009):

15
Table 2 Matrix table showing the Climate Change and Health V&A Assessment
Flowchart
Climate Change and Health V&A Assessment Flowchart
Step 1
Identify/Screen
health vulnerability
in area/community
Step 2
Conduct analysis
(Quantitative/Qualitative)
Step 3
Identify action to be
taken
Step 4
Evaluate and
feedback
■ Presence of
diseases (determine climate sensitivity/consider epidemic potential)
►Consider number
of cases, occurrence of disease
■ Utilize sentinel sites
NESSS/MET for weather parameters
■ Focused group discussions/KII
■ Preventive
(adaptation) over curative (mitigation) parameters
■ Prioritize measures ○ Efficiency vs.
Effectiveness ○ Cost/timeframe
►i.e., information drives/mass screening, smearing for febrile people, fast lane for Dengue
■ Policy formulation for health impacts – climate change compliance/resilience
■ Utilize statistical
analysis and correlate adaptation measure
■ Identify indicators of success (intermediate and long-term)
■ Refine flowchart to incorporate other factors (i.e., socio-economic)
Step 1
Identify/Screen
health vulnerability
in area/community
Step 2
Conduct analysis
(Quantitative/Qualitative)
Step 3
Identify action to be
taken
Step 4
Evaluate and
feedback
■ Availability of response mechanisms
► Health infrastructure (human and financial/infra – health centers/hospitals
■ Occurrence of extreme weather events (quantity and quality)
* (adapted from: Philippine Rural Reconstruction Movement (PRRM). 2009. Vulnerability and
Adaptation Assessment Toolkit. Philippines Second National Communication on Climate Change)
16
2. Reporting procedure under monitoring and evaluation for
climate change and health
2.1 Sources of reports/information
As with PIDSR, the sources of health-related reports/information will be the following: (a)
community; (b) barangay health stations (BHS); (c) rural health units (RHUs); (d) city health
offices (CHOs); (e) government and private hospitals and clinics; (f) government and private
laboratories; and (g) ports and airports.
However, for weather information, the sources will be the PAGASA central office
(particularly the National Epidemiology Center) and the satellite weather stations located all
over the country. The weather stations will supply information through the provincial health
offices, which will be responsible for disseminating weather-related information to the
municipal and city health offices within the province.
2.2 Flow of information
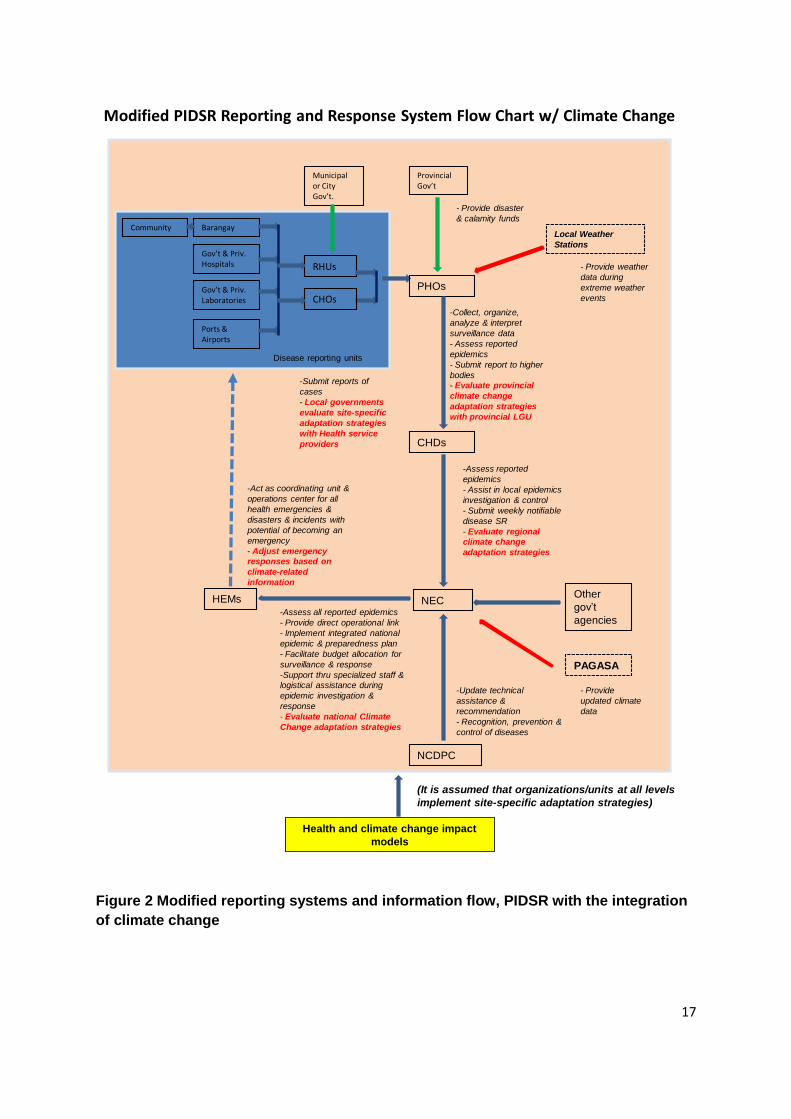
Figure 2 shows the scheme as to how information is to be reported under the modified
PIDSR to integrate climate change and how it will flow through the various levels and offices
tasked with disease surveillance monitoring, reporting, data analysis and response
formulation. The original tasks assigned to the various offices in line with PIDSR are
indicated, while the new tasks are shown in red italics. Similarly, the additional information to
be collected and shared within the system is shown as red arrows.
17
Modified PIDSR Reporting and Response System Flow Chart w/ Climate Change
Municipal or City Gov’t.
Community Barangay
Gov’t & Priv.Hospitals
Gov’t & Priv. Laboratories
Ports & Airports
RHUs
CHOsPHOs
CHDs
NECHEMsOther
gov’t
agencies
NCDPC
Disease reporting units
-Submit reports of
cases
- Local governments
evaluate site-specific
adaptation strategies
with Health service
providers
Provincial Gov’t
- Provide disaster
& calamity funds
-Collect, organize,
analyze & interpret
surveillance data
- Assess reported
epidemics
- Submit report to higher
bodies
- Evaluate provincial
climate change
adaptation strategies
with provincial LGU
-Assess reported
epidemics
- Assist in local epidemics
investigation & control
- Submit weekly notifiable
disease SR
- Evaluate regional
climate change
adaptation strategies
-Update technical
assistance &
recommendation
- Recognition, prevention &
control of diseases
-Assess all reported epidemics
- Provide direct operational link
- Implement integrated national
epidemic & preparedness plan
- Facilitate budget allocation for
surveillance & response
-Support thru specialized staff &
logistical assistance during
epidemic investigation &
response
- Evaluate national Climate
Change adaptation strategies
-Act as coordinating unit &
operations center for all
health emergencies &
disasters & incidents with
potential of becoming an
emergency
- Adjust emergency
responses based on
climate-related
information
Local Weather
Stations
- Provide weather
data during
extreme weather
events
PAGASA
- Provide
updated climate
data
Health and climate change impact
models
(It is assumed that organizations/units at all levels
implement site-specific adaptation strategies)
Figure 2 Modified reporting systems and information flow, PIDSR with the integration
of climate change

18
3. Roles and Responsibilities
In addition to the basic roles and responsibilities pertinent to the manifold surveillance
and response functions of the various agencies under the Department of Health (DOH) as
enumerated in the PIDSR Manual of Procedures (2007), the following responsibilities are
hereby added in order to monitor the impacts of climate change on the health sector. Aside
from the health agencies and local government units given responsibilities under PIDSR,
non-health agencies tasked with weather forecasting and climate projection are also
assigned responsibilities, subject to agreements to be forged between the DOH and the
DOST to which PAGASA belongs.
3.1 Department of Health (DOH)
3.1.1 National Epidemiology Center (NEC)
Based on the PIDSR Manual of Operations (2007), the tasks of undertaking the overall
design and implementation of PIDSR has been reposed upon NEC. The responsibilities
associated with this function are retained in the modified PIDSR. Consequently, new tasks
have been added, while most other functions have been retained, with modification to some
to make them more attuned to the integration of climate change. The performance of some
of the new/added/modified functions is contingent upon the participation of PAGASA and
other agencies, subject to formal arrangements to be agreed upon by DOH with such
agencies. The new and/or modified functions to account for climate change are as follows:
a. To receive daily weather data from PAGASA and to establish and maintain weather
database for the health sector; in the case of extreme weather events such as typhoons,
to receive data as frequently as these are issued by PAGASA.
b. Guided by climate-health models, determine if health data show abnormal trends that can
be explained by changes in climate parameters.
c. Determine appropriate adaptation approaches and strategies to respond to observed or
predicted abnormal patterns that could result in enhanced health vulnerabilities or even
deterioration to epidemic levels of certain diseases that are sensitive to climate.

19
d. Notify/inform all health offices at all levels through HEMS and the Regional CHDs of
adaptation strategies to be implemented, as well as the basis/rational for calling such
strategies including the measures for evaluating their effectiveness and the reporting
protocols to be complied with.
3.1.2 National Center for Disease Prevention and Control (NCDPC)
The following functions of NCDPC are not new but are drawn from the functions identified
in PIDSR with some modification to integrate climate change:
a. Provide updates, technical advice, and recommendations on the identification of climate
change related vulnerabilities; recognition of, prevention, and control of climate-sensitive
diseases; and the formulation of adaptation strategies to reduce impacts of climate
change.
b. Assist NEC in the development and implementation of integrated national epidemic
preparedness and response plan by the health sector that takes into account the impacts
of climate change.
3.1.3 Health Emergency Management Staff (HEMS)
a. In case of extreme weather events and national-level disasters associated with climate
change, NEC shall coordinate health sector efforts to mitigate adverse impacts on health,
minimize exposure to climate-enhanced vectors, and to lessen morbidity/mortality in
affected areas.
b. Fine-tune/adjust health disaster emergency responses in accordance with health-climate
models and up-to-date weather information.
c. Together with NCDPC, to assist NEC in the development and implementation of
integrated national epidemic preparedness and response plan by the health sector that
takes into account the impacts of climate change.
3.1.4 Centers for Health Development (CHDs)
Listed below are new/additional/modified functions of CHDs in relation to the
implementation of the modified PIDSR:

20
a. Provide the leadership in implementing regional health vulnerability assessments and the
formulation and implementation of region-specific adaptation strategies to respond to
health risks to climate change.
b. In establishing, operating, and maintaining a regional disaster preparedness and response
plan, CHDs must take into consideration climate-health models, the results of health
vulnerability assessments, and updated weather data and adjust/fine-tune the plans to
account for climate parameters and projections.
c. Correlate weather data with health statistics to detect abnormal trends, increases in
vulnerabilities, and to adjust region-specific health adaptation strategies.
d. Provide technical and logistical assistance in the conduct of vulnerability assessments to
climate change and in the preparation of adaptation measures at the
provincial/city/municipal levels.
e. Ensure compliance at the regional/provincial/city/municipal levels in the conduct of
vulnerability assessments and the formulation/implementation of adaptation measures to
respond to health threats posed by climate change.
f. Coordinate regional efforts designed to mitigate adverse health effects of climate-related
disasters as well as to manage epidemics brought about by climate change.
3.2 Local Government Units (LGUs)
3.2.1 Provincial Health Offices (PHOs)
The new/added/modified functions of the PHOs in consideration of the impacts of climate
change to health are as follows:
a. To receive daily weather data from the local PAGASA weather station and to establish
and maintain a provincial weather database; in the case of extreme weather events such
as typhoons, to receive data as frequently as these are issued by the PAGASA station.
Take responsibility for disseminating weather-related information that could adversely
impact health to the cities/municipalities within the province.
b. Immediately report to the region (CHD) climate change related disease occurrences as
well as deaths associated with disasters brought about by climate change.

21
c. Provide the leadership in implementing provincial health vulnerability assessments and
the formulation and implementation of province-specific adaptation strategies to respond
to health risks to climate change.
d. In establishing, operating, and maintaining a provincial disaster preparedness and
response plan, PHOs must take into consideration climate-health models, the results of
health vulnerability assessments, and updated weather data and adjust/fine-tune the
plans to account for climate parameters and projections.
e. Correlate weather data with health statistics to detect abnormal trends, increases in
vulnerabilities, and to adjust province-specific health adaptation strategies.
f. Provide technical and logistical assistance in the conduct of vulnerability assessments to
climate change and in the preparation of adaptation measures at the municipal levels.
g. Ensure compliance at the provincial/municipal levels in the conduct of vulnerability
assessments and the formulation/implementation of adaptation measures to respond to
health threats posed by climate change.
h. Coordinate province-wide efforts designed to mitigate adverse health effects of climate-
related disasters as well as to manage epidemics brought about by climate change.
3.2.2 City/Municipal Health Offices (CHOs/MHOs)
The new/added/modified functions of the PHOs in consideration of the impacts of climate
change to health are as follows:
a. To receive daily weather data from the PHO and to establish and maintain a city/municipal
weather database. Take responsibility for disseminating weather-related information that
could adversely impact health to the barangays within the city/municipality.
b. Immediately report to the province (PHO) climate change related disease occurrences as
well as deaths associated with disasters brought about by climate change.
c. Provide the leadership in implementing city/municipal health vulnerability assessments
and the formulation and implementation of city or municipal-specific adaptation strategies
to respond to health risks to climate change.
d. In establishing, operating, and maintaining a city/municipal disaster preparedness and
response plan, CHOs/RHUs must take into consideration climate-health models, the
results of health vulnerability assessments, and updated weather data and adjust/fine-
tune the plans to account for climate parameters and projections.

22
e. Correlate weather data with health statistics to detect abnormal trends, increases in
vulnerabilities, and to adjust city or municipality-specific health adaptation strategies.
f. Provide technical and logistical assistance in the conduct of vulnerability assessments to
climate change and in the preparation of adaptation measures at the barangay levels.
g. Ensure compliance at the city/municipality and barangay levels in the conduct of
vulnerability assessments and the formulation/implementation of adaptation measures to
respond to health threats posed by climate change.
h. Coordinate city/municipality-wide efforts designed to mitigate adverse health effects of
climate-related disasters as well as to manage epidemics brought about by climate
change.
3.3 PAGASA
A memorandum of agreement (MOA) has to be forged between DOST and DOH that
henceforth, the following functions shall be performed by PAGASA headquarters and the
weather stations to enable the health sector to address the threats of climate change.
3.3.1 PAGASA Headquarters
a. To provide daily weather data to the DOH through the NEC and to assist the latter in
establishing and maintaining a weather database containing climate parameters that are
relevant to the health sector.
b. In the case of extreme weather events such as typhoons, to provide data/information to
NEC as frequently as these are issued by PAGASA.
c. To provide and update NEC with information and models pertaining to climate scenarios in
the future, particularly those involving climate parameters that are known to significantly
impact public health.
3.3.2 PAGASA Weather Stations
a. To provide daily weather data to the Province, through the Provincial Health Office and to
assist the latter establish and maintain a provincial weather database.

23
b. In the case of extreme weather events such as typhoons or intense rainfall, to provide
data as frequently as these are monitored by the PAGASA station.
c. Assist PHOs in disseminating weather-related information that could adversely impact
health to the cities/municipalities within the province.
4. Data Analysis and Interpretation
4.1 Integration of weather parameters with PIDSR health data
As in PIDSR, all reporting units will still be required to analyze their data on a weekly
basis, with the only difference that analysis should include the integration of weather
parameters into the health data. This will be useful in guiding the unit to correlate
health occurrences and patterns with the variations in weather parameters.
For this purpose, Figure 5 in PIDSR (Summary Table of Notifiable Disease
Occurrence by Barangay and Morbidity Week) is hereby modified, and is referred to
as Figure 3 in this manual. This revised form shall only be used for reporting climate-
sensitive diseases. For non-climate sensitive diseases, the table without the last four
rows on weather information (Figure 5 in PIDSR) should still be used.

24
Figure 3 Summary Table of Notifiable Disease Occurrence by Barangay and Morbidity
Week and Weather Data
Year: _______________
Notifiable Disease: (limited to climate-sensitive diseases only)
Municipality: _____________________________
Province: _____________________________
Region: _____________________________
Reporting unit: _____________________________
Name and signature of reporting staff:
________________________________________
Contact Numbers: _______________________
Names of Barangays
Category of Cases
Morbidity Weeks Total cases for the year
MW 1
MW 2
MW 3
MW 4
MW …
MW …
MW 52
Barangay 1 Survived
Died
Barangay 2 Survived
Died
… Last Barangay
Survived
Died
Total number of all cases (Survived and Died)
per morbidity
week
Grand total for the munici-pality or city for the year
Total number of Deaths per morbidity
week
Grand total for the munici-pality or city for the year
Mean temperature (°C) for the
week
Highest temperature
(°C)
Lowest temperature
(°C)
Precipitation (mm)
Added rows to include climate parameters in the weekly summary.
25
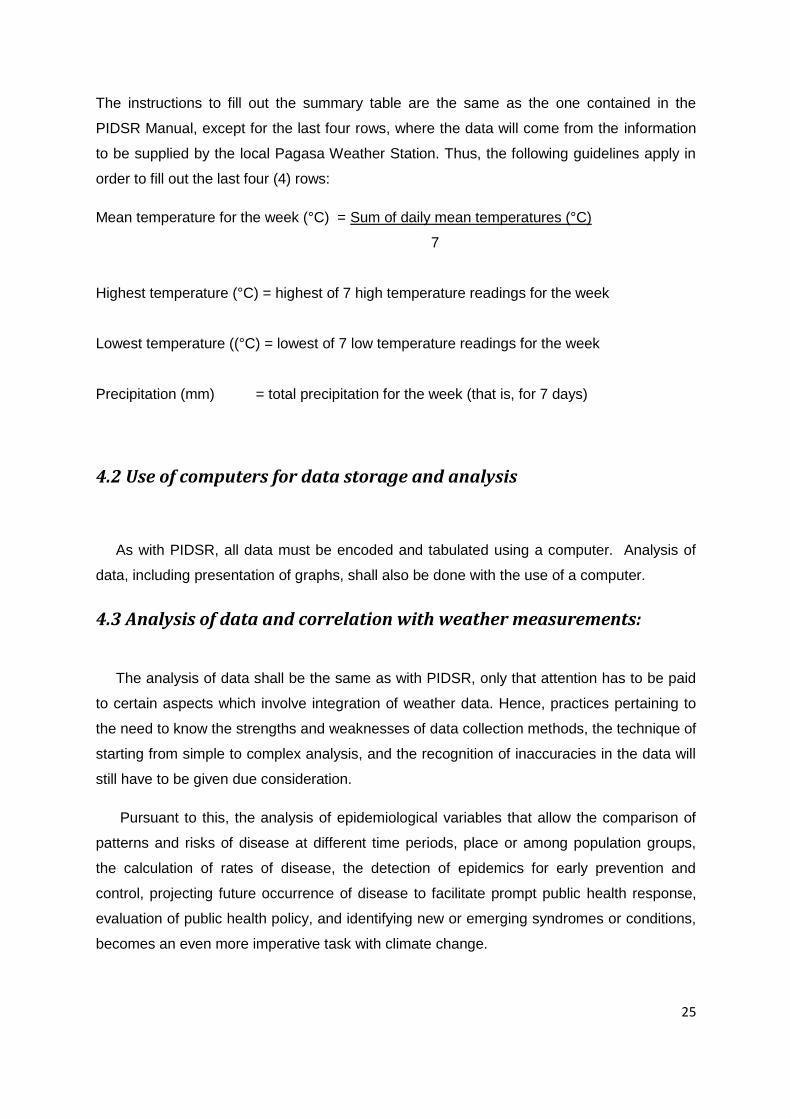
The instructions to fill out the summary table are the same as the one contained in the
PIDSR Manual, except for the last four rows, where the data will come from the information
to be supplied by the local Pagasa Weather Station. Thus, the following guidelines apply in
order to fill out the last four (4) rows:
Mean temperature for the week (°C) = Sum of daily mean temperatures (°C)
7
Highest temperature (°C) = highest of 7 high temperature readings for the week
Lowest temperature ((°C) = lowest of 7 low temperature readings for the week
Precipitation (mm) = total precipitation for the week (that is, for 7 days)
4.2 Use of computers for data storage and analysis
As with PIDSR, all data must be encoded and tabulated using a computer. Analysis of
data, including presentation of graphs, shall also be done with the use of a computer.
4.3 Analysis of data and correlation with weather measurements:
The analysis of data shall be the same as with PIDSR, only that attention has to be paid
to certain aspects which involve integration of weather data. Hence, practices pertaining to
the need to know the strengths and weaknesses of data collection methods, the technique of
starting from simple to complex analysis, and the recognition of inaccuracies in the data will
still have to be given due consideration.
Pursuant to this, the analysis of epidemiological variables that allow the comparison of
patterns and risks of disease at different time periods, place or among population groups,
the calculation of rates of disease, the detection of epidemics for early prevention and
control, projecting future occurrence of disease to facilitate prompt public health response,
evaluation of public health policy, and identifying new or emerging syndromes or conditions,
becomes an even more imperative task with climate change.

26
4.3.1 Analysis of data by time
Apart from answering the questions, “When does the disease occur commonly or rarely?”
and “Is the frequency of disease at present different from the frequency in the past?”,
analysis of data by time will also address the questions on “Whether the occurrence of
disease through time is influenced by or can be associated with, changes in weather
patterns?” Hence, analyzing data by time will remain an important activity, but this will have
to be superimposed with information on the changes in climate parameters through time.
This will both have a predictive and response functions – predictive because the analysis of
changes in weather parameters through time will provide basis for predicting changes in
disease trends; and response because knowing the trends in weather conditions will enable
the health sector to adequately prepare for adverse health events that may possibly arise.
For purposes of incorporating climate parameters into the time analysis, Figure 6 in the
PIDSR manual may be modified to appear as in Figure 4 as follows:
Figure 4 Dengue fever cases in city X by month (N = ___ ); January – November, 2010
(Example only)
Thus, with just one glance on the graph, one can already see how dengue cases can be
correlated with mean temperature and precipitation for the period under consideration.

27
4.3.2 Analysis of data by place
As in PIDSR, the place analysis of surveillance data answers the question “Where are the
rates of disease highest or lowest?” In addition, superimposing spatial climate information
with health data would have the extra advantage of being able to either attribute to, or readily
rule out climate as the cause for the more prevalent occurrence of a disease in one place
over another. This can be implemented at the province level, where the capacity to prepare
GIS maps exist. The PHO should work closely with the provincial unit tasked with mapping
to be able to prepare maps that show location of disease occurrence vis a vis rainfall and
temperature variations in the province at a given point in time.
4.3.3 Analysis of data by person
As with PIDSR, analysis by person answers the question, “Who are getting the disease?”
The presumption in the integration of climate change in health is that vulnerability
assessments have been made to determine which populations are susceptible to climate-
sensitive diseases. Thus, undertaking analysis by person will also enable answering the
following questions vis a vis occurrence of diseases and how they are being affected by
climate change:
a) Are the more vulnerable groups the ones that are suffering the brunt of climate change-
related diseases?
b) Have public health measures been taken to lessen the adverse impacts of climate
change on the health of the more vulnerable populations?
c) Are adaptation measures adequate to enable vulnerable sectors to withstand the effects
of climate change vis a vis climate-sensitive diseases?
4.3.4 Interpretation of surveillance and health data
As with PIDSR, this activity will entail comparison of current situation with those in other
time periods (be they one week, one month, or one year ago or even longer). The instruction
given in the PIDSR Manual of Procedure is to make observations on the changes in the
number of cases and deaths to see whether the patterns are stable, increasing or
decreasing. These will remain part of the interpretation, but at the same time, there will be a

28
need to correlate the information with climate information over time and across spaces. In
addition, the personnel tasked with recording and analyzing PIDSR and climate data must
also be able to examine health-climate models as well. Thresholds for various diseases will
remain the same, but the usefulness of climate models is that they will enable the health
sector to carry out precautionary health measures so that increased risks due to climate
change will not breach the thresholds. Adjustments will have to be made in public health
measures to be undertaken so that more adequate health responses will be in place as a
way of addressing adverse climate impacts on health.
4.3.5 Using the results of the analysis
The integration of climate data facilitates the analysis of climate change-related disease
occurrence and trends. This is especially true for climate-sensitive diseases such as malaria,
dengue, cholera, typhoid and leptospirosis. In the conduct of epidemiological investigation,
the analyst can more easily rule out and/or attribute the observations to, the changing
weather/climate conditions.
Climate change has an adverse effect on occurrence/morbidity of humans afflicted with
climate-sensitive diseases. Tracking climate parameters over time will enable reporting units
and hospitals to anticipate future climatic conditions. At the same time, it will equip the health
sector with a decision tool as regards to the nature, timing, and extent of public measures to
undertake to lessen the impacts of climate change on health. The benefits to society will
come in the following forms (adapted from PIDSR, with some modifications):
Limit the spread and occurrence of additional cases.
Enable adequate planning to prevent occurrence of outbreaks and improve adaptive
capacity of vulnerable sectors.
Enable cross-agency and multi-level collaboration.
Advocate for more government support to lessen vulnerability of certain individuals
and populations.
Provide a system for engaging lower level PIDSR units to become more proactive in
collecting, analyzing, and reporting disease occurrence and in providing the
information critical to local or community actions designed to adapt to climate
change.

29
5. Dash board indicators
“Dashboard Indicators” by Donabedian served as a guide in the design and selection of
Monitoring and Evaluation indicators. The use of dashboards involves the collection of data
at the lowest level of the chain or system (micro-system) and is aggregated up to higher
levels (meso and macro- systems) to create a dashboard of measurements across the
systems (Table 5). In this project, a dashboard indicator is seen as a broad indicator that
summarizes other indicators at the micro-, meso- and macro-systems. It is likened to an
airplane’s dashboard where the pilot and his co-pilot and/ or navigator are able to see, utilize
and interpret the information on real-time basis (real-time monitoring). The cockpit
dashboard also shows the present and future state of the airplane through related but vital
indicators. All these characteristics help the pilot make timely and wise decisions or actions
or even midcourse actions to correct a condition or situation.
The M and E indicators are grouped into domains as reflected in the M&E framework. These
domains are 1) Climate and Environmental Parameters; 2) Public Health and Health Service
Interventions; 3) Environmental and Social determinants of Health; and 4) Health System
and Infrastructure. The DOH is mainly responsible for overseeing the M&E system using
one of its existing systems called Philippine Integrated Disease Surveillance and Response
(PIDSR). PIDSR is the core structure within the M&E system that integrates disease and
climate change factors (Figure 5). Apart from the PIDSR, monitoring and evaluation would
need to be done by agencies within the system. The system is developed to support the
framework in collaboration with PAGASA, NDCC, PDCC and Local Government Units.

30
Figure 5 ME system with PIDSR as Core
The M&E indicators classified according to a hierarchy -- First level (objective) indictor,
Second level (output) indicator, Third level (outcome) indicator and Dashboard indicator
(goal). The indicators will be monitored and evaluated based on the levels of the system
(barangay, municipal, provincial and national) and frequency (daily, weekly, monthly,
quarterly and annually). In Table 5 agencies responsible are indicated as well as the
indicators’ sources of information.
For Climate and Environmental Parameters domain, the presence of a Memorandum of
Agreement among government agencies PAGASA, DOH, NDCC and PDCC is the proposed
First Level (objective) indicator that would initiate the sharing of rainfall and temperature data
between PAGASA/ synaptic stations and DOH and the PDCCs and the NDCC. With data
shared and analyzed, province-specific rainfall and temperature annual thresholds will be
established. The utilization of Local Government Units of PAGASA data for early response
planning is an outcome (Third level) indicator. The dashboard indicator is Alert and
Threshold Level (See Table 5).

31
For the Public health and health Service Interventions domain there are two Dashboard
Indicators: 1) Early Health Emergency Preparedness and 2) Access to Primary Health
Care. Under these, there are 4 outcome indicators under Early Health Emergency
Preparedness and 4 outcome indicators for Access to Primary Health Care. Refer to Table
3 for the output/ second level and objective/first level indicators.
Table 3 Dashboard and Outcome indicators for the Public Health and Health Service
Domain
Early Health Emergency Preparedness Access to Primary Health Care
1. Active community participation in
health emergency preparedness
projects and activities
1. Increase/ decrease in number of
diagnosed cases of malaria through
microscopy and rapid diagnostic test
2. # of deaths due to malaria
2. Functional response system 3. Increase/ decrease in malaria cases
treated
3. Adaptation strategies implemented
by different LGUs
4. Increase/ decrease in treated dengue
cases
4. Functional disease surveillance
system integrated with PAGASA
data
5. Increase/ decrease in number of treated
diarrhea cases
1. Increase/ decrease in number of
leptospirosis cases treated
For the Environmental and Social Determinants of Health domain, Environmental Health
and Safety is the dashboard indicator. Under which are outcome indicators: Integrated
vector management and Effective Sanitation Programs. The last domain, Health System
and Infrastructure, contains 3 dashboard indicators. These are Integrated Program on
Climate Change, Climate Change Research and Development, and Policy and
Program Development to address Climate Change. Each has its outcome/ third level
indicators. Refer to Table 5 for the output/ second level and objective/ first level indicators.

32
Table 4 Dashboard and Outcome indicators for the Health System and Infrastructure
Domain
Integrated Program on
Climate Change
Climate Change Research and
Development
Policy and Program
Development to address
Climate Change
Stakeholder engagement:
Existing partnerships
between DOH/ LGUs and
other CC- related
institutions
Research and development
agenda at the national level
Functional policies and
programs created for CC
adaptation, disaster and
emergency response at the
national level
No. of funded projects on
CC
% of funds/ grants in R&D for CC
at the national level
Policies and programs are
updated/ reviewed
#/ % of health facilities
(hospitals, RHUs, BHS,
clinics) with adaptation
programs and are
emergency and disaster
prepared
Funds allocated at national for
collaborative projects at the
national levels
Majority of the indicators are already established and regularly collected by the DOH.
However, there are indicators that will require collection of new information. Such include
the following:
1. Capacity building activities
a. Training of PAGASA and LGU HR on local data analysis
b. Capacity building seminars at LGU level on health emergencies and early
response and adaptation
c. Capacity building seminars at LGU level for implementation of adaptation
projects and activities
2. Policy and System development
a. MOA among PAGASA/ local synaptic station, DOH and NDCC/ PDCC/
MDCC
b. Development and institutionalization of a response network and system at
LGU level for health emergency early response
c. MOA between DOST-PAGASA and DOH for data sharing and technical
assistance

33
d. Creation of a working group within NEC-DOH to process and analyze health
and climate data
e. DOH policy on integrated vector management
f. Existing and functional programs found in LGUs on integrated vector
management
g. MOA to establish partnerships between DOH/ LGUs and other CC- related
institutions
h. Funding for the CC program/ projects in health at the national level
i. Health facilities (hospitals, RHUs, BHS, clinics) with adaptation programs and
are health emergency prepared
j. Funds/ grants/ others sources of R&D funding for CC and health at the
national level
k. Congressional bill (PNHRS) for CC and health research funding
l. Evidence based CC and projects and programs
m. Technology transfer and utilization in health
n. Administrative Orders to support programs related to CC at the DOH level
o. Implemented ordinances, rules and resolutions on CC adaptation and health
emergency response at LGUs
p. DOH AO on regular monitoring and evaluation of the relevant policies and
programs
3. Data to be added to PIDSR data collection:
a. Sanitation data – toilets, sanitary permits
b. Flooded areas in the community reported in PIDSR; Presence of areas with
stagnant/ swampy water in the municipality/ city
c. Live larvae found in selected households (Breteau index)

34
Table 5 Monitoring and Evaluation Indicators
LEGEND: LEVEL - Barangay, Municipal, Provincial, National
FREQUENCY - Daily, Weekly, Monthly, Quarterly, Annually
DOMAINS
DASHBOARD
INDICATORS
(GOAL)
3RD LEVEL
INDICATORS
(OUTCOME)
2ND LEVEL
INDICATORS
(OUTPUT)
1ST LEVEL
INDICATORS
(OBJECTIVE)
MONITORING POSITION/
AGENCY
SOURCE OF
INFORMATION
LEVEL FREQUENCY
I. Climate &
Environmental
Parameters
ALERT AND
THRESHOLD
LEVEL
Data on Rainfall
intensity
increase beyond
rainfall threshold
on an annual
basis
Daily weather
forecast
information
provided by
PAGASA and
shared with
DOH and NDCC
and LGUs
through PDCC
MOA among
PAGASA/ local
synaptic station,
DOH and
NDCC/ PDCC/
MDCC
N, P PAGASA,
DOH, NDCC
AND PDCC
PAGASA reports/
synaptic reports
PAGASA data
used by LGU for
planning for
early response
Timely weather
related
information/
trends/ warnings
shared by
PAGASA to
DOH and NDCC
and LGUs
through PDCC
Trained
PAGASA and
LGU HR on
local data
analysis
N,P M PAGASA,
DOH, NDCC
AND PDCC
PAGASA reports/
synaptic reports;
LGU early
response plan

35
Temperature
increase beyond
temperature
threshold on an
annual basis
Daily weather
forecast
information
provided by
PAGASA and
shared with
DOH and NDCC
and LGUs
through PDCC
MOA among
PAGASA/ local
synaptic station,
DOH and
NDCC/
PDCC/MDCC
N, P PAGASA,
DOH, NDCC
AND PDCC
PAGASA reports/
synaptic reports
PAGASA data
used by LGU for
planning for
early response
Timely weather
related
information/
trends/ warnings
shared by
PAGASA to
DOH and NDCC
and LGUs
through PDCC
Trained
PAGASA and
LGU HR on
local data
analysis
N,P M PAGASA,
DOH, NDCC
AND PDCC
PAGASA reports/
synaptic reports;
LGU early
response plan
II. Public
Health and
Health Service
Interventions
1. EARLY
HEALTH
EMERGENCY
PREPARED-
NESS
a. Active
community
participation in
health
emergency
preparedness
projects and
activities
Compliance to
program IECs
e.g. 4 o’clock
habit (dengue);
water
disinfection and
hand-washing
(cholera and
typhoid); Use of
treated bed nets
(malaria)
# HH/
barangays/
municipalities
given program
IECs on
disasters,
emergencies,
effect of climate
change on
health and
adaptation
strategies
M,P M MHO- RHU/
BHS
RHU data
(community
surveys,
observation)
36
b. Functional
preparedness
system
# of capacity
building
seminars at
LGU level on
health
emergencies
and early
response and
adaptation
Development
and
institutionalizatio
n of a response
network and
system at LGU
level for health
emergency early
response
M, P M Local Chief
Executive,
MHO
Capacity building
documents and
outputs from the
LGU
Emergency
health response
assessment
proceedings
during/after a
disaster and
feedback by the
health response
team
Emergency
response plan
by the LGU
M,P LGU Plan
% of LGU
projects and
activities funded
and
implemented on
early response
and adaptation,
health
emergency
preparedness
projects and
activities
M,P LGU, MHO LGU
accomplishments

37
c. Adaptation
strategies
implemented by
different LGUs
Presence of an
adaptation plan/
strategy at the
level of the
barangay
% of community
meetings with
CC content
towards
formulation of
the adaptation
plan
M,P BDCC,
MDCC,
PDCC
% of adaptation
projects and
activities
implemented
% of capacity
building
seminars at
LGU level for
implementation
of adaptation
projects and
activities
M,P
LGU, MHO Capacity building
documents and
outputs from the
LGU
Amount of funds
raised/
apportioned by
the LGU for
adaptation
strategies
M,P
d. Functional
disease
surveillance
system
integrated with
PAGASA data
PIDSR data
analyzed with
PAGASA data
MOA between
DOST-PAGASA
and DOH for
data sharing and
technical
assistance
N
PAGASA,
DOH -
PISDR
LGU and
PAGASA MOA

38
Trained NEC-
DOH and
PAGASA HR to
analyze and
interpret data
Creation of a
working group
within NEC-
DOH to process
and analyze
health and
climate data
DOH DOH AO
PAGASA data
submitted to
DOH-NEC/
PAGASA
working group
N W PAGASA,
DOH-
PIDSR
PAGASA reports;
PIDSR reports
DOH Advisories
released to
concerned
LGUs re
increase/
decrease in
incidence and
prevalence of
diarrhea,
leptospirosis
and vector
borne diseases
as reported by
PIDSR
Disease and
Sanitation
conditions
reported in
PIDSR:
M,P W, M SI-RHU,
PHO, DOH-
PIDSR
RHU statistics
and PHO
statistics
disaggregated by
barangay/
municipality % of HH with
sanitary toilets
% of HH with
SAFE source of
water

39
% of HH with
proper garbage
disposal
% of
Establishments
with sanitary
permits
Flooded areas in
the community
reported in
PIDSR;
Presence of
areas with
stagnant/
swampy water in
the municipality/
city
RHU statistics
and PHO
statistics
disaggregated by
barangay/
municipality
#/% of
confirmed
malarial smears
reported in
PIDSR
Community
surveillance:
Active case
finding with index
case by barangay
#/% confirmed
dengue cases
reported in
PIDSR
Community
surveillance:
Active case
finding with index
case by barangay

40
#/% confirmed
leptospirosis
cases reported
in PIDSR
Community
surveillance:
Active case
finding with index
case by barangay
# of live larvae
found in
selected
households
(Breteau index)
DOH- NEC,
DOH- CHD
SI Inspection
report
DOH
Surveillance
teams launched
to investigate
outbreak or
health
emergency
situations
Appropriate
LGU response
to outbreak or
health
emergency
MHO- RHU/
BHS
2. ACCESS
TO PRIMARY
HEALTH
CARE
a. Increase/
decrease in
number of
diagnosed
cases of malaria
through
#/% of
confirmed
malarial smears
or RDT (+)
# of probable
cases of malaria
M,P,N W,M MHO-RHU,
PHO, DOH-
PIDSR
Community
survey: Active
case finding with
index case; RHU
statistics and
PHO statistics;

41
microscopy and
rapid diagnostic
test
PIDSR Reports
b. Age -sex
specific death
rates
# of deaths due
to malaria
disaggregated
by age and sex
c. Increase/
decrease in
malaria cases
treated
#/% of malaria
cases given
complete
dosage
Availability of
1st-line and 2
nd-
line drugs
M,P,N W,M MHO-RHU,
PHO, DOH-
PIDSR
RHU statistics
and PHO
statistics; PIDSR
reports
d. Increase/
decrease in
treated dengue
cases
#/% of
confirmed
(serologic
diagnosis)
dengue cases
# of probable
dengue cases
M,P,N W,M MHO-RHU,
PHO, DOH-
PIDSR
Community
survey: Active
case finding with
index case; RHU
statistics and
PHO statistics;
PIDSR Reports
e. Increase/
decrease in
number of
treated diarrhea
cases
#/% of diarrheal
cases identified
Sanitation
condition:
M,P,N W,M MHO-RHU,
PHO, DOH-
PIDSR
RHU statistics
and PHO
statistics; PIDSR
reports

42
% of HH with
sanitary toilets
% of HH with
safe source of
water
% of HH with
proper garbage
disposal
% of
Establishments
with sanitary
permits
% of FIC
% exclusively
breastfed
children until 6
months
f. Increase/
decrease in
number of
leptospirosis
cases treated
#/ % of
leptospirosis
cases identified
Flooded areas in
the community
reported to
PIDSR;
Presence of
areas with
stagnant/
swampy water in
the municipality/
city
M,P,N W,M MHO-RHU,
PHO, DOH-
PIDSR
RHU statistics
and PHO
statistics; PIDSR
reports

43
III.
Environmental
and social
determinants
of health
ENVIRON-
MENTAL
HEALTH AND
SAFETY
a. Decreased
vector
population
% of Provincial,
city and
municipal
governments
engaged in
integrated vector
management
DOH policy on
integrated vector
management
enacted
M,P Q DOH, CHD,
PHO, CHO,
MHO
DOH issuances
Implementation
of Bretaeau
index; rat traps
at community
level
Existing and
functional
programs found
in LGUs on
integrated vector
management
Program on
integrated vector
management at
the LGU level
b. Effective
Sanitation
Programs based
on standards for
sanitation
facilities, water
sources,
garbage
disposal
% Increase in
compliance to
sanitation
programs
Sanitation
condition:
M, P Q SI- RHU
PHO
RHU statistics
and PHO
statistics
% of HH with
sanitary toilets
% of HH with
clean source of
water

44
% of HH with
proper waste
segregation and
disposal
% of
Establishments
with sanitary
permits
% decrease/
increase in food
and water borne
diseases
% of HH that
participated in
santitation
program
IV. Health
System and
Infrastructure
1.
INTEGRATED
PROGRAM
ON CLIMATE
CHANGE
a.
Stakeholder
engagement:
Sustained
partnerships
between DOH/
LGUs and other
CC- related
institutions
(government
and private)
Functional
national/ local
framework and
implementation
plan
MOA; Outputs of
collaborative
work and
projects brought
about by
existing
partnerships
N Q USEC-
DOH
MOA to
institutionalize
the partnerships
and roles of each
agency;
Stakeholders'
workshop
Functional
working groups
on CC at the
national level
PHO Working group
plan/ strategies/
activities

45
b. %of funded
programs and
projects on CC
in health
Amount of
funding for the
CC program/
projects in
health at the
national level
N A DOH
NEDA
CC research plan
and outputs at
level of DOH and
NEDA
c. #/ % of
health facilities
(hospitals,
RHUs, BHS,
clinics) with
adaptation
programs and
are health
emergency
prepared
# / % of health
facilities with
adaptation and
health
emergency
plans
N A DOH LGUs Health facility
plan for
adaptation
strategies and
emergency and
disaster
preparedness
2. CC
RESEARCH
AND
DEVELOP-
MENT
a. Increase in
evidence based
CC and projects
and programs
% of research
and
development
project
proposals
funded
# of R&D project
proposals
submitted by
LGUs and
institutions
N A DOH, NEDA
and CC
partner
agencies
Research and
development plan
and outputs at
level of DOH and
NEDA
b. Increase in
technology
transfer and
utilization in
health

46
c. % of
funds/ grants/
others sources
of R&D funding
for CC and
health at the
national level
Increase
continuous
sources of funds
for CC and
health R&D
Congressional
bill (PNHRS) for
CC and health
research funding
passed;
Continuous
sourcing out
funds from
international
community
Research and
development
plan, funding and
outputs at the
level of NEDA,
DOH and CC
partners
d. Funds
allocated at
national for
collaborative
projects on CC
and health at the
national level
Funds allocated,
raised and
utilized for
collaborative
projects on CC
and health at the
provincial/ city/
municipal levels
Adaptation and
emergency and
disaster plans
and projects at
the LGU level
3.
POLICYand
PROGRAM
DEVELOP-
MENT to
address CC
Functional
policies and
programs
created for CC
adaptation,
disaster and
emergency
# of
Administrative
Orders to
support
programs
related to CC at
the DOH level
N, P, M A DOH NEDA
LGUs
DOH
Administrative
Orders

47
response at the
national level
#/ % of
implemented
ordinances,
rules and
resolutions on
CC adaptation,
and health
emergency
response at
LGUs
# of policies on
CC adaptation
strategies and
health
emergency
response at
LGUs
DOH NEDA
LGUs
Implementation
reports
Policies and
programs are
updated/
reviewed
DOH AO on
regular
monitoring and
evaluation of the
relevant policies
and programs
N, P, M A DOH, LGUs Monitoring
reports

1
VULNERABILITY MAPS
The vulnerability map is a visual representation of vulnerable areas or “hotspots”. It is
designed to provide national and local planners with a visual reference for areas that are
more vulnerable to the changes in the environment, including the health sector, brought
about by climate change.
Vulnerability map is part of the impact model that is at the center of vulnerability assessment.
Although the vulnerability map is at the center, not all of the factors or variables identified in
the model can be effectively rendered in the map. These other factors and variables would
only clutter the map and make it less understandable.
In coming up with the vulnerability map, the project team initially decided to use available
mapping software technology (i.e., ArcGIS) as tool to build such. Computer-aided mapping
technologies have been observed by the team as common to all the three (3) provincial
validation sites of the project in terms of mapping capabilities. However, during the course
of gathering the necessary datasets that could be rendered in ArcGIS for the project, a
number of limitations were encountered.
Limitations to the Vulnerability Maps
The following limitations have been encountered by the project team in coming up with
computer-aided vulnerability maps:
Unavailability of information/data - One of the difficulties encountered by the team
in its effort to gather datasets and shapefiles (GIS filetype) was the unavailability of
information or data itself. It is not absolutely necessary that the data or information
be in a shapefile or geo-referenced (i.e. longitude and latitude readings). It is
sufficient that the data could be linked to a geographic area. For example, the open
pit dumpsites data that the team was able to gather was not geo-referenced but with
a specific barangay-level address, the team will be able to mark this on the map.
This becomes an important piece of information for planners. However, a number of
vital data sets were dropped from the list because they were either not being
collected or not available for dissemination during the visit. This limits the analysis
that could be done at the province and municipality level when assessing for

2
vulnerabilities to diseases. Table 1 presents the dataset requirements identified by
the project team.
Most often, the team was able to find a map that shows the data needed in building
the vulnerability map, however, the data is in picture format (*.jpg or *.bmp). These
cannot be rendered or manipulated in the mapping software (ArcGIS) being used by
the team. Such predicament posed serious limitations on the team’s ability to
electronically render, analyze and present the different data sets in a vulnerability
map.
Table 1: Dataset Requirements
Variables/Datasets Agency Involved
Rainfall
Temp (Max, Min, Mean)
Relative Humidity
Number of Weather Stations and Locations
PAGASA-DOST
Prevalence and Incidence of Diseases
Age/Sex-Specific Morbidity/Mortality Data
Address of Health Facilities/Coordinates if available
(Longitude and Latitude of health facilities from
Barangay health units to tertiary hospitals)
DOH (NCDPC, IMS)
DOH – PHAP (Hospital
Licensing)
DOH-IMS (Information
Management Office)
Population Information
Low Density/High Density Population (geographical
locations)
NSO
Topographic Maps NAMRIA - DENR
Forest Cover FMB - DENR
Watershed and Water Networks DENR / DA
Disaster Preparedness Index of Provinces,
Municipalities
DND / DILG / PNRC
Human Settlement Information DILG
Geohazard Maps NAMRIA / MGB

3
Variables/Datasets Agency Involved
Rodent/Mosquito Population Research Institute for Tropical
Medicine (RITM)
Landfill Information DENR - NSWMC
Road Networks DPWH – Central Office or from
Planning Offices of each
Province
Safe Water Access NSO
Data Sourcing - The datasets and shapefiles that the team has been able to gather
so far has been mostly sourced through official channels. However in order to
facilitate the initial discussion for the project, some information were gathered
through unofficial channels.
There were also instances wherein the needed shapefiles are already available;
however, securing these data is another issue. What is being shared for the project
is just a portion or just the picture format of it.
Incompatibility of existing map formats for use in ArcView - The official maps
from NAMRIA are currently rendered in AUTOCAD. Although they are currently in
the process of converting these files to shapefiles, the file format for ArcGIS, this is a
long and tedious process. It would take the team approximately 50 weeks to convert
the AUTOCAD files for Palawan which is composed of 50 map sheets or files at a
rate of 1 week: 1 map sheet. This is the shortest time estimate given to the team by
the NAMRIA if the AUTOCAD file were “clean” or needed fewer adjustments. But
there is no assurance that the Palawan files are clean.
According to NAMRIA, among the three focus areas, Palawan is the least priority
when it comes to conversion because it is not a “geohazard area” unlike Pangasinan
and Rizal where some of the map sheets have been converted to shapefiles. This is
a special concern for the team because, even if shapefiles are available, they are not
complete that would allow for a comprehensive analysis of the province. To
illustrate, Figure 1 shows the flood and landslide prone areas in Pangasinan based
on available NAMRIA maps. It can be seen that two large chunks of Pangasinan
(Dagupan City and Infanta areas) cannot be rendered on the map.

4
Figure 1: Flood and landslide prone areas in Pangasinan
“Misalignment” of some maps to NAMRIA maps. The team has been able to get
shapefiles but, when rendered on ArcGIS, they are misaligned. This is particularly
true for the provincial and municipality boundary files, which shows the administrative
boundaries of the different municipalities and provinces. As can been seen in Figure
2, the boundary shapefiles are “misaligned” when super-imposed over the NAMRIA-
produced shapefiles, such as the forest cover map. Technically, this could be fixed
by manually adjusting the boundary files. But this will never be fully aligned with the
NAMRIA-based files.
Figure 2: Pangasinan Provincial and Municipal boundaries rendered over the forest cover shapefile

5
No available digitized barangay boundary maps. The team also has difficulty in
securing digitized barangay maps. Such limitation posses a problem since, ideally,
incidences of the diseases should be mapped out in a specific location at the
barangay level in order to come up with a more evidence-based analysis of its
demographic or environmental characteristics.
Use of mapping software tool only at the national and provincial level. Mapping
software technologies are only available and being used for planning activities at the
national and provincial level. Although there are few cities and municipalities in the
country which are also using mapping software technologies, however, their use is
only limited to purposes such as tax mapping and development planning. And since
there is now a paradigm shift in terms of planning hierarchy from top down into
bottom up, it is important to also equip these local planning offices (i.e. municipalities)
with the necessary tools to guide them and carry their respective mandates in
addressing issues in their own localities.
Alternative Method for the Vulnerability Map
Ideally, the vulnerability map being envisioned by the team should be rendered and analyzed
electronically. The use of Geographic Information System (GIS) software such as ArcGIS
allows the team more room for modeling the vulnerability assessment. But given the
limitations presented above, the team has decided to shift to a more traditional method of
rendering, analyzing and presenting the vulnerability maps. A more manual methodology
allows the team to integrate data in different formats (shapefiles, pictures, print outs) into a
common platform – acetates or similar materials. This conventional method hopes to also
address the issue of technical readiness in using ArcGIS software of some municipalities in
the study area. Through the use of acetates and overlay of the various variable layers (or
maps) being considered in this study, local planners and decision makers will be able to
participate in the planning process and at the same time appreciate the visual presentation
of the vulnerabilities in their respective jurisdictions.
For instance, local planners could overlay the political boundary map (Acetate 1 in Figure 3)
together with other maps/layers such as built-up areas (Acetate 2), flood prone areas
(Acetate 4), and solid waste disposal (Acetate 5) in order to see the locations that are
vulnerable to, say, leptospirosis. Or they can further analyze why incidences of leptospirosis

6
are high to some areas by looking at the demographic and environmental conditions in these
areas. One factor could be that these areas are the same areas that are flood prone or
where landfills or dumpsites are located.
Acetate 1: Political Boundary Map
Acetate 2: Built-up Areas Map

7
Acetate 3: Climate Map
Acetate 4: Flood Prone Areas Map
8
Acetate 5: Solid Waste Disposal Map
Acetate 6: Health Facilities Map Figure 3: Sample Maps of Rizal Province in Acetate platform
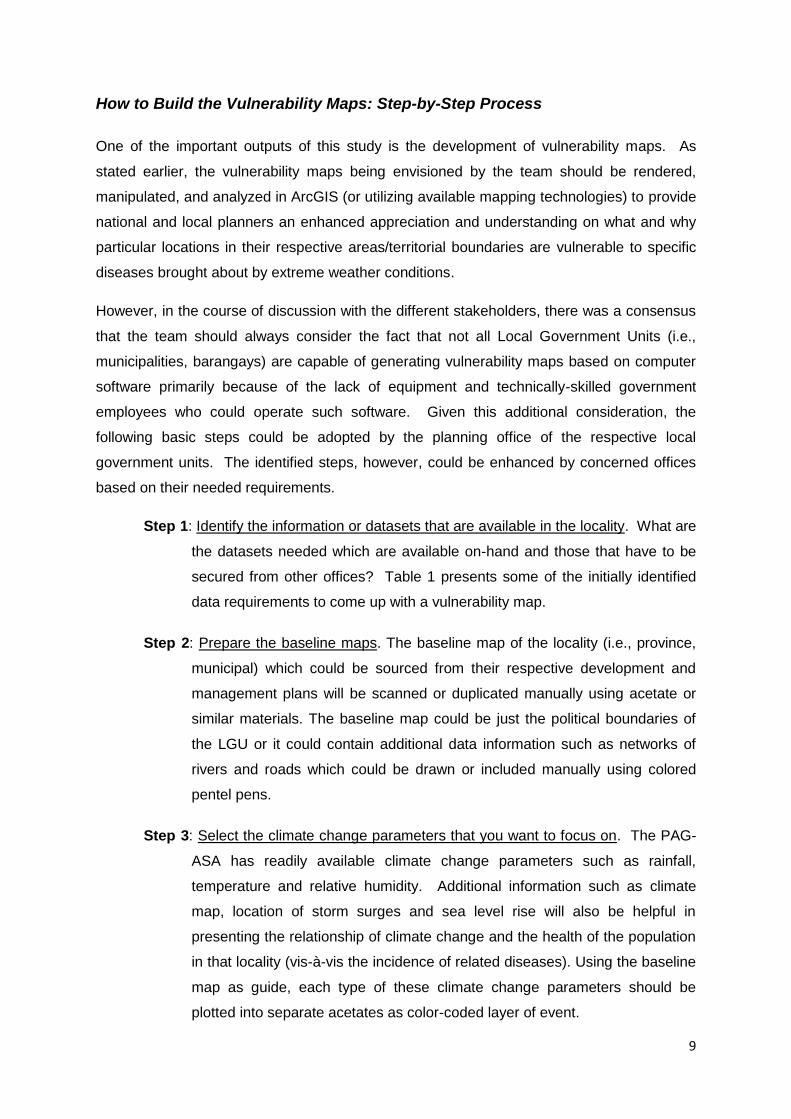
9
How to Build the Vulnerability Maps: Step-by-Step Process
One of the important outputs of this study is the development of vulnerability maps. As
stated earlier, the vulnerability maps being envisioned by the team should be rendered,
manipulated, and analyzed in ArcGIS (or utilizing available mapping technologies) to provide
national and local planners an enhanced appreciation and understanding on what and why
particular locations in their respective areas/territorial boundaries are vulnerable to specific
diseases brought about by extreme weather conditions.
However, in the course of discussion with the different stakeholders, there was a consensus
that the team should always consider the fact that not all Local Government Units (i.e.,
municipalities, barangays) are capable of generating vulnerability maps based on computer
software primarily because of the lack of equipment and technically-skilled government
employees who could operate such software. Given this additional consideration, the
following basic steps could be adopted by the planning office of the respective local
government units. The identified steps, however, could be enhanced by concerned offices
based on their needed requirements.
Step 1: Identify the information or datasets that are available in the locality. What are
the datasets needed which are available on-hand and those that have to be
secured from other offices? Table 1 presents some of the initially identified
data requirements to come up with a vulnerability map.
Step 2: Prepare the baseline maps. The baseline map of the locality (i.e., province,
municipal) which could be sourced from their respective development and
management plans will be scanned or duplicated manually using acetate or
similar materials. The baseline map could be just the political boundaries of
the LGU or it could contain additional data information such as networks of
rivers and roads which could be drawn or included manually using colored
pentel pens.
Step 3: Select the climate change parameters that you want to focus on. The PAG-
ASA has readily available climate change parameters such as rainfall,
temperature and relative humidity. Additional information such as climate
map, location of storm surges and sea level rise will also be helpful in
presenting the relationship of climate change and the health of the population
in that locality (vis-à-vis the incidence of related diseases). Using the baseline
map as guide, each type of these climate change parameters should be
plotted into separate acetates as color-coded layer of event.

10
Step 4: Make an inventory of the assets and service facilities available in the area.
These include location and type of health facilities, available solid waste
disposal system, access to safe water, and built-up areas. Relevant datasets
such as human settlement information, forest cover, and other environmental
factors deemed necessary could also be included and mapped each feature
separately into the acetate. These additional information could be manually
drawn/included in the acetate map using colored pentel pens. Use legends to
properly label these information being drawn/included.
Step 5: Map-out the incidence of diseases in the area. After collecting the data on
diseases from the municipal or provincial health office, each type of disease
(i.e., dengue, malaria, leptospirosis, cholera, and typhoid) will be mapped-out
and presented as separate layers of the map. Again, these additional
information could be manually drawn/included in the acetate map using
colored pentel pens. Use legends to properly label these information being
drawn/included.
Step 6: Overlay the various acetates containing the data layers that one wants to
analyze. Using the acetate baseline map as a platform, one can overlay with
it 3-4 more acetates in order to see and analyze why certain areas/groups in
the municipality or province are vulnerable to specific diseases.
The importance of vulnerability maps is that it could be used as a tool for planning
investments for infrastructure, resettlement, reforestation, and so on. Moreover, planning
officers could also be guided further on what specific measures and strategies to introduce
to target/address climate change vulnerabilities.