MCOM RESEARCH PROPOSAL: 395826wiredspace.wits.ac.za/jspui/bitstream/10539/22159/1/Thesis FINAL...
98
MCOM RESEARCH REPORT: 395826 1 Modelling Return on Marketing in the South African Banking sector RESEARCH REPORT DEGREE MCOM MMIT FULL DETAILS OF CANDIDATE Ms Belinda K Mabuzane Student number: 395826 FIELD OF STUDY Marketing Modelling SUPERVISOR Ian Campbell DATE OF SUBMISSION 20 October 2011
Transcript of MCOM RESEARCH PROPOSAL: 395826wiredspace.wits.ac.za/jspui/bitstream/10539/22159/1/Thesis FINAL...
MCOM RESEARCH REPORT: 395826
1
Modelling Return on Marketing in the
South African Banking sector
RESEARCH REPORT
DEGREE MCOM MMIT
FULL DETAILS OF CANDIDATE Ms Belinda K Mabuzane
Student number: 395826
FIELD OF STUDY Marketing Modelling
SUPERVISOR Ian Campbell
DATE OF SUBMISSION 20 October 2011
MCOM RESEARCH REPORT: 395826
2
Abstract
In today‟s increasingly dynamic and competitive markets, organizations are continuously
pressurized to meet financial targets in order to realise company goals in an efficient and
effective manner. The banking sector in South Africa has, for a very long time, operated in a
predominantly oligopoly market, however, due to increasing pressure from new entrants like
Capitec Bank, there has been a shift of focus to ensuring long term profitability and
competitiveness as the new entrants are constantly implementing strategies that cause
customer switching. The literature reveals that long-term profitability requires that a firm
implements sustainable development projects to ensure long-term profitability. However,
many of the profitability models in use today do not have a variable for sustainable
development and yet it is a key factor in drawing returns on investment. This study adopts the
South African banking sector and investigates the applicability of Rust, Lemon and
Zeithaml‟s (2004) return on investment model for the various initiatives that the banks have
implemented.
From qualitative research with the banks, it was found that sustainable development forms a
large part of the annual budget with the aim of improving the brand perceptions and
increasing the likelihood of customer retention and attraction. However, the results from the
bank‟s customers reveal that the initiatives being sponsored by the banks have very little
effect on their decision to switch or remain banking with a specified bank. Basic customer
satisfaction techniques like clear communication and customer care still outweigh any
corporate initiative like sponsoring the local soccer league thus although these initiatives do
benefit to keep the brand name in customer‟s minds, they do less in realising returns. The
model reveals a technique to quantify return on investment taking into account factors like
sustainable development and it was found that the model is applicable and useful in a South
African setting.
Recommendations include applying the model to gauge not only the possibility of returns but
also how much a company can expect to receive after investing a specified amount of money
on any initiative. This model will be very useful for planning especially for capital intensive
projects as the current economic environment cannot accommodate for misappropriation of
funds.
MCOM RESEARCH REPORT: 395826
3
Declaration
I declare that this research project is my own work. It is submitted in partial fulfilment of the
requirements for the degree of Masters of Commerce at the School of Business and
Economics, University of the Witwatersrand. It has not been submitted before for any degree
or examination in any other University. I further declare that I have obtained the necessary
authorisation and consent to carry out this research.
Belinda Keratiloe Mabuzane
Student Number 395826
………………………………………
Signed
………………………………………
Date
MCOM RESEARCH REPORT: 395826
4
Acknowledgements
To God – Thank you for giving me the ability and gracing me with the opportunity to achieve
what seemed to be impossible at first. This study would not have succeeded without God‟s
grace!
To my Supervisors – Scott Hoenig, thank you for your insight and intelligence that enabled
this study to commence. Though you had to leave unexpectedly, the study went on and we
can proud that it was finished. To Ian Campbell, thank you for adopting my study after I hit a
huge stumbling block with Scott‟s sudden departure. I know it was not an easy thing for you
to do but we can celebrate work done and look forward to a bright future.
To my family – Mmoloki, thank you for putting up with my endless trips to campus and
being patient and supportive to make this study a success. To Onalenna Nkanyezi, your
presence made everything worthwhile; you will soon understand what mommy was doing all
those times in front of the computer.
To my colleagues at work – thank you for understanding.
To my friends – thank you for proof reading.
MCOM RESEARCH REPORT: 395826
5
Table of Contents
Abstract ...................................................................................................................................... 2
Declaration ................................................................................................................................. 3
Acknowledgements .................................................................................................................... 4
CHAPTER ONE: INTRODUCTION ........................................................................................ 8
1.1 Research Objectives ......................................................................................................... 9
1.2 Importance of the study .................................................................................................. 10
1.3 Scope .............................................................................................................................. 10
CHAPTER TWO: LITERATURE REVIEW .......................................................................... 12
2.1 Introduction .................................................................................................................... 12
2.2 Marketing accountability techniques ............................................................................. 13
2.2.1 Introduction ............................................................................................................. 13
2.1.2 Obtaining the largest long-term profits from customers using an equity approach 14
2.2 Customer Equity Logic for Marketing ........................................................................... 14
2.3 Measurements of a firms market value .......................................................................... 15
2.4 CLV Forecasting: Managing the Asset Value of the Customer Base ............................ 20
2.5 Customer Equity overview ............................................................................................. 22
2.6 Value Equity ................................................................................................................... 24
2.6.1 Definition and Role ................................................................................................. 24
2.6.2 Drivers of Value Equity ........................................................................................... 25
2.7 Brand Equity .................................................................................................................. 26
2.7.1 Definition and Role ................................................................................................. 26
2.7.2 Drivers and potential impact of brand equity. ......................................................... 27
2.8 Relationship Equity ........................................................................................................ 31
2.8.1 Definition and Role ................................................................................................. 32
2.8.2 Drivers of Relationship Equity ................................................................................ 33
MCOM RESEARCH REPORT: 395826
6
2.8.3 Customer-Initiated Contacts .................................................................................... 36
2.9 Using Customer Equity to assess return on investment ................................................. 37
2.10 The Roles of Sustainable Development and Social Responsibility ............................. 38
2.10.1 CSR and Social Marketing .................................................................................... 39
2.11 Cause-Related Marketing ............................................................................................. 40
2.11.1 Definition ............................................................................................................... 40
2.12 Green Marketing .......................................................................................................... 42
2.13 Sustainable Development ............................................................................................. 44
CHAPTER THREE: RESEARCH METHODS ...................................................................... 48
3.1 Research Design ............................................................................................................. 48
3.2 Definition of the population ........................................................................................... 48
3.3 Sample plan .................................................................................................................... 48
3.3.1 Data Collection ............................................................................................................ 50
3.3.2 Data Collection Instrument ......................................................................................... 50
3.4 Nonsampling error reduction ......................................................................................... 50
3.5 Questionnaire and scale development ............................................................................ 51
3.5.1 Construct Validity ....................................................................................................... 51
3.5.2 Reliability .................................................................................................................... 52
3.6 Analysis Technique ........................................................................................................ 52
CHAPTER FOUR: RESEARCH RESULTS .......................................................................... 53
4.1 Descriptive Statistics ...................................................................................................... 53
4.3 Brand Switching ............................................................................................................. 61
4.3.1 Banking industry retention rates (FNB, 2011) ............................................................ 63
4.4 Improving Market Share ................................................................................................ 63
4.5 Customer lifetime Value ................................................................................................ 66
4.5.1 Calculation of customer lifetime value ....................................................................... 67
4.5.1 Calculation of customer equity ................................................................................... 67
MCOM RESEARCH REPORT: 395826
7
4.5.2 Test of model for Marketing ROI ............................................................................... 68
4.6 Sustainable Development Outcome ............................................................................... 70
4.6.1 Conclusion:.................................................................................................................. 73
CHAPTER FIVE: CONCLUSION AND RECOMMENDATIONS ...................................... 75
5.1 Summary of main findings ............................................................................................. 75
5.2 Implications for management and academia .................................................................. 76
5.3 Research Limitations ...................................................................................................... 76
5.4 Recommendations for future research............................................................................ 76
References ................................................................................................................................ 78
Appendix A: Questionnaire sample ......................................................................................... 83
Appendix B: Focus group questions ........................................................................................ 91
MCOM RESEARCH REPORT: 395826
8
CHAPTER ONE: INTRODUCTION
With an increasingly competitive market, many businesses have shifted from product-
centred thinking to customer- centred thinking where creating long term customer value has
become a priority. As a result of this, customer equity is the latest development in marketing
theory and there has been substantial demand for research which develops improved
approaches to marketing that encompass more analytical rigour and demonstrate the effect of
marketing on business performance.
Business success is measured in financial terms and as a result, it is important to measure any
management actions like investing in sustainable development. Customer equity is a
summation of customer lifetime values for the customer base of an organisation and it is a
critical determinant of business performance and returns on investment as it accounts for non-
tangible assets (for example, brand and relationship equity) unlike financial models. Bauer
and Hammerschmidt (2005) suggest that the long term value of customers is a more stable
and relevant metric of firm value than financial metrics like market capitalisation or price
earnings ratio. The present research thus seeks to use a customer equity model that can
evaluate return on marketing programs and corporate citizenship initiatives, which are not
accounted for in financial analysis yet they constitute a huge percentage of most businesses
budgets.
Rust, Lemon and Zeithaml (2004) acknowledge that various techniques exist for evaluating
financial returns from marketing expenditure; however the approaches adopted in the
literature have not produced a practical model that can be employed to trade off marketing
strategies. As the banking sector in South Africa is becoming increasingly competitive with
new players like Capitec slowly penetrating the market, a model is needed to demonstrate the
benefit of a marketing campaign before launching as the model should predict how the bank‟s
ratings will increase and determine the probability of retaining a customer and more
importantly of attracting another customer. Such a model would help marketing practitioners
to decide between campaigns and determine the value of incorporating elements like
sustainable development.
Unlike other marketing techniques, sustainable development is difficult to quantify as the
banks spend large sums of money investing in the society by doing community work,
sponsoring education and numerous good deeds in the hope of creating a good name and
preference from the community.
MCOM RESEARCH REPORT: 395826
9
However, banks have no practical means to determine the value of their investment and it
becomes difficult to evaluate returns as most of the time customers do not really change their
behaviour because of a company‟s corporate responsibility (Schultz & Gronstedt, 1997). This
study seeks to test a model that will enable marketing accountability and the model will be
devised for the banking sector as research has shown increasing investments into society‟s
wellbeing.
1.1 Research Objectives
The aim of this study is to use marketing science phenomena to establish a model that will
enable a bank to determine key drivers of customer equity and establish return on investment
in the same manner that Rust et al (2004) determined drivers of customer equity in the airline
industry. The model will take sustainable development into account and propose financial
accountability of marketing actions.
The study tests a model which enables what if evaluation of marketing returns on investment
as it tests the effect on using marketing expenditure to improve customer equity drivers in the
South African banking sector. The research seeks to enable these banks to focus marketing
efforts on strategic initiatives that generate the greatest returns.
The research therefore, will seek to answer the following research questions:
1. What are the key drivers of customer equity for bank customers?
The components of value, brand and relationship equity will be analysed to assess
their effect on customer equity in order to determine returns on investment on any of
these criteria.
2. What is the effect of sustainable development initiatives on customer equity?
It is essential to determine returns on corporate responsibility initiatives as banks
dedicate large budgets for this so the study will investigate means of evaluating
returns on corporate citizenship.
3. Where can banks focus their efforts in order to achieve sustainable competitive
advantage?
4. How can banks build long term value for themselves and for their customers and
remain sustainable?
MCOM RESEARCH REPORT: 395826
10
1.2 Importance of the study
Marketing is increasingly becoming accountable for investments since the fundamental shift
toward value based management has led to an increasing demand for corporate valuation
methods (Bauer & Hammerschmidt, 2005). For a long time, marketing managers have relied
on intuition and experience to make capital intensive decisions such as whether they should
increase advertising, invest in a loyalty program or invest in corporate citizenship with the
hope that the community will acknowledge their efforts and change their purchasing
behaviour. The outcome of this study will enable the marketing industry to draw conclusions
and action plans based on the results of a model that will predict returns should a particular
campaign be pursued.
This will enable accountability and better use of the marketing budgets as practitioners can
make informed decisions and management can plan accordingly. Practitioners will be able to
trade off investments by assessing returns on quality, returns on advertising, returns on
loyalty programs and returns on corporate citizenship given a particular shift in customer
perceptions. Practitioners will be able to select initiatives that generate the greatest returns.
For academia, this study will fill a gap in the literature and contribute to the customer equity
theories by introducing a model to quantify return on investment. It will also create a base for
future research to develop models in other industries which will provide measurement
techniques for studying marketing investments.
1.3 Scope
The study will focus on the main banks in South Africa, namely, FNB, ABSA, Standard
Bank and Nedbank as these have shown to have large investments into corporate social
responsibility.
The study will progress as follows:
Chapter 1 – Introduction
The reader will be presented with an overview of customer equity and sustainable
development and how this research will contribute to that domain.
Furthermore, the chapter will outline gaps in the literature of this type of output thereby
outlining the purpose and importance of the study.
MCOM RESEARCH REPORT: 395826
11
Chapter 2: Literature review
This chapter will provide a critical review of research studies conducted in the customer
equity arena and establish all theories relating to the topic and determine major findings that
emanate from previous research.
This will enable the reader to be knowledgeable about the field under investigation and to
conceptualise the positioning of the study prior to viewing the outcome.
Chapter 3: Research Methodology
As there are many research designs that can be adopted, this chapter will justify why the
chosen research design has been adopted and outline all plans to achieve reliability and
validity whilst reducing bias. Elements such as the data collection technique, measurement
instrument and sampling techniques will be discussed and a copy of the instrument will be
attached as part of the appendices.
Chapter 4: Analysis of Results
Using marketing modelling techniques such as segmentation and stepwise regression, a full
model will be devised that can aid decision making in marketing investments. Important
outcomes will be established and highlighted for the reader.
Chapter 5: Discussion
Important results will be interpreted and implications for management, marketing and
academia will be discussed. Each of the hypotheses will be discussed and concluded in terms
of their relevance and impact on the conceptual model.
Chapter 6: Conclusion
This chapter will summarise the research report and draw all relevant conclusions. Areas for
improvement and future research will be suggested whilst highlighting any shortfalls of the
study.
MCOM RESEARCH REPORT: 395826
12
CHAPTER TWO: LITERATURE REVIEW
2.1 Introduction
This section introduces two constructs, these being sustainable development and customer
equity management. Recently, there has been a growing trend in sustainable development
where companies are investing into corporate social responsibility but there is no evident
benefit of the CSR campaigns. Corporate Social Responsibility (CSR) has been described as
the company's performance in providing information on societal initiatives undertaken by the
firm, community involvement and corporate philanthropy being an activity above and beyond
what is required of the organization (Mullen, 1997). More generally, CSR is a set of policies,
practices, and programs that are integrated throughout business operations and decision-
making processes, and intended to ensure the company maximizes the positive impacts of its
operations in society (Attalla & Carrigan, 2001). This literature review will reveal practices
in CSR and evaluate the customer equity concept in order to establish the contribution of this
research
According to Polonsky (1994) a firm that is socially responsible acknowledges that it exists
and operates in a shared environment with stakeholders who are affected by the
organisation‟s goals. Thus, management of stakeholder relationships lies at the core of CSR
and entails establishment of a sound and functioning two-way communication with
stakeholder groups. Maignan, Ferell and Ferell (2005) propose that firms need to understand
the type of support needed from each group, as well as learn the expectations of business
customers in order to have effective corporate citizenship which falls under the umbrella of
sustainable development.
As this study will combine sustainable development and marketing efforts to gauge returns
on investment, it is crucial to investigate what the literature reveals in the customer equity
management arena.
According to Rust, Lemon and Zeithaml (2004), in a customer management marketing
strategy, the objective is to maximize customer equity and having achieved this, a firm can
use this as a basis for the comparison of strategic marketing alternatives. Customer equity is
defined as, “the total of discounted lifetime values summed over all of the firm‟s current and
potential customers” (Rust et al. 2004, p.110).
MCOM RESEARCH REPORT: 395826
13
Customer equity evaluates all marketing expenditures on the same basis while customer
lifetime value (CLV) is the suitable metric for individual customers (Rust et al. 2004).
Conceptualizing the suitable methods for the growth and management of customer equity
requires a breakdown of the construct into its components of value equity, brand equity and
relationship equity (Rust et al. 2004).
These components each have specific, incisive actions a bank could use to enhance them all
and the association between customer equity and these actionable drivers provides firms with
a framework to systematically respond to changing customer needs and a changing
competitive environment (Rust et al. 2004).
For this study, the focus will be placed on corporate social responsibility as it was established
that this form of sustainable marketing practice would greatly benefit the banking sector. This
construct would need to be integrated with the company‟s current initiatives and projects to
ensure synchronicity across the business.
In addition, the literature review will show how the proposed model will be used to gauge the
balance between sustainable development, service excellence and profitability. Thus, this
study is critical in merging both sustainable development and customer equity as the way the
business operates today and into the future.
The literature review will commence with an overview of marketing accountability and the
role of customer equity in gauging returns, investigate measures used in customer equity and
brand equity.
2.2 Marketing accountability techniques
2.2.1 Introduction
Marketing accountability is difficult to achieve because the cause-and-effect relationships
between marketing and business performance usually are not clearly defined in the literature.
Many researchers agree that tactical insights at this level are what many companies want
(Hanssens et al. 2008). Numerous tools have been proposed in the literature to gauge the
value of a firm and one of these tools is customer equity.
MCOM RESEARCH REPORT: 395826
14
Gupta, Lehmann, and Stuart, (2004), posit that customer equity is a reasonable proxy for the
value of the firm. This conclusion is supported by Rust et al. (2004), based on analysis of
American Airlines. Gupta‟s, et al. (2004) customer based valuation approach is based on the
premise that says if the long-term value of a customer can be estimated and the growth in
number of customers can be forecast, it is easy to value a company‟s current and future
customer base. It is thus critical to understand the profit orientated framework as that places
an effect on the company‟s value.
The Profit-Orientated Framework thus includes an analysis of the following sections:
a) Obtaining the largest long-term profits from customers using a customer equity
approach.
b) Measurements of marketing success and how this may be linked to the firm‟s market
value.
c) A bank‟s value, brand and relationship equity with specific ideas for how this may be
increased most effectively.
2.1.2 Obtaining the largest long-term profits from customers using an equity approach
As it has been established, the banking sector in South Africa is facing intense competition
especially with the emergence of new players that target the low income market like Capitec
Bank. This competition places a greater urgency for establishing means to obtain long term
profits from customers thereby ensuring cost effective management of funds using an equity
approach. This was highlighted by Thompson (2001) and is an efficient way to build and
maintain relationships with customers, thereby increasing the customer‟s life span with the
respective bank.
It is therefore crucial to review the customer equity approach and what the literature reveals
about different aspects of it as this can enable successful modelling of marketing returns
using the equity framework that is currently being employed by the banks.
2.2 Customer Equity Logic for Marketing
Many researchers agree that today‟s economy has shifted from being goods driven to services
driven, thus customers and firms have shifted from focusing on transactions to focusing on
relationships (Vargo & Lusch 2004). This has led to a fundamental shift from marketing
products to managing customers (Rust et al. 2004).
MCOM RESEARCH REPORT: 395826
15
This shift is described as the new dominant logic for Marketing where service provision
rather than goods is fundamental to economic change and this shift can be observed
particularly in the South African banking sector (Vargo & Lusch 2004) in the same manner
that Rust et al (2004) observed the importance of customer service in the airline industry
Customer orientation suggests that businesses need to spend resources to capture the business
of high value prospective customers. Thereafter, it is critical that high value customers,
converted to the company are then retained through excellent service (Blattberg & Deighton
1996). The customer equity logic seeks to establish the value of providing superior customer
service and how this translates in sustainable value for the firm
For banks and businesses in general, setting a marketing budget requires the firm to balance
what is spent in terms of customer acquisition with what is spent on retention. The customer
equity logic places emphasis on both as by achieving both targets the company will achieve
higher customer equity (Blattberg & Deighton 1996). It is equally important for the banks to
spend on retaining customers. The return on investment model investigated in this study will
consider marketing efforts for acquisition and retention in order to cater for Blattberg et al,
(1996) findings.
Essentially, appraising customer equity has two determinants: The cost of acquiring new
customers and the future profit stream from retained customers, thus the new goal of the
marketing strategy is to maximize customer equity by balancing acquisition and retention
efforts (Blattberg & Deighton 1996). To establish this balance, an understanding needs to be
made of the various measures utilised to gauge a firm‟s value and these are discussed below
2.3 Measurements of a firms market value
According to Hanssens et al. (2008), the ultimate performance measure is unit sales or
revenue, and the lessons learned improve profits in the near term. Profits are critical for
business and that is the major goal for all businesses. Consequently, models have been
developed for businesses that depend on building long-lasting, profitable relationships with
customers. One of these measures is customer lifetime value and it is the dominant means of
assessing customer value. Some of the other models though similar to customer lifetime
value, still fall short and thus this study seeks to improve in that domain.
MCOM RESEARCH REPORT: 395826
16
According to Rust et al. (2004), Customer Lifetime Value (CLV) can be defined as a measure
of the future financial value of the customer‟s purchases with an organization and considers
factors such as:
1. How much the customer spends on each purchase with the firm,
2. How often the customer purchases from the firm
3. The likelihood of the customer remaining a customer in the future
4. How much it costs to serve the customer and
5. The organization‟s discount rate.
The components of CLV are thus purchase frequency, the contribution margin and the
marketing costs (Venkatesan & Kumar 2004). Venkatesan et al (2004) also prelude to the fact
that it is easier and cheaper to retain customers than to acquire new customers as more
marketing efforts are required to obtain new customers.
To incorporate these components of customer acquisition and retention in the model, one
needs to incorporate brand switching as that determines the level of loyalty that consumers
have to a brand. (Rust et al. 2004). If a customer is loyal to a particular brand the chances of
retaining that customer are very high and similarly, if a brand is reputable and well known,
customers are attracted to it and this increases the likelihood of customer acquisition.
Essentially, Rust et al. (2004) use brand switching to determine the customer lifetime value
using this reasoning as customers switching between brands decreases the retention and
ultimately the CLV.
Brand switching, in the case of the banking sector, would involve customers changing from
one bank to another in search of benefits. Examples were provided in the qualitative study
where some customers switched from FNB to Standard Bank as the latter approved their
home loans thus the customers shifted all their banking to the bank that proved favourable.
Brand profitability, on the other hand, is concerned with understanding the extent to which
customers repurchase that particular brand and this needs to include information about the
focal company and its competitor‟s results. This is vital as it is not enough to have customers
that prefer a brand, they have to actually continually purchase the brand in order for the firm
to realise value (Massy, 1965).
MCOM RESEARCH REPORT: 395826
17
However, knowledge of probabilities of purchases is not sufficient to measure CLV. A
company‟s time horizon and discount rates also need to be assessed and these will be
assessed in this study.
According to Rust et al. (2004), CLV modeling, also involves the modeling of the switching
matrix for each individual customer. This requires using individual level data from a cross-
sectional sample of customers, combined with purchase (or purchase intention) data, then a
firm can estimate model parameters that enable the modeling of CLV at the individual
customer level (Rust et al. 2004). A similar approach was adopted in this study, where
individual data was collected of customers‟ purchasing habits in order to derive the CLV.
For managers, it is important to realize that the switching matrix is largely under the firm‟s
control. If the firm improves the service, for example, this could result in a higher retention
rate. The following section provides explanations of the different equations and use of the
equations used by Rust et al. (2004) to determine various components of customer equity.
This study follows a similar approach and the formulae are listed below:
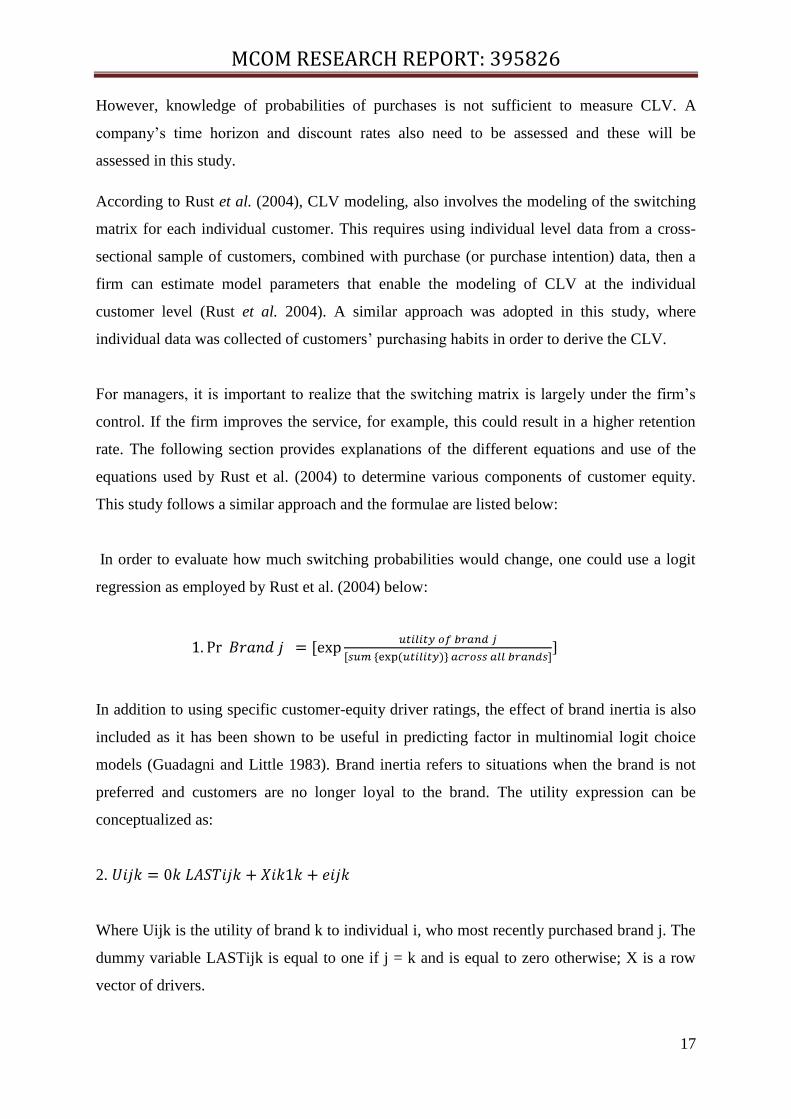
In order to evaluate how much switching probabilities would change, one could use a logit
regression as employed by Rust et al. (2004) below:
]
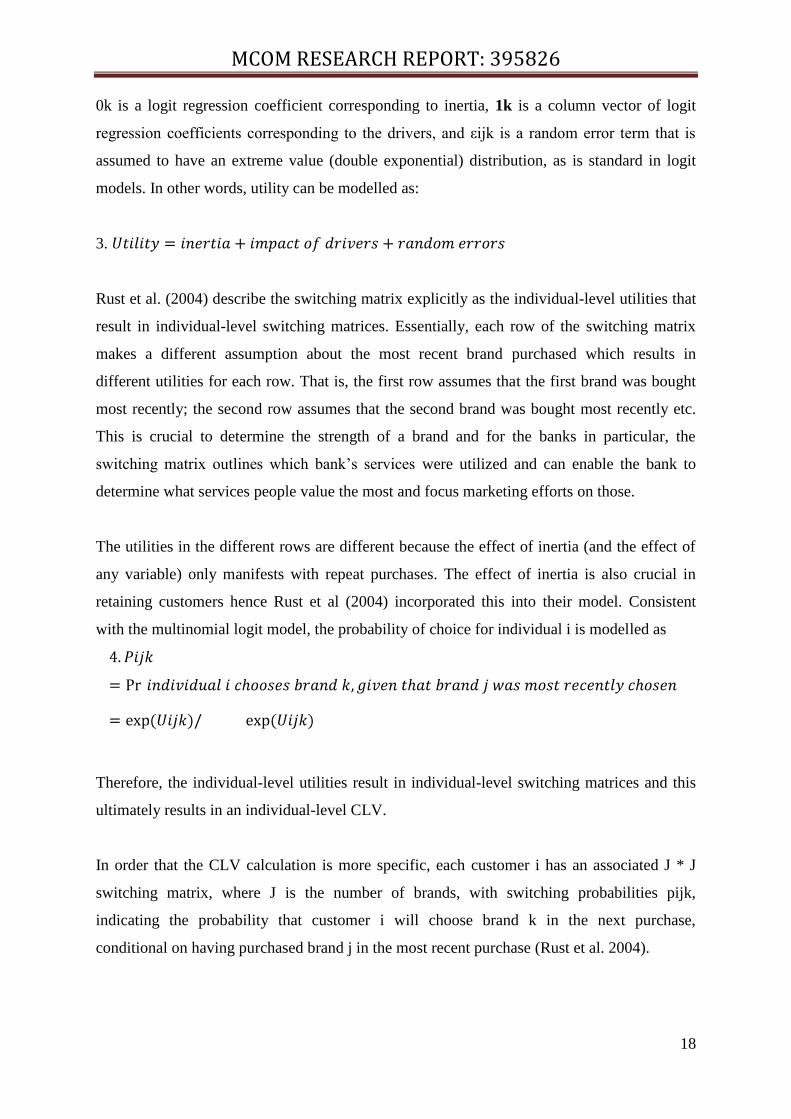
In addition to using specific customer-equity driver ratings, the effect of brand inertia is also
included as it has been shown to be useful in predicting factor in multinomial logit choice
models (Guadagni and Little 1983). Brand inertia refers to situations when the brand is not
preferred and customers are no longer loyal to the brand. The utility expression can be
conceptualized as:
2.
Where Uijk is the utility of brand k to individual i, who most recently purchased brand j. The
dummy variable LASTijk is equal to one if j = k and is equal to zero otherwise; X is a row
vector of drivers.
MCOM RESEARCH REPORT: 395826
18
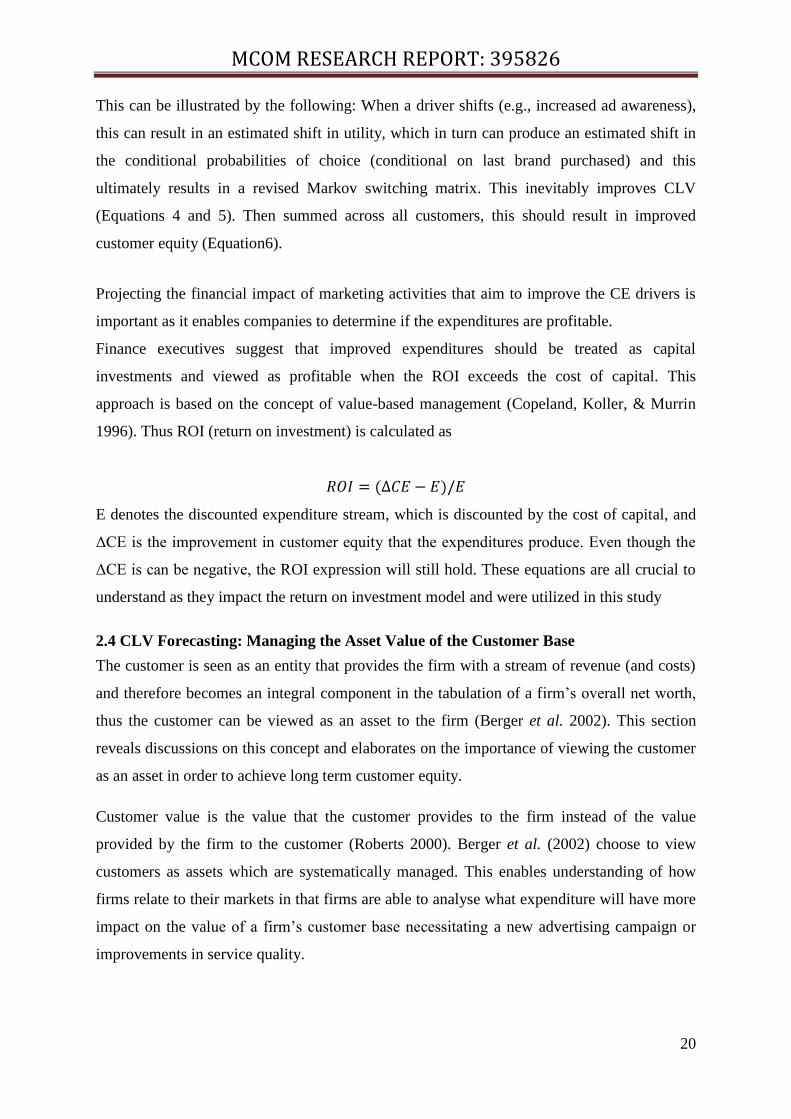
0k is a logit regression coefficient corresponding to inertia, 1k is a column vector of logit
regression coefficients corresponding to the drivers, and εijk is a random error term that is
assumed to have an extreme value (double exponential) distribution, as is standard in logit
models. In other words, utility can be modelled as:
3.
Rust et al. (2004) describe the switching matrix explicitly as the individual-level utilities that
result in individual-level switching matrices. Essentially, each row of the switching matrix
makes a different assumption about the most recent brand purchased which results in
different utilities for each row. That is, the first row assumes that the first brand was bought
most recently; the second row assumes that the second brand was bought most recently etc.
This is crucial to determine the strength of a brand and for the banks in particular, the
switching matrix outlines which bank‟s services were utilized and can enable the bank to
determine what services people value the most and focus marketing efforts on those.
The utilities in the different rows are different because the effect of inertia (and the effect of
any variable) only manifests with repeat purchases. The effect of inertia is also crucial in
retaining customers hence Rust et al (2004) incorporated this into their model. Consistent
with the multinomial logit model, the probability of choice for individual i is modelled as
Therefore, the individual-level utilities result in individual-level switching matrices and this
ultimately results in an individual-level CLV.
In order that the CLV calculation is more specific, each customer i has an associated J * J
switching matrix, where J is the number of brands, with switching probabilities pijk,
indicating the probability that customer i will choose brand k in the next purchase,
conditional on having purchased brand j in the most recent purchase (Rust et al. 2004).
MCOM RESEARCH REPORT: 395826
19
This leads to the concept of the Markov switching matrix which is denoted as Mi, and the 1 ×
J row vector Ai has as its elements the probabilities of purchase for customer i‟s current
transaction. The matrix can be depicted as
(4) Bit = AiMit
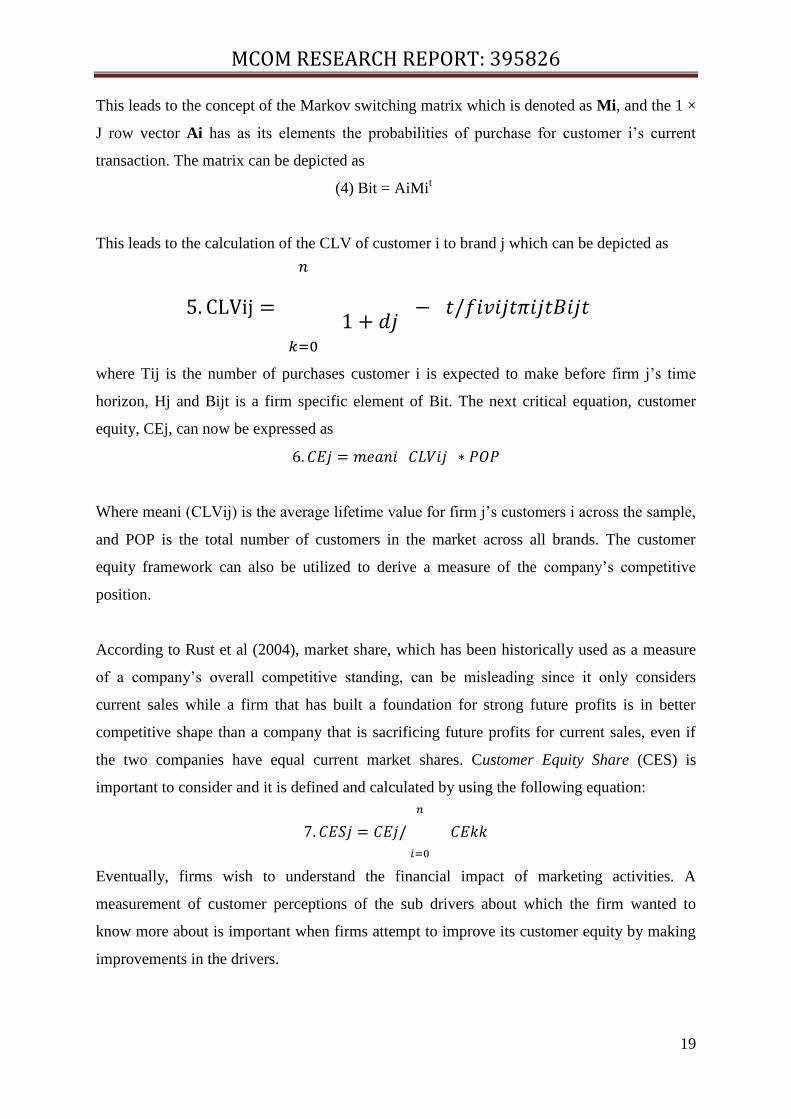
This leads to the calculation of the CLV of customer i to brand j which can be depicted as
where Tij is the number of purchases customer i is expected to make before firm j‟s time
horizon, Hj and Bijt is a firm specific element of Bit. The next critical equation, customer
equity, CEj, can now be expressed as
Where meani (CLVij) is the average lifetime value for firm j‟s customers i across the sample,
and POP is the total number of customers in the market across all brands. The customer
equity framework can also be utilized to derive a measure of the company‟s competitive
position.
According to Rust et al (2004), market share, which has been historically used as a measure
of a company‟s overall competitive standing, can be misleading since it only considers
current sales while a firm that has built a foundation for strong future profits is in better
competitive shape than a company that is sacrificing future profits for current sales, even if
the two companies have equal current market shares. Customer Equity Share (CES) is
important to consider and it is defined and calculated by using the following equation:
Eventually, firms wish to understand the financial impact of marketing activities. A
measurement of customer perceptions of the sub drivers about which the firm wanted to
know more about is important when firms attempt to improve its customer equity by making
improvements in the drivers.
MCOM RESEARCH REPORT: 395826
20
This can be illustrated by the following: When a driver shifts (e.g., increased ad awareness),
this can result in an estimated shift in utility, which in turn can produce an estimated shift in
the conditional probabilities of choice (conditional on last brand purchased) and this
ultimately results in a revised Markov switching matrix. This inevitably improves CLV
(Equations 4 and 5). Then summed across all customers, this should result in improved
customer equity (Equation6).
Projecting the financial impact of marketing activities that aim to improve the CE drivers is
important as it enables companies to determine if the expenditures are profitable.
Finance executives suggest that improved expenditures should be treated as capital
investments and viewed as profitable when the ROI exceeds the cost of capital. This
approach is based on the concept of value-based management (Copeland, Koller, & Murrin
1996). Thus ROI (return on investment) is calculated as
E denotes the discounted expenditure stream, which is discounted by the cost of capital, and
ΔCE is the improvement in customer equity that the expenditures produce. Even though the
ΔCE is can be negative, the ROI expression will still hold. These equations are all crucial to
understand as they impact the return on investment model and were utilized in this study
2.4 CLV Forecasting: Managing the Asset Value of the Customer Base
The customer is seen as an entity that provides the firm with a stream of revenue (and costs)
and therefore becomes an integral component in the tabulation of a firm‟s overall net worth,
thus the customer can be viewed as an asset to the firm (Berger et al. 2002). This section
reveals discussions on this concept and elaborates on the importance of viewing the customer
as an asset in order to achieve long term customer equity.
Customer value is the value that the customer provides to the firm instead of the value
provided by the firm to the customer (Roberts 2000). Berger et al. (2002) choose to view
customers as assets which are systematically managed. This enables understanding of how
firms relate to their markets in that firms are able to analyse what expenditure will have more
impact on the value of a firm‟s customer base necessitating a new advertising campaign or
improvements in service quality.
MCOM RESEARCH REPORT: 395826
21
Customer value means the asset value of the customer from a firm‟s standpoint i.e the
customers‟ lifetime value to the firm (Berger et al. 2002). The value the customer provides to
the firm is the sum of the discounted net contribution margins over time of the customer
which is the revenue provided to the firm less the firm‟s cost associated with maintaining a
relationship with the customer (Berger and Nada 1998). The firm cannot perfectly predict
how much an individual customer will contribute to its net worth, but it can calculate the
expected value of the cash flows associated with an individual customer based on the
customer‟s characteristics and the firm‟s planned marketing actions (Berger et al. 2002).
Essentially, Customer Lifetime Value (CLV) refers to the monetary value of the customer (or
group of customers) over this time period (Berger et al. 2002). CLV analyses require each
firm to make a careful assessment of the costs and benefits of alternative expenditures and
investments, and then determine the optimal allocation of resources to homogeneous
customer groups (Berger et al. 2002). Research has encountered many challenges and
problems in linking marketing actions to CLV resulting in some managers and researchers
concluding that marketing actions are ineffective in increasing the value of the customer base.
Berger et al. (2002)‟s framework presents CLV as a dynamic construct since it not only
influences the eventual allocation of marketing resources, but also is influenced by that
allocation. Changes in the value of customer assets triggered by changes in marketing and
changes in the allocation of firm resources (leading to changes in marketing actions) occur in
a continuous, cyclical fashion.
In managing the asset value of the customer base, the four actions that firms must take in
order to understand how their marketing activities affect the value of their customer assets
are:
1. Create a database guided by marketing intelligence for the calculation of CLV
2. Segment according to customer needs and purchase patterns
3. Forecast CLV under alternative scenarios
4. Allocate resources to maximize the value of the customer base
By viewing customers as assets, and systematically managing those assets, a firm will be able
to allocate its resources optimally and take the most appropriate marketing actions to acquire
and maintain those assets so as to maximize the returns from them (Berger et al. 2002).
MCOM RESEARCH REPORT: 395826
22
Once the CLV has been determined, the Customer Equity Management System suggests that
the following drivers need to be examined: Brand Equity, Value Equity and Relationships
Equity. These collectively form customer equity and are crucial in determining the customer
equity for any business entity.
2.5 Customer Equity overview
According to Rust et al. (2004), in a customer management marketing strategy, the objective
is to maximize customer equity and having achieved this, a firm can use this as a basis for the
comparison of strategic marketing alternatives. As has been previously highlighted, customer
equity validly evaluates all marketing expenditures on the same basis while CLV is the
suitable metric for individual customers (Rust et al. 2004). Viewpoints on this concept are
discussed below
For most firms, customer equity is certain to be the most important determinant of the long-
term value of the firm but not responsible for the entire value of the firm. (Lemon, 2001).
Since customer equity is about cash flow derived from current customers and future
customers, it addresses the long-term sustainability of a firm‟s cash flow. Lemon posits that
customer equity offers a powerful new approach to marketing strategy, replacing product-
based strategy with a competitive strategy approach based on growing the long-term value of
the firm. There is clearly a shift from brand-centric to customer centric marketing. According
to Bell (2002), the point is not that product-or-brand-driven initiatives are unimportant or that
the focus is misplaced but that the shift to a customer focus enables marketing tools to be
more directly accountable for their intended results and to learn by a process of adaptive
experimentation.
Direct accountability is one consequence of the ability to market to identified customers.
Another, perhaps more important, is the ability to compute a customer‟s lifetime value and
thereby to select customers and measure marketing results by the criterion of customer worth.
By effectively leveraging the capabilities of information technology, marketing is entering a
state where investment and returns can be credibly measured and indeed marketing functions
can be related to market capitalization and shareholder value creation. (Bell, 2002). Rust et al
(2004) also allude to this fact.
MCOM RESEARCH REPORT: 395826
23
Leone (2006) argues that brand equity and customer equity tend to emphasise different
aspects. The customer equity perspective puts much focus on the bottom-line financial value
extracted from customers. Its' clear benefit is the quantifiable measures of financial
performance it provides. Leone (2006) also concludes that the customer equity perspective
largely ignores some of the important advantages of creating a strong brand. Examples
include the ability of a strong brand to attract higher quality employees, elicit stronger
support from channel and supply chain partners, and create growth opportunities through line
and category extensions and licensing, and so on. In particular, the customer equity
perspective is somewhat weak in capturing the nature of marketing tasks that deal with
managing the channel and managing competitors.
Leone‟s argument is however nullified by Lemon‟s (2001) argument that says customer
equity depends on three drivers namely; value equity, brand equity, and relationship equity.
Therefore, brand equity is a subset of customer equity. One weakness of the customer equity
approach is that it does not (according to Leone, 2001) always fully account for competitive
response and the resulting moves and countermoves; nor does it fully account for social
network effects, word-of-mouth, and customer-to-customer recommendations.
Other authors agree with Lemon (2001) and elaborate that marketing is viewed as an
investment (Srivastava, Shervani, and Fahey 1998) that produces an improvement in a driver
of customer equity. (Rust, 2004). In order to fully accomplish customer equity, firms need to
make an effort to improve all three drivers. However, this concept implies that if all these
drivers are improved, the firm will have significant market share and hence higher equity but
there is no clear link between market share and profitability. Previous studies attempted to
link market share to profitability as this study also attempts to do. A company that has built
the foundation for strong future profits is in a better competitive position than a company that
is sacrificing future profits for current sales, even if the two companies‟ current market shares
are identical. (Rust, 2004). There has been a shift from focusing on market share and brand to
managing customer lifetime value (CLV) and most recently to customer equity (CE).
MCOM RESEARCH REPORT: 395826
24
Customer equity is referred to (Rust 2004) as an alternative to market share that takes CLV
into account. Gupta (2004) found that a 1% improvement in retention, margin, or acquisition
costs improves firm value by 5%, 1% and 0.1% respectively. They also find that a 1%
improvement in retention has almost a five times greater impact on firm value that a 1%
change in discount rate or cost of capital. (Gupta, et al. 2004).
Most companies refer to customers as assets from which value can be extracted and a brand is
considered as one of the market- based assets. If indeed value can be extracted then it should
be quantified. . The value of a customer is based on both the lifetime value and the indirect
economic returns from influencing other prospective or current customers (Kraft, Rudolph &
Rudolf- Sipotz, 2005).
Conceptualizing the suitable methods for the growth and management of customer equity
requires a breakdown of the construct into its components of Value Equity, Brand Equity
and Relationship Equity (Lemon, 2001). These components each have specific, incisive
actions a firm could use to enhance them all and the association between customer equity and
these actionable drivers provides firms with a framework to systematically respond to
changing customer needs and a changing competitive environment (Rust et al. 2004).
2.6 Value Equity
2.6.1 Definition and Role
Value equity represents the customer‟s objective evaluation of the firm‟s product and service
offerings such as banking services (Rust et al. 2004). Value equity is defined as the
consumer‟s overall assessment of the product or service based on perceptions concerning that
which is given up for that which is received (Lemon, 2001). Value is an important link
between a customer and the firm and thus the firm should deliver on the value basics to meet
customer needs and expectations (Rust et al. 2004). The three drivers for value equity are
quality, price and convenience.
MCOM RESEARCH REPORT: 395826
25
According to the Lemon (2001), value equity is most important when
1. The customer can discern difference between competing products
2. The innovative products and services are introduced
3. Customers face complex purchase decisions and
4. Firms wish to reinvigorate mature products or services
2.6.2 Drivers of Value Equity
The drivers of value equity are explored below
Quality: Quality can be defined as a form of overall evaluation of a product, similar to
attitude (Zeithaml, 1988).
Firms can make the environment interesting for consumers and they can make their processes
less burdensome for consumers whilst enhancing customer trust through the consistency of
the service environment. Rust et al (2004) establish that high quality of a product results in
higher value equity which in turn increases customer equity. The banks thus need to be
assessed on this aspect and the study‟s quality sub-driver is formulated in the question: “How
proud would you be to use these bank‟s services?”
Price: Price has been used as a tactic to attempt to influence customer perceptions of value
(Rust et al. 2004). Usually customers associate high price with high value and the opposite is
true in assessing low priced products. Pricing strategy can be defined as a reasoned choice
from a set of alternative prices that aim at profit maximization within a planning period in
response to a given scenario (Tellis 1986). To evaluate the price component and its effect on
customer equity, the study‟s price sub-driver is formulated in the question: “How would you
rate the competitiveness (Cheap vs Expensive) of bank charges to use your account (overall
bank charges) for each of these banks?” These questions are derived from Rust et al (2004)
study as they employed the same questions to assess price effect.
Convenience: According to Rust et al. (2004), convenience has three sub-drivers and these
include location, availability and ease of use. Customers do not like to work too hard to
achieve their objectives so firms can benefit from this by making their product more
convenient and easily accessible to the consumer. The sub drivers are defined below:
MCOM RESEARCH REPORT: 395826
26
Location is defined as the physical or virtual space in which customers interact with the firm
or purchase from the firm. For the banks used in this study, this includes the bank itself, the
atms for the specific bank and walk in service centres. For value equity to improve, the
location and experience thereof must be positive and encourage customers to continue using
the service without feeling inconvenienced.
Ease-of-use can be defined as enhancements to a product or service that allows the customer
to operate more effectively and efficiently. Anything that makes the product easier to use can
be classified in this category and examples include the tips displayed at atms to assist the
consumers, service agents inside the banks that help customers to navigate to the correct
queue and the pamphlets on various banking needs that enable the customer to choose their
package efficiently.
The last aspect of convenience is availability and this is, defined as an aspect of the firm‟s
offering that determines when customers can contact or interact with the firm. Availability is
crucial as clients need to be able to contact their service provider and Lemon (2001) warns
that if this factor is not catered for it could be the number reason for customers switching to
another service provider.
The study‟s convenience sub-driver is formulated in the following statement that is rated:
“The bank serves me when and where I need it to”.
2.7 Brand Equity
2.7.1 Definition and Role
The second aspect of customer equity is brand equity. According to Rust et al. (2004), brand
equity represents the customer‟s subjective view of the firm and its offerings. Brand equity is
defined as that customer equity segment which encapsulates the customer‟s brand
perceptions. These perceptions are inevitably subjective and can be shaped by the firm
through its marketing strategies and tactics and the customer can influence them through
associations, experiences and connections with the firm‟s branded products and services.
These created perceptions also reiterate Rust et al. (2004)‟s notion that brand equity is the key
customer equity component since brand management may be essential to successful customer
management since the brand has the ability to influence the probability that a customer
continues to do business with the firm.
MCOM RESEARCH REPORT: 395826
27
2.7.2 Drivers and potential impact of brand equity.
The drivers of brand equity are namely brand awareness, attitude toward the brand and
corporate citizenship and ethics. These drive brand equity because they have a large impact
on customers‟ perceptions and are discussed further in this section.
Brand Awareness is the extent to which a customer shows knowledge and recall of a certain
brand and the opportunity for awareness cultivation depends on the Customer
Communication Strategy building blocks and Word of Mouth initiatives. Numerous examples
are discussed such as the big yellow M symbol of McDonalds as something that consumers
can easily recall or the tick of Nike‟s “do it” on sporting attire is instant recognition of the
Nike brand. Brand awareness is important if a firm is to survive and to achieve that
communication strategies have to be put in place. According to Rust et al. (2004), within
these Communication Strategy are six sub-drivers:
Media Advertising: This includes mass-market customer communications such as
television, radio, print and billboard advertising and web-page development. These
tend to be the most expensive techniques as they reach masses of people.
Direct to Consumer: Unlike the above, these include customized communications
such as direct mail, e-mail, outbound telemarketing, sales force communications and
websites. In using these communications, it is important that the right consumers are
reached and that these customers are actually consuming these efforts. It is equally
important to ensure that these communications are consistent with these customers‟
communication preferences.
Consumer to Firm: These include websites, customer service, e-mail, inbound
telemarketing and incoming direct mail.
These elements depend on the opportunities that firms create for their customers to
communicate with the firm and they increase in importance as customers become
less-willing to respond to direct-to-customer communications.
MCOM RESEARCH REPORT: 395826
28
Sales Promotions, Publicity and Public Relations: Sales Promotion initiatives are
coupons, featured advertisements, contests and in-store displays. Publicity and Public
Relations initiatives include formal firm communications that are not paid for, thus it
is critical to ensure that these events communicate that which is consistent with the
firm‟s brand strategy. An example of this includes in- store displays in busy malls.
Word of Mouth Campaigns: These are known to encourage customers to „spread the
(positive) word‟ about the brand and thus customers can be offered incentives such as
refer-a-friend incentives. Viral Marketing campaigns are also an example of this.
Effectiveness of the Communications: In order to evaluate this, firms have to
consider whether their strategy initiatives answer to the call of the firm building
awareness and attracting new customers, reminding existing customers to return
and/or tell others and realising the firm‟s long-term strategy of building emotional-ties
with customers.
These techniques can all be employed to achieve brand awareness. It is the firms marketing
department‟s responsibility to devise a suitable mix of techniques for their target market and
the banks in South Africa tend to use the first three elements of media advertising, direct
marketing and consumer to firm techniques. These techniques are working well for all the
banks as consumers can easily identify them by brand name, symbol and what the bank
stands for. This could also be due to the fact the bank market is small with only 4 major
players and small new entrants.
Attitude toward the brand is another component of brand equity and it is determined by the
brand position. The brand position is defined as how the strengths and weaknesses of a brand
are defined by the customer relative to substitutes and competitors. This driver is critical
since a considerable portion of a firm‟s success depends on its ability to capture the heart and
minds of consumer‟s which depends on accurate positioning where there is the right fit
between the firm and its customer base. The sub-drivers are:
A Media Creative Strategy: The key message(s) which the firm wishes to convey to
current and potential customers may include the messages the sales force should
deliver to current and potential customers.
MCOM RESEARCH REPORT: 395826
29
Media Placement: This depends on the firm‟s target market choice, thus an accurate
and focused segmentation procedure will be required. For example, when designing
media campaigns, a bank would need to establish what forms of media would most
effectively reach their target market and this concurrently develops a customers‟
attitude toward the bank. Nedbank is currently trying to reach the lower LSM‟s and
absorb customers from those segments so to effectively do so they must air their
messages on public television like SABC channels and radio and not DSTV or any
other magazines that do not reach these consumers.
Brand Name and Brand Partners: These include selecting associate brands that can
enable customers to develop positive attitudes towards the brand e.g Know soups
sometimes partner with Robertsons spices as the two products can be used together
and customers can make sense of the use of the product. Selecting these can
positively or negatively influence the brand‟s position depending on whether the
names and partners align with the brand‟s image. Some banks have employed this
technique in South Africa and an example is Absa bank partnering with the PSL
soccer league in order to gain favourable attitudes with the mass market.
Packaging and Merchandising: Product package design, the product display can
affect the overall brand‟s positioning in that customer brand perceptions can be
influenced. Firms must ensure the package aligns with the firms brand values so as to
keep consistency and enable customers to recall the brands more effectively.
Site Location and Distribution Strategy: Distribution decisions influence the brand
position whereas site location can significantly influence the brand‟s perception.
Firms need to design their sites to match the branding strategy in order to be effective
Corporate Citizenship and Ethics in a brand equity frame of reference this considers the
degree to which brands and customer values are consistent. Corporate citizenship is the last
driver of brand equity and probably the most expensive driver to execute as firms usually
devise a separate corporate citizenship budget. The values of a firm‟s customers relate to the
brand when growing brand equity is considered. Thus, these values need to be understood as
the strength of this driver depends on the firm‟s customer base.
MCOM RESEARCH REPORT: 395826
30
It is without saying that this driver exemplifies how a firm can benefit when it is strengthened
and how the firm can suffer if the driver is viewed negatively by its customers. The sub-
drivers of this driver are:
Community Event Sponsorship and Strong Record of Giving to the Community:
Event sponsorship can complement brand and firm reputation, brand perceptions and
even favourably position a brand relative to its competitors. South African banks are
doing well in this aspect as they sponsor numerous events.
Development and Maintenance of a Privacy Policy for Use of Customer
Information: Strong and solid private policies that protect these primary stakeholders
have the ability to build customer confidence and improve customer perceptions of
the firm‟s ethical practices. It is usually the norm to collect customer databases but in
order to improve trust; firms must try to protect this information.
Clean Environmental Record: According to Ackerstein & Lemon (1999), a firm
which engages in „green‟ practices can positively influence brand equity.
Ethical Hiring and Work Practices: Due to the globalization of the workforce, there
is more pressure for firms to practice ethical hiring practices and working conditions
in all markets, especially developing countries where low-income stakeholder‟s
(employees) are subjected to poor working conditions.
Strong Product or Service Guarantees: These have the ability to build customer
confidence and improve customer‟s perceptions of the respective firm‟s ethical
practices.
Focusing on building strong corporate citizenship and combining it with strong brand
awareness and positive attitudes towards the brand are some of the solid strategies that can
effectively be created that can build brand equity (Rust et al. 2004).
Building a brand means building brand equity by ensuring that new customers buy and
current customers buy again (Rust et al. 2004). Since the drivers have been identified, it is
important to also discuss what brand equity can do.
MCOM RESEARCH REPORT: 395826
31
This first requires a brief discussion of what brands can do for the firm. Rust et al. (2004)
point out that brands are able to
1) Build a customer‟s awareness and recognition of the firm‟s product and service
offerings- This means that the brand acts as a magnet attracting new customers.
2) Act as a hallmark reminder for the customer about the firm – The brand stimulates
customer retention as it ensures that current customers continue to think of the firm
3) Build an emotive brand-based tie between the customer and the firm- Customers with
strong relationships with the brand closely identify with it and may form a
relationship with that firm such as a loyal committed partnership which ensures
customer retention and is preferred to a one-shot frivolous engagement.
According to Rust et al. (2004), brand equity influences customer equity in three distinct
ways. If more favourable attitudes are created toward the brand, it is more probable that
customer‟s will purchase the brand. Secondly, customers with increased positive feelings
about the brand are less probable to switch to the competitor brand. Finally, these positive
attitudes and feelings increase the probability that the customer will recommend the brand to
others, thereby increasing the probability for other customers to try the brand.
2.8 Relationship Equity
The second aspect of customer equity is relationship equity. In Rust et al (2004) model
relationship equity is assessed and it was found that the companies that built stronger
relationships with their customers tended to keep the customers longer and this consequently
increased customer equity. Relationship equity is thus essential and in an effort to maintain
relations with clients, companies have developed databases that capture customer information
including details of their profiles, demographics and bought products and this data was used
by employees in order to determine market trends
Customer relationship management (CRM) ensures that this database software is used to
develop actions that enhance customer relationships and the banks in South Africa all
maintain some form of database of their customers.
MCOM RESEARCH REPORT: 395826
32
According to Foss & Stone (2001), CRM is a useful tool in managing customer relationships.
However, this requires concrete, practical value-driven initiatives as opposed to abstract
ideals as research indicates. Greenberg (2004) suggests that CRM‟s implementation requires
planning in order to succeed and such a program fails to succeed with lack of or poor
planning. Lovelock & Wirtz (2007) suggest that over half of CRM implementations fail since
companies equate installing CRM systems to having customer relationship strategies which
means they perceive the system to be a strategy itself instead of a tool that enhances the
firm‟s customer servicing capabilities (Lovelock et al. 2007)..
CLV is speedily gaining acceptance as the benchmark metric of acquiring, growing and
retaining the appropriate customers in customer relationship marketing (Venkatesan &
Kumar, 2004). However, many companies misuse the measurement since they initially work
with undesirable customers or they do not know how to create the highest value (Thompson
2001). Most marketing managers are challenged with achieving convergence between
marketing actions and CRM (Venkatesan & Kumar, 2004). Venkatesan & Kumar (2004)
suggest that firms specifically need to take all consumer data collected and integrate this with
how the firm and customers interact.
2.8.1 Definition and Role
Relationship equity represents the customer‟s view of the strength of the relationship between
the customer and the firm (Rust et al. 2004). Relationship equity involves two components,
namely understanding and managing one relationship‟s evolution and managing a portfolio of
different relationships which are at different stages in the evolution (Rust et al. 2004). Buyer-
seller relationships exist along a spectrum bounded at one end by single transactions and at
the other by collaborative relationships or partnerships and in each transactional relationship
firms wish to maximize returns in each transaction (Rust et al. 2004). This is applicable to the
banking sector as they can improve on customer equity through the drivers discussed further
below.
MCOM RESEARCH REPORT: 395826
33
2.8.2 Drivers of Relationship Equity
First-In-The-Door-Approach: This is a strategy where the first customers drawn to a
product are immediately absorbed by the offer and relationships are built immediately for
future sales. Understanding and managing a relationship‟s evolution involves a Foot-in-the-
door-approach (FITD). In this technique, vendor‟s ultimately aim to capture all the money
customers can potentially spend as early as possible and breaking down the firm‟s total
offering into many independent components constitutes the FITD approach with the first
component sold being what is termed in the literature as the foot in the door (Rust et al.
2004).
The FITD approach must
1. Mitigate customer risk, thus be inexpensive enough to be purchased without hesitation
2. Fit between product functionality and customer needs must be close
3. The product quality should be impeccable
4. Customer problems should be solved uniquely to ensure that vendor‟s credibility and
forestall competitive entry at a late date
5. A progressive path for future sales in the relationship should be laid out (Rust et al.
2004). FITD could fail if the FITD product fails, if the vendor is identified as being
good at just the FITD product and the competitors get customers to switch by giving
away the FITD product.
This technique is not common in the banking sector but it is essential in any case to
understand all the tools proposed in the literature.
All-At-Once-Approach: This approach is ideal when the vendor wishes to sell the whole
bundle of products and services from the onset of the relationship (Rust et al. 2004). This
approach can enable a firm to streamline processes for servicing downstream business,
incorporate midstream opportunity selection, locate a narrow path of upstream sales
opportunities for proactive selling and install a new set of evaluation measures for evaluating
its customer management efforts (Rust et al. 2004).
MCOM RESEARCH REPORT: 395826
34
Different customers play different roles in a firm, thus should be managed differently, thus
each relationship process needs to be adapted to a particular customer type and this is
illustrated by the price versus cost to serve (CTS) framework which associates vendor
investments with the returns from each customer relationship (Shapiro et al. 1987). The
framework depicts four stages which customer relationships can occur and change.
Stage 1: This is depicted by High prices and High CTS at the introduction of a new product
that offers sustainable benefits. The high CTS are due to customer education costs and the
need for support in the absence of experience with the vendor and product (Rust et al. 2004).
Sometimes referred to as „pioneers‟, customers in this quadrant are expensive to serve,
willing to pay a high price, want turnkey solutions from vendors in that they have chosen not
to develop in-house expertise, are willing to pay the highest premiums for the latest and best
products and as major drivers of innovation push the vendor to stay at the cutting edge of
technology. Firms need to be aware of these needs and treat these customers differently.
Banks do well in this field where Standard bank has premium package for high earners and
these receive their own personal bankers, Nedbank and Absa also have premium packages for
these customers.
Shifts to quadrant 2 occurs when the vendor can more efficiently serve these customers and is
able to reduce their CTS without decreasing price (Hanssens et al. 2008). This shift requires
little or no customer involvement.
Stage 2: In the second stage, vendors scale economies become more efficient and effective
(Hanssens et al, 2008). This stage represents the good times for firms as lessened needs for
support reduces the CTS, customers still value all of the product benefits and thus there is
little competition which allows the vendor to charge higher prices (Bick, 2007).
Customers in this stage are depicted as ignorant in that they are unaware that they are paying
high prices; grateful in that they value the relationship with the vendor and will pay
premiums that rewards the vendor for past efforts; unconcerned in that they are not bothered
by the high price in that costs of negotiating price reductions exceed the benefits of lower
prices; Hostage customers who are prevented from ending the relationship since the vendor
has increased switching costs (Duncan & Moriarty, 1997). A shift to quadrant 3 emerges
from a gradual reduction in service levels coupled with lower CTS that are passed on to
customers in the form of lower prices (Duncan et al, 1997).This shift needs to be jointly
managed with the customer.
MCOM RESEARCH REPORT: 395826
35
Stage 3: The selling strategy here involves offering equivalent products at a sustainably
lower price, thus the vendor reduces prices while continuing to offer the same service
(Hanssens et al. 2008). Here, customers expecting lower prices force vendors to strip away
value-added services and sell them as basic products since this reduces CTS (Hanssens et al.
2008). These customers are switchers who will switch vendors if they cannot obtain lower
prices (Benson et al. 1987). Vendors sometimes reduce CTS through joint investment and
learning and firms differentiate between switchers and could be redefined into collaborators
(Rust et al. 2004).
Stage 4: This stage is characterized by low prices and low CTS. As competition continues,
the focal vendor becomes paranoid about losing the customer therefore, in order to counter
the switching threat, additional services are offered that increase the CTS but since the
customer does not pay a higher price, the relationship becomes highly unprofitable and thus
the process ends here for the vendor (Duncan et al. 1997). Here vendors will do anything to
stay in business and customer relationships that vendors try to buy their way in to populate
the quadrant (Rust et al. 2004). New entrants like Capitec bank play aggressively in this
quadrant as they cannot afford to lose the customers that they have managed to acquire.
The customers that span the four quadrants are
(1) Lead users: These customers have needs, months and years before they become
general in a marketplace.
(2) Advocates and reference accounts: These loyal customers are willing to advertise
through positive WOM, therefore utilizing powerful sales tools that supplement a
vendor‟s sales efforts (Rust et al. 2004).
Essentially, either of these techniques can be employed to build relationships with the
customers but it must first understand the different types of customers and their needs in
order to invest in an appropriate strategy. This study analyses this concept generically as the
relationship questions in the questionnaire attempt to gauge the level of strength of the
relationship and if customers are likely to switch or remain customers of their respective
banks. It is up to the banks to action these findings by adopting any of the techniques
discussed above to build stronger, long lasting relationships.
MCOM RESEARCH REPORT: 395826
36
2.8.3 Customer-Initiated Contacts
Customer Initiated Contacts (CICs) are also a crucial element of this study as they are an
important source of customers concerns, questions and queries (Bowman & Narayandas
2001). Bowman & Narayandas (2001) define CICs as any communication with a
manufacturer that is initiated by a customer or prospective customer. These could be inquiries
about a products use, availability, reformulation, requests or refunds and complaints about
product and/ or service quality performance (Bowman & Narayandas 2001). Firms are
increasingly viewing contacts with their customers as an opportunity that needs to be
managed. Acknowledgement that dissatisfied customers divert a firms marketing and sales
organisation from its core functions has resulted in firms using technology to speed up their
customer service organisations responses to CIC‟s therefore cutting costs and increasing
profits, in particular, the interconnectedness of brand and relationship equity (Piturro 1998).
CIC specific factors are defined as the different customer characteristics (e.g. heavy category
users and light category users) and context specific factors (Bowman & Narayandas 2001).
There are certain antecedents of CICs. According to Bowman & Narayandas (2001), A CIC
entails exchange between a customer and a firm. Exchanges are evaluated along three
dimensions of perceived fairness related to:
1. The allocation of resources and distribution of outcomes (distributive fairness)
2. The process or means by which decisions are made (procedural fairness)
3. How information is exchanged and outcomes are communicated (interactional fairness)
The behavioural consequences of CICs are:
1. Increasing returns to satisfaction and the importance of customer delight.
2. The extremes of satisfaction are an important determinant of behaviour in transaction type
outcomes such as word of mouth activity.
Since it has been established that brand equity is not important to all firms, it is likely to
matter the most in several specific situations. The situations pertaining to the banking
industry are discussed below.
The first situation where brand equity plays a role is in an instance when experiences
associated with the product or service can be passed from one individual or generation to the
next.
MCOM RESEARCH REPORT: 395826
37
This relates to one of Sheth & Parvatinyar‟s (1995) relationship marketing antecedents which
state that, the intergeneration pattern of relationship marketing behaviour will be more
prevalent among family oriented consumers. As the basic sociological unit, the family
determines and shapes the entire social viewpoint and perception of each of its members,
including their purchase and consumption behaviour (Sheth & Parvatinyar‟s 1995). This is
especially true in collectivist societies such as South Africa‟s low-income sector, where
family structures are the focus and co-dependency is common, which results in consumer‟s
often adopting consumption patterns of family members, thus using the banking services of
bank‟s used and approved by family members.
The second vital use of brand equity is when it is difficult to evaluate the quality of a product
or service before consumption. Firms can use a proxy for quality which again, could be a
family member, which reiterates the connection towards relationship marketing efforts.
Achieving profitability in marketing measures is critical but this study also incorporates
consideration for this to occur sustainably.
2.9 Using Customer Equity to assess return on investment
Firms exist to create or improve value for shareholders and other stakeholders such as
employees and communities they operate in. Stakeholders‟ theory is completely consistent
with value maximisation, which implies that managers must pay attention to all
constituencies that can affect the firm (Jansen, 2002). Given the growing importance of
creating value for shareholders, market strategies have to be evaluated by their capacity to
achieve this goal. Accordingly, both the acquisition and maintenance of customers must
result in superior cash flows and augmented shareholder value (Stahl, Matzler & Hinterhuber,
2002).
Gupta, Lehmann, and Stuart, (2001), posit that customer equity is a reasonable proxy for the
value of the firm. This conclusion is supported by Rust, Lemon and Zeithaml, (2004), based
on analysis of American Airlines. Gupta‟s, et al. (2004) customer based valuation approach is
based on the premise that says if the long-term value of a customer can be estimated and the
growth in number of customers can be forecast, it is easy to value a company‟s current and
future customer base.
MCOM RESEARCH REPORT: 395826
38
Having determined the customer base, it becomes easier to assess future returns which are a
key step in increasing marketing accountability. This approach of using customer based
valuation techniques is supported by Gupta, et al. (2004). Gupta, et al. (2004) suggest and
show that the value based on customers can be a strong determinant of firm value.
Customer equity therefore, can be employed to assess a firm‟s value as will be done in this
study.
2.10 The Roles of Sustainable Development and Social Responsibility
As established in the Rust et al (2004) study, customer equity is essential in making
marketing accountable for expenditure and increasing the value of a firm. Effective
management of customer equity results in returns on marketing investment and makes it more
possible for a firm to compete effectively in the business arena.
However, some of the techniques employed by firms today are more difficult to assess. A
major weakness of the customer equity approach is that it does not (according to Leone, 2006)
always fully account for competitive response and the resulting moves and countermoves; nor
does it fully account for social responsibility effects, word-of-mouth, and customer-to-customer
recommendations.
This is crucial to assess considering that firms spends millions on social responsibility initiatives
in order to gain favourability in the market and improve recommendations between customers
when they become more aware of how the firm helps society. With such large budgets being
made for sustainable development it is critical to include this in the model of determining return
on investment.
This section unpacks the sustainable development concept and how it has become a common
marketing tool, especially in the South African banking sector.
MCOM RESEARCH REPORT: 395826
39
2.10.1 CSR and Social Marketing
Amongst many strategies, banks tend to pursue corporate responsibility to earn positive
connotations and preference from their customers. Corporate Social Responsibility (CSR) has
been described as the company's performance in providing information on societal initiatives
undertaken by the firm, community involvement and corporate philanthropy being an activity
above and beyond what is required of the organization (Mullen, 1997). More generally, CSR
is a set of policies, practices, and programs that are integrated throughout business operations
and decision-making processes, and intended to ensure the company maximizes the positive
impacts of its operations on society (Business for Social Responsibility, 2003).
A firm that is socially responsible acknowledges that it exists and operates in a shared
environment, characterized by a mutual impact of a firm‟s relationships on a broad variety of
stakeholders, who are affected by and can eventually affect the achievement of an
organization's objectives. Thus management of stakeholder relationships lies at the core of
CSR and entails establishment of a sound/functioning two-way communication with
stakeholder groups, i.e. understanding the type of support needed from each group, as well as
learning their expectations of business and what they are willing to pay for having their
expectations met (Brønn et al., 2001).
Preliminary research supports the idea that today‟s consumers demand a fairly high level of
CRS (Cui et al., 2003) and firms are finding that consumers‟ perceptions of this responsibility
influence their beliefs and attitudes about new products manufactured by a company (Brown
and Dacin, 1997). This is quite evident in South Africa with Nedbank supporting the green
robots initiative and energy efficiency programs and numerous other businesses sponsoring
community events and building initiatives such as the habitat for humanity.
In their study, Brown and Dacin (1997) place CSR under corporate associations along with
corporate ability (CA) which they define as those associations related to the company‟s
expertise in producing and delivering its outputs while CSR associations reflect the
organization‟s status and activities with respect to its perceived societal obligations.
Examples include food companies like KFC sponsoring food to a community or an event.
This makes sense to consumers as they already associate KFC with food. The authors also
found that CSR associations have an influence on product evaluations specifically through
the overall corporate evaluation.
MCOM RESEARCH REPORT: 395826
40
Besides social responsibility, companies are encouraged to promote ethics, fairness,
transparency, and accountability in all their dealings. They are expected to continue
generating profits while maintaining the highest standards of governance internally and most
businesses in South Africa, irrespective of the industry, adhere to corporate governance
standards.
A firm‟s decisions should also be aligned with the interests of different players within and
outside the company (Freeman, 1984). Hence, businesses have to also keep their activities
attuned to society‟s ethical, legal, and communal aspirations-this falls in the realm of CSR
(Jamali et al., 2008).
Environmental and social issues have become important strategic concerns for businesses
(Fellman, 1999). Consumers are becoming more concerned with corporate social
responsibility and firms are finding that consumers‟ perceptions of this responsibility
influence their beliefs and attitudes about new products manufactured by a company (Brown
and Dacin, 1997). This can be noted in the increase of corporate responsibility budgets
especially in the banking sector as they are one of the biggest economic players in the
country.
Essentially the concept of CSR can be classified into cause related marketing where
companies ensure to support a cause that is linked to the nature of their business, green
marketing where firms can support environmental initiatives especially with the new climate
culture emanating in consumers world-wide and sustainable development which focuses on
developing people and is the umbrella term for developing society. Each of these are
examined below
2.11 Cause-Related Marketing
2.11.1 Definition
There have been many definitions of Cause Related Marketing (CRM) and as it forms part of
sustainable development, it is worth investigating the literature relating to it. According to
Varadarajan and Menon (1988), cause related marketing is the firm‟s contribution to a
designated cause being linked to customers‟ engaging in revenue-producing transactions with
the firm-exchange of good and services for money. The authors view cause related marketing
as the horizontal cooperative promotion, and involves the contribution to a cause by a firm
which is „linked to customers‟ engaging in revenue producing transactions with the firm.
MCOM RESEARCH REPORT: 395826
41
This definition shows that CRM is essentially a way for a firm to “do well by doing good”
and provides several benefits to both the firm and the non-profit organizations (NPOs)
receiving the donations, and only refer to promotions in which the amount given to a charity
by a firm is somehow tied to the purchase intention of consumers (Hou et al., 2008).
CRM is a marketing program that strives to achieve two objectives and these entail
improving corporate performance and helping worthy causes-by linking fund raising for the
benefit of a cause to the purchase of the firm's products and/or services (Varadarajan and
Menon, 1988). This means it will benefit an organisation selling female products to support
women initiatives like women‟s day or breast cancer awareness, similarly, a company which
services children like Pampers and Purity can benefit in cause related marketing if they
sponsor something related to children like vaccinations.
CRM has two types of campaigns: short-term campaigns and long-term campaigns, where
short-term campaigns last for more or less six months while long-term campaigns last for a
year or more.
The South African banking sector has not fully embraced this concept as they sponsor
anything even if it is not linked to the nature of their business such as the soccer league, talent
shows and community events. In the qualitative study, customers of these banks were
interviewed to determine the use and effect of sponsoring of the unrelated causes.
From an experiment done by Duncan & Moriarty (1997), the respondents used were from the
United States of America (U.S.) as well as the United Kingdom (U.K.). From the findings the
authors found how respondents perceive CRM campaigns, where 78% of the respondents in
the U.S. are more likely to buy a product that supports a cause. It was found that U.K.
respondents (86%) were more likely to switch to brands that claim to help a cause a bit more
than the U.S. respondents would (76%). Along with this U.K. respondents (45%) were less
likely to pay more for a brand that supports a cause. Both U.K. respondents as well as U.S.
respondents were aware of companies that support causes (79%, 68%) respectively.
CRM still needs to be investigated in a South African setting to determine if consumers will
switch to a brand that supports a cause. There is very little literature on CRM in an African
context.
MCOM RESEARCH REPORT: 395826
42
2.12 Green Marketing
Green marketing is also a component of sustainable development and the law and regulation
within countries have played a significant role in enhancing consumers‟ awareness and
concerns about the environment and therefore the marketing activities of firms. Ethics is
therefore seen as important to marketers as a company‟s ethical behaviour is perceived as
having an impact on consumer behaviour. Consumers are seen to develop more favourable
attitudes to firms that operate ethically (Carrigan and Attalla, 2001).
Green Marketing is said to be the specific development, pricing, promotion and distribution
of products that do not harm the environment (Mimi & Hu, 2009). According to Mimi et al
(2009), green marketing can be seen as a form of social marketing as it is concerned with not
causing harm to the environment which fulfils one of the society‟s most important goals.
South Africa generally has embraced the green marketing concept but there is still room for
improvement as only a small section of the market actively participates in supporting green
initiatives.
According to Grant (2008), a green brand is one that offers a significant eco-advantage over
the incumbents and which appeals to those who are willing to making green a priority. There
are strong green brands targeting both retail consumers and also B2B customers. Polonsky
(1994) states that businesses believe that green marketing is an opportunity which can be
used to achieve the organization‟s selling goals and that if firms engage in green marketing,
they can use this to distinguish their product offerings as well as obtain a competitive
advantage over other businesses, on top of this, green marketing may also increase the
businesses‟ market share as well as disseminate a positive image to society.
For the South African banking sector, green marketing is a new concept that only the four
major banks have started investing in. They all encourage environmental efficiency and some
banks, like Nedbank, have gone the extra mile to support the green robots initiative.
Businesses are generally motivated to engage in environmental marketing to reduce their
costs, as costs for hazardous behaviour towards the environment, such as waste disposal are
increasing. When firms decrease their hazardous behaviours they save on costs which allow
their profits to increase (Polonsky, 1994). This logic suggests that investing in green
marketing can translate to higher returns by saving other operational costs and simultaneously
gaining favourability in the market.
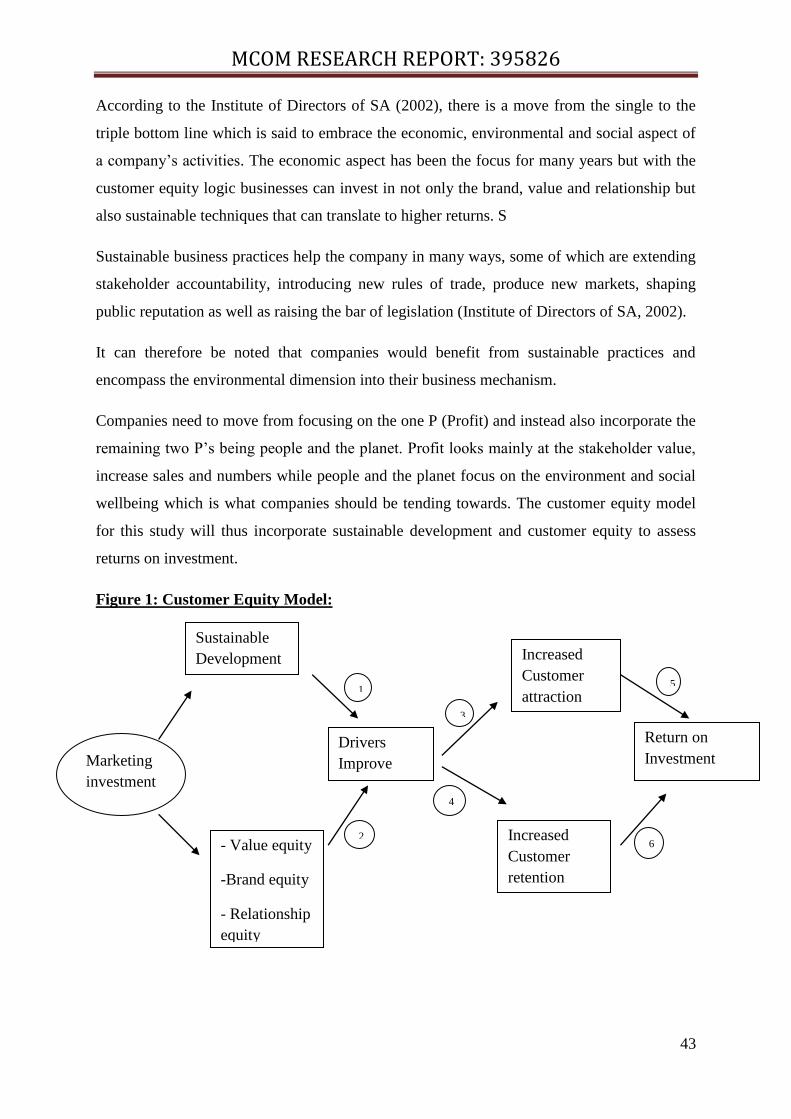
MCOM RESEARCH REPORT: 395826
43
According to the Institute of Directors of SA (2002), there is a move from the single to the
triple bottom line which is said to embrace the economic, environmental and social aspect of
a company‟s activities. The economic aspect has been the focus for many years but with the
customer equity logic businesses can invest in not only the brand, value and relationship but
also sustainable techniques that can translate to higher returns. S
Sustainable business practices help the company in many ways, some of which are extending
stakeholder accountability, introducing new rules of trade, produce new markets, shaping
public reputation as well as raising the bar of legislation (Institute of Directors of SA, 2002).
It can therefore be noted that companies would benefit from sustainable practices and
encompass the environmental dimension into their business mechanism.
Companies need to move from focusing on the one P (Profit) and instead also incorporate the
remaining two P‟s being people and the planet. Profit looks mainly at the stakeholder value,
increase sales and numbers while people and the planet focus on the environment and social
wellbeing which is what companies should be tending towards. The customer equity model
for this study will thus incorporate sustainable development and customer equity to assess
returns on investment.
Figure 1: Customer Equity Model:
mvbnffj
Marketing
investment
t
- Value equity
-Brand equity
- Relationship
equity
Drivers
Improve
Return on
Investment
Increased
Customer
retention
2
1
4
6
Sustainable
Development Increased
Customer
attraction 3
5
MCOM RESEARCH REPORT: 395826
44
The conceptual model for marketing return on investment considering sustainable
development is illustrated in figure 1 above. This model is based on the customer equity
framework which comprises of sustainable development theory where the dependent variable
is return on investment which depends on the type of strategy pursued, customer equity
drivers and cost of marketing investment as established by Rust et al. (2004). The customer
equity drivers of brand, relationship and value together with specific sustainable development
practices such as green marketing or CSR or cause related marketing can be assessed to
ensure returns on investment and make marketing more accountable.
As the aim of the research is to devise a model that combines marketing efforts on customer
equity with sustainable development, the following variables will be tested to determine if a
relationship exists and if return on investment can be modelled in an appropriate manner.
2.13 Sustainable Development
Attalla and Carrigan (2001) argue that corporate responsibility has little effect on customer‟s
purchase behaviour and provide a framework to assess the impact of a sustainable
development campaign. According to Ungerer et al (2007) being sustainably developed, is to
capture the whole set of values, issues and processes that companies must address in order to
minimize any harm resulting from their activities and create economic, social and
environmental value. This also involves being clear about the company‟s purpose and taking
into consideration the needs of all the company‟s stakeholders.
The present study will establish if a banks‟ corporate citizenship affects customer‟s intentions
and it is believed that the more a bank invests into campaigns that matter to customers the
more likely customer equity will improve. Through interviews and questionnaires, it will be
determined if customers take note of the sustainable development initiatives and if this
influences their buying behaviour and perceptions of the bank. Consequently, if they do take
note of these initiatives and it affects their banking behaviour then lessons can be learnt to
apply effective strategies. However, if these sustainable development investments are not
affecting the purchasing behaviour, these expenditures will not be accounted for.
The following hypotheses will be tested
H1: Sustainable development has a positive relationship with customer driver
improvement.
MCOM RESEARCH REPORT: 395826
45
If the banks investments on the national soccer league, habitat for humanity, green robots etc
create favour in the market then customer perceptions will change and they are likely to
switch to that bank or remain there if they are already customers. Similarly, if the perceptions
are negative, they are likely to leave and have no associations with the bank resulting in
lower driver improvement.
Value equity
Zeithaml (1988) established that value is a key link between the customer and the firm and
she defined value to be the firm‟s ability to meet the customer‟s needs and expectations in
terms of quality, price and convenience.
It will therefore be argued that a bank‟s goal should be to understand customer‟s expectations
and then to deliver on them before spending on initiatives that customer‟s do not care about.
If a customer does not perceive that the firm‟s products or services are providing value, any
marketing campaign, sustainable development project or loyalty program will have little
effect in retaining the customers.
H2a: There is a positive relationship between value equity and improved customer equity
drivers.
This means the more value a bank delivers to the customers, the higher the perceptions and
ratings of the bank from a customer‟s perspective.
Brand Equity
Aaker and Keller (1990) describe brand equity to represent the extent to which a firm
manages to influence a customer‟s subjective evaluation of the company‟s offerings and they
believe that if customers develop more favourable attitudes toward the brand; they are more
likely to purchase the brand. In the present study, it will be investigated how marketing
efforts improve customer‟s feelings towards the bank‟s brand. If customers have increased
positive feelings for the brand, they will be less likely to switch banks thereby increasing
customer retention.
H2b: Brand equity has a positive impact on customer equity drivers
This would mean the higher the brand equity, the more positive the perceptions of the bank.
MCOM RESEARCH REPORT: 395826
46
Relationship Equity
Vargo and Lusch (2004) highlight the need for building long term relationships with
customers whilst Getz and Thomas (2001) describe relationship equity to represent the
customer‟s view of the strength of the relationship between the customer and the firm.
With banking services, it is crucial to maintain good relationships with customers and this is
evident in the bank‟s commitments to informing customers and providing service to assist
customers in making decisions.
The present study will investigate the impact of investing in relationships and it is
hypothesised that the stronger the relationship the stronger the customer equity and hence the
higher the probability of higher returns on investment.
H2c: Relationship equity has a positive influence on customer equity drivers.
Customer attraction and customer retention
As Rust et al (2004) provide a framework for assessing customer equity driver improvements
(see appendix A), it is proposed that any driver improvements will increase retention for
customers that are already members of the bank and also attract other members from other
banks thereby causing switch.
H3: Increased driver improvements have a positive effect on customer attraction
H4: Increased driver improvements have a positive effect on customer retention
Return on investment
According to Berger and Nada (1998) the goal of ROI is to project how much a particular
driver will increase profits thereby recovering the initial investment. Rust et al (2004)
established that customer equity is driven by three pillars of relationship, brand and value
equity thus if all those improve perceptions of the bank and increase either retention and/or
attraction, there should be an increase in profits which enables the bank to also receive higher
returns on the investment.
MCOM RESEARCH REPORT: 395826
47
It is therefore hypothesised that:
H5: Increased customer attraction has a positive impact on marketing returns
H6: Increased customer retention has a positive impact on marketing returns
The model to be tested here will enable “what- if” evaluation of return on investment and this
can include such criteria as return on quality, return on advertising, return on loyalty
programs and return on corporate citizenship as well. Firms will be able to make accountable
decisions and trade off strategies to select those that are most effective in increasing the
returns and never have to invest in programs that do not improve their drivers of customer
equity.
MCOM RESEARCH REPORT: 395826
48
CHAPTER THREE: RESEARCH METHODS
This section details the research methodology that was followed for this study. This study is
an extension of Rust et al (2004), who used a customer equity model to estimate the value of
companies and gauge return on investment in the airline industry. The latest models in using
customer equity to do valuation of a firm were applied to the banking sector in South Africa
and the proposed model was utilised to achieve the research objectives
3.1 Research Design
Zikmund (2003), states that a research design is a master plan specifying the methods and
procedures for collecting and analysing the needed information. As the aim of the study is to
describe customer equity drivers, an exploratory design approach was used. Data sources that
were used were both primary and secondary. Primary data was collected from the banks and
the findings of the qualitative study enabled formulation of questions to be asked in the
quantitative study (a copy of the questionnaire is available in appendix A). The questions
revolved around the customer equity drivers and sustainable techniques as employed in the
Rust et al (2004) airline study. The exploratory approach allows the data collection to be both
quantitative and qualitative.
A total of 200 respondents were asked to respond to a series of structured questions. The
questionnaire was split into various sections covering customer equity management. A focus
group was conducted to investigate the elements that would contribute to banks‟ sustainable
development (focus group discussion available in appendix B).
3.2 Definition of the population
The population of this study comprised of all users of transactional accounts across industries
and banks in South Africa. The statistics from FNB indicate that the majority of this market is
the mass market thus this study focuses on them by drawing a sample from the mass market.
3.3 Sample plan
Sampling is any procedure that uses a small number of items or a portion of a population to
make conclusions regarding the whole population (Zikmund, 2003). A precondition for
sampling is that the selected sample has to be representative of the population under study in
order for the researcher to be able to make generalisations about the population of interest
(Zikmund, 2003).
MCOM RESEARCH REPORT: 395826
49
For the present study, a group of ten people falling into the mass market bracket (earning less
than R100 000/annum) were invited for a focus group discussion on their banking
experiences. The purpose of this focus group was to gain more insight into the sustainable
development component of the model in order to determine what drivers influence their
purchasing behaviour and ultimately influence return on marketing investments. The focus
group was facilitated by the researcher and a panel including the marketing manager of FNB
and two researchers from the University of the Witwatersrand. The discussion was
unstructured to allow the respondents to express their opinions on the banks corporate
responsibility initiatives and this enabled the researcher to design the questionnaire
appropriately.
The questionnaire was adopted from Rust et al (2004) study and two hundred mass market
consumers were sampled were 100 represented consumers that are currently banking with
FNB and 100 represented „other banks‟. A sample of the questionnaire is available in
appendix A.
Because the city of Johannesburg is a vast region with tremendous heterogeneity in the mass
market‟s ages and income brackets, there needs to be sufficient representation for the
segment in order to derive any suitable conclusions. Various income brackets and all the age
groups described above need representation as they live different lives and potentially hold
different values.
The sampling frame that was utilised is a systematic sampling technique that used a chance
selection process.
For the quantitative analysis, the researcher distributed questionnaires to every tenth person
they met outside various FNB, ABSA and Capitec branches around Johannesburg shopping
malls (North Gate, South Gate, Braamfontein, West gate and East gate).
To ensure representation and avoid location biased results, the researchers distributed to
various branches around Johannesburg until the target of 200 questionnaires was reached.
MCOM RESEARCH REPORT: 395826
50
3.3.1 Data Collection
Printed surveys were distributed to every tenth respondent and the researcher was present to
assist the respondent when needed in filling out the questionnaire. The questionnaire was
divided into four parts, brand switching, value related drivers, brand related drivers and
relationship related drivers respectively. The brand switching and CLV questions were placed
in the beginning as accurate answers are required for these in order to derive the customer
lifetime value as required in the model to test customer equity. Placing them at the beginning
of the questionnaire enabled the researchers to capture the respondent‟s perceptions before
fatigue sets in and to arouse interest for the respondent because authors like Malhotra (2006)
have criticised use of demographics in the beginning as they believe this tends to bore the
respondent.
3.3.2 Data Collection Instrument
The period of data collection lasted from12 March to 02 April 2011 and a questionnaire was
employed to collect the information.
A pre-test study was conducted to determine if respondents would be able to understand the
process and the questions and to time how long it takes to complete the questionnaire. The
questionnaire was set out in such ways that ensured completion and maintained interest of the
respondent to avoid causing boredom and fatigue.
It was also set to provide responses on each of the elements of customer equity (value, brand
and relationship) and sustainable development in order to test the model appropriately.
English was employed as the main medium in the questionnaire. However, in the focus
group, the researchers were available to interpret in the vernacular where respondents
required clarification. This was done to reduce bias in the form of non-response, since
English is widely understood across tribes in South Africa and therefore it is the best option.
3.4 Nonsampling error reduction
Bush and Burns (2006) define non-sampling error as all errors in a survey except those due to
the sample plan and the sample size. Essentially, non-sampling errors can be committed by
fieldworkers and respondents. In order to reduce these errors, the study employed a number
of techniques for each type of nonsampling error. These are discussed below.
MCOM RESEARCH REPORT: 395826
51
Intentional fieldwork errors
These include errors such as cheating or leading the respondents to reply in a certain way. To
avoid this, the study divided the researchers into teams where two people work together in a
specific area instead of one researcher working alone.
Unintentional fieldwork errors
These are errors that can occur when an interviewer believes he or she knows how to
administer the survey and thereby causes misunderstandings or errors as a result of fatigue.
Burns et al. (2006) recommend that it is best to train interviewers beforehand and allow for
breaks in between sessions. Unfortunately, due to time constraints, training did not take place
and thus unintentional fieldwork errors were not controlled.
Intentional respondent errors
Such errors comprise of falsehoods and non-response. To cater for this, the team provided
incentives in the form of coffee mugs and pens and each research pair consisted of one person
who speaks the mother tongue of this respondent. This was to ensure that respondents felt
comfortable to discuss issues with the team.
Unintentional respondent errors
These could occur as a result of misunderstandings; guessing; attention loss and distractions.
Researchers obtained permission from the managers of the respondents to avoid distractions
and provide the comfort of knowing that they have been excused from their jobs for a few
minutes. Additionally, a simple questionnaire with direct questions was employed to ensure
that respondents do not lose attention or misunderstand the requirements of the question.
3.5 Questionnaire and scale development
3.5.1 Construct Validity
Essentially, construct validity tests whether a specific construct measures what it is meant to
(Peter 1981). This must be tested in order to test for validity in a South African setting as the
customer equity framework was created in the United States by Rust et al (2004). It thus
essential when testing theory and to assess validity, Burns et al (2006) advise that convergent
validity, discriminant validity and nomoligical validity can also be assessed. Exploratory
factor analysis was used to establish validity for the present study.
MCOM RESEARCH REPORT: 395826
52
3.5.2 Reliability
According to Malhotra (2006), reliability tests are conducted to ensure the consistency of
scales across time periods in order to assure that scales can be used at any time. This study
will assess reliability by calculating Cronbach‟s alpha for all scaled questions to gauge the
stability of all scaled questions.
In essence, the study will assess both construct validity (using factor analysis) and it will also
check the reliability of all of the scales using cronbach‟s alpha. An adequate cronbach‟s alpha
should not be below 0.70 (Hair et al, 1998). These tests are fundamental as all the scales are
imported thus their application to a heterogeneous setting like South Africa should result in a
different outcome.
3.6 Analysis Technique
For the qualitative section of sustainable development, the researchers sought help from the
bank‟s management and used experienced facilitators to draw conclusions relating to the
sustainable development component of the model. For the quantitative section, two computer
packages were utilised in the analysis, namely, SAS Enterprise guide and SPSS. This was
done to take advantage of the strengths of these packages in performing multivariate
statistics, correlations and reliability tests as outlined in the analysis section.
According to Zikmund (2003), among the statistical tests is t-test (or t-test) for a hypothesis
about a mean, product-moment correlation analysis, and analysis of variance tests. The t-test
may be used to test a hypothesis stating that the mean scores on some variable will be
significantly different for two independent samples or groups. T-test is used when the sample
size is small i.e. 30 or less, and the population standard deviation is unknown.
Zikmund (2003) continues to say that if the standard deviation is unknown but the number of
observations in both groups is large, the appropriate test of mean differences between two
groups is a z-test rather than a t-test. The z-test statistical procedure is identical to the t-test
procedure. These tests were applied in some instances.
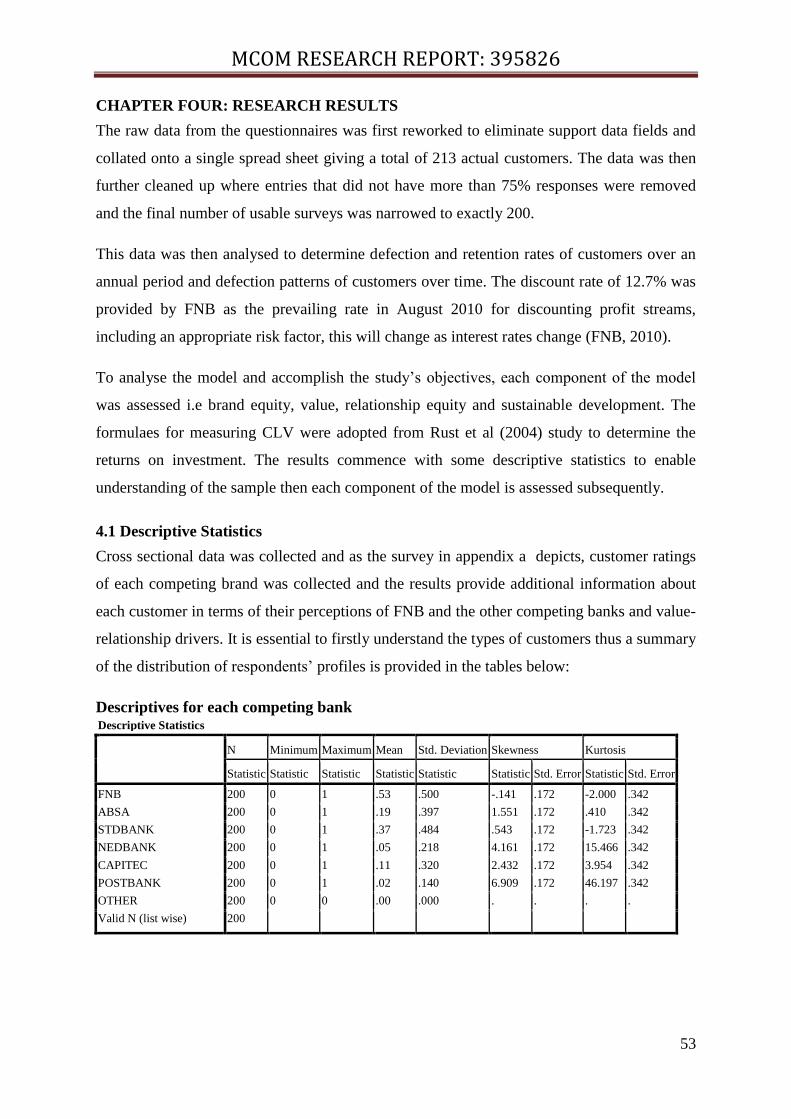
MCOM RESEARCH REPORT: 395826
53
CHAPTER FOUR: RESEARCH RESULTS
The raw data from the questionnaires was first reworked to eliminate support data fields and
collated onto a single spread sheet giving a total of 213 actual customers. The data was then
further cleaned up where entries that did not have more than 75% responses were removed
and the final number of usable surveys was narrowed to exactly 200.
This data was then analysed to determine defection and retention rates of customers over an
annual period and defection patterns of customers over time. The discount rate of 12.7% was
provided by FNB as the prevailing rate in August 2010 for discounting profit streams,
including an appropriate risk factor, this will change as interest rates change (FNB, 2010).
To analyse the model and accomplish the study‟s objectives, each component of the model
was assessed i.e brand equity, value, relationship equity and sustainable development. The
formulaes for measuring CLV were adopted from Rust et al (2004) study to determine the
returns on investment. The results commence with some descriptive statistics to enable
understanding of the sample then each component of the model is assessed subsequently.
4.1 Descriptive Statistics
Cross sectional data was collected and as the survey in appendix a depicts, customer ratings
of each competing brand was collected and the results provide additional information about
each customer in terms of their perceptions of FNB and the other competing banks and value-
relationship drivers. It is essential to firstly understand the types of customers thus a summary
of the distribution of respondents‟ profiles is provided in the tables below:
Descriptives for each competing bank Descriptive Statistics
N Minimum Maximum Mean Std. Deviation Skewness Kurtosis
Statistic Statistic Statistic Statistic Statistic Statistic Std. Error Statistic Std. Error
FNB 200 0 1 .53 .500 -.141 .172 -2.000 .342
ABSA 200 0 1 .19 .397 1.551 .172 .410 .342
STDBANK 200 0 1 .37 .484 .543 .172 -1.723 .342
NEDBANK 200 0 1 .05 .218 4.161 .172 15.466 .342
CAPITEC 200 0 1 .11 .320 2.432 .172 3.954 .342
POSTBANK 200 0 1 .02 .140 6.909 .172 46.197 .342
OTHER 200 0 0 .00 .000 . . . .
Valid N (list wise) 200
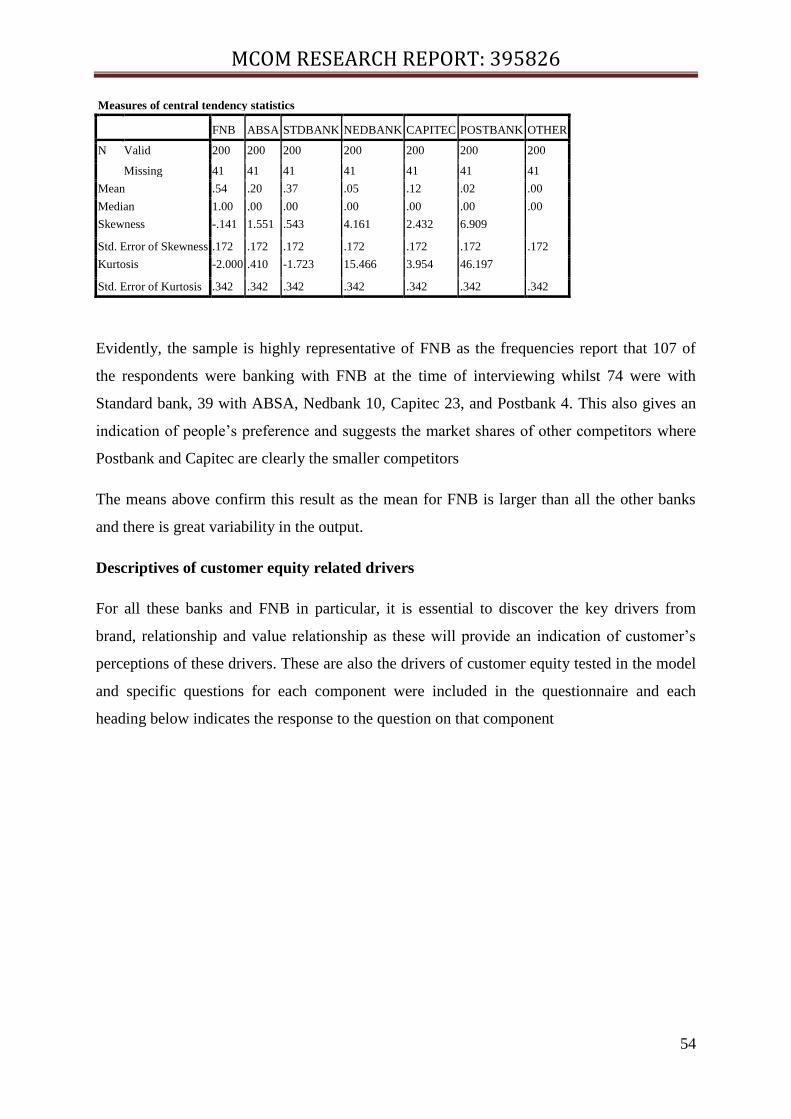
MCOM RESEARCH REPORT: 395826
54
Measures of central tendency statistics
FNB ABSA STDBANK NEDBANK CAPITEC POSTBANK OTHER
N Valid 200 200 200 200 200 200 200
Missing 41 41 41 41 41 41 41
Mean .54 .20 .37 .05 .12 .02 .00
Median 1.00 .00 .00 .00 .00 .00 .00
Skewness -.141 1.551 .543 4.161 2.432 6.909
Std. Error of Skewness .172 .172 .172 .172 .172 .172 .172
Kurtosis -2.000 .410 -1.723 15.466 3.954 46.197
Std. Error of Kurtosis .342 .342 .342 .342 .342 .342 .342
Evidently, the sample is highly representative of FNB as the frequencies report that 107 of
the respondents were banking with FNB at the time of interviewing whilst 74 were with
Standard bank, 39 with ABSA, Nedbank 10, Capitec 23, and Postbank 4. This also gives an
indication of people‟s preference and suggests the market shares of other competitors where
Postbank and Capitec are clearly the smaller competitors
The means above confirm this result as the mean for FNB is larger than all the other banks
and there is great variability in the output.
Descriptives of customer equity related drivers
For all these banks and FNB in particular, it is essential to discover the key drivers from
brand, relationship and value relationship as these will provide an indication of customer‟s
perceptions of these drivers. These are also the drivers of customer equity tested in the model
and specific questions for each component were included in the questionnaire and each
heading below indicates the response to the question on that component
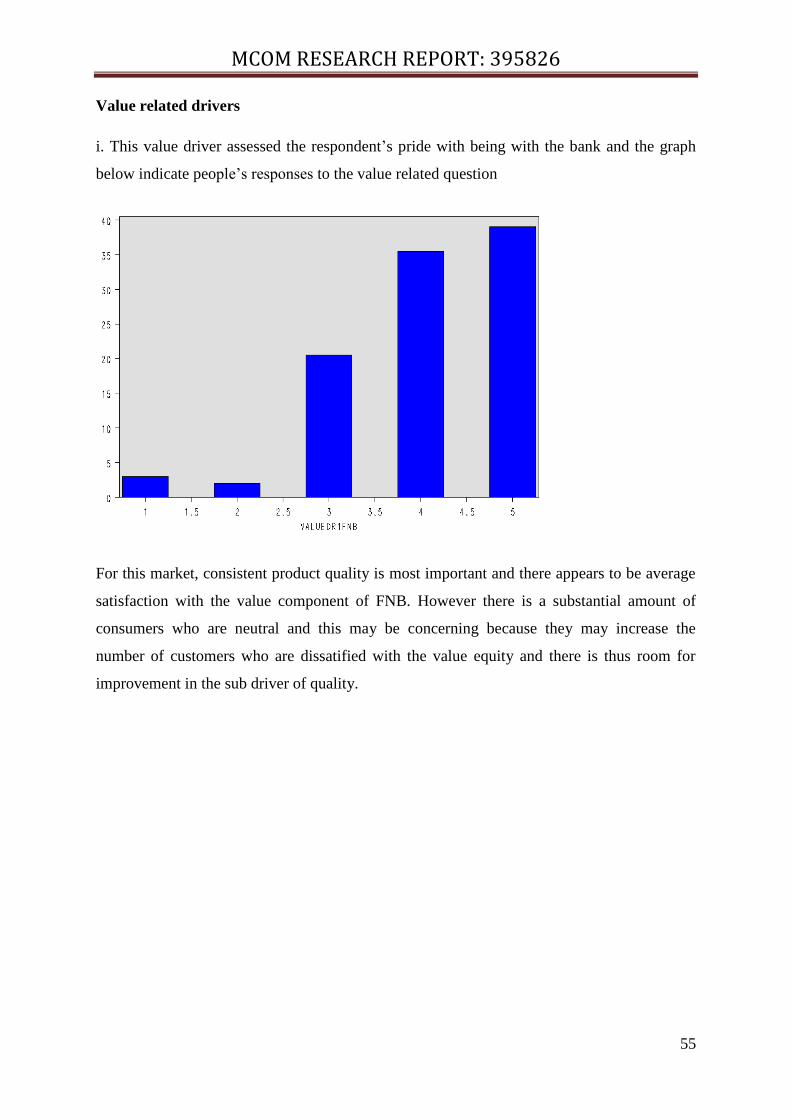
MCOM RESEARCH REPORT: 395826
55
Value related drivers
i. This value driver assessed the respondent‟s pride with being with the bank and the graph
below indicate people‟s responses to the value related question
For this market, consistent product quality is most important and there appears to be average
satisfaction with the value component of FNB. However there is a substantial amount of
consumers who are neutral and this may be concerning because they may increase the
number of customers who are dissatified with the value equity and there is thus room for
improvement in the sub driver of quality.
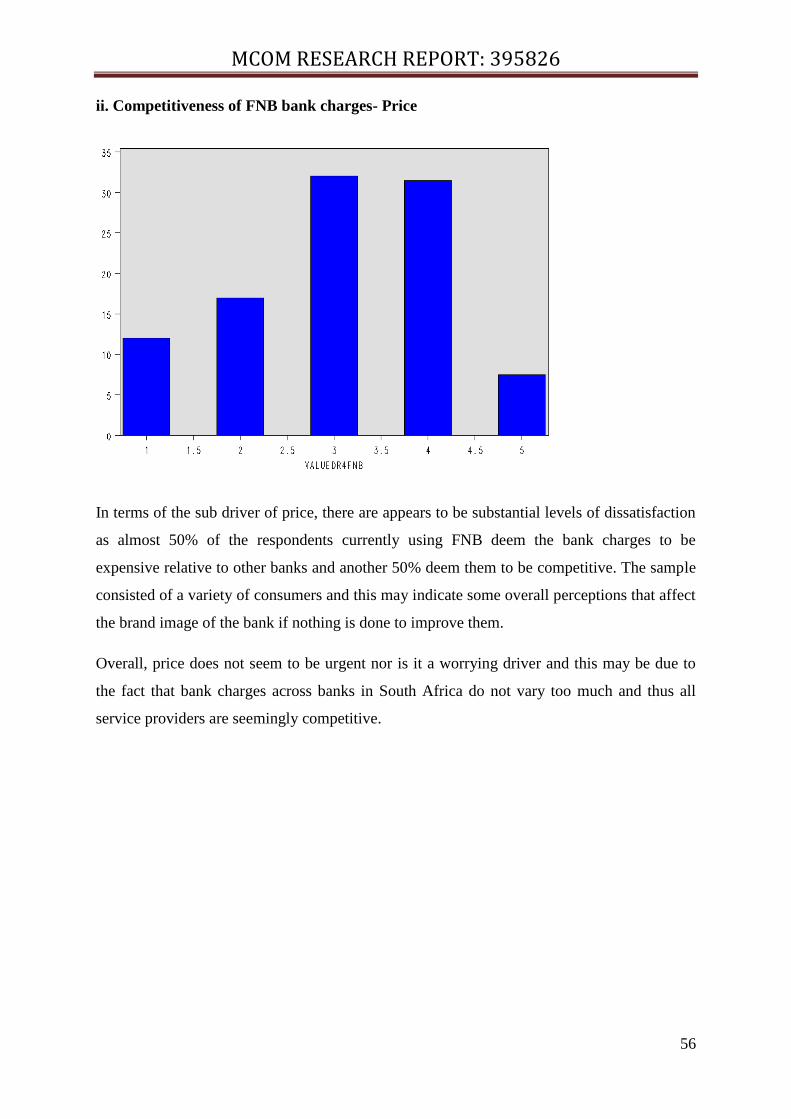
MCOM RESEARCH REPORT: 395826
56
ii. Competitiveness of FNB bank charges- Price
In terms of the sub driver of price, there are appears to be substantial levels of dissatisfaction
as almost 50% of the respondents currently using FNB deem the bank charges to be
expensive relative to other banks and another 50% deem them to be competitive. The sample
consisted of a variety of consumers and this may indicate some overall perceptions that affect
the brand image of the bank if nothing is done to improve them.
Overall, price does not seem to be urgent nor is it a worrying driver and this may be due to
the fact that bank charges across banks in South Africa do not vary too much and thus all
service providers are seemingly competitive.
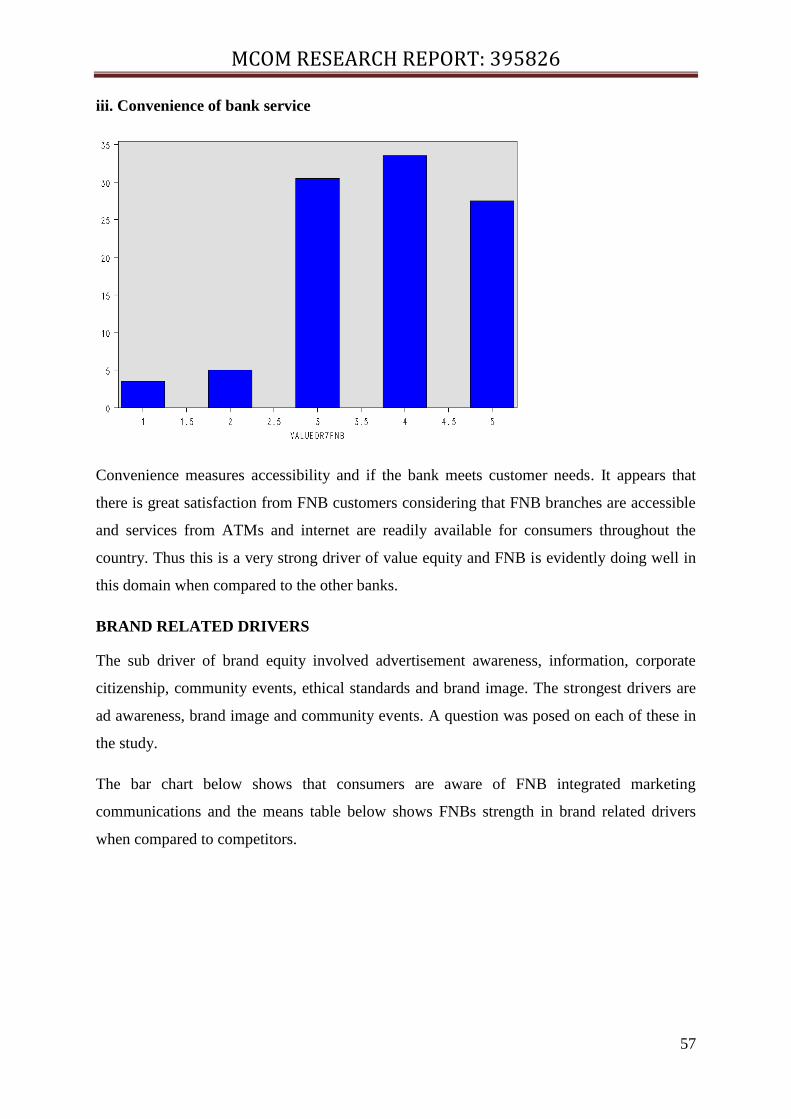
MCOM RESEARCH REPORT: 395826
57
iii. Convenience of bank service
Convenience measures accessibility and if the bank meets customer needs. It appears that
there is great satisfaction from FNB customers considering that FNB branches are accessible
and services from ATMs and internet are readily available for consumers throughout the
country. Thus this is a very strong driver of value equity and FNB is evidently doing well in
this domain when compared to the other banks.
BRAND RELATED DRIVERS
The sub driver of brand equity involved advertisement awareness, information, corporate
citizenship, community events, ethical standards and brand image. The strongest drivers are
ad awareness, brand image and community events. A question was posed on each of these in
the study.
The bar chart below shows that consumers are aware of FNB integrated marketing
communications and the means table below shows FNBs strength in brand related drivers
when compared to competitors.
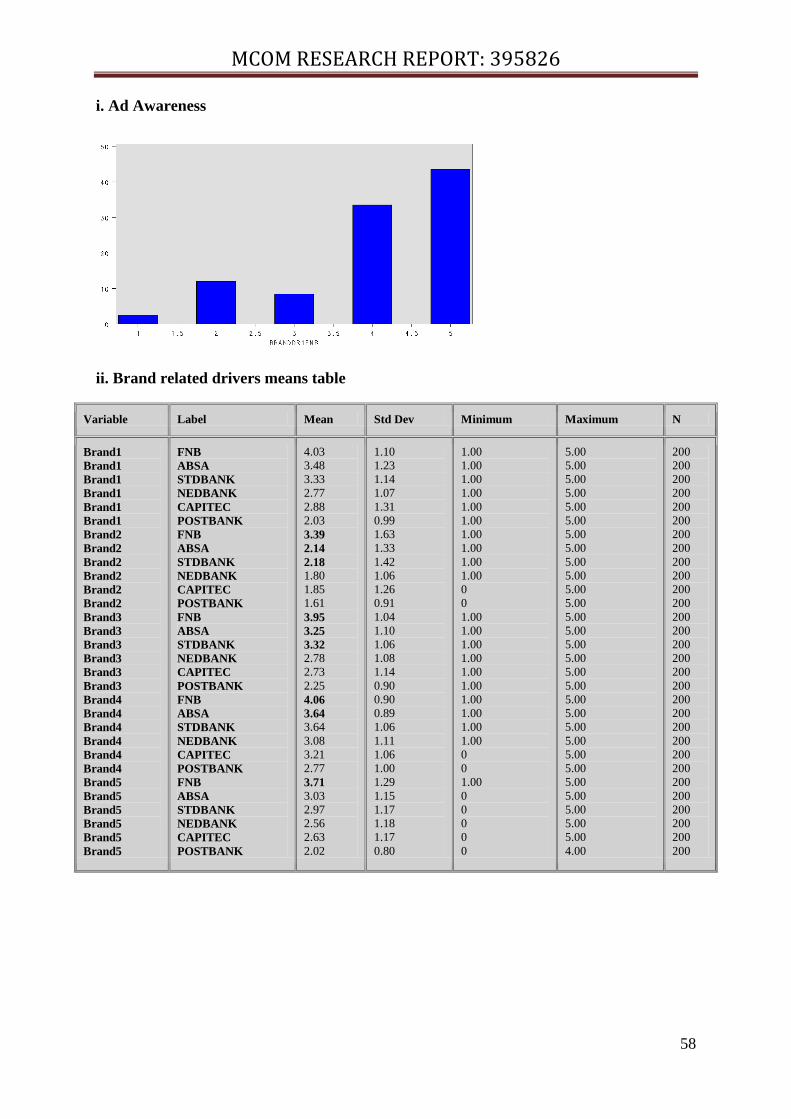
MCOM RESEARCH REPORT: 395826
58
i. Ad Awareness
ii. Brand related drivers means table
Variable Label Mean Std Dev Minimum Maximum N
Brand1
Brand1
Brand1
Brand1
Brand1
Brand1
Brand2
Brand2
Brand2
Brand2
Brand2
Brand2
Brand3
Brand3
Brand3
Brand3
Brand3
Brand3
Brand4
Brand4
Brand4
Brand4
Brand4
Brand4
Brand5
Brand5
Brand5
Brand5
Brand5
Brand5
FNB
ABSA
STDBANK
NEDBANK
CAPITEC
POSTBANK
FNB
ABSA
STDBANK
NEDBANK
CAPITEC
POSTBANK
FNB
ABSA
STDBANK
NEDBANK
CAPITEC
POSTBANK
FNB
ABSA
STDBANK
NEDBANK
CAPITEC
POSTBANK
FNB
ABSA
STDBANK
NEDBANK
CAPITEC
POSTBANK
4.03
3.48
3.33
2.77
2.88
2.03
3.39
2.14
2.18 1.80
1.85
1.61
3.95
3.25
3.32 2.78
2.73
2.25
4.06
3.64 3.64
3.08
3.21
2.77
3.71 3.03
2.97
2.56
2.63
2.02
1.10
1.23
1.14
1.07
1.31
0.99
1.63
1.33
1.42
1.06
1.26
0.91
1.04
1.10
1.06
1.08
1.14
0.90
0.90
0.89
1.06
1.11
1.06
1.00
1.29
1.15
1.17
1.18
1.17
0.80
1.00
1.00
1.00
1.00
1.00
1.00
1.00
1.00
1.00
1.00
0
0
1.00
1.00
1.00
1.00
1.00
1.00
1.00
1.00
1.00
1.00
0
0
1.00
0
0
0
0
0
5.00
5.00
5.00
5.00
5.00
5.00
5.00
5.00
5.00
5.00
5.00
5.00
5.00
5.00
5.00
5.00
5.00
5.00
5.00
5.00
5.00
5.00
5.00
5.00
5.00
5.00
5.00
5.00
5.00
4.00
200
200
200
200
200
200
200
200
200
200
200
200
200
200
200
200
200
200
200
200
200
200
200
200
200
200
200
200
200
200
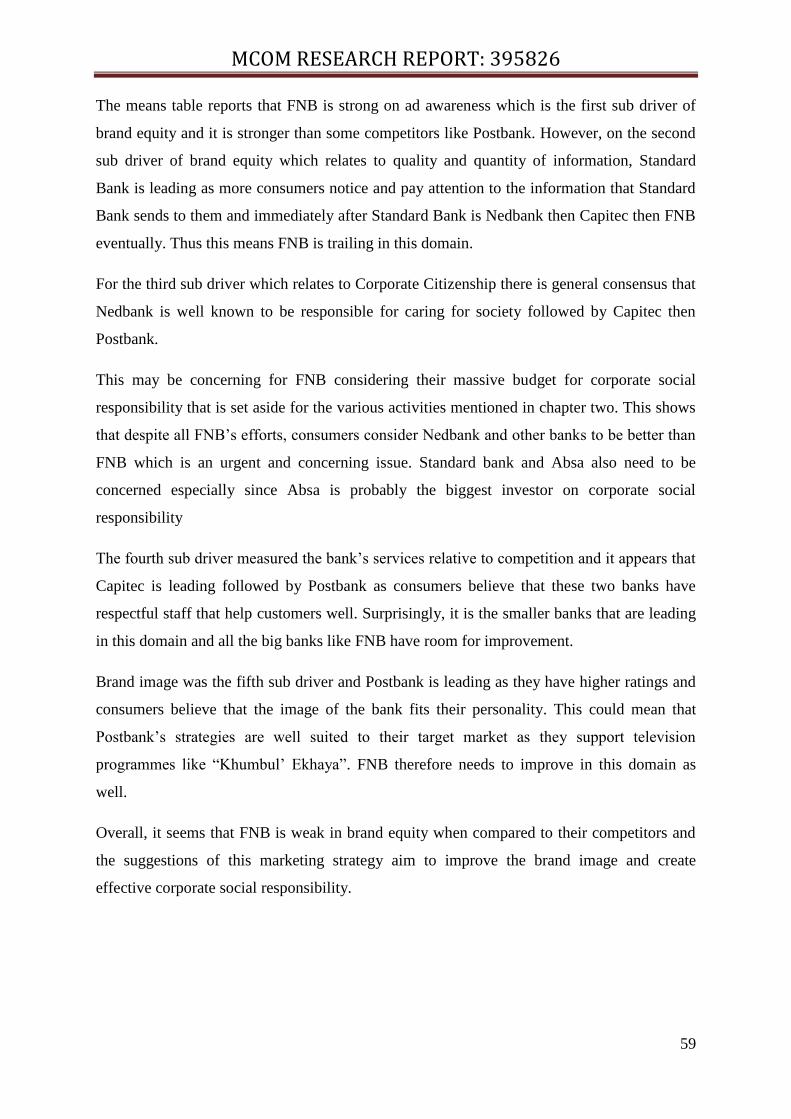
MCOM RESEARCH REPORT: 395826
59
The means table reports that FNB is strong on ad awareness which is the first sub driver of
brand equity and it is stronger than some competitors like Postbank. However, on the second
sub driver of brand equity which relates to quality and quantity of information, Standard
Bank is leading as more consumers notice and pay attention to the information that Standard
Bank sends to them and immediately after Standard Bank is Nedbank then Capitec then FNB
eventually. Thus this means FNB is trailing in this domain.
For the third sub driver which relates to Corporate Citizenship there is general consensus that
Nedbank is well known to be responsible for caring for society followed by Capitec then
Postbank.
This may be concerning for FNB considering their massive budget for corporate social
responsibility that is set aside for the various activities mentioned in chapter two. This shows
that despite all FNB‟s efforts, consumers consider Nedbank and other banks to be better than
FNB which is an urgent and concerning issue. Standard bank and Absa also need to be
concerned especially since Absa is probably the biggest investor on corporate social
responsibility
The fourth sub driver measured the bank‟s services relative to competition and it appears that
Capitec is leading followed by Postbank as consumers believe that these two banks have
respectful staff that help customers well. Surprisingly, it is the smaller banks that are leading
in this domain and all the big banks like FNB have room for improvement.
Brand image was the fifth sub driver and Postbank is leading as they have higher ratings and
consumers believe that the image of the bank fits their personality. This could mean that
Postbank‟s strategies are well suited to their target market as they support television
programmes like “Khumbul‟ Ekhaya”. FNB therefore needs to improve in this domain as
well.
Overall, it seems that FNB is weak in brand equity when compared to their competitors and
the suggestions of this marketing strategy aim to improve the brand image and create
effective corporate social responsibility.
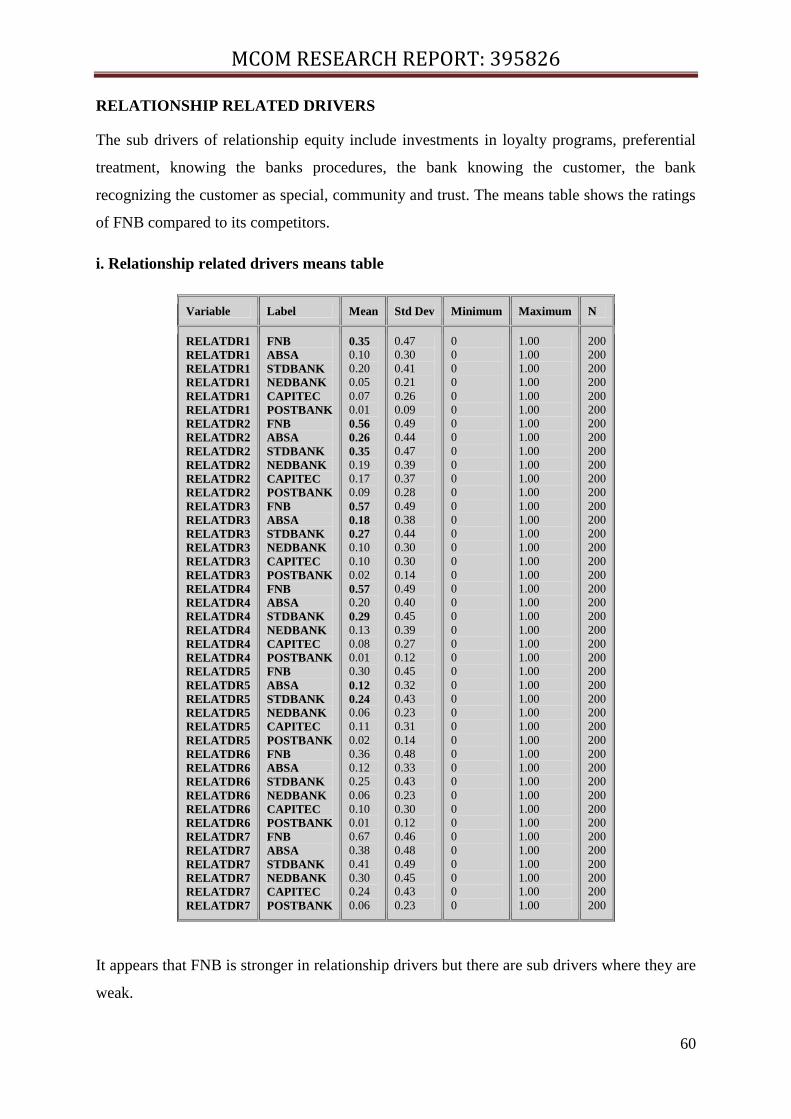
MCOM RESEARCH REPORT: 395826
60
RELATIONSHIP RELATED DRIVERS
The sub drivers of relationship equity include investments in loyalty programs, preferential
treatment, knowing the banks procedures, the bank knowing the customer, the bank
recognizing the customer as special, community and trust. The means table shows the ratings
of FNB compared to its competitors.
i. Relationship related drivers means table
Variable Label Mean Std Dev Minimum Maximum N
RELATDR1
RELATDR1
RELATDR1
RELATDR1
RELATDR1
RELATDR1
RELATDR2
RELATDR2
RELATDR2
RELATDR2
RELATDR2
RELATDR2
RELATDR3
RELATDR3
RELATDR3
RELATDR3
RELATDR3
RELATDR3
RELATDR4
RELATDR4
RELATDR4
RELATDR4
RELATDR4
RELATDR4
RELATDR5
RELATDR5
RELATDR5
RELATDR5
RELATDR5
RELATDR5
RELATDR6
RELATDR6
RELATDR6
RELATDR6
RELATDR6
RELATDR6
RELATDR7
RELATDR7
RELATDR7
RELATDR7
RELATDR7
RELATDR7
FNB
ABSA
STDBANK
NEDBANK
CAPITEC
POSTBANK
FNB
ABSA
STDBANK
NEDBANK
CAPITEC
POSTBANK
FNB
ABSA
STDBANK
NEDBANK
CAPITEC
POSTBANK
FNB
ABSA
STDBANK
NEDBANK
CAPITEC
POSTBANK
FNB
ABSA
STDBANK
NEDBANK
CAPITEC
POSTBANK
FNB
ABSA
STDBANK
NEDBANK
CAPITEC
POSTBANK
FNB
ABSA
STDBANK
NEDBANK
CAPITEC
POSTBANK
0.35 0.10
0.20
0.05
0.07
0.01
0.56
0.26
0.35 0.19
0.17
0.09
0.57
0.18
0.27 0.10
0.10
0.02
0.57 0.20
0.29 0.13
0.08
0.01
0.30
0.12
0.24 0.06
0.11
0.02
0.36
0.12
0.25
0.06
0.10
0.01
0.67
0.38
0.41
0.30
0.24
0.06
0.47
0.30
0.41
0.21
0.26
0.09
0.49
0.44
0.47
0.39
0.37
0.28
0.49
0.38
0.44
0.30
0.30
0.14
0.49
0.40
0.45
0.39
0.27
0.12
0.45
0.32
0.43
0.23
0.31
0.14
0.48
0.33
0.43
0.23
0.30
0.12
0.46
0.48
0.49
0.45
0.43
0.23
0
0
0
0
0
0
0
0
0
0
0
0
0
0
0
0
0
0
0
0
0
0
0
0
0
0
0
0
0
0
0
0
0
0
0
0
0
0
0
0
0
0
1.00
1.00
1.00
1.00
1.00
1.00
1.00
1.00
1.00
1.00
1.00
1.00
1.00
1.00
1.00
1.00
1.00
1.00
1.00
1.00
1.00
1.00
1.00
1.00
1.00
1.00
1.00
1.00
1.00
1.00
1.00
1.00
1.00
1.00
1.00
1.00
1.00
1.00
1.00
1.00
1.00
1.00
200
200
200
200
200
200
200
200
200
200
200
200
200
200
200
200
200
200
200
200
200
200
200
200
200
200
200
200
200
200
200
200
200
200
200
200
200
200
200
200
200
200
It appears that FNB is stronger in relationship drivers but there are sub drivers where they are
weak.
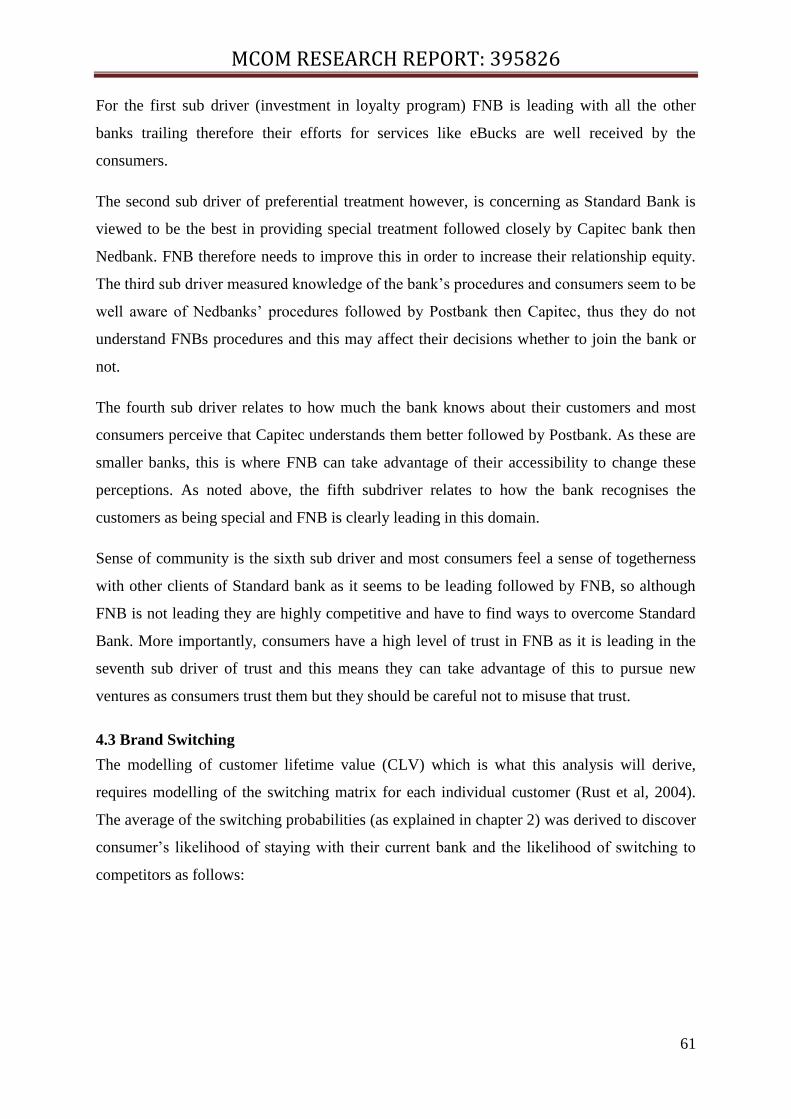
MCOM RESEARCH REPORT: 395826
61
For the first sub driver (investment in loyalty program) FNB is leading with all the other
banks trailing therefore their efforts for services like eBucks are well received by the
consumers.
The second sub driver of preferential treatment however, is concerning as Standard Bank is
viewed to be the best in providing special treatment followed closely by Capitec bank then
Nedbank. FNB therefore needs to improve this in order to increase their relationship equity.
The third sub driver measured knowledge of the bank‟s procedures and consumers seem to be
well aware of Nedbanks‟ procedures followed by Postbank then Capitec, thus they do not
understand FNBs procedures and this may affect their decisions whether to join the bank or
not.
The fourth sub driver relates to how much the bank knows about their customers and most
consumers perceive that Capitec understands them better followed by Postbank. As these are
smaller banks, this is where FNB can take advantage of their accessibility to change these
perceptions. As noted above, the fifth subdriver relates to how the bank recognises the
customers as being special and FNB is clearly leading in this domain.
Sense of community is the sixth sub driver and most consumers feel a sense of togetherness
with other clients of Standard bank as it seems to be leading followed by FNB, so although
FNB is not leading they are highly competitive and have to find ways to overcome Standard
Bank. More importantly, consumers have a high level of trust in FNB as it is leading in the
seventh sub driver of trust and this means they can take advantage of this to pursue new
ventures as consumers trust them but they should be careful not to misuse that trust.
4.3 Brand Switching
The modelling of customer lifetime value (CLV) which is what this analysis will derive,
requires modelling of the switching matrix for each individual customer (Rust et al, 2004).
The average of the switching probabilities (as explained in chapter 2) was derived to discover
consumer‟s likelihood of staying with their current bank and the likelihood of switching to
competitors as follows:
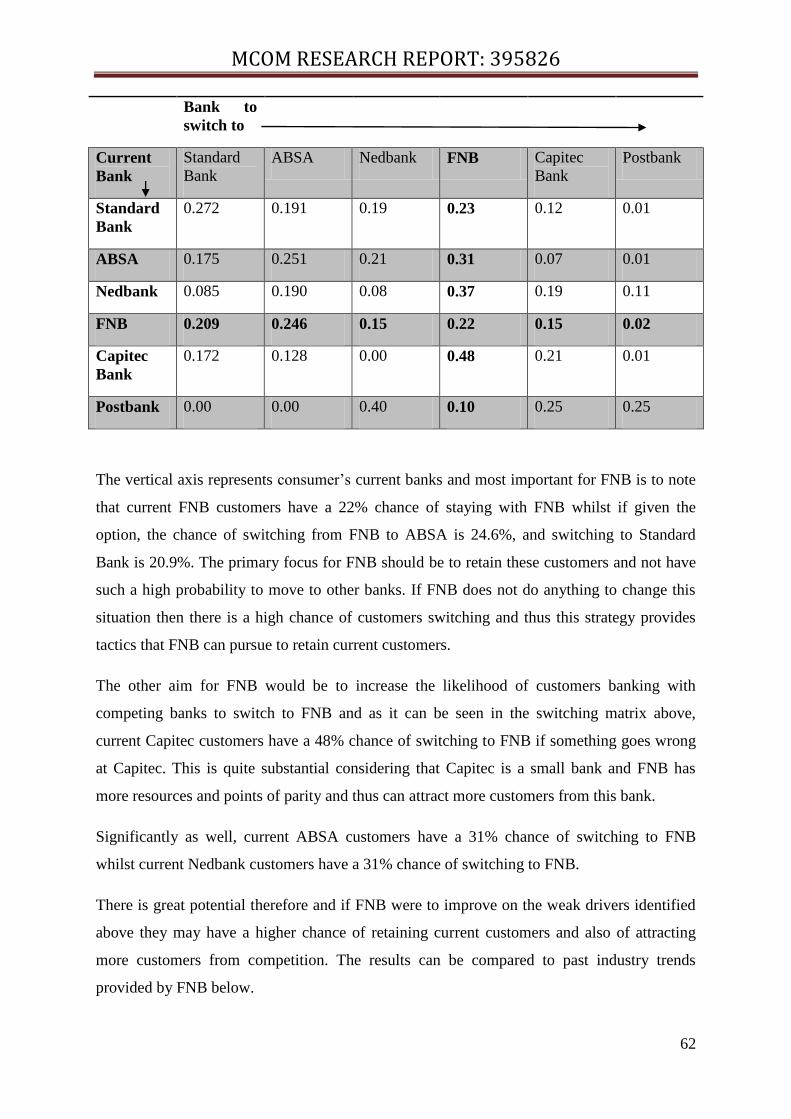
MCOM RESEARCH REPORT: 395826
62
Bank to
switch to
Current
Bank
Standard
Bank
ABSA Nedbank FNB Capitec
Bank
Postbank
Standard
Bank
0.272 0.191 0.19 0.23 0.12 0.01
ABSA 0.175 0.251 0.21 0.31 0.07 0.01
Nedbank 0.085 0.190 0.08 0.37 0.19 0.11
FNB 0.209 0.246 0.15 0.22 0.15 0.02
Capitec
Bank
0.172 0.128 0.00 0.48 0.21 0.01
Postbank 0.00 0.00 0.40 0.10 0.25 0.25
The vertical axis represents consumer‟s current banks and most important for FNB is to note
that current FNB customers have a 22% chance of staying with FNB whilst if given the
option, the chance of switching from FNB to ABSA is 24.6%, and switching to Standard
Bank is 20.9%. The primary focus for FNB should be to retain these customers and not have
such a high probability to move to other banks. If FNB does not do anything to change this
situation then there is a high chance of customers switching and thus this strategy provides
tactics that FNB can pursue to retain current customers.
The other aim for FNB would be to increase the likelihood of customers banking with
competing banks to switch to FNB and as it can be seen in the switching matrix above,
current Capitec customers have a 48% chance of switching to FNB if something goes wrong
at Capitec. This is quite substantial considering that Capitec is a small bank and FNB has
more resources and points of parity and thus can attract more customers from this bank.
Significantly as well, current ABSA customers have a 31% chance of switching to FNB
whilst current Nedbank customers have a 31% chance of switching to FNB.
There is great potential therefore and if FNB were to improve on the weak drivers identified
above they may have a higher chance of retaining current customers and also of attracting
more customers from competition. The results can be compared to past industry trends
provided by FNB below.
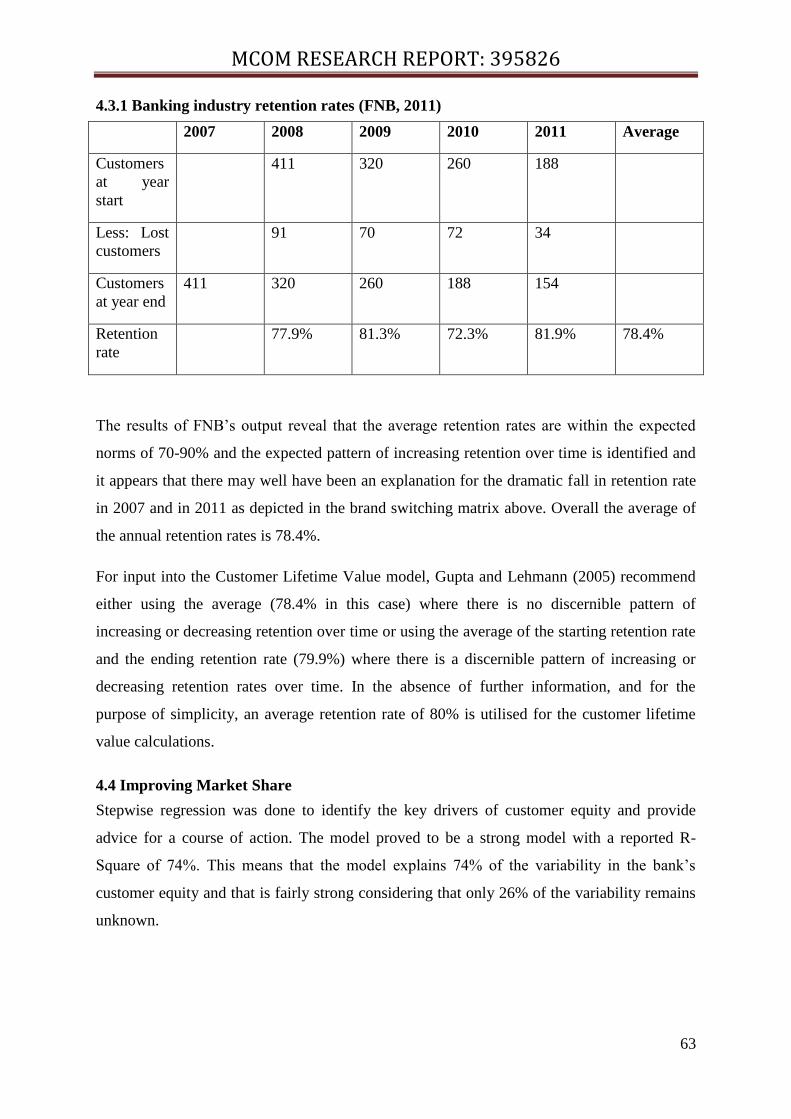
MCOM RESEARCH REPORT: 395826
63
4.3.1 Banking industry retention rates (FNB, 2011)
2007 2008 2009 2010 2011 Average
Customers
at year
start
411 320 260 188
Less: Lost
customers
91 70 72 34
Customers
at year end
411 320 260 188 154
Retention
rate
77.9% 81.3% 72.3% 81.9% 78.4%
The results of FNB‟s output reveal that the average retention rates are within the expected
norms of 70-90% and the expected pattern of increasing retention over time is identified and
it appears that there may well have been an explanation for the dramatic fall in retention rate
in 2007 and in 2011 as depicted in the brand switching matrix above. Overall the average of
the annual retention rates is 78.4%.
For input into the Customer Lifetime Value model, Gupta and Lehmann (2005) recommend
either using the average (78.4% in this case) where there is no discernible pattern of
increasing or decreasing retention over time or using the average of the starting retention rate
and the ending retention rate (79.9%) where there is a discernible pattern of increasing or
decreasing retention rates over time. In the absence of further information, and for the
purpose of simplicity, an average retention rate of 80% is utilised for the customer lifetime
value calculations.
4.4 Improving Market Share
Stepwise regression was done to identify the key drivers of customer equity and provide
advice for a course of action. The model proved to be a strong model with a reported R-
Square of 74%. This means that the model explains 74% of the variability in the bank‟s
customer equity and that is fairly strong considering that only 26% of the variability remains
unknown.
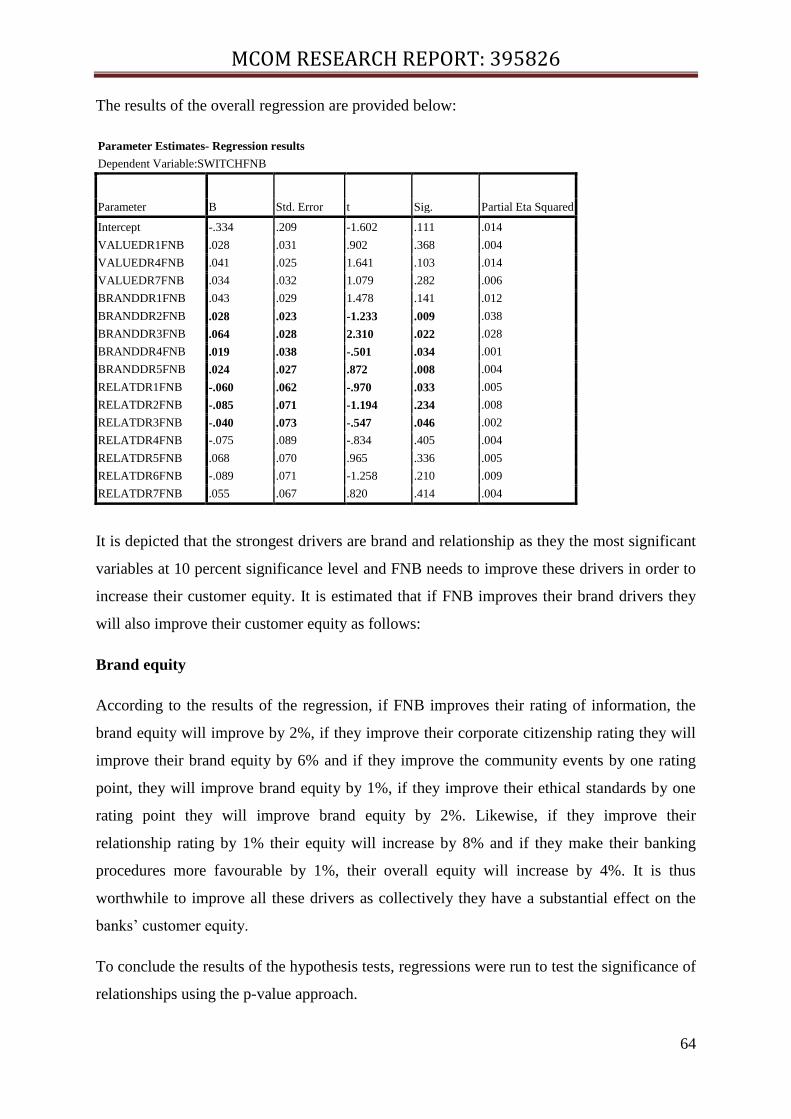
MCOM RESEARCH REPORT: 395826
64
The results of the overall regression are provided below:
Parameter Estimates- Regression results
Dependent Variable:SWITCHFNB
Parameter B Std. Error t Sig. Partial Eta Squared
Intercept -.334 .209 -1.602 .111 .014
VALUEDR1FNB .028 .031 .902 .368 .004
VALUEDR4FNB .041 .025 1.641 .103 .014
VALUEDR7FNB .034 .032 1.079 .282 .006
BRANDDR1FNB .043 .029 1.478 .141 .012
BRANDDR2FNB .028 .023 -1.233 .009 .038
BRANDDR3FNB .064 .028 2.310 .022 .028
BRANDDR4FNB .019 .038 -.501 .034 .001
BRANDDR5FNB .024 .027 .872 .008 .004
RELATDR1FNB -.060 .062 -.970 .033 .005
RELATDR2FNB -.085 .071 -1.194 .234 .008
RELATDR3FNB -.040 .073 -.547 .046 .002
RELATDR4FNB -.075 .089 -.834 .405 .004
RELATDR5FNB .068 .070 .965 .336 .005
RELATDR6FNB -.089 .071 -1.258 .210 .009
RELATDR7FNB .055 .067 .820 .414 .004
It is depicted that the strongest drivers are brand and relationship as they the most significant
variables at 10 percent significance level and FNB needs to improve these drivers in order to
increase their customer equity. It is estimated that if FNB improves their brand drivers they
will also improve their customer equity as follows:
Brand equity
According to the results of the regression, if FNB improves their rating of information, the
brand equity will improve by 2%, if they improve their corporate citizenship rating they will
improve their brand equity by 6% and if they improve the community events by one rating
point, they will improve brand equity by 1%, if they improve their ethical standards by one
rating point they will improve brand equity by 2%. Likewise, if they improve their
relationship rating by 1% their equity will increase by 8% and if they make their banking
procedures more favourable by 1%, their overall equity will increase by 4%. It is thus
worthwhile to improve all these drivers as collectively they have a substantial effect on the
banks‟ customer equity.
To conclude the results of the hypothesis tests, regressions were run to test the significance of
relationships using the p-value approach.
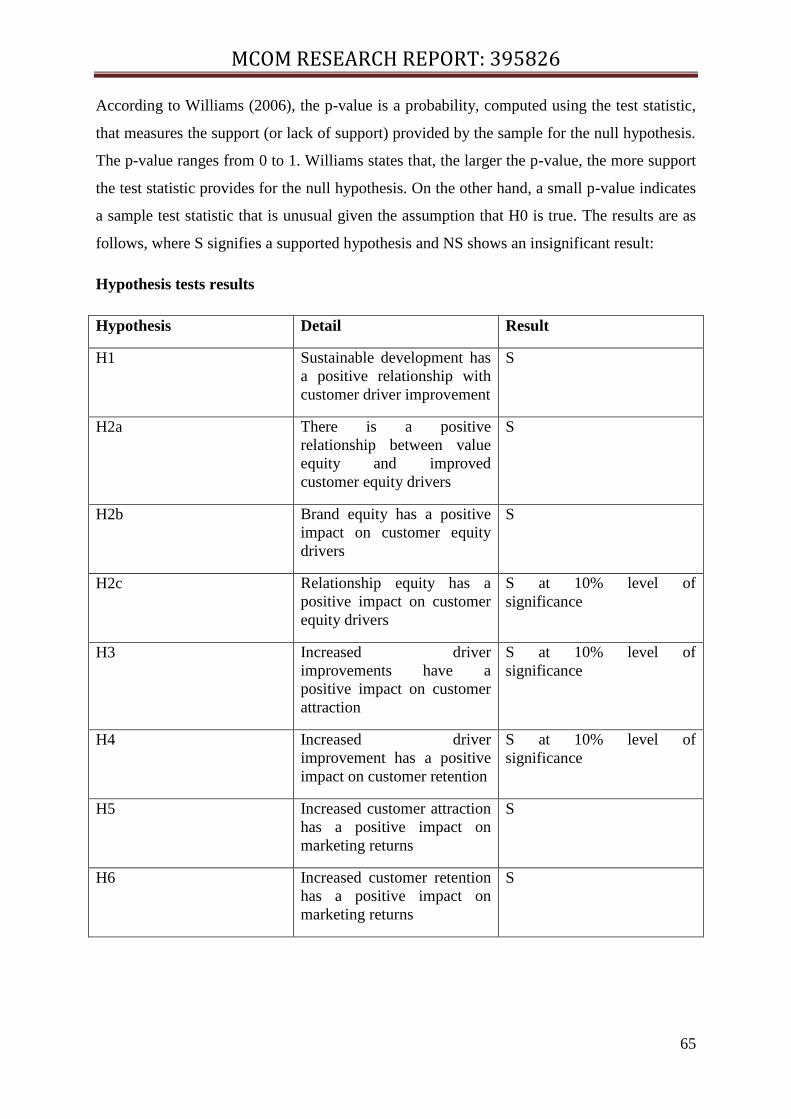
MCOM RESEARCH REPORT: 395826
65
According to Williams (2006), the p-value is a probability, computed using the test statistic,
that measures the support (or lack of support) provided by the sample for the null hypothesis.
The p-value ranges from 0 to 1. Williams states that, the larger the p-value, the more support
the test statistic provides for the null hypothesis. On the other hand, a small p-value indicates
a sample test statistic that is unusual given the assumption that H0 is true. The results are as
follows, where S signifies a supported hypothesis and NS shows an insignificant result:
Hypothesis tests results
Hypothesis Detail Result
H1 Sustainable development has
a positive relationship with
customer driver improvement
S
H2a There is a positive
relationship between value
equity and improved
customer equity drivers
S
H2b Brand equity has a positive
impact on customer equity
drivers
S
H2c Relationship equity has a
positive impact on customer
equity drivers
S at 10% level of
significance
H3 Increased driver
improvements have a
positive impact on customer
attraction
S at 10% level of
significance
H4 Increased driver
improvement has a positive
impact on customer retention
S at 10% level of
significance
H5 Increased customer attraction
has a positive impact on
marketing returns
S
H6 Increased customer retention
has a positive impact on
marketing returns
S
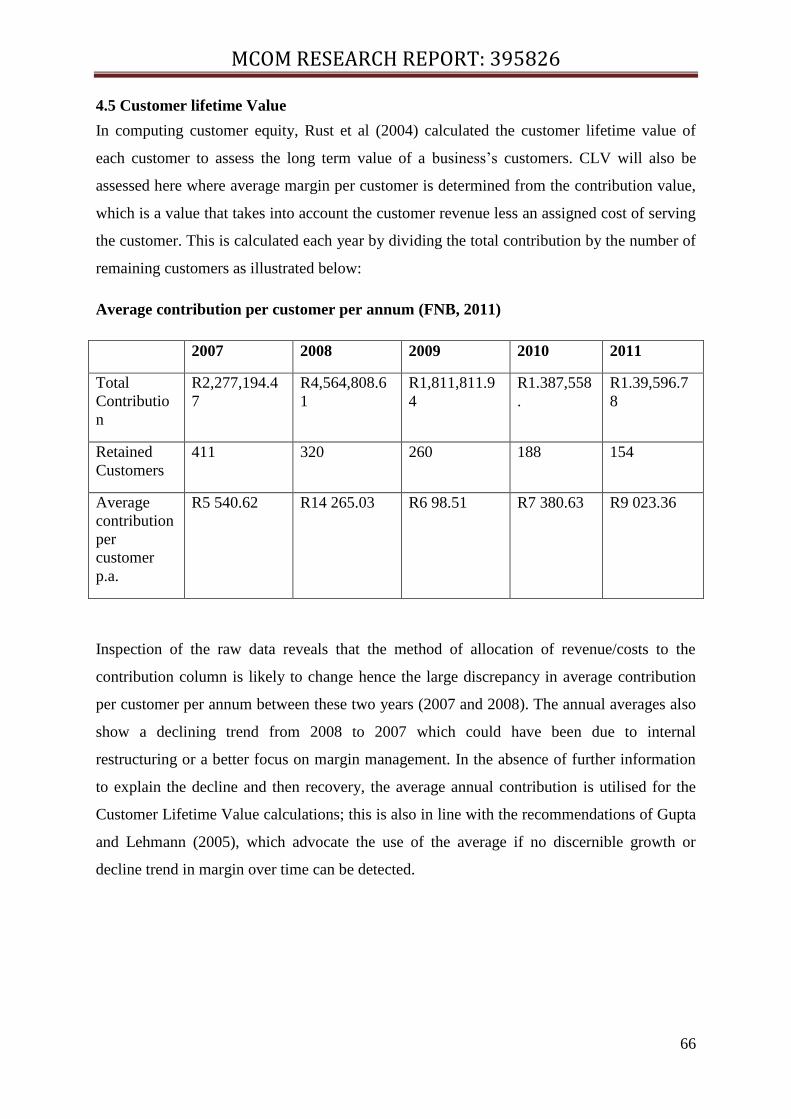
MCOM RESEARCH REPORT: 395826
66
4.5 Customer lifetime Value
In computing customer equity, Rust et al (2004) calculated the customer lifetime value of
each customer to assess the long term value of a business‟s customers. CLV will also be
assessed here where average margin per customer is determined from the contribution value,
which is a value that takes into account the customer revenue less an assigned cost of serving
the customer. This is calculated each year by dividing the total contribution by the number of
remaining customers as illustrated below:
Average contribution per customer per annum (FNB, 2011)
2007 2008 2009 2010 2011
Total
Contributio
n
R2,277,194.4
7
R4,564,808.6
1
R1,811,811.9
4
R1.387,558
.
R1.39,596.7
8
Retained
Customers
411 320 260 188 154
Average
contribution
per
customer
p.a.
R5 540.62 R14 265.03 R6 98.51 R7 380.63 R9 023.36
Inspection of the raw data reveals that the method of allocation of revenue/costs to the
contribution column is likely to change hence the large discrepancy in average contribution
per customer per annum between these two years (2007 and 2008). The annual averages also
show a declining trend from 2008 to 2007 which could have been due to internal
restructuring or a better focus on margin management. In the absence of further information
to explain the decline and then recovery, the average annual contribution is utilised for the
Customer Lifetime Value calculations; this is also in line with the recommendations of Gupta
and Lehmann (2005), which advocate the use of the average if no discernible growth or
decline trend in margin over time can be detected.
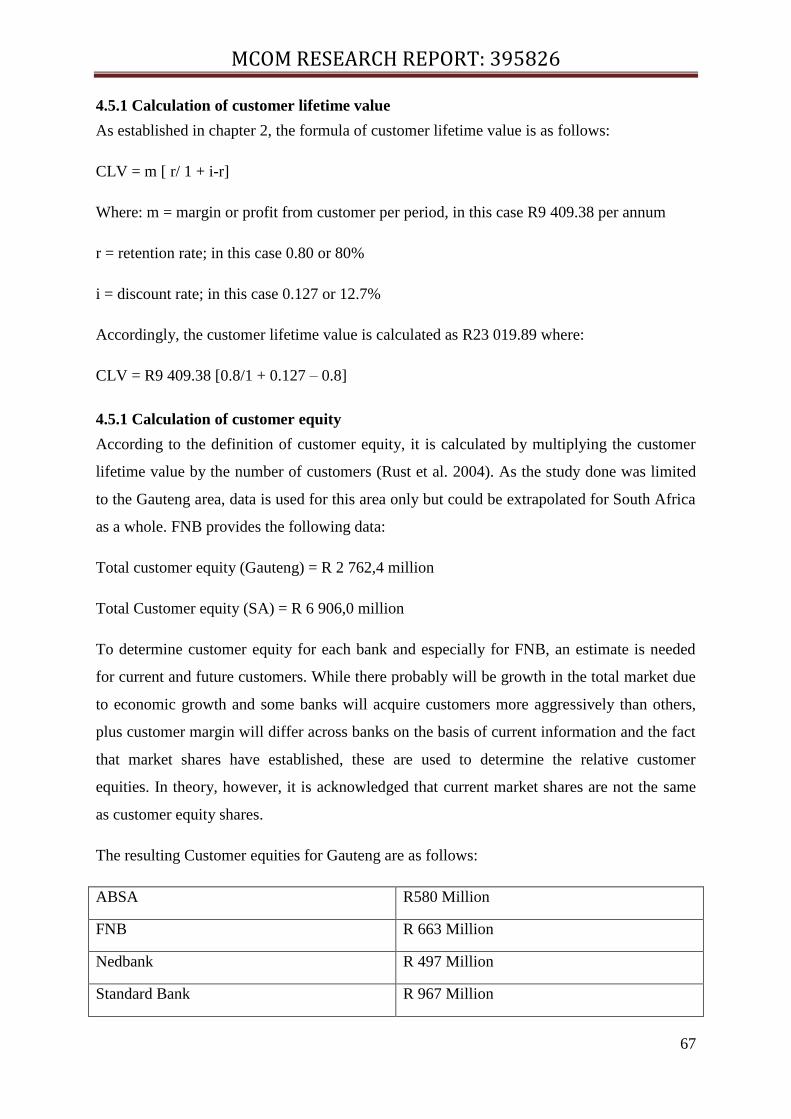
MCOM RESEARCH REPORT: 395826
67
4.5.1 Calculation of customer lifetime value
As established in chapter 2, the formula of customer lifetime value is as follows:
CLV = m [ r/ 1 + i-r]
Where: m = margin or profit from customer per period, in this case R9 409.38 per annum
r = retention rate; in this case 0.80 or 80%
i = discount rate; in this case 0.127 or 12.7%
Accordingly, the customer lifetime value is calculated as R23 019.89 where:
CLV = R9 409.38 [0.8/1 + 0.127 – 0.8]
4.5.1 Calculation of customer equity
According to the definition of customer equity, it is calculated by multiplying the customer
lifetime value by the number of customers (Rust et al. 2004). As the study done was limited
to the Gauteng area, data is used for this area only but could be extrapolated for South Africa
as a whole. FNB provides the following data:
Total customer equity (Gauteng) = R 2 762,4 million
Total Customer equity (SA) = R 6 906,0 million
To determine customer equity for each bank and especially for FNB, an estimate is needed
for current and future customers. While there probably will be growth in the total market due
to economic growth and some banks will acquire customers more aggressively than others,
plus customer margin will differ across banks on the basis of current information and the fact
that market shares have established, these are used to determine the relative customer
equities. In theory, however, it is acknowledged that current market shares are not the same
as customer equity shares.
The resulting Customer equities for Gauteng are as follows:
ABSA R580 Million
FNB R 663 Million
Nedbank R 497 Million
Standard Bank R 967 Million
MCOM RESEARCH REPORT: 395826
68
In conclusion, all the banks, particularly FNB needs to improve on drivers of brand and
relationship equity and to prove that pursuing the marketing activities will actually improve
profitability. The overall suggestions of this strategy is to do an integrated marketing
communication campaign to promote FNB‟s current CSR strategies and a CSR relationship
building campaign where FNB will create stronger relationships with current customers by
supporting housing initiatives.
4.5.2 Test of model for Marketing ROI
To test the model, inputs were obtained from FNB for these two potential marketing
programmes, which could then be loaded into the model and a resulting ROI of each
programme calculated. The basis of this model is that firms can decide what drivers they
would like to improve as established in the analysis above. If it is brand and relationship
drivers that need improvement, marketing practitioners can design a strategy to improve these
and firstly test it on the model to ensure they will receive returns on the investment. The two
programmes therefore are:
Marketing Programme 1: IMC Campaign
An IMC (Integrated marketing communications) campaign is a common strategy that
businesses pursue to increase awareness in the market of either the firms products or events.
An IMC campaign could be pursued here. The IMC campaign could be aimed at positioning
FNB as a good corporate citizen as they are currently lagging behind other banks like
Nedbank. So on a five point scale the strategy seeks to improve ratings as follows:
Brand sub driver of information: to improve rating to 3.90
Brand sub driver of image: to improve it to 3.80
Relationship sub driver of preferential treatment: to improve rating it to 3.20
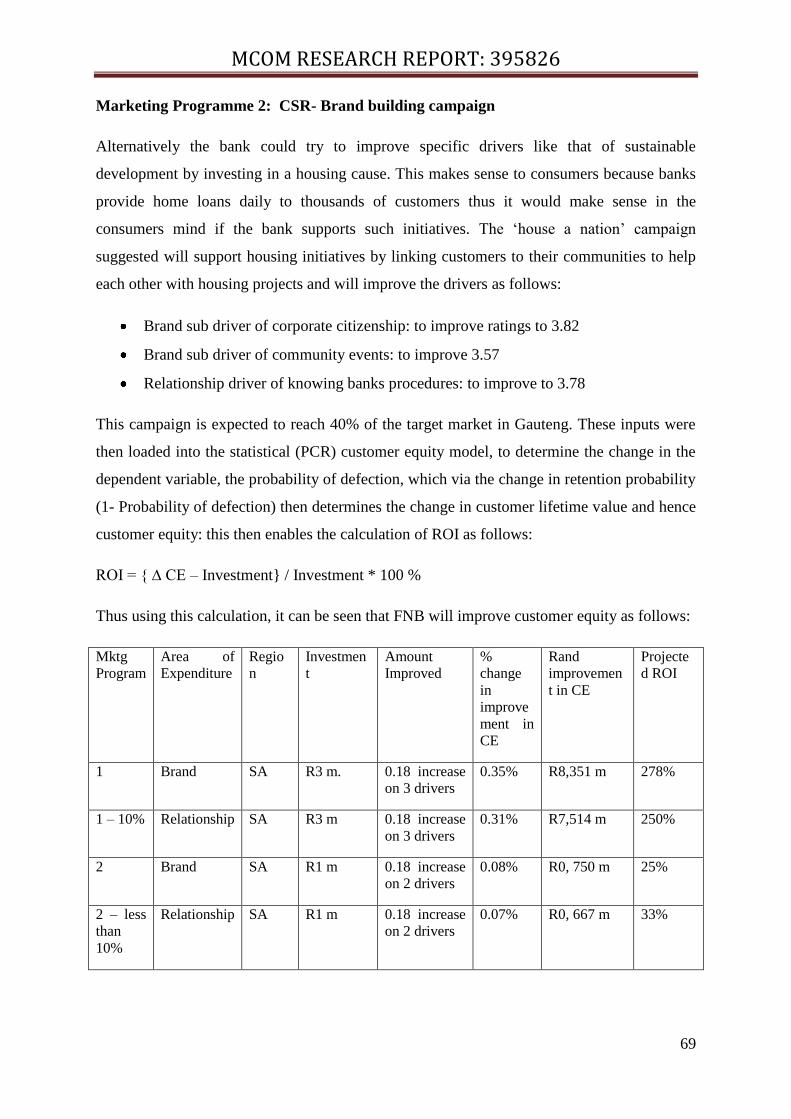
MCOM RESEARCH REPORT: 395826
69
Marketing Programme 2: CSR- Brand building campaign
Alternatively the bank could try to improve specific drivers like that of sustainable
development by investing in a housing cause. This makes sense to consumers because banks
provide home loans daily to thousands of customers thus it would make sense in the
consumers mind if the bank supports such initiatives. The „house a nation‟ campaign
suggested will support housing initiatives by linking customers to their communities to help
each other with housing projects and will improve the drivers as follows:
Brand sub driver of corporate citizenship: to improve ratings to 3.82
Brand sub driver of community events: to improve 3.57
Relationship driver of knowing banks procedures: to improve to 3.78
This campaign is expected to reach 40% of the target market in Gauteng. These inputs were
then loaded into the statistical (PCR) customer equity model, to determine the change in the
dependent variable, the probability of defection, which via the change in retention probability
(1- Probability of defection) then determines the change in customer lifetime value and hence
customer equity: this then enables the calculation of ROI as follows:
ROI = { ∆ CE – Investment} / Investment * 100 %
Thus using this calculation, it can be seen that FNB will improve customer equity as follows:
Mktg
Program
Area of
Expenditure
Regio
n
Investmen
t
Amount
Improved
%
change
in
improve
ment in
CE
Rand
improvemen
t in CE
Projecte
d ROI
1 Brand SA R3 m. 0.18 increase
on 3 drivers
0.35% R8,351 m 278%
1 – 10% Relationship SA R3 m 0.18 increase
on 3 drivers
0.31% R7,514 m 250%
2 Brand SA R1 m 0.18 increase
on 2 drivers
0.08% R0, 750 m 25%
2 – less
than
10%
Relationship SA R1 m 0.18 increase
on 2 drivers
0.07% R0, 667 m 33%
MCOM RESEARCH REPORT: 395826
70
Although the figures above are estimates, the table illustrates that the present strategy can be
used to calculate ROI of different programmes. The banks could try numerous strategies and
be able to determine the return using this technique which also proved successful in the
airline industry in Rust el al (2004) study. From the information above, it appears that
marketing programme 1 has a very high ROI whereas marketing programme 2 has a lower
return on investment thus it would be worthwhile to invest in an IMC campaign Overall, the
model could also be tested with different inputs or with different marketing programmes and
this shows that the model can be used to calculate the ROI of marketing programmes.
Practitioners can use this to trade off investments whenever there are a number of options
provided to address a lack of presence in the market. This tool makes the marketing function
more accountable because practitioners can discuss numbers at board level and be able to
decide which strategy is most effective and efficient before investing millions in it. As
marketing budgets are usually large, this exercise would provide direction and enable wise
investments to occur.
4.6 Sustainable Development Outcome
The following section provides an analysis of current CSR initiatives and discusses customer
responses relating to the topic and how the banks can use sustainable development to their
advantage. Using sustainable development in the model will enable planning and forecasts of
returns on marketing prior to pursuing any capital intensive sustainable development projects.
The key CSR issues include governance, environmental management, stakeholder
engagement and labour standards amongst others. CSR is not only about fulfilling a duty to
society; it should also bring competitive advantage, and through an effective CSR program,
companies can; improve access to capital, sharpen decision-making and reduce risk, enhance
brand image, uncover previously hidden commercial opportunities, reduce costs and finally
attract, retain and motivate employees. Any of these can be incorporated into the customer
equity model employed in this study to ascertain return on investment.
MCOM RESEARCH REPORT: 395826
71
It is more important to ensure that investments on people translate to longer term growth of
the firm and existence in a competitive environment.
According to The King III Report, stakeholders are categorized as shareholders, as providers
of capital, parties that contract with the enterprise either as providers of input to various
business processes and activities or as purchasers of its output including customers,
employees and business partners. It is evident that customers should be seen as assets of the
company and should be viewed in high regard.
From a stakeholder approach, Maignan et al., (2005) give important stakeholder measures
that have to be incorporated for each respective stakeholder group. As established in chapter
2, one of the key stakeholders is the customer as they are the only source of revenue. It is
crucial to take the customer‟s needs into account and pursue sustainable development projects
that are meaningful to them. The focus group discussion revealed that the main needs of the
mass market include housing and employment. To have an impact, the banks should address
these issues rather than what seems fashionable at the time as any other projects that do not
link to their lives cannot affect their preferences and thus have no impact on customer equity.
South Africa is currently facing a low-income housing crisis. Pillay and Naude (2006) state
that an obstacle in the provision of low-income housing is the difficulty encountered by
commercial banks to extend loans in this market despite supporting initiatives by
Government. A lack of knowledge on the borrowing behaviour, preferences and experiences
of low-income households in accessing housing finance from the commercial banking sector
in South Africa hampers an understanding of the reasons for these problems.
From the research conducted by Pillay and Naude (2006), it was found that, in the housing
purchase process, the majority of buyers were unable to access accurate information on the
primary and secondary housing market, which influenced their ability to purchase a home.
Housing is thus a serious issue for these consumers and it is an opportunity for the banks to
establish sustainable development projects that address their needs and thus create valuable
relationships with the consumers
The focus group participants expressed concern with regard to the lack of information they
get as they do not understand the interest that reflects on their monthly statements and more
importantly are unaware of the details of what it means to open up a bank account and what it
entails.
MCOM RESEARCH REPORT: 395826
72
Thus, banks need to emphasize and invest on their education to the consumers, starting at the
front desk where a (potential) consumer would approach with interest in opening an account.
It was noted that consumers would understand more and appreciate it if bank consultants
explained all the details to the consumers in their own languages as English for many is not a
first language. This would improve the consumers‟ understanding of the bank operations and
therefore improve the relationship between the two parties as competitors like Capitec bank
do.
The new government seeks to address the inequalities created by apartheid through
subsidising housing and service provision for the very poor. Towards this end, more than
two-thirds of the state housing subsidy now goes to households earning less than R1 500 per
month (National Department Of Housing, 2001). The focus group conducted showed that
consumers are highly interested in having the banks assist in Reconstruction and
Development Program (RDP) housing, as they feel that government is taking too long to
satisfy their needs of having a home and they strongly emphasise that even though FNB has
sustainable and community driven initiatives, they do not see them and are thus not affected
by them. They believed that if FNB would state the initiatives and help in their communities,
many people would move to FNB as their preferred bank.
It is evident that if the banks expressed their sustainable development initiatives to the public
in a manner that they can understand then they will acquire more consumers in this particular
market. This is supported by the cause related marketing discussion in chapter 2.
Corporate Social Responsibility can be used as an innovation tool in fusing both sustainable
development and its CSR strategies in creating originality in its marketing strategies. The
banks can associate themselves with a community driven initiative like Habitat for Humanity.
Habitat for Humanity South Africa considers such factors as the level of need for housing in
the community, support of local leadership and community stability. Habitat for Humanity
South Africa supports the committee through training them in their roles and responsibilities,
administration, house design, finance, business plans, construction program, and record
keeping (Habitat.org). The potential home owner helps build the house, this is a form of
„paying it forward‟ as the community who help with the home building are assured that they
will get help from the potential home owner they are currently helping. This initiative will
also be remembered by the consumers as it addresses a need in their communities.
MCOM RESEARCH REPORT: 395826
73
What was also evident in the focus group is that FNB tends to close consumers‟ accounts
when there is no money it, this being done without the consumers‟ knowledge. As one of the
respondents said “I use Standard Bank as right now I am unemployed so I find Standard Bank
to be the easiest as even though I have no money they will not close my account, but FNB
does this and it is very upsetting and inconvenient. You‟ll find that I sometimes get a little
money here and there from my peace jobs but the people try to put money in my account and
find that they cannot as it has been closed without my knowledge”. To the consumers this
seems to be a focal concern, where FNB would need to focus on. Throughout the focus group
the importance of information came out as key.
The community projects that most banks are currently running lack focus on the actual
consumers and people of the communities as well as not targeting low income consumers.
It was noted from the focus group conducted that the consumers want community initiatives
that are “closer to home” and are targeted at their own communities.
In addition to the community and environmental projects that the main banks are currently
running they are also involved in sponsorships. These can be effective and contribute to
customer equity if the sponsorship is for the teams that are actually in need within the
communities of the target market.
These programs are good for engaging the youth and keeping them active. The three main
attributes of sustainable development are; the people (of South Africa), the planet and profit
and any bank that can successfully strike that balance will be guaranteed of strong
positioning.
4.6.1 Conclusion:
The purpose of this section was to test the customer equity model and apply it to the South
African banking sector. The quantitative and qualitative outputs were employed to gauge the
usability and effect of sustainable development on customer equity.
It was established that the customer equity model is applicable to the banking sector and
sustainable development can be measured as an additional variable. The results show that it
would greatly benefit the banks to look into educating their consumers so that they can
understand the banking processes.
MCOM RESEARCH REPORT: 395826
74
Education in a language that the consumers can understand is imperative in the retention of
the current customers as well as helping with the complaints levels that the company may
encounter.
Consumers would also be more affected and possibly attracted by the bank‟s being involved
in helping their communities through assisting in the RDP housing developments. Although
this may be a difficult obstacle, banks can use this opportunity to associate themselves with
housing and get involved in an initiative such as Habitat for Humanity. This initiative allows
the consumers to help themselves while helping others and with any bank supporting this,
consumers will see the company as helping their community and would want to switch banks
thereby strengthening their relationships with the specific bank.
The closure of consumers‟ accounts without their knowledge is a big problem for consumers
and for banks alike. Some of the banks like Standard Bank do not do this and from the focus
group it was noted that this is one of the biggest reasons for consumers to move to Standard
Bank and stay with them. The other banks can adopt the same system for consumers in the
mass market to maintain retention levels.
The recommendations made above can assist the banks in fusing the three P‟s or sustainable
development; people, planet and profit. The balance between these three is empirical for a
company to further grow and develop. Consumers should be placed as assets and more
emphasis should be placed on them rather than having the latest marketing strategy that does
not impact the people that it is targeting.
The current sustainable development initiatives are efficient but have to be worked on,
incorporating the recommendations made. Advertising the initiatives is also vital to increase
the company‟s brand awareness and brand image and ultimately the company‟s‟ brand
equity.
MCOM RESEARCH REPORT: 395826
75
CHAPTER FIVE: CONCLUSION AND RECOMMENDATIONS
The purpose of the study was to develop means to find a balance between profitability and
sustainable development. A customer equity model and sustainable development model was
used to show that by pursuing corporate social responsibility, banks can improve their brand
equity and relationship equity whilst pursuing sustainable development.
5.1 Summary of main findings
- Employing a customer equity model that was tested in the study to gauge potential
marketing returns before implementing strategy to ensure increased marketing
accountability.
- Running an IMC campaign to promote the banks current and proposed CSR activities
in order to create awareness and develop favourability amongst consumers.
- Pursuing a “housing the nation” campaign to address the specific issues of the target
market so that there is a strong link in the customers‟ minds.
This will can be done using “habitat for humanity” were a bank can assist customers
to reduce their costs for housing by being involved in their own housing projects.
- Creating stronger customer initiated contacts by developing relationships with
customers and linking them to other members of the bank to create a sense of
community with the bank.
The customer equity and sustainable development model developed in this study can provide
a significant contribution to organisations as marketing strives to become more accountable
and as organisations search for tools to measure the effectiveness of marketing programmes.
The strategies presented here will provide organisations with a powerful tool to build
shareholder value by understanding the drivers of market based intangible assets. However,
to implement such a model will require some organisational changes and for the culture of
the bank to become more customer focused.
MCOM RESEARCH REPORT: 395826
76
In conclusion, the strategy proposed here is essential for FNB since economies are moving
from manufacturing goods to providing services and as marketing shifts from making
transactions to developing relationships, the requirement of organisations needs to shift from
managing products to managing customers as stated by Rust et al (2004). Marketing can thus
be a greater contribution by being accountable as driving customer equity will build
shareholder value and create not only sustainable profits but sustainable development as well.
5.2 Implications for management and academia
The customer equity model has proved to be an essential tool when making marketing based
decisions that involve corporate social responsibility. This contributes to the marketing
industry as practitioners can make use of the tool and report quantitative statistics that
shareholders can understand to monitor investments. This will make marketing more
accountable in the banking industry as practitioners can end the era of relying on judgement
and experience when selecting marketing strategies.
The marketing literature will also lean towards quantitative reports using financial language
in the form of the customer equity model. This is beneficial for standardised research as
marketing eventually reports to finance and plays a vital role in determining enterprise value.
Customer equity has thus broadened to include intangible assets like brand and relationship
equity and this will affect current and future research to focus on this domain.
5.3 Research Limitations
Use of convenience sampling introduced a limitation in that the sample was not
representative of the population and therefore the researcher could not generalise results of
this study. The Gauteng region also comprises of many consumers and a bigger sample size
would have been more representative.
It was also difficult to attain expenditure amounts on customer retention and acquisition from
all banks. This made it difficult to generalise the results without taking into account the exact
spend on these components. The results thus had to rely on past trends and estimates.
5.4 Recommendations for future research
The present study focused on the measures of customer equity and used regression analysis to
assess the impact on the future value of a bank. It is may be possible to use other statistical
methods to solve this problem and further determine returns on investment.
MCOM RESEARCH REPORT: 395826
77
There are also opportunities for simplified and easy to use models of calculating customer
equity and linking this to enterprise value. The possibility to use statistical methods to project
the future needs of customers based on currently unmet needs in the market may add to the
debate around the value that customers add to an enterprise and therefore increase customer
equity and enterprise value.
Rust et al (2004) tested the customer equity model on the American airline study then this
study tested the model in the South African banking sector. It might be worthwhile to test the
model in another industry to validate the customer equity model and make marketing more
accountable across industries in the world.
MCOM RESEARCH REPORT: 395826
78
References
Aaker, D.A. & Keller, K.L. (1990). Consumer Evaluations of Brand Extensions. Journal of
Marketing, 54 (January): 27-41.
Ackerstein, D & Lemon, K. N. (1999). The Greening of the Brand: Environmental Marketing
Stategies and the American Consumer. Greener Marketing: A Global Perspective on
Greening Marketing Practice, 2nd
ed (UK: Greenleaf Publishing).
Attalla, A. Carrigan, M. (2001). The myth of the ethical consumer-Do ethics matter in
purchase behaviour. Journal of Consumer Marketing, 18(7): 560-576
Barnes N. G. & Fitzgibbons A. D. (1992). Strategic Marketing for Charitable
Organizations. Health Marketing Quarterly, 9, (3 & 4) (May): 103 – 114.
Bauer, H.H. & Hammerschmidt, M. (2005). Customer-based corporate valuation: Integrating
the concepts of customer equity and shareholder value. Management Decision, 43(3): 331-
348.
Bell, D., Deighton, J., Reinartz, W. J., Rust, R. T., & Swartz, G. (2002). Seven barriers to
customer equity management. Journal of Service Research, 5(1): 77-85.
Benson, P. S., Rangan, V. K., Moriarty, R & Ross, E. B. (1987). Manage Customers for
Profits (Not Just Sales). 9(5): 101-108.
Berger, P. D., Bolton, R. N., Bowman, D., Briggs, E., Kumar, V., Parasuraman, A. & Terry,
C. (2002). Marketing actions and the value of customer assets: a framework for customer
asset management. Journal of Service Research, 5: 39.
Berger, P. D. & Nada I. N. (1998). Customer Lifetime Value: Marketing Models and
Applications. Journal of Interactive Marketing, 12(1): 17-30.
Bick, G. (2007). Developing a Customer Equity Model for Guiding Marketing Spend in the
Financial Services Sector, University of Johannesburg Phd Dissertation.
Blattberg, R. C., & Deighton, J. (1996). Marketing by the customer equity test. Harvard
Business Review.
Bronn, P. S. & Vrioni, A. B. (2001). Corporate Social Responsibility and Cause Related
Marketing: an Overview. International Journal of Advertising
Brown, T. J. & Dacin, P.A. (1997). The Company and the Product: Corporate Associations
and Consumer Product Responses, Journal of Marketing, 61(1): 68–84
Burns, A. C. & Bush, F. R. (2006). Marketing Research. Prentice Hall: Pearson Education.
Cash, T. E., Grant, J. R. (2005) Cognitive-behavioural treatment of body-image disturbances.
In V. Van Hasselt & M. Hersen (Eds.), Sourcebook of psychological treatment manuals for
adult disorders. New York: Plenum Press.
MCOM RESEARCH REPORT: 395826
79
Copeland, T., Koller, T. & Murrin, J. (1996). Valuation: Measuring and Managing the Value
of Companies. New York: John Wiley & Sons.
Council For Scientific And Industrial Research (CSIR) (2000) Council For Scientific And
Industrial Research (CSIR) Status quo report: Unblocking finance for affordable housing in
South Africa. Report prepared for the NHFC by the Council for Scientific and Industrial
Research, Boutek Division, South Africa, Unpublished.
Cui, Y., Trent, E. S., Sullivan, P.M. & Matiru, G. N. (2003). Cause-related marketing: how
generation Y responds. International Journal of Retail & Distribution Management, 31 (6):
310-320.
Doyle, P. (2000). Value –Based Marketing, John Wiley & Sons, Chichester, UK
Duncan, T. & Moriarty, S. (1997). Driving Brand Value: Using Integrated Marketing to
manage profitable stakeholder relationships, McGraw-Hill, New York.
Fellman, J. (1999). Gustav Elving‟s contribution to the emergence of the optimal
experimental design theory. Statistical Science, 14(2): 197-200.
FNB.co.za., (2011). Online Banking, Retrieved April 11, 2011, [available at http://www.fnb-
onlinebanking.net/about-us/4536168800]
Foss, B. & Stone, M. (2001). Successful Customer Relationship Management: New thinking,
new strategies, new tools for getting closer to your customers. London: Kogan Page Ltd.
Freeman, E. (1984).Strategic Management: A Stakeholder Approach. Pitman Publishing,
Boston.
Gale, B. T. (1994) Managing Customer Value. New York: The Free Press.
Galpin, J.S., & Krommenhoek, R. (2009). Course notes for Statistical research design and
analysis, University of the Witwatersrand, Johannesburg.
Getz, G. & Thomas, J.G. (2001). Customer Equity: building and managing relationships as
valuable assets. Boston: Harvard Business School Press.
Grant, R.M. (2008). Contemporary strategy analysis. 6th
edn. Blackwell Publishing.
Greenberg, P. (2003). Customer Relationship Management: Essential Customer Strategies
for the 21st Century. 3
rd edn. Emeryville, CA: McGraw-Hill/Osborne.
Gupta, S., Lehmann, D.R. & Stuart J.A (2004). Valuing customers. Journal of Marketing
Research, 41(1): 7-18.
Habitat for Humanity, learn about us, Retrieved April 1, 2011, [available at
http://www.habitat.org/ame/learn/about.aspx]
Hair, J.F., Anderson, R.E., Tatham, R.L. & Black, W.C. (1998). Multivariate Data Analysis,
5th
Edition. New Jersey: Prentice Hall.
MCOM RESEARCH REPORT: 395826
80
Hanssens, D. M., Thorpe, D. & Finkbeiner, C. (2008). Marketing When Customer Equity
Matters (accessed April 14, 2011), [available at
http://hbr.harvardbusiness.org/2008/05/marketing-when-customer-equity-matters/ar/1].
Hou, C., Zou, W., Moses, M.E., Woodruff, B., Brown, J.H. & West, G.B. (2008). Energy
uptake and allocation during ontogeny. Science, 322(5902): 736- 739.
Jamali, D., Asem M.S., & Myriam, R. (2008). Corporate Governance and Corporate Social
Responsibility Synergies and Interrelationships. Blackwell Publishing Ltd, 16 (5).
Karsens (1999). Speech by Deputy Director General at the National Housing Strategy
Conference, December, Johannesburg: National Department of Housing.
Krafft, M., Rudolf, M., & Rudolf-Sipötz, E. (2005). Valuation of customers in growth
companies – a scenario based model. Schmalenbach Business Review, 57(4): 103 – 127
King, M. (2009) The King III Report. The South African Chapter of the Institute of Directors
Kordupleski, R., Rust, R.T & Zahorik, A.J. (1993). Why Improving Quality Doesn‟t Improve
Quality. California Management Review, 35: 82-95.
Lovelock, C. & Wirtz, J. (2007). Services Marketing: People, Technology, Strategy. Upper
Saddle River, New Jersey: Pearson Prentice Hall.
Lemon, K. N., Rust, R. T., & Zeithaml, V. A. (2001). What drives customer equity.
Marketing Management, 10(1): 20-25.
Leone, R.P. (2006). Linking brand equity to customer equity. Journal of Service Research,
9(2): 125- 138
MacHulbert, R. C. & Pitt, L. F. (1996). Exit Left Center Stage? The Future of Functional
Marketing. European Management Journal, 14 (1): 47-60.
Maignan, I,Ferrell, O.C. & Ferrell, L. (2005). A stakeholder model for implementing social
responsibility in marketing. European Journal of Marketing, 36 (9/10): 956-977.
Massy, W.F (1965). Principal components regression in exploratory statistical research.
Journal of the American statistical association, 60(3): 234- 256.
Malhotra, B. N. (2006). Marketing Research: An applied approach. 3rd Edition. Prentice
Hall.
Mizik, N. & Jacobson, R. (2006). Myopic Marketing Management: The Phenomenon and its
Long-Term Impact on Firm Value, Marketing Science Institute, Report No. 6-100.
Mullen, J. (1997). Performance-based corporate philanthropy: How giving smart can further
corporate goals. Public Relations Quarterly, 42 (2): 42-48.
Parasuraman, A. (1997). Reflections on gaining competitive advantage through customer
value. Journal of the Academy of Marketing Science, 25(2): 154-161.
MCOM RESEARCH REPORT: 395826
81
Peter, J. P. (1981). Construct Validity: A Review of Basic Issues and Marketing Practices.
Journal of Marketing Research, 18(2): 133-145.
Pillay, A. & Naude, W.A. (2006). Financing low income housing in South Africa: Borrower
experiences and perceptions of banks. Habitat International, 30(4): 872- 885.
Piturro, M. (1998). Getting a Charge Out of Service. Sales and Marketing Management
Journal, 150 (12): 86–91.
Polonsky, M.J. (1994). An introduction to Green Marketing. Electronic Green Journal, 1,
(2): 1-10
Roberts, J. H. (2000). Developing New Rules for New Markets. Journal of the Academy of
Marketing Science, 28 (1): 31-44.
Ross, J.K., Patterson, L.T. & Stutts, M.A. (1992). Consumer perceptions of organisations that
use cause related marketing. Journal of the Academy of Marketing Science, 20(1): 93-97.
Rust, R. T., Lemon, K. N., Zeithaml, V.A. (2004). Return on Marketing: Using Customer
Equity to Focus Marketing Strategy. Journal of Marketing, 68(1): 109-127.
Schiffman, L., Bednall, D., O‟Cass, A., Paladino, A. & Kanuk, L. (2005). Consumer
Behaviour 3rd
Edn. Pearson Education Prentice Hall.
Schiller, Z. (1988). Doing well by doing good, Business week, (December): 53-57.
Schultz, D.E. & Gronstedt, G.A. (1997). Making marcom an investment. Marketing
Management, 6(3): 40- 49.
Sethi, S. P. (1977). Advocacy Advertising and Large Corporations, Lexington Books,
Lexington, MA.
Sidiropoulos, E. (1998). South Africa survey, Institute of Race Relations, Johannesburg
South Africa. National Department of Housing (2001). National Department of Housing,
National Department of Housing data base: Housing and urbanisation information system,
Department of Housing, Pretoria.
Srivastava, R. K., Shervani, T. A., Liam Fahey, L. (1998). Market-Based Assets and
Shareholder Value: A Framework for Analysis. The Journal of Marketing, 62 (1): 2-18
Tellis, G. J .(1986). Beyond the Many Faces of Price: An Integration of Pricing Strategies.
The Journal of Marketing, 50 (4): 146-160.
Thompson, B. (2001). CRM and the Internet: Leading Edge Strategies for a Multi-Channel
World (accessed May 19, 2011), [available at
http://www.businessweek.com/adsections/care/crm/crm_index.htm].
Ungerer, M. Pretorius, M. & Herholdt, J. (2007). Viable business strategies: a systemic,
people-centric approach. Knowres Publishers, Stellenbosch.
Varadarajan, R.P. & Menon, A. (1988). Cause-Related Marketing: A Co alignment of
Marketing Strategy and Corporate Philanthropy. The Journal of Marketing, 52(3): 58-74.
MCOM RESEARCH REPORT: 395826
82
Vargo, S. L. & Lusch, R. F. (2004). Evolving to a new Dominant Logic for Marketing.
Journal of Marketing, 68(1): 1-17.
Venkatesan, R. & Kumar, V. (2004). A Customer Lifetime Value Framework for Customer
election and Resource Allocation Strategy. Journal of Marketing, 68(1): 106-125
Westhuizen, I & Botha, J. (1995). In: G. Westhuizen and R. Botha, Editors, South African
housing scenario, Khayalethu Home Loans, Randburg
Wood, J. (1989). Theory and research concerning social comparisons of personal attributes.
Psychological Bulletin, 106: 231-248.
Zeithaml, V.A. (1988). Consumer perceptions of price, quality and value: a means-end model
and synthesis of evidence. Journal of Marketing, 52(7): 2- 22.
Zikmund, W.G. (2003). Business Research Methods. 7th
edn: South Western Cengage
Learning.
MCOM RESEARCH REPORT: 395826
83
Appendix A: Questionnaire sample
Understanding Customer Equity Management
This study is being conducted as part of a Masters Customer equity research project at the
University of the Witwatersrand. The Questionnaire should take you approximately 5 minutes
to complete. It is crucial that you read the questions carefully and think before you choose an
answer. The survey is anonymous (i.e kept in secret), so please be honest!
Kindly read through the instructions at the beginning of each section of the questionnaire
before completing that section.
Please note- There are no right or wrong answers!
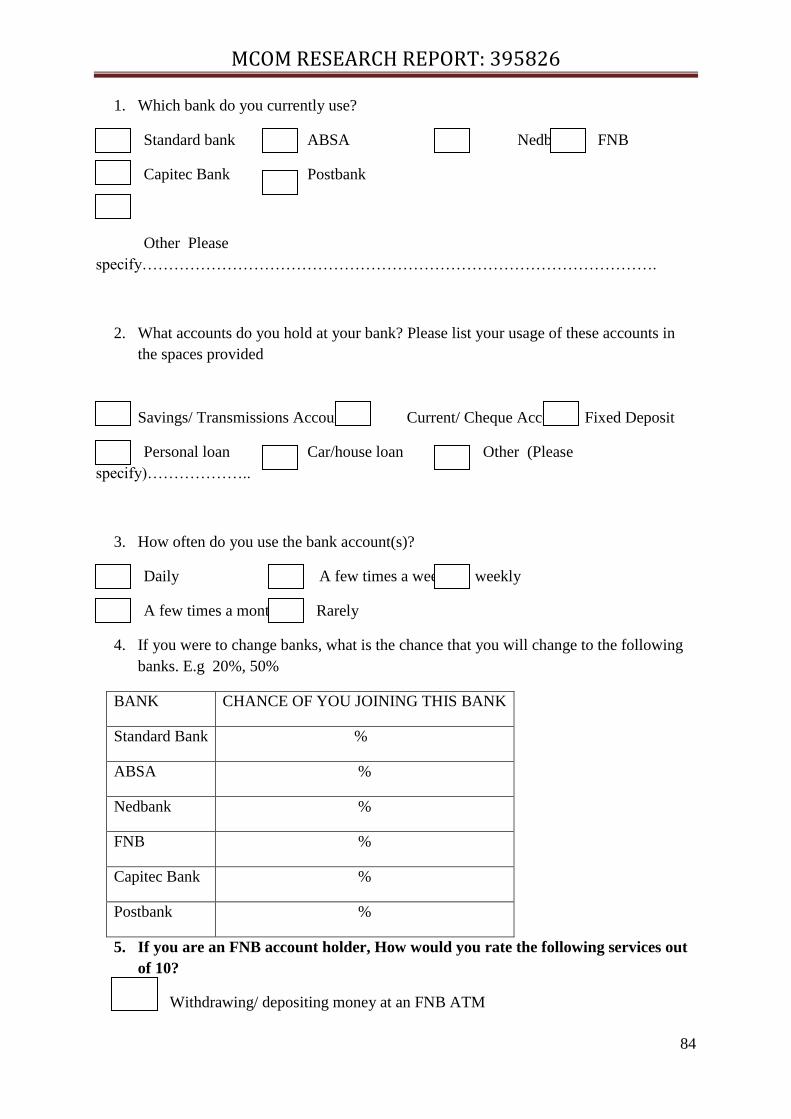
MCOM RESEARCH REPORT: 395826
84
1. Which bank do you currently use?
Standard bank ABSA Nedbank FNB
Capitec Bank Postbank
Other Please
specify…………………………………………………………………………………….
2. What accounts do you hold at your bank? Please list your usage of these accounts in
the spaces provided
Savings/ Transmissions Account Current/ Cheque Account Fixed Deposit
Personal loan Car/house loan Other (Please
specify)………………..
3. How often do you use the bank account(s)?
Daily A few times a week weekly
Pers A few times a month Rarely
4. If you were to change banks, what is the chance that you will change to the following
banks. E.g 20%, 50%
BANK CHANCE OF YOU JOINING THIS BANK
Standard Bank %
ABSA %
Nedbank %
FNB %
Capitec Bank %
Postbank %
5. If you are an FNB account holder, How would you rate the following services out
of 10?
Withdrawing/ depositing money at an FNB ATM
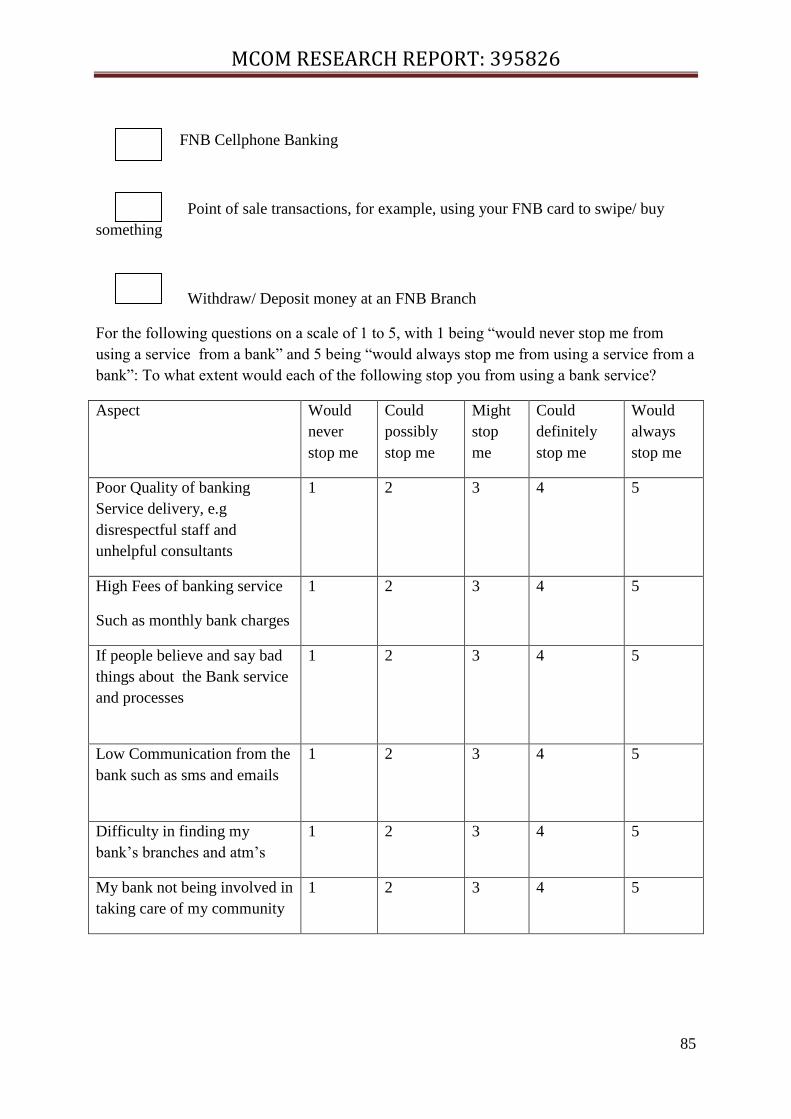
MCOM RESEARCH REPORT: 395826
85
FNB Cellphone Banking
Point of sale transactions, for example, using your FNB card to swipe/ buy
something
Withdraw/ Deposit money at an FNB Branch
For the following questions on a scale of 1 to 5, with 1 being “would never stop me from
using a service from a bank” and 5 being “would always stop me from using a service from a
bank”: To what extent would each of the following stop you from using a bank service?
Aspect Would
never
stop me
Could
possibly
stop me
Might
stop
me
Could
definitely
stop me
Would
always
stop me
Poor Quality of banking
Service delivery, e.g
disrespectful staff and
unhelpful consultants
1 2 3 4 5
High Fees of banking service
Such as monthly bank charges
1 2 3 4 5
If people believe and say bad
things about the Bank service
and processes
1 2 3 4 5
Low Communication from the
bank such as sms and emails
1 2 3 4 5
Difficulty in finding my
bank‟s branches and atm‟s
1 2 3 4 5
My bank not being involved in
taking care of my community
1 2 3 4 5
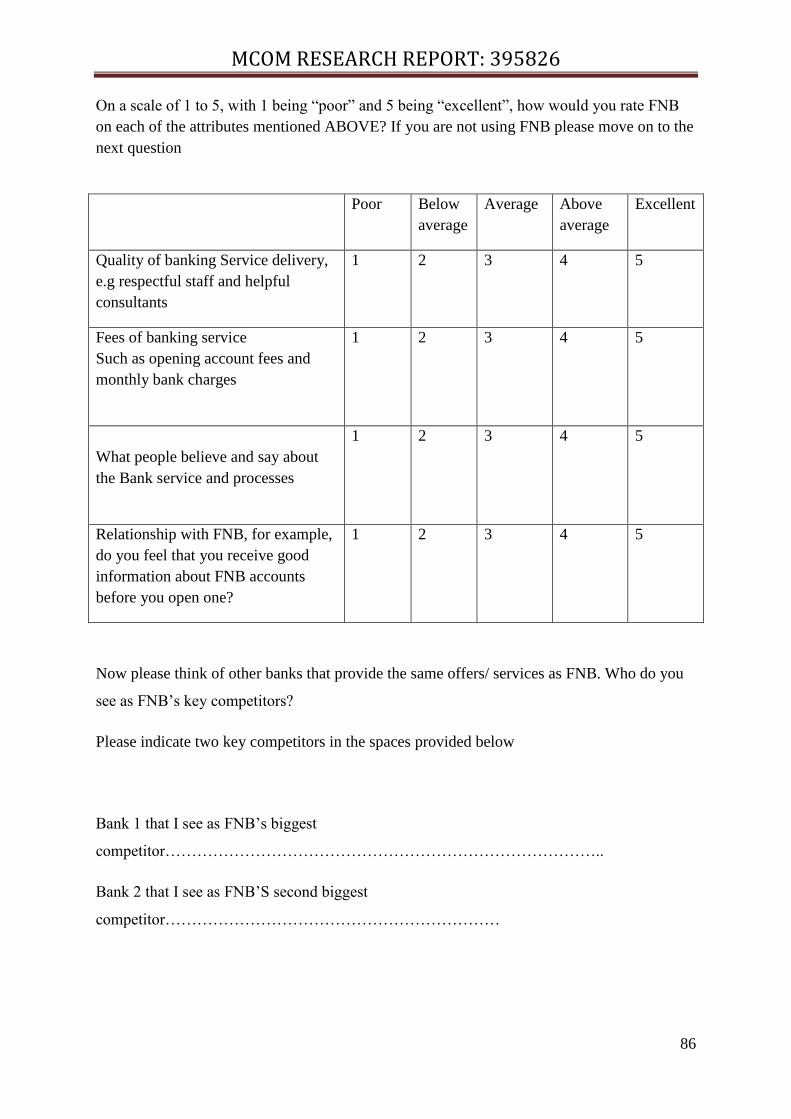
MCOM RESEARCH REPORT: 395826
86
On a scale of 1 to 5, with 1 being “poor” and 5 being “excellent”, how would you rate FNB
on each of the attributes mentioned ABOVE? If you are not using FNB please move on to the
next question
Poor Below
average
Average Above
average
Excellent
Quality of banking Service delivery,
e.g respectful staff and helpful
consultants
1 2 3 4 5
Fees of banking service
Such as opening account fees and
monthly bank charges
1 2 3 4 5
What people believe and say about
the Bank service and processes
1 2 3 4 5
Relationship with FNB, for example,
do you feel that you receive good
information about FNB accounts
before you open one?
1 2 3 4 5
Now please think of other banks that provide the same offers/ services as FNB. Who do you
see as FNB‟s key competitors?
Please indicate two key competitors in the spaces provided below
Bank 1 that I see as FNB‟s biggest
competitor………………………………………………………………………..
Bank 2 that I see as FNB‟S second biggest
competitor………………………………………………………
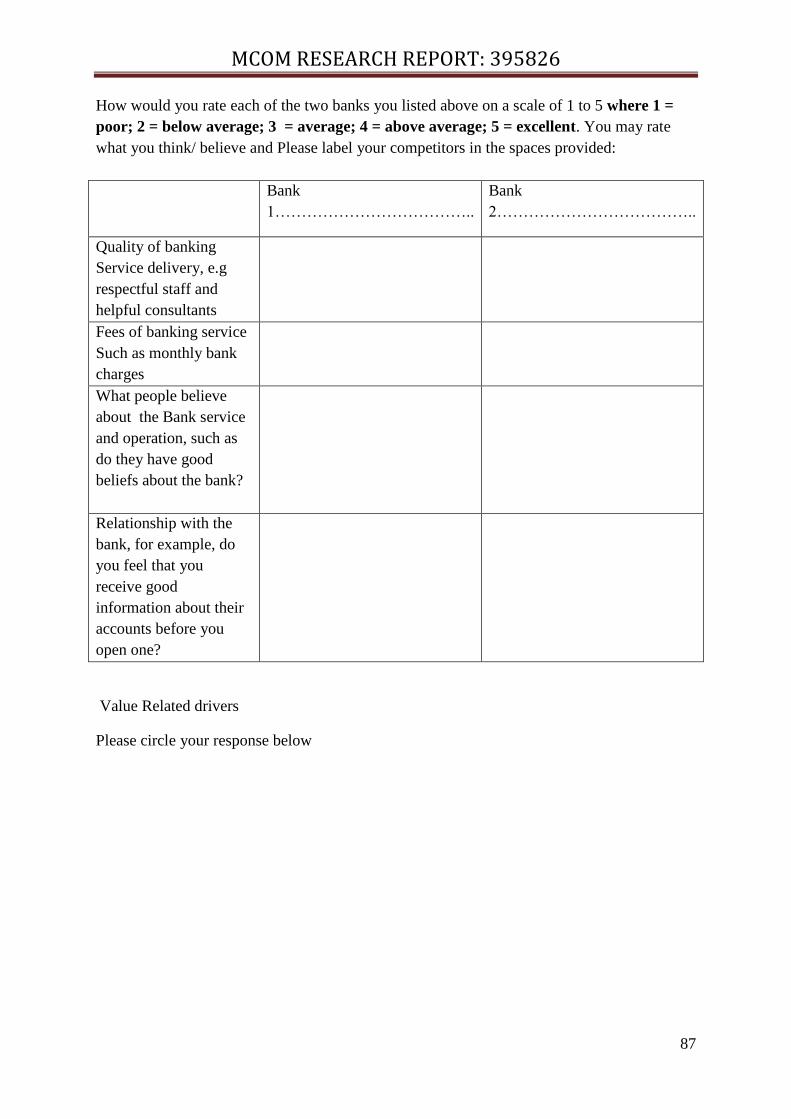
MCOM RESEARCH REPORT: 395826
87
How would you rate each of the two banks you listed above on a scale of 1 to 5 where 1 =
poor; 2 = below average; 3 = average; 4 = above average; 5 = excellent. You may rate
what you think/ believe and Please label your competitors in the spaces provided:
Bank
1………………………………..
Bank
2………………………………..
Quality of banking
Service delivery, e.g
respectful staff and
helpful consultants
Fees of banking service
Such as monthly bank
charges
What people believe
about the Bank service
and operation, such as
do they have good
beliefs about the bank?
Relationship with the
bank, for example, do
you feel that you
receive good
information about their
accounts before you
open one?
Value Related drivers
Please circle your response below
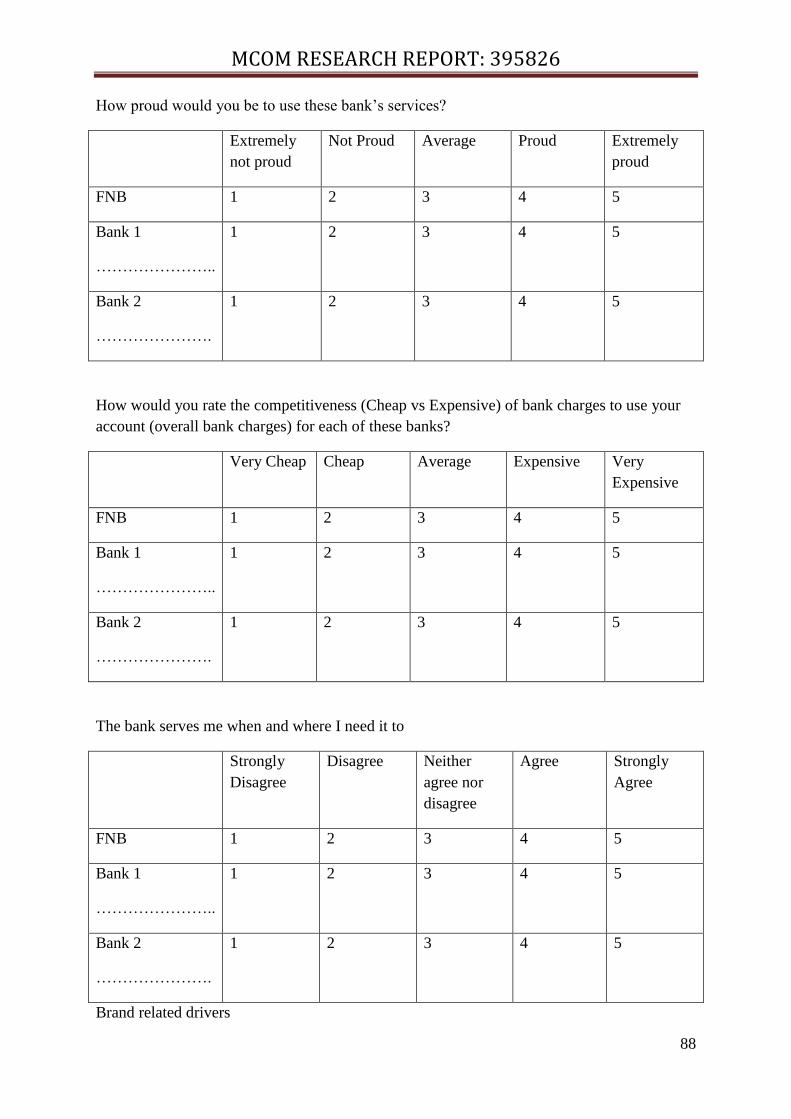
MCOM RESEARCH REPORT: 395826
88
How proud would you be to use these bank‟s services?
Extremely
not proud
Not Proud Average Proud Extremely
proud
FNB 1 2 3 4 5
Bank 1
…………………..
1 2 3 4 5
Bank 2
………………….
1 2 3 4 5
How would you rate the competitiveness (Cheap vs Expensive) of bank charges to use your
account (overall bank charges) for each of these banks?
Very Cheap Cheap Average Expensive Very
Expensive
FNB 1 2 3 4 5
Bank 1
…………………..
1 2 3 4 5
Bank 2
………………….
1 2 3 4 5
The bank serves me when and where I need it to
Strongly
Disagree
Disagree Neither
agree nor
disagree
Agree Strongly
Agree
FNB 1 2 3 4 5
Bank 1
…………………..
1 2 3 4 5
Bank 2
………………….
1 2 3 4 5
Brand related drivers
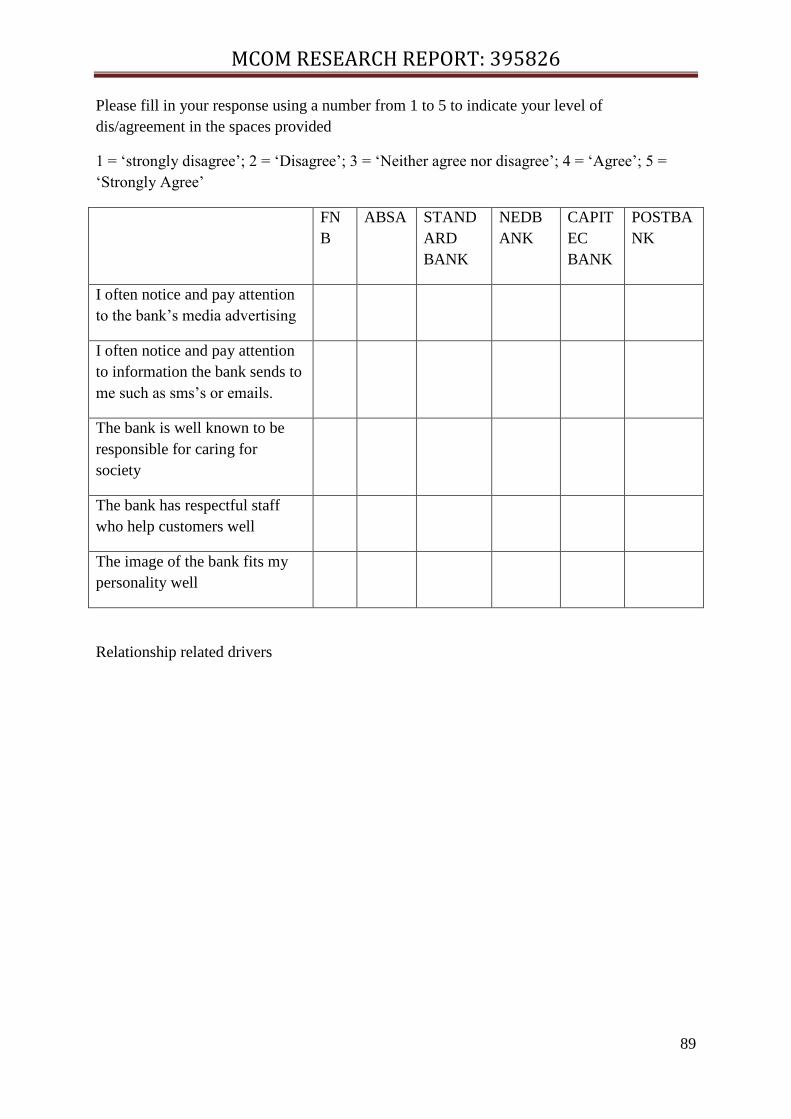
MCOM RESEARCH REPORT: 395826
89
Please fill in your response using a number from 1 to 5 to indicate your level of
dis/agreement in the spaces provided
1 = „strongly disagree‟; 2 = „Disagree‟; 3 = „Neither agree nor disagree‟; 4 = „Agree‟; 5 =
„Strongly Agree‟
FN
B
ABSA STAND
ARD
BANK
NEDB
ANK
CAPIT
EC
BANK
POSTBA
NK
I often notice and pay attention
to the bank‟s media advertising
I often notice and pay attention
to information the bank sends to
me such as sms‟s or emails.
The bank is well known to be
responsible for caring for
society
The bank has respectful staff
who help customers well
The image of the bank fits my
personality well
Relationship related drivers
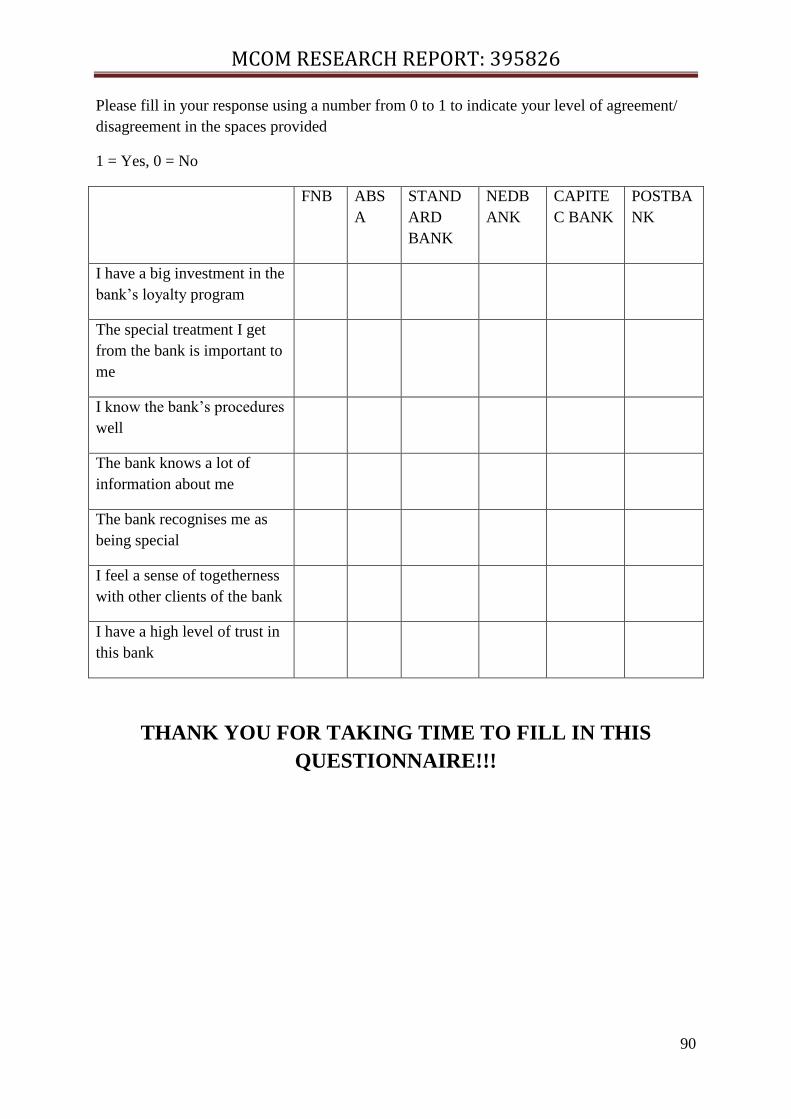
MCOM RESEARCH REPORT: 395826
90
Please fill in your response using a number from 0 to 1 to indicate your level of agreement/
disagreement in the spaces provided
1 = Yes, 0 = No
FNB ABS
A
STAND
ARD
BANK
NEDB
ANK
CAPITE
C BANK
POSTBA
NK
I have a big investment in the
bank‟s loyalty program
The special treatment I get
from the bank is important to
me
I know the bank‟s procedures
well
The bank knows a lot of
information about me
The bank recognises me as
being special
I feel a sense of togetherness
with other clients of the bank
I have a high level of trust in
this bank
THANK YOU FOR TAKING TIME TO FILL IN THIS
QUESTIONNAIRE!!!
MCOM RESEARCH REPORT: 395826
91
Appendix B: Focus group questions
Focus Group Conduction for the FNB sustainable development assignment:
Focus groups are "small groups of unrelated individuals that are formed by the researcher
and then led in a group discussion of a topic" (Schutt, 1999: 308). Focus groups are similar
to interviewing people one-on-one but there are important differences. When conducting an
individual interview the researcher is trying to learn about biographical details, political
opinions, product preferences, etc., and how the individual interprets aspects of the social
world. But these remain essentially the self-reflections of just one person (unless a suitable
sample size is attained and aggregated to produce group measures). In a focus group, the
object of the analysis is the interactions among the group members— how the group
collectively creates meanings and negotiates definitions of whatever is discussed. Focus
groups thus have the strength of being a more "natural" than one-on-one interviews which
are by comparison more structured and somewhat more artificial.
www.nd.edu/~fwriting/fyc/instructors/documents/FocusGroups.doc
Date: 7 November 2010
Venue: Hyde Park
Time: 12:30
The focus group in question was conducted in vernacular language but will be transcribed to
English for ease of understanding.
Onke: We are here to conduct a focus group to determine which banks you are currently at,
why and whether or not you would consider leaving the bank. Will be going through some
questions with you to help gain a better understanding of the banks that you currently use and
wish to use.
So we would like to ask each of you, which bank you currently bank with?
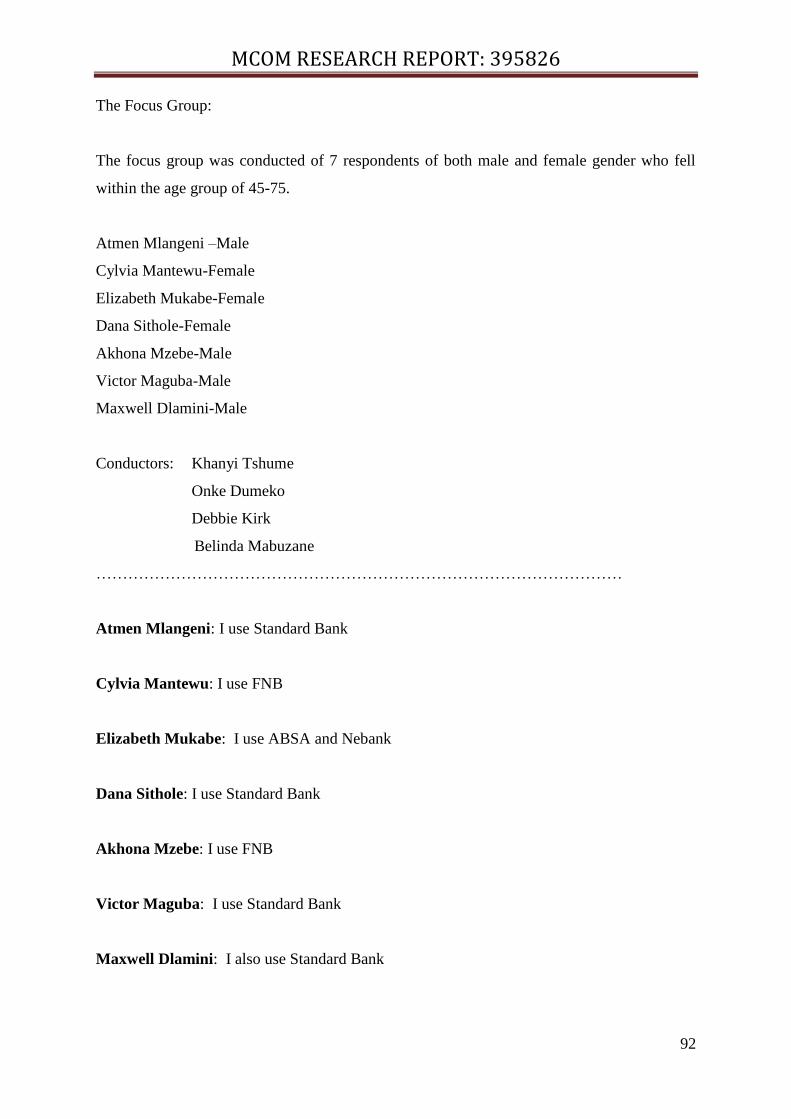
MCOM RESEARCH REPORT: 395826
92
The Focus Group:
The focus group was conducted of 7 respondents of both male and female gender who fell
within the age group of 45-75.
Atmen Mlangeni –Male
Cylvia Mantewu-Female
Elizabeth Mukabe-Female
Dana Sithole-Female
Akhona Mzebe-Male
Victor Maguba-Male
Maxwell Dlamini-Male
Conductors: Khanyi Tshume
Onke Dumeko
Debbie Kirk
Belinda Mabuzane
………………………………………………………………………………………
Atmen Mlangeni: I use Standard Bank
Cylvia Mantewu: I use FNB
Elizabeth Mukabe: I use ABSA and Nebank
Dana Sithole: I use Standard Bank
Akhona Mzebe: I use FNB
Victor Maguba: I use Standard Bank
Maxwell Dlamini: I also use Standard Bank
MCOM RESEARCH REPORT: 395826
93
Onke: Ok, those you use FNB please tell us why?
Akhona: FNB is ok, compared to Standard Bank as when there is money that is meant to
show it will show late so that why I prefer FNB as this does not happen. Standard Bank is
too strict.
Onke: And those who use Standard Bank, tell us why and what you like about it?
Atmen: I just like standard bank
Onke: So if you could change to another bank, say FNB or ABSA would you?
Atmen: No, I wouldn‟t as I Iike the bank.
Victor: I would not leave Standard Bank either as it gives me no problems, my money
doesn‟t come in late.
Elizabeth: I like ABSA because even if you have R50 in your account they won‟t close it, but
with Nedbank I regret it as they have too many charges. I use Nedbank for my transactions.
Khanyi: So you use these accounts when wanting to purchase groceries and such?
Elizabeth: Well yes, but I used to use FNB for my stockvel money in a group. We found that
the money was ok and the returns were fine.
Victor: I use Standard Bank as right now I am unemployed so I find Standard Bank to be the
easiest as even though I have no money they will not close my account, but FNB does this
and it is very upsetting and inconvenient. You‟ll find that I sometimes get a little money here
and there from my „peace jobs‟ but the people try to put money in my account and find that
they cannot as it has been closed without my knowledge.
MCOM RESEARCH REPORT: 395826
94
The majority of the group agrees with Victors point and say that this is one of the big and
important reasons for them to not bank or to leave FNB.
Cylvia: I use ABSA bank, because I think it suits me and I have had no problems so far with
it.
Maxwell: Yes I use Standard Bank but only because I get paid in that bank. The people I
work for opened the account for me so that is why I use it. Even if I wanted to leave or not
Standard Bank is where I am told to go to get paid.
Khanyi: We would like to know about what you think FNB does and etcetera what more do
you think FNB should do to better itself.
Elizabeth: I think FNB is an ok bank, but what they need to do is to stop closing our
accounts, even if we have R50 in the account at least there is something there so to just close
the accounts without us knowing makes no sense.
Onke: What do you think FNB can do to better the community? Could it sponsor schools or
what?
Atmen: I think what they could do is to help the people, maybe by sponsoring RDP houses or
something to that effect or they could place some temporary houses around just to support the
people.
Victor: My main concern is that they need to have a pensioners fund for our parents as they
are important to us.
Khanyi: Do you think FNB should educate their consumers in terms of explaining to you
guys what it means to open this account or what the interest rates are or what you are paying
for and things like that?
Group: Yes we think that should happen because when they say sign we just sign without
knowing what we are signing for exactly. They need to educate us more so we can use our
accounts better and know what we have „gotten‟ ourselves into.
MCOM RESEARCH REPORT: 395826
95
Khanyi: So if they do help build houses and teach their consumers more would you think
FNB is a better bank or do you think it is something they should do anyway?
Maxwell and Elizabeth: Yes they should do it anyway as they are a bank that wants to help
people. If they do this more people would go to FNB and some of us would go back.
Khanyi: Are you guys aware of anything that FNB does for the community or South Africa?
Group: No not really
Khanyi: Well FNB does have campaigns and things that they do to help your communities
out.
Elizabeth: Well if that is the case then maybe they should tell us about them so that we also
know and can maybe help were we can. We like good things to happen in our communities.
Khanyi: Ok, so what do you guys think of the other banks such a Capitec Bank and
PostBank?
Elizabeth: We would like Capitec but it is not in our area. They call us to tell us that we can
open an account with R10 but it is not around.
Onke: Do you guys think that Bank fees are too much?
Victor: Yes well I believe FNB has higher interests than the other banks.
Onke: So for you guys your main problem is that it closes your accounts.
Elizabeth: The bank is ok in terms of transactions, investments and such.
MCOM RESEARCH REPORT: 395826
96
Akhona: What I would like to know is why they take a long time to send transactions from
one account to another account or bank?
Maxwell: My main concern is that when they say I must go and take my money from the
bank I find that it is less than the amount they said would be in it. If I‟m supposed to get
R2000 for my work then that‟s what I should get. I can be getting my money taken away
every time I go to an ATM.
Khanyi: So would you prefer a bank with no interests when taking out your money?
Maxwell: Well yes, if that is even possible as I don‟t like this money taking thing that they
do. I work fully so I must get my money fully.
Khanyi: I‟m sure this is a big problem as you guys budget this money so when it does not
come in, in full you can‟t do the things you wanted to do with the money so your month gets
disorganised.
Group: Yes definitely.
[Another participant joins the group]
Onke: Hi sisi, I would just like to ask which bank you use?
Dana: I use Standard Bank and FNB
Onke: What do you use with the FNB and Standard Bank accounts?
Dana: I just use both as savings accounts
Onke: What do you like about FNB?
Dana: I like FNB because they have funeral policies, the service is good but what I don‟t like
is the fees, they are too expensive.
MCOM RESEARCH REPORT: 395826
97
Onke: What about Standard Bank?
Dana: Standard Bank is expensive but is reasonable.
Onke: What do you think FNB can do to better itself?
Dana: FNB has many charges and you find that when you get your statement you do not
know what these charges are or what they mean. So they need to explain to us what they are
or write them out fully on the statement and not the short version of it. They don‟t explain to
us how you get these interests, whether it is from EFT at Pick n Pay or from withdrawing.
Onke: Would you leave any of your banks?
Dana: No I wouldn‟t.
Debbie: We are currently working on a new product where you only pay one amount once off
R60 a month only. R59.99 paid every month as long as you do not go into a branch, so you
can use your phone for cellphone banking or go to an ATM and deposit money without any
extra charges. You also get R10000 funeral cover as a member.
Group: That would be a better account to have. We did not know that such an account existed
or is about to exist.
MCOM RESEARCH REPORT: 395826
98
Conclusion:
From the focus group we found that the consumers did not appreciate the closing of their
accounts without their knowledge as even though they may not have money in the account in
that month they could still get an income somewhere and need the surety that their accounts
will still be there when they tell the employer which account to deposit the money in. As the
group voiced, “Yes we think that should happen because when they say sign we just sign
without knowing what we are signing for exactly. They need to educate us more so we can
use our accounts better and know what we have „gotten‟ ourselves into.” They found it very
embarrassing and frustrating when the employer came back to inform them that that account
no longer exists.
The groups‟ responses showed that a lot more education needs to occur at the front desk
when they want to open an account and continuously as they use the account. They found it
frustrating to find all of these amounts deducted from their accounts without knowing what
they are and what they are there for. They state that if they could be educated about these fees
then they would try to avoid having them at all.
FNB would also need to voice their initiatives in social development as the group was
unaware of any of the good endeavours that they did in communities. The respondents stated
that if they knew about what FNB did in their communities more people would join the bank.