McGraw-Hill Global Education Holdings, LLC · CURRENT REPORT Pursuant to: (i) Section 4.02(a)(iii)...
57
CURRENT REPORT Pursuant to: (i) Section 4.02(a)(iii) of the Indenture, dated May 4, 2016, governing the 7.875% Senior Notes due 2024 of McGraw-Hill Global Education Holdings, LLC and McGraw-Hill Global Education Finance, Inc. and (ii) Section 6.02(a)(iii) of the Term Loan Agreement, dated April 20, 2018, among MHGE Parent, LLC, the lenders party thereto and Ares Agent Services, L.P., as administrative agent May 6, 2019 Date of Report (Date of earliest event reported) McGraw-Hill Global Education Holdings, LLC 2 Penn Plaza, 20 th Floor New York, New York 10121 Telephone: 646-766-2626
Transcript of McGraw-Hill Global Education Holdings, LLC · CURRENT REPORT Pursuant to: (i) Section 4.02(a)(iii)...

CURRENT REPORT
Pursuant to:
(i) Section 4.02(a)(iii) of the Indenture, dated May 4, 2016, governing
the 7.875% Senior Notes due 2024 of
McGraw-Hill Global Education Holdings, LLC
and
McGraw-Hill Global Education Finance, Inc.
and
(ii) Section 6.02(a)(iii) of the Term Loan Agreement, dated April 20, 2018,
among MHGE Parent, LLC,
the lenders party thereto
and
Ares Agent Services, L.P., as administrative agent
May 6, 2019
Date of Report (Date of earliest event reported)
McGraw-Hill Global Education Holdings, LLC
2 Penn Plaza, 20th Floor
New York, New York 10121
Telephone: 646-766-2626

Item 1.01 Entry into a Material Definitive Agreement
On May 1, 2019, Cengage Learning Holdings II, Inc. (“Cengage”), Cengage Learning Holdco,
Inc. (“Cengage Intermediate Holdco”), Cengage Learning, Inc. (“Cengage Issuer”), McGraw-Hill
Education, Inc. (“McGraw-Hill”) and McGraw-Hill Global Education Holdings, LLC (“McGraw-Hill
Issuer”) entered into an Agreement and Plan of Merger (the “Merger Agreement”) pursuant to which,
among other things, Cengage will merge with and into McGraw-Hill Issuer (the “Merger”), with
McGraw-Hill Issuer continuing as the surviving corporation of the Merger.
Immediately prior to the effective time of the Merger (the “Effective Time”), McGraw-Hill will
amend and restate its certificate of incorporation (the “Certificate Amendment”) to, among other things,
(1) authorize three new classes of common stock: Class A common stock, par value $0.01 per share (the
“Class A Common Stock”), Class B common stock, par value $0.01 per share (the “Class B Common
Stock”) and Class C common stock, par value $0.01 per share (the “Class C Common Stock”), and (2)
effect certain governance arrangements for the combined company, including that the combined company
will have a nine-person board of directors, four members of which will be appointed by a majority of the
holders of Class A Common Stock (one of which will be an independent director), four members of
which will be appointed by a majority of the holders of Class B Common Stock (one of which will be an
independent director) and one member of which shall be the chief executive officer of the combined
company. The Certificate Amendment will also provide that any action of the combined company board
of directors will generally require the vote of at least five directors (not counting the chief executive
officer), and will grant to certain stockholders of the combined company preemptive rights, tag-along
rights and registration rights.
Pursuant to the Merger Agreement, upon the terms and subject to the conditions of the Merger
Agreement, at the Effective Time, (1) each share of McGraw-Hill common stock, par value $0.01 per
share, will convert into one share of Class A Common Stock, and (2) each share of Cengage common
stock, par value $0.01 per share (the “Cengage Common Stock”), will convert into a certain number of
shares of Class B Common Stock such that, as of the Effective Time, the aggregate number of issued and
outstanding shares of Class A Common Stock will equal the aggregate number of issued and outstanding
shares of Class B Common Stock. Accordingly, the legacy stockholders of McGraw-Hill and the legacy
stockholders of Cengage will, as of the Effective Time, each collectively own exactly 50% of the issued
and outstanding shares of voting common stock of the combined company.
Pursuant to the Merger Agreement, outstanding McGraw-Hill equity-based awards will be treated
as follows (collectively, the “Treatment of McGraw-Hill Equity Awards”):
• At the Effective Time, each McGraw-Hill restricted stock unit award that is outstanding
as of immediately prior to the Effective Time, each vested McGraw-Hill option with an
exercise price greater than $75 per share and each unvested McGraw-Hill option will, in
each case, be converted into a corresponding award relating to shares of Class C
Common Stock, and such converted awards shall otherwise be governed by the same
terms and conditions following the Effective Time; and
• No later than immediately prior to the Effective Time, each McGraw-Hill option with an
exercise price equal to or less than $75 per share will be settled in a number of shares of
McGraw-Hill Common Stock equal to the number of shares of McGraw-Hill Common
Stock subject to such award minus the number of shares of McGraw-Hill Common Stock
withheld to satisfy the aggregate exercise price applicable to such award, and minus any
shares withheld to satisfy applicable tax withholding in connection with such settlement,
and such remaining deliverable shares of McGraw-Hill Common Stock will be converted

into shares of Class A Common Stock at the Effective Time like all other shares of
McGraw-Hill Common Stock.
The respective boards of directors of McGraw-Hill and Cengage have unanimously approved the
Merger Agreement and the treatment of equity awards, as applicable. The holders of a majority of the
outstanding shares of Cengage Common Stock have executed a written consent adopting and approving
the Merger Agreement and the transactions contemplated thereby, including the Merger.
The closing of the proposed transaction is subject to the satisfaction or waiver certain conditions,
including (1) the expiration or termination of the waiting period under the Hart-Scott Rodino Antitrust
Improvements Act of 1976, as amended, and receipt of regulatory approvals in other jurisdictions, (2) the
absence of any law or order prohibiting consummation of the Merger or requiring divestiture of either
party’s assets that produced net revenues in excess of $175 million during calendar year 2018, (3) the
consent by lenders holding at least ninety percent (90%) of the principal amount of the term loans under
each of Cengage Issuer’s and McGraw-Hill Issuer’s existing credit agreements to amend the respective
credit agreements and extend the maturity of the term loans, (4) the accuracy of each party’s
representations and warranties, subject in most cases to materiality or material adverse effect
qualifications, (5) material compliance with each party’s covenants, (6) the receipt of a written opinion
from each party’s counsel, in form and substance reasonably satisfactory to such party, dated as of the
closing date, to the effect that the Merger will qualify as a “reorganization” within the meaning of Section
368(a) of the Internal Revenue Code of 1986, as amended, and (7) effectiveness of the Certificate
Amendment and related changes to McGraw-Hill’s board of directors. McGraw Hill’s obligation to
consummate the closing is also subject to receipt of certain third party consents by Cengage.
The Merger Agreement contains customary representations and warranties made by each party.
McGraw-Hill and Cengage have also agreed to various customary covenants and agreements, including,
among others, to conduct their respective business in the ordinary course during the period between the
execution of the Merger Agreement and the Effective Time, and to use reasonable best efforts to obtain
all requisite regulatory approvals.
The Merger Agreement contains certain termination rights for McGraw-Hill and Cengage. The
Merger Agreement can be terminated by mutual written consent, or by either party (1) if there is a law or
order prohibiting the consummation of the Merger, (2) if the Merger has not been consummated by
February 1, 2020 (the “Outside Date”), which Outside Date may be extended by either party to May 1,
2020 and, after such extension, extended by mutual agreement of the parties to August 1, 2020, or (3) if
the other party has breached its representations, warranties or covenants in a way that prevents
satisfaction of a closing condition, subject to a cure period.
Item 7.01 Regulation FD Disclosure
On May 6, 2019, McGraw-Hill Issuer announced that it is seeking an amendment of its existing
senior secured credit facilities in connection with the Merger, including to extend the maturity of the
revolving facility commitments and the term loans thereunder. The proposed amendment is subject to
market and other conditions. A copy of the relevant lender presentation is attached as Exhibit 99.1.
The information in this Item 7.01, including Exhibit 99.1, is furnished to comply with Regulation
FD.
Item 9.01 Financial Statements and Exhibits
(d) Exhibits

Exhibit No. Description
99.1 Lender Presentation, dated as of May 6, 2019

SIGNATURE
The Company has duly caused this report to be signed on its behalf by the undersigned hereunto duly
authorized.
McGraw-Hill Global Education Holdings, LLC
Date: May 6, 2019 By: /s/ David B. Stafford
Name: David B. Stafford
Title: Senior Vice President and General
Counsel

LENDER PRESENTATION
M A Y 2 0 1 9 | C O N F I D E N T I A L
Black text / Grey underline
Bullets use same grey
On March [ ], 2019, McGraw-Hill Education, Inc.
Headings (202/202/202) – 2nd one down

0, 39, 72
37, 93, 143
135, 135, 135
202, 202, 202
229, 27, 36
255, 182, 0
Disclaimer
2
This presentation includes statements that are, or may be deemed to be, “forward-looking statements.” These forward-looking statements can be identified by the use of forward-looking terminology, including the terms “believes,” “estimates,” “anticipates,” “expects,” “intends,” “plans,” “may,” “will” or “should” or, in each case, their negative or other variations or comparable terminology. These forward-looking statements include all matters that are not historical facts. They appear in a number of places throughout this presentation and include statements regarding our intentions, beliefs or current expectations concerning, among other things, our results of operations, financial condition, liquidity, prospects, growth, strategies and the industry in which we operate. By their nature, forward-looking statements involve risks and uncertainties because they relate to events and depend on circumstances that may or may not occur in the future. We caution you that actual results during the period or periods covered by forward-looking statements may differ significantly from projected results and that no assurance can be given that the projected results will be realized. In addition, even if our results of operations, financial condition and liquidity, and the development of the industry in which we operate are consistent with the forward-looking statements contained in this presentation, those results of operations, financial condition and liquidity or developments may not be indicative of results or developments in subsequent periods. Any forward-looking statements we make in this presentation speak only as of the date of such statement, and we undertake no obligation to update such statements. Comparisons of results for current and any prior periods are not intended to express any future trends or indications of future performance, unless expressed as such, and should only be viewed as historical data. The 2019 fiscal year financial results presented herein are unaudited and subject to finalization. We caution that the preliminary financial results for the 2019 fiscal year are not guarantees of future performance or outcomes and that actual results may differ. Such preliminary results are subject to the closing of the 2019 fiscal year and finalization of accounting and reporting procedures, and should not be viewed as a substitute for fiscal year financial statements prepared in accordance with accounting principles generally accepted in the U.S. (“GAAP”) Non-GAAP Financial Measures Certain financial information included herein, including Cash Revenue, EBITDA, Adjusted Cash EBITDA, Pro Forma Adjusted Cash EBITDA and Pro Forma Adjusted Cash EBITDA margin are not presentations made in accordance with U.S. GAAP, and use of such terms varies from others in the same industry. Non-GAAP financial measures should not be considered as alternatives to income from continuing operations, income from operations or any other performance measures derived in accordance with U.S. GAAP as measures of operating performance or cash flows as measures of liquidity. Non-GAAP financial measures have important limitations as analytical tools, and you should not consider them in isolation or as substitutes for results as reported under U.S. GAAP. This presentation includes a reconciliation of certain non-GAAP financial measures to the most directly comparable financial measures calculated in accordance with U.S. GAAP.

0, 39, 72
37, 93, 143
135, 135, 135
202, 202, 202
229, 27, 36
255, 182, 0
Adam Reiss
• Managing Director, Searchlight Capital
Nana Banerjee
• CEO, McGraw-Hill
Mike Evans
• CFO, McGraw-Hill
Itai Wallach
• Principal, Apollo Global Management
Michael Hansen
• CEO, Cengage
Kermit Cook
• Managing Director, KKR
Meeting Participants
3
Bob Munro
• CFO, Cengage

0, 39, 72
37, 93, 143
135, 135, 135
202, 202, 202
229, 27, 36
255, 182, 0
4
Agenda
1 Transaction Overview
2 Strategic Rationale
3 Key Credit Highlights
4 Financial Overview
Q & A
Appendix

Transaction Overview

0, 39, 72
37, 93, 143
135, 135, 135
202, 202, 202
229, 27, 36
255, 182, 0
Executive Summary
6
Cengage Learning Holdings II, Inc. (“Cengage”) and McGraw-Hill Education, Inc. (“McGraw-Hill”) have entered into a definitive merger agreement to create a leading provider of curated educational content and digital learning solutions (together, the “Combined Company”)
− The merger will be structured as a merger of equals, in which existing Cengage shareholders and existing McGraw-Hill shareholders will each retain 50% of the pro forma corporate entity
− The transaction is expected to close in early 2020 (Jan-Mar)
− Pro forma for the merger, the Combined Company generated LTM 3/31/19 Cash Revenue and PF Adjusted Cash EBITDA of $3,157 million and $916 million, respectively (29% margin) (1)
The Cengage and McGraw-Hill merger is highly synergistic with a unique value proposition in a transforming and compelling market:
− Increased scale in Higher Education, International and K-12 markets leading to opportunities for accelerated revenue growth
− Significant savings and additional synergies through headcount rationalization, facility consolidation and distribution efficiencies
− Enhanced financial profile and deleveraging provides substantial runway to execute on growth strategy
Combined Company Profile:
− Well positioned to deliver superior learning experiences and greater value for students and educators from best-in-class content, proven digital platforms and a continued commitment to affordability
− Full continuum of both print and world-class digital learning solutions for learners at every age and stage
− Sole provider of core instructional material covering the learning continuum – from kindergarten to degree to professional
As part of the Transaction, the Combined Company is offering existing Cengage and McGraw-Hill lenders an opportunity to extend or exchange into a combined term loan tranche of up to $3,342 million with extended maturity to May 2024 to provide additional liquidity:
− Seeking amendment consent from >90% of each of the existing Cengage and McGraw-Hill term loan lenders
As part of this Transaction, the Combined Company will have the following liquidity facilities: $350 million Revolving Credit Facility, $150 million (anticipated liquidity) AR Securitization Facility
− At time of closing, PF company is expected to have in excess of $600 million in cash bringing total liquidity to ~$1.1 billion
Pro forma for the Transaction, first lien net and total net leverage will be 3.1x and 4.5x, respectively, providing significant de-leveraging for the Combined Company
Note: Company logos and representation placed in alphabetical order throughout the presentation. (1) Includes $328 million of estimated pro forma cost synergies.
0, 39, 72
37, 93, 143
135, 135, 135
202, 202, 202
229, 27, 36
255, 182, 0
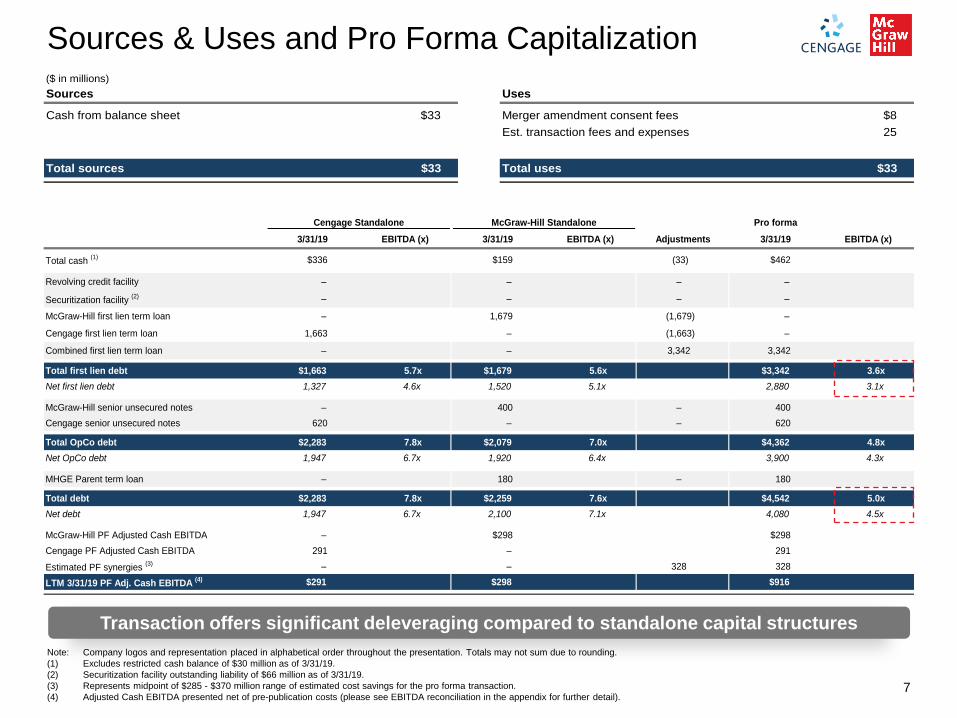
Cengage Standalone McGraw-Hill Standalone Pro forma
3/31/19 EBITDA (x) 3/31/19 EBITDA (x) Adjustments 3/31/19 EBITDA (x)
Total cash (1) $336 $159 (33) $462
Revolving credit facility – – – –
Securitization facility (2) – – – –
McGraw-Hill first lien term loan – 1,679 (1,679) –
Cengage first lien term loan 1,663 – (1,663) –
Combined first lien term loan – – 3,342 3,342
Total first lien debt $1,663 5.7x $1,679 5.6x $3,342 3.6x
Net first lien debt 1,327 4.6x 1,520 5.1x 2,880 3.1x
McGraw-Hill senior unsecured notes – 400 – 400
Cengage senior unsecured notes 620 – – 620
Total OpCo debt $2,283 7.8x $2,079 7.0x $4,362 4.8x
Net OpCo debt 1,947 6.7x 1,920 6.4x 3,900 4.3x
MHGE Parent term loan – 180 – 180
Total debt $2,283 7.8x $2,259 7.6x $4,542 5.0x
Net debt 1,947 6.7x 2,100 7.1x 4,080 4.5x
McGraw-Hill PF Adjusted Cash EBITDA – $298 $298
Cengage PF Adjusted Cash EBITDA 291 – 291
Estimated PF synergies (3) – – 328 328
LTM 3/31/19 PF Adj. Cash EBITDA (4) $291 $298 $916
Sources & Uses and Pro Forma Capitalization
7
($ in millions)
Sources Uses
Cash from balance sheet $33 Merger amendment consent fees $8
Est. transaction fees and expenses 25
Total sources $33 Total uses $33
Note: Company logos and representation placed in alphabetical order throughout the presentation. Totals may not sum due to rounding.
(1) Excludes restricted cash balance of $30 million as of 3/31/19.
(2) Securitization facility outstanding liability of $66 million as of 3/31/19.
(3) Represents midpoint of $285 - $370 million range of estimated cost savings for the pro forma transaction.
(4) Adjusted Cash EBITDA presented net of pre-publication costs (please see EBITDA reconciliation in the appendix for further detail).
Transaction offers significant deleveraging compared to standalone capital structures

Strategic Rationale

0, 39, 72
37, 93, 143
135, 135, 135
202, 202, 202
229, 27, 36
255, 182, 0
790 702
1,492 162
602
764
298
257
554
225
347
122 $1,474
$1,682
Higher Education K-12 International Gale/Professional
9
Combination Creates an Enhanced Portfolio, Increasing Scale to Promote Faster Growth
Market leadership in affordable digital learning and burgeoning direct to
student / D2C brand
Revered brand with +130 year history, market leading tech platforms and tools,
along with deep author relationships
Leading global learning solutions provider with strong, recurring
customers and revenue
Add legend for segments Show the growing scale
Replace with stacked bars to show the growth in absolute scale in addition to overlap / diversity
($ in millions) $3,157
Note: Company logos and representation placed in alphabetical order throughout the presentation. Figures in the bar chart represent FY 3/31/19 revenue. Totals may not sum due to rounding. Cengage reports revenues in annual and quarterly reports in three segments, namely Learning, International and Gale. For the purposes of this presentation estimates have been made to allocate the Learning segment between Higher Education and K-12.
(1) McGraw-Hill Higher Education segment includes $3m of Other revenue. (2) Cengage includes Gale of $225m and McGraw-Hill includes Professional of $122m.
Combined, the two companies provide unparalleled access and affordability to students, instructors and institutions across the learning continuum
15%
20%
11%
54%
7%
15%
36%
42%
11%
18%
24%
47%
$291m, 20% $298m, 18% $916m, 29% Adj. Cash EBITDA, Margin
(1) (2)

0, 39, 72
37, 93, 143
135, 135, 135
202, 202, 202
229, 27, 36
255, 182, 0
10
Proposed Merger Drives Revenue Growth, Synergies and Enhances Financial Profile
Increases global scale providing an opportunity to accelerate revenue growth from an expanding portfolio of high-quality, curated learning materials
Higher Ed:
— Increases sales coverage deepening relationships at the institution level to drive incremental Inclusive Access revenues and digital activations
— Accelerates offering of affordable, high-quality solutions to students and faculty through Unlimited subscription offering
K-12:
— Complementary offerings: Combination of McGraw-Hill’s proven offerings across all subjects and grades and Cengage’s HS/AP products creates a K-12 segment with a greater breadth of offerings, increased sales coverage and greater stability
International:
— Increases scale in key growth countries (China, India, Middle East) to drive higher revenue growth
$285-370m of annual cost synergies over next 3 years (11% – 14% of addressable costs)
Cost takeout drops to the bottom line and improves EBITDA while also delevering the balance sheet
Enhances financial profile creating an opportunity to capture larger share of relevant adjacencies within the global education market
Opportunity to accelerate industry movement away from traditional textbook model to recurring digital model
Enhances Scale Leading to Increased Revenue
Growth
Synergies / Significant Cost Takeout
Enhances Financial Profile to Delever and
Enter Adjacent Markets
Note: Company logos and representation placed in alphabetical order throughout the presentation.
1
2
3

0, 39, 72
37, 93, 143
135, 135, 135
202, 202, 202
229, 27, 36
255, 182, 0
“Best-in-Class” Products and Author Franchises
11
Slide owner: FSG
130+ years developing portfolio of market leading titles and proprietary content
[ 17,504 for MHE, 4,894 for CNG ] authors and educators in various fields of study
[1,792+ for CNG] Digital products
[4,583 for MHE, 6,112 for CNG] Higher Education institutions
[MHE cannot support, maybe remove, 140.048 for CNG]+ Higher Education instructors
[13,584 for MHE, Need for CNG ]+ K-12 School Districts
[4,363,861 Connect + Connect International ] Higher Education paid activations of Connect / LearnSmart
#1 trade publisher of foreign language book and learning materials in North America
~[100+ for MHE, 186 countries for CNG] Countries, [ ] countries with offices outside of the US
[ 1,414 for MHE, 1,125 total] person sales force with significant international coverage and every U.S. state
[8,000]+ employees globally
Note: Company logos and representation placed in alphabetical order throughout the presentation.
At scale, “best-of-both” integration possible with complementary product portfolios
20,000+
Authors and educators in various fields of study
44,000+
Titles
70+
Disciplines covered
50+
Nobel Laureate contributors
1
Rich Catalogue of Products Leading Author Franchises

0, 39, 72
37, 93, 143
135, 135, 135
202, 202, 202
229, 27, 36
255, 182, 0
Diverse Suite of Technology Platforms and Learning Tools with 10m+ Annual Activations
Extensive user base across all platforms
Range of platforms that support learning across the complete learning cycle
Market-leading support functionality for learners and instructor needs
Leading personalized learning engines to support learners with diverse abilities
Add legend for MHE vs CL
Replace with lifelong (K-Career) dimension Show distribution of platforms at scale used for mix of specialized, age-focused and generalist needs across K-C journey
12 Note: Company logos and representation placed in alphabetical order throughout the presentation. (1) Represents a select set of Cengage and McGraw-Hill products and is not a comprehensive illustration of all offerings.
Comprehensive digital ecosystem provides complete end-to-end education solution (1)
1
Extensive and growing user base across the learning continuum
Leading provider of adaptive technologies to support learning process with billions of cumulative interactions
Market-leading support for learner and instructor needs
McGraw-Hill Cengage
K – 12 Higher Education Professional
Market-Leading Learning Tools and Adaptive Technologies
Platforms

0, 39, 72
37, 93, 143
135, 135, 135
202, 202, 202
229, 27, 36
255, 182, 0
Higher Education Moving From “High-Price-Point Unit-Based” Business to Highly Digital Subscription-Based Business that Significantly Enhances Student Affordability
1
13
Combined Company delivers end-to-end digital solutions aligning price-to-value that helps all 3 stakeholders (individual learners, instructors and institutions) succeed
− Builds lasting and direct relationship with all stakeholders
Cost synergy supports focus on affordability and elimination of legacy costs that are no longer necessary
Combination allows Company to focus on quality learning materials, unlocking student outcomes at scale
Smart reinvestment in product content and platform technology provides an enhanced user experience at affordable pricing
Print textbooks with high prices and new edition focused strategy
Secondary markets put significant pressure on revenues
Internet enabled re-selling models
Increased supply of counterfeit and illegal downloads
Legacy publishers selling at excessive unit prices failed to deliver value to customers that solved their needs
− Flat product that was updated on schedule to chase profits
− Ineffective and unimplemented technology
− Little focus on student outcomes
From: Legacy Industry Dynamics and Missteps To: Focus on Affordability and Digital Learning
Note: Company logos and representation placed in alphabetical order throughout the presentation.
Increased focus on affordability, quality and choice through enhanced digital delivery
Less predictable and declining revenue
Diminishing value proposition
Pressure on profits
More predicable revenue and visibility
More recurring revenue
Opportunities to drive profitability built both on cost and revenue
Ability to reinvent and reinvest in product innovation and digital transformation without compromising on affordability, quality or choice

0, 39, 72
37, 93, 143
135, 135, 135
202, 202, 202
229, 27, 36
255, 182, 0
14
Strengthens commitment to expanded suite of affordable options: Commitment to high quality affordable solutions Inclusive Access and Unlimited programs Potential opportunity to combine content and broaden
program offerings
Delivers superior experience and value: “Best-in-class” content, proven digital platforms
and affordability Superior experiences and greater value for students and
educators Learning platforms enable students to achieve their
full potential Advanced analytics to better equip educators to act
earlier
Higher Education Combined Company Delivers More Value to Students and Educators
Best-in-Class Curated Content
Proven Digital Platforms &
Learning Tools
Expanded Suite of Affordable
Options
Superior Experience &
Value
1
Expands access to “best-in-class” curated content:
Features 44,000+ titles from leading academics and experts, representing proven approaches to teach a wide variety of subjects
Enhances learning experiences through proven digital platforms and learning tools:
Creates better user experiences for all students globally
Seamless integration with other platforms, tools and applications
Reduced leverage profile allows for increased investment and innovation
Combined Company offers a range of “best-in-class” content – delivered through digital
platforms at an affordable price, providing students high quality learning materials to succeed
Note: Company logos and representation placed in alphabetical order throughout the presentation.

0, 39, 72
37, 93, 143
135, 135, 135
202, 202, 202
229, 27, 36
255, 182, 0
Driving affordability push with 600+ institutions under partnership
50-80% lower cost to student than print textbook
Inclusive Access business $100m+ across Combined Company and rapidly growing
First of its kind subscription model for higher education content
Key student focused partnerships with over $200 in value, included as part of affordable subscription price
1m+ subscriptions and $60m+ saved for students within 7 months of launch
Unlimited Inclusive Access Rental
Affordability focused rental program with key channel partners
Protects intellectual property associated with curated content and limits supply of used print market
Higher Education Proven Digital Platforms and More Affordable Options
Combined Company accelerates student affordability initiatives by providing students access to an expanded portfolio of high-quality, curated learning materials and technology
platforms at a lower cost
Note: Company logos and representation placed in alphabetical order throughout the presentation.
Digital Print
1
15
Network effect will be positively impacted by
adding content and augmenting services
Increased institutional coverage and relevancy will accelerate growth
Combination to enhance revenue capture and
improve student affordability

0, 39, 72
37, 93, 143
135, 135, 135
202, 202, 202
229, 27, 36
255, 182, 0
16
K-12 Combination Complements K-12 Focus Areas
Significant scale across all subjects and grades directly to 13,000+ U.S. school districts
Positioned to compete and increase market participation opportunities in all major new adoptions
Combination provides deep coverage in core instruction along with supplemental and intervention
Highly engaging AP & Elective High School products
Beloved National Geographic Learning brand with riveting content and imagery for early grades
Focus areas
Complementary product suites provide a more stable combined K-12 revenue base
World renowned, respected brand with proven offerings across all subjects and grades
Deep expertise, experience and relationships
Industry leading blended learning provider
Focus areas
Note: Company logos and representation placed in alphabetical order throughout the presentation.
1

0, 39, 72
37, 93, 143
135, 135, 135
202, 202, 202
229, 27, 36
255, 182, 0
17
International Combined Company is Well Positioned to Capture Global Growth
PF LTM 3/31/19 International Cash Revenue
$137m K-12
$103m English Language
Teaching
$86m Professional / Gale
Increased scale in key countries (China, India, M. East) drives higher revenue capture
Combination provides enhanced product offerings and curated content globally across the learning continuum
Opportunity to leverage product development resources and distribution channels to drive expansion opportunities
Cengage and McGraw-Hill have each developed trusted and recognizable global brands
Note: Company logos and representation placed in alphabetical order throughout the presentation. Fiscal year ending March 31. International Gale Cash Revenue attributed to Gale business segment. International Cash Revenue includes $5 million of Other Cash Revenue.
$269m Higher Education
Strong Partnerships
1
Combined presence of
Presence in
100+ Countries
Offices in
25+ Countries
2,000+
Global Sales Force
800+ Sales Force
Outside the U.S.
8,000+
Global Employees
2,000+ Employees
Outside the U.S.
• CNG SF outside of US: 464 • MH SG Outside of US: 421 • Total: 885 • CNG total employees outside of US: 1,115 • MH total employees outside of US: 1,040 • Total: 2,155
Source: 4/24/19 emails from Rebecca McNamara and Garet Guthrie

0, 39, 72
37, 93, 143
135, 135, 135
202, 202, 202
229, 27, 36
255, 182, 0
18
Segment-Specific Synergies Complement Overall Deal Rationale
Higher Ed.
K-12
International
Professional & Gale
“Best-of-both” merger
Reduction of cost structures and portfolio rationalization
Step-up in resourcing of digital innovation
Combination of Cengage white glove service and McGraw-Hill premier science-based learning
Combines McGraw-Hill’s leading portfolio, tech and sales reach with Cengage’s niche strengths in humanities, AP & CTE
Ability to efficiently share content across flagship programs
Significant opportunity to rationalize extensive and expensive global cost structure
Improved efficiency of the Higher Ed. content leverage model
Scale-up of the high growth ELT segment
Scaled positions in each overlapping country
Limited synergy opportunity but scale can be leveraged for growth
Note: Company logos and representation placed in alphabetical order throughout the presentation.
2

0, 39, 72
37, 93, 143
135, 135, 135
202, 202, 202
229, 27, 36
255, 182, 0
Highly Synergistic Cost Structure
19
1%
24%
11% 12% 3%
24%
7% 12% 9% 11%
Low High Total Cost Base
14%
$141
$46
$141
$282
$328
Year 1 Year 2 Year 3
Cumulative New
Pro Forma NewCo Cost Base & Planned Synergies Cumulative Mid-Point Run Rate Savings Actioned
$285-370m of identified cost savings only represent 11%-14% of total cost base(1)
12% 17%
8%
30%
4%
13%
30%
2%
17%
$285-370m of identified cost savings; Labor and headcount synergies represent ~65%, Non-labor and headcount represent ~35%
100% of business segment specific initiatives and more than 80% of total synergies actioned within two years
Note: Company logos and representation placed in alphabetical order throughout the presentation. (1) Total cost base as of 12/31/18.
($ in millions)
2

0, 39, 72
37, 93, 143
135, 135, 135
202, 202, 202
229, 27, 36
255, 182, 0
Need to highlight relevant adjacencies – e,g. workforce training and lifelong learning
3 3
4
5
6
8
10 Global Education and Training Expenditure (Trillion USD)
Enhanced Financial Profile Combination Creates Opportunities to Delever and Enter Relevant Adjacencies
Note: Company logos and representation placed in alphabetical order throughout the presentation. Source: HolonIQ and Wall Street Research. Global education and training expenditure mix is interpolated for years 2015 – 2025. (1) Includes Pre-K, K-12, and Post-secondary education.
Global education market is set to reach $10 trillion by 2030 from ~$6.5 trillion today
Growth driven by developing markets and need for re-skilling and up-skilling in developed economies
Expansion of existing market strategy by enhancing catalog and expanding into new territories with existing assets
Relevant Adjacencies from Growing Education Market
TBU - TMT
3
20
$2.7
$3.4
$4.1
$5.1
$6.4
$8.0
$10.0
2000A 2005A 2010A 2015A 2020E 2025E 2030E
Early and post-secondary Corporate Lifelong learning Total education
Global Education and Training Expenditure ($ in trillions)
(1)
Pro Forma De-leveraging Characteristics
Substantial synergies and cost take-out opportunities create an enhanced financial profile
Significant deleveraging characteristics provide flexibility for expansion into relevant adjacencies
6.7x 7.1x
4.5x
Cengage Standalone McGraw-Hill Standalone PF CombinedCo
(Total net leverage)

Key Credit Highlights
0, 39, 72
37, 93, 143
135, 135, 135
202, 202, 202
229, 27, 36
255, 182, 0
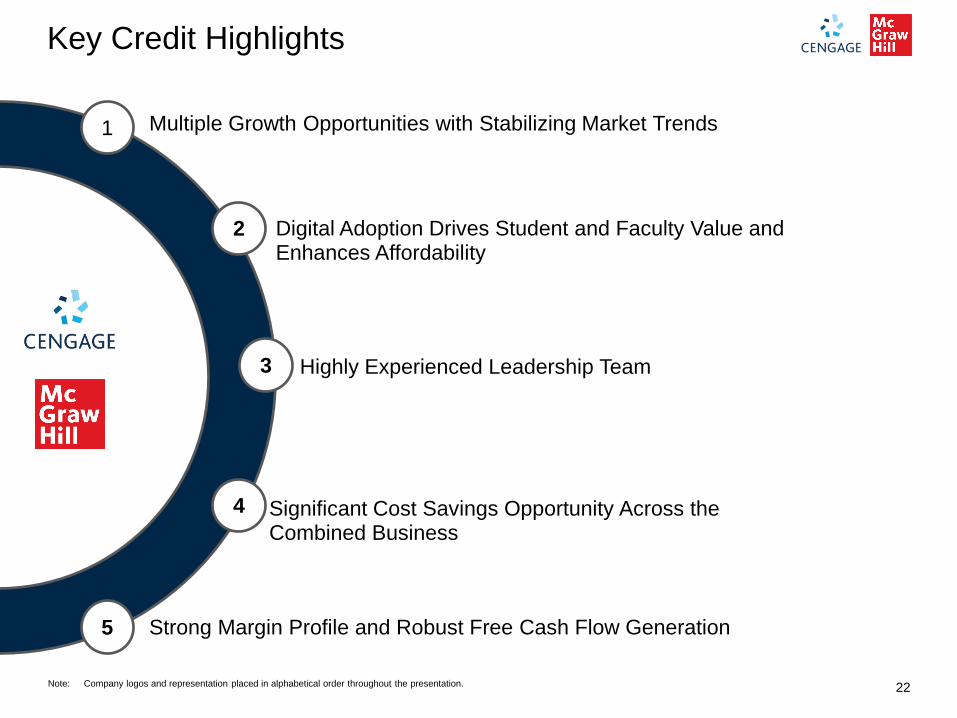
Key Credit Highlights
1
2
3
4
5
Multiple Growth Opportunities with Stabilizing Market Trends
Digital Adoption Drives Student and Faculty Value and Enhances Affordability
Highly Experienced Leadership Team
Significant Cost Savings Opportunity Across the Combined Business
Strong Margin Profile and Robust Free Cash Flow Generation
22 Note: Company logos and representation placed in alphabetical order throughout the presentation.

0, 39, 72
37, 93, 143
135, 135, 135
202, 202, 202
229, 27, 36
255, 182, 0
5
10
15
20
25
2000 2003 2006 2009 2012 2015 2018 2021 2024 2027
1 Multiple Growth Opportunities with Stabilizing Market Trends Long-term Stable Enrollment in Higher Education
Note: Company logos and representation placed in alphabetical order throughout the presentation. Source: US Department of Education, National Center for Education Statistics (published March 2018).
Enrollment in U.S. Degree-granting Institutions 2000 - 2027
Projected
(# in millions)
23
Higher education enrollment tends to be counter-cyclical
After a period of higher education enrollment growth, 2011 / 2012 experienced a shift and declined at a (1.4%) CAGR between 2011 and 2016, impacting all publishers as the economy continued to rebound from the economic recession
As economic growth and the higher education markets have begun to normalize, enrollment is expected to return to modest growth, projected at 0.3% between 2017 and 2027

0, 39, 72
37, 93, 143
135, 135, 135
202, 202, 202
229, 27, 36
255, 182, 0
$2.7
$3.0
$3.3 $3.1
$2.7 $2.6 ~$2.6
~$2.7-2.8 ~$2.7-2.8 ~$2.8-2.9
–
$0.5
$1.0
$1.5
$2.0
$2.5
$3.0
$3.5
$4.0
$4.5
$5.0
2012 2013 2014 2015 2016 2017 2018E 2019E 2020E 2021E
($ in billions)
24
Note: Company logos and representation placed in alphabetical order throughout the presentation. All future figures are McGraw-Hill estimates based upon addressable market. Core Basal Market includes New Adoption, Residual Adoption and Open Territory/Other. Opportunities in 2022 include Texas (Science) and Florida (Math). Years represent calendar years. All data updated as of March 2019.
Cyclical
adoption
trough
TX K-8
Reading,
CA SS and
Science
TX 9-12
ELA,
CA SS
and
Science
FL
Reading,
CA
Science
Cyclical new adoption patterns create strong future market opportunity with an underlying stable K-12 core basal base
1 Multiple Growth Opportunities with Stabilizing Market Trends K-12 Core Basal Market – Adoption and Open Territory
Residual Adoption and Open Territory / Other New Adoption

0, 39, 72
37, 93, 143
135, 135, 135
202, 202, 202
229, 27, 36
255, 182, 0
Digital Adoption Drives Student and Faculty Value and Enhances Affordability Approaching $1bn in Digital Investments FY ’16-’19 Has Driven Over $1bn in Higher Education Digital Revenue Over the Last 12 Months
25
Significant Combined Investments in R&D and Innovation… …Have Led to Digital Accounting for Nearly 80% of Combined Higher
Education Revenues as of FY 2019
~$1bn of combined investments in R&D innovation through the past 4 fiscal years
Digital revenue as a percentage of Higher Education has expanded by 1,500 bps from FY 2016 to FY 2019
Strong performance of Inclusive Access exhibiting 63% growth in FY 2019
Successful launch of Unlimited, posting over 1 million cumulative subscriptions in the first 7 months
2
$233 $236 $226
$212
FY 2016 FY 2017 FY 2018 FY 2019
Digital transition creating unique opportunity for Higher Education to improve classroom penetration and grow revenue, as professors adopt the most impactful and robust digital solutions
Note: Company logos and representation placed in alphabetical order throughout the presentation. Fiscal year ending March 31. Source: Company materials.
62%
71% 77% 77%
FY 2016 FY 2017 FY 2018 FY 2019
Higher Ed Investments ($ in millions)
Combined Higher Ed Revenue and Digital % ($ in millions)
$1,839 Total Higher Ed Cash Revenue
$1,564 $1,488 $1,488

0, 39, 72
37, 93, 143
135, 135, 135
202, 202, 202
229, 27, 36
255, 182, 0
60%
70% 76% 76%
FY 2016 FY 2017 FY 2018 FY 2019
6.8 7.5
8.3
9.4 10.3
FY 2015 FY 2016 FY 2017 FY 2018 FY 2019
Digital Adoption Drives Student and Faculty Value and Enhances Affordability Strong Digital Adoption Rate and Further Revenue Stability with Increased Recurring Revenue
26
Higher Ed Digital Activations (# in millions)
Recurring Revenue % of Combined Higher Ed Revenue
+1,600 bps
Steady Growth in Digital Activations… …Has Increased Share of Revenue from Recurring Units
Rapid adoption rate due to high quality learning materials at an affordable price
Digital activations result in significantly greater recurring revenue, increasing recurring revenue as a percentage of total cash revenue by 1,600 bps between FY 2016 – FY 2019
Provides students with a full ecosystem of products and builds direct relationships with students
11% CAGR
Digital leads to increased revenue stability from recurring revenue stream
2
Note: Company logos and representation placed in alphabetical order throughout the presentation. Fiscal year ending March 31. Source: Company materials.

0, 39, 72
37, 93, 143
135, 135, 135
202, 202, 202
229, 27, 36
255, 182, 0
117 124 146
151 186
203
$268
$310
$349
FY 2016 FY 2017 FY 2018
Cengage McGraw-Hill
($ in millions)
Digital Adoption Drives Student and Faculty Value and Enhances Affordability Digital Revenue Supported by Growing Direct-to-Student Sales Channel
E-Commerce Net Sales
27 Note: Company logos and representation placed in alphabetical order throughout the presentation. Source: Company materials.
E-commerce sales channel builds direct relationship with students
Combined Higher Education D2S digital e-commerce unit sales have grown at a ~14% CAGR FY’16–‘18
Digital remains a key driver for Higher Education growth and is central to the long term strategy especially as distribution models scale with billions of cumulative interactions
Direct-to-student e-commerce channel has driven a significant portion of digital sales
2

0, 39, 72
37, 93, 143
135, 135, 135
202, 202, 202
229, 27, 36
255, 182, 0
28
Highly Experienced Leadership Team 3
Joined McGraw-Hill in 2018
Former Group President of Verisk (NYSE: VRSK)
Ph.D., State University of New York; M.S., Indian Institute of Technology, Delhi; B.S., St. Stephens College, Delhi
Nana Banerjee CEO, McGraw-Hill
Joined Cengage in 2012
Former CEO of Elsevier Health Sciences and Harcourt Assessment
LL. M., University of Bonn; M.B.A., Columbia University
Michael Hansen CEO, Cengage
Fernando Bleichmar, GM, Higher Ed & Skills
Alexander Broich, President, International
Gary Fortier, Chief People Officer
Sharon Loeb, Chief Marketing Officer
Todd Markson, Chief Strategy Officer
Rebecca McNamara, Chief Integration Officer
George Moore, Chief Technology Officer
Bob Munro, Chief Financial Officer
Laura Stevens, General Counsel
Simon Allen, President, Higher Ed and International
Angelo DeGenaro, Chief Information & Operations Officer
Mike Evans, Chief Financial Officer
Scott Grillo, President, Professional Group
Stephen Laster, Chief Digital Officer
Catherine Mathis, Chief Communications Officer
Heath Morrison, President, School Group
Sheila O’Neill, Chief Culture and Talent Officer
David Stafford, General Counsel and Secretary
Note: Company logos and representation placed in alphabetical order throughout the presentation.

0, 39, 72
37, 93, 143
135, 135, 135
202, 202, 202
229, 27, 36
255, 182, 0
Significant Cost Savings Opportunity Across the Combined Business
29
Combined Company Synergies
67%
33%
Cost savings estimate developed through extensive third-party bottoms up analysis of each business unit, functional area, account, vendor, personnel and geography
$285 – 370 million of identified cost savings across both existing businesses, representing only 11%-14% of the addressable baseline spend
Labor cost savings driven by consolidation of sales / go-to-market organizations
Corporate cost savings driven by reduction of duplicative roles across the two organizations
Product savings driven by editorial and production synergies
Real estate savings driven by the consolidation of office spaces
4
Synergy Breakout (Low) Synergy Breakout (High)
65%
35%
Labor Labor
Non-Labor Non-Labor
Both companies have strong track records of outperforming costs savings targets
Note: Company logos and representation placed in alphabetical order throughout the presentation. Cost Savings Analysis diligence performed by PwC.

0, 39, 72
37, 93, 143
135, 135, 135
202, 202, 202
229, 27, 36
255, 182, 0
Significant Cost Savings Opportunity Across the Combined Business
30
4
120
245 285
$160
$320
$370
Year 1 Year 2 Year 3
Low High
Cost Savings Detail One-time Cost Estimate
Implementation Schedule of Cost Savings
($ in millions)
Cost Category Low High
Severance Costs $50 $55
Retention 15 15
PMO Consulting 19 25
Other Consulting (inc. 3rd party) 20 34
Corporate Real Estate 14 21
Re-branding 2 3
Communications 1 2
Other / Contingency 31 37
Total Non-Technology $151 $191
Total Technology $37 $66
Total One-time Costs $190 $255
($ in millions)
Midpoint of estimated run-rate cost savings of $328 million
($ in millions) Savings Range
Addressable $ % of Base
Cost Category Baseline Low High Low High
Labor and Headcount
Sales $318 $64 $79 20% 25%
Product 239 39 55 16% 23%
Marketing 62 16 20 26% 32%
Corporate Overhead 122 41 48 34% 39%
Other (non-technology) 66 6 10 9% 14%
Technology 156 24 31 15% 20%
Total Labor and Headcount $963 $190 $242 20% 25%
Non-Labor Headcount
Cost of Sales $732 $8 $13 1% 2%
Sales 165 11 14 7% 8%
Product 26 3 5 12% 19%
Marketing 67 8 10 12% 15%
Corporate Overhead 136 22 29 16% 21%
Other (non-technology) 249 20 24 8% 10%
Technology 364 23 33 6% 9%
Total Non-Labor and Headcount $1,739 $95 $128 5% 7%
Total Baseline / Synergies $2,700 $285 $370 11% 14%
Identified synergies account for only 11% - 14% of the addressable baseline spend(2)
Note: Company logos and representation placed in alphabetical order throughout the presentation. Fiscal year ending March 31. Cost Savings Analysis diligence performed by PwC. Totals may not sum due to rounding. (1) Includes vendor contract buyouts, application integration fees, temp/backfill support for key personnel reassigned to integration, customer migration costs, etc. (2) Addressable baseline spend as of 12/31/18.
(1)

0, 39, 72
37, 93, 143
135, 135, 135
202, 202, 202
229, 27, 36
255, 182, 0
31
24, 72, 109,
159, 34, 65
114, 15, 7
26, 65, 101
0, 53, 95
255, 182, 0
More efficient pre-publication expenditures and smoothing of certain expenses as part of the digital transformation and perpetual revision cycle
Efficient working capital dynamics driven by digital transformation and portfolio rationalization
Favorable tax attributes with a significant amount of NOLs providing further improvement to the free cash flow profile
Strong Margin Profile and Robust Free Cash Flow Generation
5
Unlevered Free Cash Flow Profile
($ in millions) Pro Forma
FY 2019 FY 2019
Cengage $291 $291
McGraw-Hill 298 298
Pro Forma Cost Savings – 328
Combined Adjusted Cash EBITDA $589 $916
% margin 18.7% 29.0%
Cengage (50) (50)
McGraw-Hill (57) (57)
Capital Expenditures (108) (108)
Cengage (7) (7)
McGraw-Hill (11) (11)
Change in Working Capital (excl. Def. Taxes) (18) (18)
Operating Free Cash Flow $463 $791
% of Combined Adjusted Cash EBITDA 78.7% 86.3%
~70% Increase in FCF
While both companies have historically attractive cash flow profiles, the combination and resulting cost synergies creates a substantial increase in free cash flow
Note: Company logos and representation placed in alphabetical order throughout the presentation. Fiscal year ending March 31.

Financial Overview

0, 39, 72
37, 93, 143
135, 135, 135
202, 202, 202
229, 27, 36
255, 182, 0
$1,778 $1,759 $1,849 $1,823
FY 2016 FY 2017 FY 2018 FY 2019
Combined Company Financial Overview
33 Note: Company logos and representation placed in alphabetical order throughout the presentation. Fiscal year ending March 31.
589
$966 $768 $707
$916
FY 2016 FY 2017 FY 2018 FY 2019
Total Combined Company
Cash Revenue
Pro Forma Adj. Cash EBITDA / Margin %
Pro Forma Adj. Cash EBITDA – CapEx / Adj. Cash EBITDA %
Digital Cash Revenue % Total
($ in millions)
1,649 1,475 1,478 1,474
2,075 1,904 1,858 1,682
$3,725 $3,379 $3,337 $3,157
FY 2016 FY 2017 FY 2018 FY 2019
Cengage McGraw-Hill
481
$873 $657 $606
$809
FY 2016 FY 2017 FY 2018 FY 2019
23% 26% 21%
86% 90% 86%
55% 48% 52%
CAGR FY 2016 – FY 2019: (5%)
Cumulative Free Cash Flow FY 2016 – FY 2019: $2.6 billion
29% 19%
CAGR FY 2016 – FY 2019: (2%)
82%
58%
CAGR FY 2016 – FY 2019: 1%
88%

0, 39, 72
37, 93, 143
135, 135, 135
202, 202, 202
229, 27, 36
255, 182, 0
Total Cengage Adjusted Cash EBITDA
Cengage Financial Overview
34
24, 72, 109,
159, 34, 65
114, 15, 7
26, 65, 101
0, 53, 95
255, 182, 0
Total Cengage Cash Revenue
$460
$357
$307 $291
FY 2016 FY 2017 FY 2018 FY 2019
($ in millions)
1005 824 765 790
166
159 188 162
234 231 234 225
244
260 292 298
$1,649
$1,475 $1,478 $1,474
FY 2016 FY 2017 FY 2018 FY 2019
Higher Ed K-12 Gale International
($ in millions)
FY 2019 Cash Revenue was flat, with growth in Higher Ed and International offset by a downturn in the K-12 adoption cycle, and lower sales in Gale against a tough FY 2018 comparative
− Higher Ed performance driven by the launch of the Cengage Unlimited subscription product, tailwinds from the expansion of the rental partnership programmes, and a non-recurring software license sale in Q4
− International maintained its track record of growth, led by continuing momentum in ELT and a strong year in Australia School
− K-12 performance driven by declines in AP and Skills sales into high schools in a cyclically lower adoption year
− Gale impacted by overhang of large deals in FY 2018 across both domestic and international; underlying business performance is stable
Cengage Unlimited delivered significant success in its first full academic year, with over 1 million subscriptions sold in the 7 months since launch in August 2018
− Gained 65 basis points of market share(1) and grew total digital units by approximately 10% in US higher education
Adjusted Cash EBITDA of $291 million after significant investment in strategic priorities, including $15 million of one time costs to launch Cengage Unlimited and drive digital transformation
Note: Company logos and representation placed in alphabetical order throughout the presentation. Fiscal year ending March 31. Cengage reports revenues in annual and quarterly reports in three segments, namely Learning, International and Gale. For the purposes of this presentation estimates have been made to allocate the Learning segment between Higher Education and K-12.
(1) Source: MPI sales data for twelve months ending March 31, 2019.
0, 39, 72
37, 93, 143
135, 135, 135
202, 202, 202
229, 27, 36
255, 182, 0
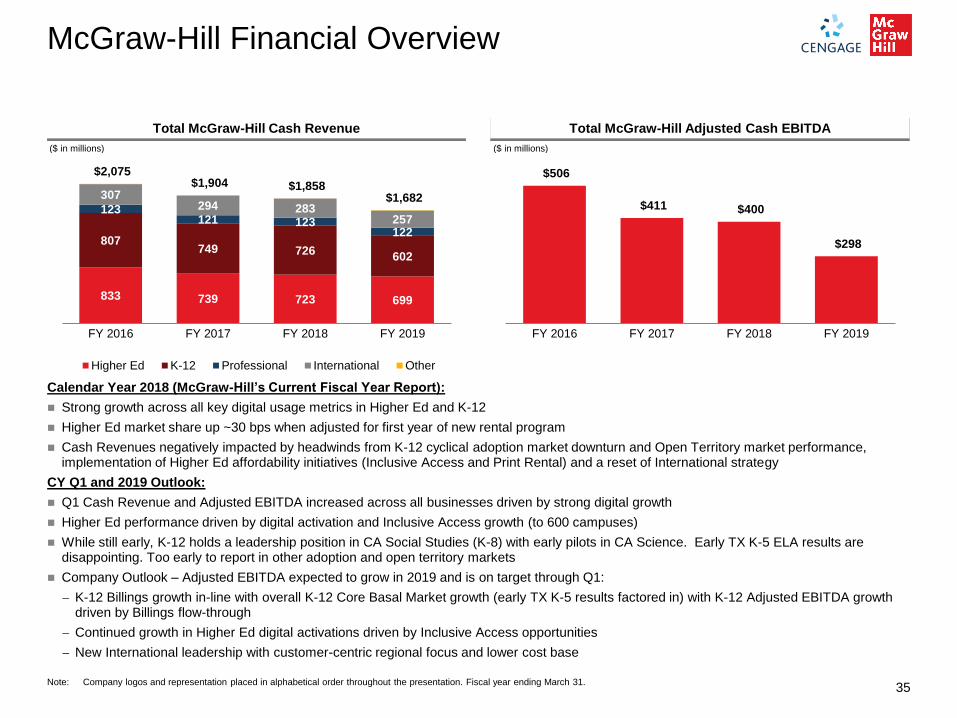
McGraw-Hill Financial Overview
35
24, 72, 109,
159, 34, 65
114, 15, 7
26, 65, 101
0, 53, 95
255, 182, 0
$506
$411 $400
$298
FY 2016 FY 2017 FY 2018 FY 2019
($ in millions)
Total McGraw-Hill Cash Revenue Total McGraw-Hill Adjusted Cash EBITDA
833 739 723 699
807 749 726
602
123 121 123
122
307 294 283
257
$2,075 $1,904 $1,858
$1,682
FY 2016 FY 2017 FY 2018 FY 2019
Higher Ed K-12 Professional International Other
($ in millions)
Note: Company logos and representation placed in alphabetical order throughout the presentation. Fiscal year ending March 31.
Calendar Year 2018 (McGraw-Hill’s Current Fiscal Year Report):
Strong growth across all key digital usage metrics in Higher Ed and K-12
Higher Ed market share up ~30 bps when adjusted for first year of new rental program
Cash Revenues negatively impacted by headwinds from K-12 cyclical adoption market downturn and Open Territory market performance, implementation of Higher Ed affordability initiatives (Inclusive Access and Print Rental) and a reset of International strategy
CY Q1 and 2019 Outlook:
Q1 Cash Revenue and Adjusted EBITDA increased across all businesses driven by strong digital growth
Higher Ed performance driven by digital activation and Inclusive Access growth (to 600 campuses)
While still early, K-12 holds a leadership position in CA Social Studies (K-8) with early pilots in CA Science. Early TX K-5 ELA results are disappointing. Too early to report in other adoption and open territory markets
Company Outlook – Adjusted EBITDA expected to grow in 2019 and is on target through Q1:
− K-12 Billings growth in-line with overall K-12 Core Basal Market growth (early TX K-5 results factored in) with K-12 Adjusted EBITDA growth driven by Billings flow-through
− Continued growth in Higher Ed digital activations driven by Inclusive Access opportunities
− New International leadership with customer-centric regional focus and lower cost base

Q&A

Appendix

0, 39, 72
37, 93, 143
135, 135, 135
202, 202, 202
229, 27, 36
255, 182, 0
Financial Terms and Acronyms
38
24, 72, 109,
159, 34, 65
114, 15, 7
26, 65, 101
0, 53, 95
255, 182, 0
Financial Terms Description
Cash Revenue
Non-GAAP financial measure defined as U.S. GAAP revenue plus the net change in deferred
revenue excluding the impact of purchase accounting. Cash Revenue, a measure used by
management to assess operating performance, is defined as the total amount of revenue that would
have been recognized in a period if all revenue were recognized immediately at the time of sale
Adjusted Cash EBITDA
EBITDA adjusted to exclude unusual items and other adjustments required or permitted in calculating covenant compliance under the debt agreements including additions to pre-publication costs (“PrePub”) on an accrual basis
EBITDA Earnings before interest (net), income tax, depreciation and amortization
Net Debt Amount of debt outstanding less cash on hand as of a point in time
Capital Expenditures Refers to capital expenditures other than pre-publication such as computers, build-out of office space and warehouse equipment
Pre-publication costs
Pre-publication costs reflect the costs incurred in the development of instructional solutions, principally design and content creation. These costs are capitalized when the title is expected to generate future economic benefits and are amortized upon publication of the title over its estimated useful life of up to six years
Deferred Revenue Advance payments or unearned revenue recorded until services have been rendered or products have been delivered in accordance with GAAP
Digital Cash Revenue Represents standalone digital sales and, where digital is sold in a bundled arrangement, the value of the bundled arrangement
Recurring Revenue Represents all revenue with the exception of standalone print revenue
Slide owner: FSG
Note: Company logos and representation placed in alphabetical order throughout the presentation. Cengage standalone definitions may differ from the terms above.

0, 39, 72
37, 93, 143
135, 135, 135
202, 202, 202
229, 27, 36
255, 182, 0
$1,488 47%
$764 24%
$554 18%
$225 7%
4% 0%
10%
17%
10%
1% 6%
56%
39
Higher Education K-12 International Gale
Combined Company Segment Overview
($ in millions)
Note: Company logos and representation placed in alphabetical order throughout the presentation. Fiscal year ending March 31. Results may not sum due to rounding. Adjusted Cash EBITDA is net of pre-publication costs. Figures do not include pro forma cost savings initiatives. Cengage reports revenues in annual and quarterly reports in three segments, namely Learning, International and Gale. For the purposes of this presentation estimates have been made to allocate the Learning segment between Higher Education and K-12.
Slide owner: FSG
Professional Other
FY 2019 Pro Forma Cash Revenue (% of Total) Digital % of Cash Revenue
FY 2019 Pro Forma Adjusted Cash EBITDA (% of Total) Pro Forma Adjusted Cash EBITDA margin
77% 41% 18% 57%
22% 13% 11% 26% 30%
84% 98%
$327
$6
$99
$61
$59
$37
Higher Ed K-12 Gale Professional International Other Legend:
$3 $122

0, 39, 72
37, 93, 143
135, 135, 135
202, 202, 202
229, 27, 36
255, 182, 0
40
Gale and Professional Segments
Top 3 player
17,000+ customers
90%+ annual customer retention
84% digital revenue (% of total Gale revenue)
High gross margin (~78%) business with strong and steady cash flows
Key Partnerships
Top player across multiple markets
2,600+ customers
90%+ annual customer retention(1)
57% digital revenue (% of total Prof. revenue)
High gross margin (~78%) business with strong and steady cash flows
Key Brands
Segments provide cash flow stability, significant digital penetration and attractive gross margins
Note: Company logos and representation placed in alphabetical order throughout the presentation. (1) Refers to customer retention for Access business.
Leading provider of proprietary research database and reference materials in a
$3bn market
Leading provider of professional content to corporations, academic institutions, libraries
and hospitals

0, 39, 72
37, 93, 143
135, 135, 135
202, 202, 202
229, 27, 36
255, 182, 0
41
Digital Product Offering Descriptions
Product Description K-12 Higher
Education
International /
Professional
Provides organized access to market-leading content including medical and engineering professional resources and academic libraries
Adaptive learning technology for the K-12 and higher education markets
Open learning environment for students and instructors in the higher education market
Content delivery platform for the K-12 market Adaptive learning program that personalizes learning and designs
targeted study paths for students Personalized program of digital products and services that
engages students with interactivity Adaptive reading product designed to help students understand
and retain course material Online homework and assessment system that lets instructors
distribute, collect, grade, and record assignments Online courseware, simulation, homework and assessment
systems that create learning exercises, and allow students to continue their learning beyond the classroom
Note: Company logos and representation placed in alphabetical order throughout the presentation. Represents a select set of Cengage and McGraw-Hill products and is not a comprehensive illustration of all offerings. Recurring revenue represents all revenue with the exception of standalone print revenue.

0, 39, 72
37, 93, 143
135, 135, 135
202, 202, 202
229, 27, 36
255, 182, 0
Cengage EBITDA Reconciliation
42
LTM($ in millions) 3/31/17 3/31/18 3/31/19
Net Income ($43) ($2) ($95)
Impact of foreign currency 3 1 5
Equity-based compensation expense 14 18 8
Non-core other operating expenses 13 8 16
Loss on early extinguishment of debt 11 – –
Amortization of pre-publication costs 150 127 110
Restructuring and other charges 27 11 18
Depreciation 84 72 76
Amortization of intangible assets 92 94 95
Other income 1 (10) (2)
Interest expense, net 156 159 172
Reorganization items – – –
Benefit from income taxes (36) (73) (30)
EBITDA $473 $406 $373
Additions to pre-publication costs (120) (105) (96)
Adjusted EBITDA $353 $301 $277
Change in deferred revenue / costs 4 6 14
Adjusted Cash EBITDA $357 $307 $291
1
2
Primarily includes bank fees, severance costs, duplicate rent expense (incurred during the build-out phase of the new headquarters in Boston), consulting costs, contract termination costs and management fees
Represents severance and other expenses incurred due to headcount reductions and the implementation of other cost savings
1
2
Commentary
Note: $15 million of one-time costs related to Cengage Unlimited / digital investments and $9 million of enterprise-wise technology investment are not being added back to Adjusted Cash EBITDA in FY 2019
Note: Company logos and representation placed in alphabetical order throughout the presentation. Fiscal year ending March 31. Numbers may not sum due to rounding.

0, 39, 72
37, 93, 143
135, 135, 135
202, 202, 202
229, 27, 36
255, 182, 0
McGraw-Hill EBITDA Reconciliation
43
Represents severance and other expenses associated with headcount reductions and other cost savings initiated as part of McGraw-Hill’s formal restructuring initiatives to create a flatter, more agile organization
Annual management fees payable to Apollo (beginning in 2014)
Write-off of unamortized deferred financing fees, original debt discount and other fees and expenses associated with the May 2016 refinancing
Includes non-cash incentive compensation expense, elimination of a $6 million gain on disposal of the K-12 Canadian business, elimination of a $5 million gain related to the sale of an equity method investment, and other adjustments required or permitted under debt agreements
Represents the net effect of converting deferred revenues to a cash basis assuming the collection of all receivable balances
Net effect of converting deferred royalties to a cash basis assuming the payment of all amounts owed in the period incurred
Net effect of converting deferred commissions to a cash basis assuming the payment of all amounts owed in the period incurred
LTM
($ in millions) 3/31/17 3/31/18 3/31/19
Net Income ($108) ($63) ($154)
Interest (income) expense, net 195 178 184
Income tax (benefit) provision 14 (7) 11
Depreciation and amortization 204 228 220
Restructuring and cost savings 16 15 7
Sponsor fees 4 4 4
Loss on extinguishment of debt 27 – –
Other 30 21 48
EBITDA $381 $376 $320
Additions to pre-publication costs (102) (97) (98)
Adjusted EBITDA $280 $279 $222 0Change in deferred revenue 144 142 85
Change in deferred royalties (13) (22) (10)
Change in deferred commissions – 1 1
Adjusted Cash EBITDA $411 $400 $298
5
6
7
1
2
3
1
2
3
4
5
6
Commentary
4
7
Note: Company logos and representation placed in alphabetical order throughout the presentation. Fiscal year ending March 31. Numbers may not sum due to rounding.

0, 39, 72
37, 93, 143
135, 135, 135
202, 202, 202
229, 27, 36
255, 182, 0
Cengage Segment Detail
44
24, 72, 109,
159, 34, 65
114, 15, 7
26, 65, 101
0, 53, 95
255, 182, 0
Slide owner: FSG
($ in millions) Fiscal year ending March 31,
2016 2017 2018 2019 CAGR
Cash Revenue
Higher Ed $1,005 $824 $765 $790 (7.7%)
K-12 166 159 188 162 (0.9%)
Gale 234 231 234 225 (1.3%)
International 244 260 292 298 6.9%
Total Cash Revenue $1,649 $1,475 $1,478 $1,474 (3.7%)
% growth (10.6%) 0.2% (0.3%)
Memo: % Digital Cash Revenue 49.3% 54.9% 57.7% 59.9%
Gross Profit
Higher Ed $773 $627 $594 $627 (6.8%)
K-12 128 123 150 127 (0.3%)
Gale 188 185 187 176 (2.1%)
International 160 174 196 199 7.5%
Total Gross Profit $1,250 $1,108 $1,127 $1,129 (3.3%)
% margin 75.8% 75.2% 76.2% 76.6%
Adjusted Cash EBITDA $460 $357 $307 $291 (14.1%)
% margin 27.9% 24.2% 20.8% 19.7%
Capital Expenditures (55) (65) (53) (50)
Adjusted Cash EBITDA – CapEx $404 $292 $254 $241 (15.9%)
% EBITDA conversion 88.0% 81.8% 82.7% 82.7%
Note: Company logos and representation placed in alphabetical order throughout the presentation. Fiscal year ending March 31. Cengage reports revenues in annual and quarterly reports in three segments, namely Learning, International and Gale. For the purposes of this presentation estimates have been made to allocate the Learning segment between Higher Education and K-12.

0, 39, 72
37, 93, 143
135, 135, 135
202, 202, 202
229, 27, 36
255, 182, 0
McGraw-Hill Segment Detail
45
24, 72, 109,
159, 34, 65
114, 15, 7
26, 65, 101
0, 53, 95
255, 182, 0
Slide owner: FSG
($ in millions) Fiscal year ending March 31,
2016 2017 2018 2019 CAGR
Cash Revenue
Higher Ed $833 $739 $723 $699 (5.7%)
K-12 807 749 726 602 (9.3%)
International 307 294 283 257 (5.9%)
Professional 123 121 123 122 (0.4%)
Other 4 1 2 3 (9.0%)
Total Cash Revenue $2,075 $1,904 $1,858 $1,682 (6.8%)
% growth (8.3%) (2.4%) (9.5%)
Memo: % Digital Cash Revenue 46.7% 50.2% 53.8% 55.9%
Gross Profit
Higher Ed $661 $594 $576 $555 (5.7%)
K-12 664 607 584 483 (10.1%)
International 168 162 155 139 (6.1%)
Professional 94 95 96 95 0.3%
Other 2 0 3 3 19.2%
Total Gross Profit $1,589 $1,458 $1,414 $1,276 (7.1%)
% margin 76.6% 76.6% 76.1% 75.8%
Adjusted Cash EBITDA $506 $411 $400 $298 (16.2%)
% margin 24.4% 21.6% 21.5% 17.7%
Capital Expenditures (38) (46) (48) (57) 14.7%
Adjusted Cash EBITDA – CapEx $468 $365 $352 $240 (19.9%)
% EBITDA conversion 92.5% 88.9% 88.0% 80.7%
Note: Company logos and representation placed in alphabetical order throughout the presentation. Fiscal year ending March 31.

0, 39, 72
37, 93, 143
135, 135, 135
202, 202, 202
229, 27, 36
255, 182, 0
46
Pro Forma Corporate Structure
McGraw-Hill Education, Inc.
(US)
MHE Acquisition, LLC (US)
MHE US Holdings, LLC
(US)
MHGE Parent, LLC (US)
McGraw-Hill Global Education Holdings,
LLC (US)
MHGE Parent Finance, Inc.
(US)
McGraw-Hill Global Education Intermediate
Holdings, LLC (US)
Combined Secured Term Loan: $3,342m
Combined Secured Revolving Loan: $350m
MGH Senior Notes: $400m Cengage Senior Notes: $620m
MGH Holdco Loan: $180m
Guarantor of the senior secured credit facilities
Co-issuer of the MGHGEH Senior Notes and Cengage
Senior Notes
Guarantor
Borrower
McGraw-Hill Shareholders Cengage Shareholders
Note: Company logos and representation placed in alphabetical order throughout the presentation.
McGraw-Hill Non-US Subsidiaries
Cengage Non-US
Subsidiaries
McGraw-Hill Global Education Finance,
Inc. (US)
Cengage US
Subsidiaries
McGraw-Hill US Subsidiaries
0, 39, 72
37, 93, 143
135, 135, 135
202, 202, 202
229, 27, 36
255, 182, 0
47
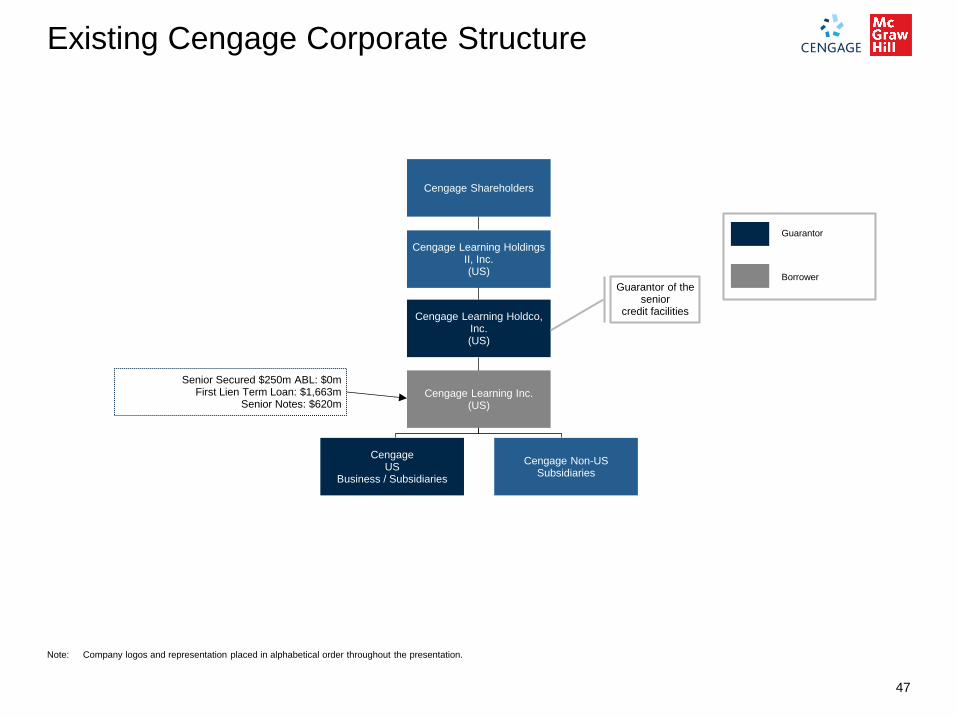
Existing Cengage Corporate Structure
Cengage Learning Holdings II, Inc. (US)
Cengage Learning Holdco, Inc. (US)
Cengage Learning Inc. (US)
Cengage Non-US Subsidiaries
Senior Secured $250m ABL: $0m
First Lien Term Loan: $1,663m
Senior Notes: $620m
Guarantor of the senior
credit facilities
Guarantor
Borrower
Cengage Shareholders
Note: Company logos and representation placed in alphabetical order throughout the presentation.
Cengage US
Business / Subsidiaries

0, 39, 72
37, 93, 143
135, 135, 135
202, 202, 202
229, 27, 36
255, 182, 0
McGraw-Hill Non-US Subsidiaries
48
Existing McGraw-Hill Corporate Structure
McGraw-Hill Education, Inc.
(US)
MHE Acquisition, LLC (US)
MHE US Holdings, LLC
(US)
MHGE Parent, LLC (US)
McGraw-Hill Global Education Holdings,
LLC (US)
McGraw-Hill Global Education Finance,
Inc. (US)
MHGE Parent Finance, Inc.
(US)
McGraw-Hill Global Education Intermediate
Holdings, LLC (US)
Senior Secured $350m Revolving Loan: $0m Senior Secured Term Loan: $1,679m
Senior Notes: $400m
MGH Holdco Loan: $180m
Guarantor of the senior secured credit facilities
Co-issuer of the MGHGEH Senior Notes.
Guarantor
Borrower
McGraw-Hill Shareholders
Note: Company logos and representation placed in alphabetical order throughout the presentation.
McGraw-Hill US Subsidiaries

Appendix K-12 Accounting and Adoption Cycle Overview

0, 39, 72
37, 93, 143
135, 135, 135
202, 202, 202
229, 27, 36
255, 182, 0
Digital Year 1 Year 2 Year 3 Year 4 Year 5 Year 6 Year 7
GAAP Revenue $ 100 $ 100 $ 100 $ 100 $ 100 $ 100 $ 100
COGS / Opex (92) (8) (8) (8) (8) (8) (8)
GAAP EBITDA $ 8 $ 92 $ 92 $ 92 $ 92 $ 92 $ 92
Cumulative $ 560
+Δ Deferred Rev. 600
+Δ Deferred Royalty (30)
+Δ Deferred
Commissions (18)
Adjusted EBITDA 560
Print Year 1 Year 2 Year 3 Year 4 Year 5 Year 6 Year 7
GAAP Revenue $ 700 $ - $ - $ - $ - $ - $ -
COGS / Opex (140) - - - - - -
GAAP EBITDA $ 560 $ - $ - $ - $ - $ - $ -
Cumulative $ 560
+Δ Deferred Rev. -
+Δ Deferred Royalty -
+Δ Deferred
Commissions -
Adjusted EBITDA $ 560
Why Cash Revenue and Cash EBITDA for Measuring Performance, Especially K‐12?
50
Economics of Selling Print vs. Digital are Similar but GAAP Accounting is Vastly Different
Illustrative Accounting Example: Print vs. Digital
GAAP accounting understates true earnings power and cash flow generation
For sales and costs deferred in accordance with GAAP, cash has been predominately collected and paid, respectively while GAAP earnings are recognized in future periods
The business is managed based on Cash Revenue and Cash EBITDA which provide comparable results in a time of digital transition
Print Digital Difference
Customer payments Upfront Upfront No
Average period of use 5-8 years 5-8 years No
Content changes post sale Minimal Minimal No
Business planning and effort put into year
of adoption and saleYes Yes No
Majority of costs incurred upfront Yes Yes No
Yr. 1 Adjusted EBITDA (based on example) $560 $560 No
Yr. 1 GAAP EBITDA (based on example) $560 $8 Yes
Sell Print Textbooks, 7-Year Adoption Cycle Sell Digital Solutions, 7-Year Adoption Cycle
Digital development costs are expensed at the time of sale. Royalty and Commission expense (assumed to be 5% and 3% in this example, respectively) are deferred for GAAP purposes although paid in Year 1. Ongoing maintenance and support costs are immaterial as a % of sales
Note: Company logos and representation placed in alphabetical order throughout the presentation.

0, 39, 72
37, 93, 143
135, 135, 135
202, 202, 202
229, 27, 36
255, 182, 0
Overview of K‐12 Markets by State
51
Open Territory States
States approve programs (i.e., create a hunting license), but individual districts make the actual buy decisions
High stakes because buying decisions occur in compressed timing windows that lock down school commitments for 5-6 years
Revenues tend to be more resilient in downturns given set buying schedules
Influence learning solutions development across country given customization during the selection process and scale of purchases
According to AAP, three states (CA, FL & TX) accounted for over 60% of the market in 2014(1)
Adoption Market States
More difficult market to serve given fragmentation of customers and increased competition
Providers require sophisticated content management capabilities to customize for Open Territory states
Economic downturns have a greater impact because states are not constrained by purchasing timetables and can adjust to longer cycles
According to AAP, five states (IL, NJ, NY, OH and PA) accounted for 45% of the market in 2014(1)
Note: Company logos and representation placed in alphabetical order throughout the presentation. (1) AAP data includes basal and supplemental market.

0, 39, 72
37, 93, 143
135, 135, 135
202, 202, 202
229, 27, 36
255, 182, 0
Overview of Purchasing and Decision Making Process
52
Instructional Materials Adoption Process
1
2
3
4
5
State develops standards and releases schedule and adoption requirements (e.g., subject area, grade, and
other specifications; adoption cycles –approx 6-8 years)
Content providers submit bids and samples to state review board (time to develop/submit: approx
1-1.5 years)
State committee/panel reviews materials and makes recommendation; state board provides final approval
State and content providers contract a price that is offered to all districts in the state; state adds new materials to the list of state-approved materials
Superintendent sets instructional materials budget; district boards or teacher committee reviews
materials and selects for purchase(1)
Open-Territory Process
1
2
3
4
State develops standards
Content providers develop learning resources in compliance with state standards
Superintendent sets instructional materials budget; district boards or teacher committee reviews
materials and selects for purchase (in some cases, materials must go to state for approval)
Content providers sell materials to districts/schools(1)
Note: Company logos and representation placed in alphabetical order throughout the presentation. (1) AAP data includes basal and supplemental market.