McCroskey Scenario t-test Take the McCroskey test yourself to see your apprehension level This...
21
McCroskey Scenario t-test Take the McCroskey test yourself to see your apprehension level This PowerPoint will walk through the comparison of means of the pre and post-tests
-
Upload
meredith-mitchell -
Category
Documents
-
view
215 -
download
1
Transcript of McCroskey Scenario t-test Take the McCroskey test yourself to see your apprehension level This...

McCroskey Scenario t-test
Take the McCroskey test yourself to see your apprehension level
This PowerPoint will walk through the comparison of means of the pre and post-tests

McCroskey Scenario t-test
Remember the Types of Scales?
Nominal Data (Chi-square) classification data, e.g. m/f no ordering, e.g. it makes no sense to state that M > F arbitrary labels, e.g., m/f, 0/1, etc Ordinal Data (t-test) ordered but differences between values are not important e.g., political parties on left to right spectrum given labels 0, 1, 2 e.g., Likert scales, rank on a scale of 1..5 your degree of satisfaction e.g., restaurant ratings Interval Data ordered, constant scale, but no natural zero differences make sense, but ratios do not (e.g., 30°-20°=20°-10°, but
20°/10° is not twice as hot! e.g., temperature (C,F), dates Ratio Data ordered, constant scale, natural zero e.g., height, weight, age, length Quoted from
http://www.stat.sfu.ca/~cschwarz/Stat-301/Handouts/node5.html

McCroskey Scenario t-test
Take McCroskey's PRCA. http://ww3.llcc.edu/speechsurvey/survey.aspx OR http://www.jamescmccroskey.com/measures/prca24.htm
Photo Source http://2.bp.blogspot.com/_27z_ybX1fcc/SafUfnpKgwI/AAAAAAAAAI4/nwRnSJx33dw/s400/speakerbestself.jpg

McCroskey Scenario t-test
Study
Imagine that a group of 20 students enrolled in Dr. Cohn's public speaking course. These students took McCroskey's test on the first day of their public speaking course. Scores can range from 24-120, and a score above 65 suggests higher than average apprehension. Dr. Cohn is concerned that she has so many apprehensive students in the class. Here are their scores:
After one term of instruction, Dr. Cohn administered the test at the end of the course because she wanted to see if taking the course lowered student apprehension.
In this case, there is a pre-post test for one group and the data on a scale. Dr. Cohn asks you to calculate the results using a t-test.
Is there a significant difference in the communication apprehension level of the class members before and after taking Dr. Cohn's course?

McCroskey Scenario t-test
First, you enter the data.

McCroskey Scenario t-test
Pull down “Help,” select “Statistics Coach” if you need help.

McCroskey Scenario t-test
Compare means of the pre and post test.

McCroskey Scenario t-test
Select two

McCroskey Scenario t-test
Related data

McCroskey Scenario t-test
Normal Distribution

McCroskey Scenario t-test
The “Statistics Coach” help function guides you in what statistical test to use.

McCroskey Scenario t-test
What are the means to be compared? The average of the pretest, the average of the posttest. The calculator will figure this automatically as part of the t-test calculation.
Add the 20 scores from the pretest = 1600
Divide by 20 students in the class = 80 is the average or mean for the pretest.
Add the 20 scores from the posttest = 1193
Divide by 20 students in the class = 51

McCroskey Scenario t-test
95% confident that the difference is not by chance

McCroskey Scenario t-test
Enter Data
McCroskey Scenario t-test
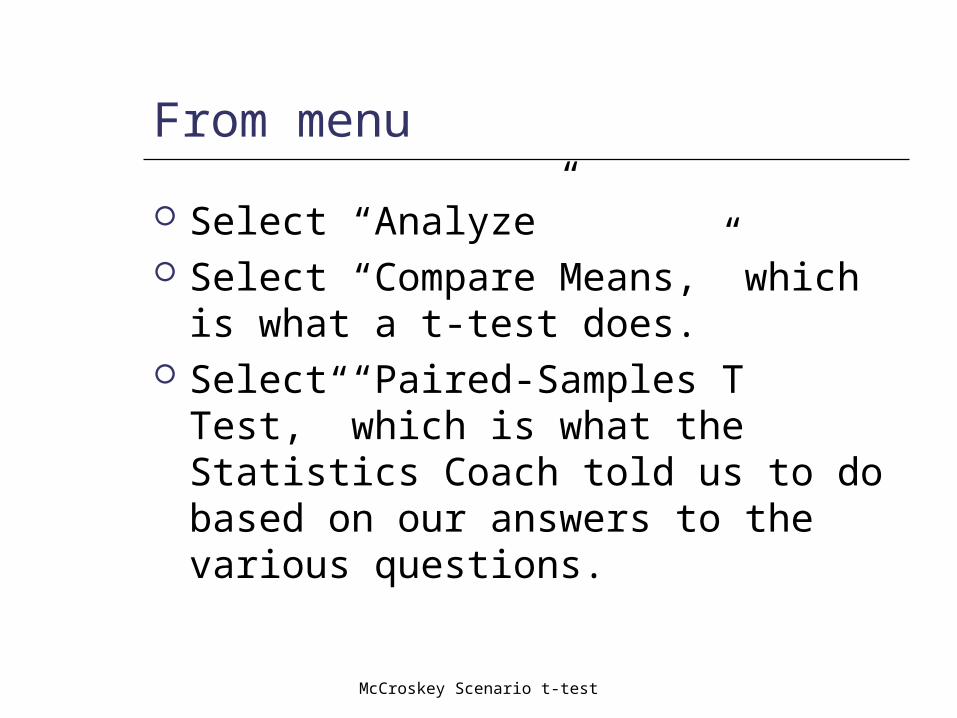
From menu
Select “Analyze” Select “Compare Means,” which is
what a t-test does. Select “Paired-Samples T Test,”
which is what the Statistics Coach told us to do based on our answers to the various questions.

McCroskey Scenario t-test

McCroskey Scenario t-test
If you don’t have SPSS, here is a calculator: http://www.physics.csbsju.edu/stats/t-test_bulk_form.html

McCroskey Scenario t-test

McCroskey Scenario t-test
The standard deviation helps the researcher determine how much distance from the mean is typical and how much is considered significant.

McCroskey Scenario t-test
Using unpaired t-testt= 4.46 sdev= 20.2 degrees of freedom = 38 The probability of this result, assuming the null hypothesis, is less than .0001
Scores are significantly lower after the course. (Remember, this is fictional research.)
We can feel confident that completing the public speaking course helped lower student communication apprehension.

McCroskey Scenario t-test
Hope you enjoyed this application practice!