McCLELLAND LABORATORIES, INC. - Paramount …paramountgold.com/_docs/PARAMOUNT GOLD AND SILVER...
28
In association with H.J. Heinen McCLELLAND LABORATORIES, INC. 1016 Greg Street, Sparks, Nevada 89431 (775) 356-1300 FAX (775) 356-8917 E-MAIL [email protected] Report on Metallurgical Evaluation - 11 San Miguel Drill Hole Composites MLI Job No. 3463 April 4, 2011 for Mr. Chris Crupi Paramount Gold and Silver Corp. 665 Anderson Street Winnemucca, Nevada 89445 TABLE OF CONTENTS EXECUTIVE SUMMARY ..................................................... 1 Table 1. - Summary Results, Agitated Cyanidation (Bottle Roll) Test Results, Various San Miguel Composites (San Francisco and Chihuahua), P 80 75μm Feeds .................................................... 1 Table 2. - Summary Bulk Sulfide Flotation Test Results, Various San Miguel Composites (San Francisco and Chihuahua), P 80 75μm Feeds ................ 2 COMPOSITE PREPARATION AND COMPOSITE FEED ANALYSES .............. 3 Table 3. - Composite Make-Up Information, San Francisco Drill Hole Composite - SF-09-01; 116.00-124.75, 151.85-163.65 Meters ............... 3 Table 4. - Composite Make-Up Information, San Francisco Drill Hole Composite - SF-09-02; 132.20-162.70, 181.50 Meters ..................... 4 Table 5. - Composite Make-Up Information, San Francisco Drill Hole Composite - RCSF 10-001; 50.29-65.53, 105.16-134.11 Meters ............. 5 Table 6. - Composite Make-Up Information, San Francisco Drill Hole Composite - RCSF 10-002; 204.22-224.03 Meters ........................ 5 Table 7. - Composite Make-Up Information, San Francisco Drill Hole Composite - RCSF 10-004; 199.64-259.08 Meters ........................ 6 Table 8. - Composite Make-Up Information, San Francisco Drill Hole Composite - RCSF 10-005; 10.67-21.34, 167-64-178.31 Meters ............. 7 Table 9. - Composite Make-Up Information, San Francisco Drill Hole Composite - RCSF 10-006; 132.59-144.78, 227.80 Meters ................. 8
Transcript of McCLELLAND LABORATORIES, INC. - Paramount …paramountgold.com/_docs/PARAMOUNT GOLD AND SILVER...
In association with H.J. Heinen
McCLELLAND LABORATORIES, INC. 1016 Greg Street, Sparks, Nevada 89431 (775) 356-1300
FAX (775) 356-8917E-MAIL [email protected]
Reporton
Metallurgical Evaluation -11 San Miguel Drill Hole Composites
MLI Job No. 3463April 4, 2011
for
Mr. Chris CrupiParamount Gold and Silver Corp.
665 Anderson Street Winnemucca, Nevada 89445
TABLE OF CONTENTS
EXECUTIVE SUMMARY . . . . . . . . . . . . . . . . . . . . . . . . . . . . . . . . . . . . . . . . . . . . . . . . . . . . . 1Table 1. - Summary Results, Agitated Cyanidation (Bottle Roll) Test Results,
Various San Miguel Composites (San Francisco and Chihuahua), P8075µm Feeds . . . . . . . . . . . . . . . . . . . . . . . . . . . . . . . . . . . . . . . . . . . . . . . . . . . . 1
Table 2. - Summary Bulk Sulfide Flotation Test Results, Various San MiguelComposites (San Francisco and Chihuahua), P8075µm Feeds . . . . . . . . . . . . . . . . 2
COMPOSITE PREPARATION AND COMPOSITE FEED ANALYSES . . . . . . . . . . . . . . 3Table 3. - Composite Make-Up Information, San Francisco Drill Hole
Composite - SF-09-01; 116.00-124.75, 151.85-163.65 Meters . . . . . . . . . . . . . . . 3Table 4. - Composite Make-Up Information, San Francisco Drill Hole
Composite - SF-09-02; 132.20-162.70, 181.50 Meters . . . . . . . . . . . . . . . . . . . . . 4Table 5. - Composite Make-Up Information, San Francisco Drill Hole
Composite - RCSF 10-001; 50.29-65.53, 105.16-134.11 Meters . . . . . . . . . . . . . 5Table 6. - Composite Make-Up Information, San Francisco Drill Hole
Composite - RCSF 10-002; 204.22-224.03 Meters . . . . . . . . . . . . . . . . . . . . . . . . 5Table 7. - Composite Make-Up Information, San Francisco Drill Hole
Composite - RCSF 10-004; 199.64-259.08 Meters . . . . . . . . . . . . . . . . . . . . . . . . 6Table 8. - Composite Make-Up Information, San Francisco Drill Hole
Composite - RCSF 10-005; 10.67-21.34, 167-64-178.31 Meters . . . . . . . . . . . . . 7Table 9. - Composite Make-Up Information, San Francisco Drill Hole
Composite - RCSF 10-006; 132.59-144.78, 227.80 Meters . . . . . . . . . . . . . . . . . 8
Mr. Chris Crupi / Paramount Gold and Silver Corp.Table of Contents - April 4, 2011
ii
McCLELLAND LABORATORIES, INC.
Table 10. - Composite Make-Up Information, San Francisco Drill Hole Composite - RCSF 10-007; 86.87-114.30 Meters . . . . . . . . . . . . . . . . . . . . . . . . . 9
Table 11. - Composite Make-Up Information, San Francisco Drill HoleComposite - RCSF 10-008; 146.30-178.31 Meters . . . . . . . . . . . . . . . . . . . . . . . . 9
Table 12. - Composite Make-Up Information, Chihuahua (San Miguel) Hi Au Intervals (+0.3 gAu/mt, <25 gAg/mt) . . . . . . . . . . . . . . . . . . . . . . . . . . . . 10
Table 13. - Composite Make-Up Information, Chihuahua (San Miguel) Hi Ag, Low Au Intervals (>70 - + 10 gAg/mt, <0.5 gAu/mt) . . . . . . . . . . . . . . . 11
Table 14. - Gold Head Assay Results and Head Grade Comparison, San MiguelDrill Hole Composites (San Francisco) . . . . . . . . . . . . . . . . . . . . . . . . . . . . . . . . 11
Table 15. - Silver Head Assay Results and Head Grade Comparison, San MiguelDrill Hole Composites (San Francisco) . . . . . . . . . . . . . . . . . . . . . . . . . . . . . . . . 12
Table 16. - Head Assay Results and Head Grade Comparison, San Miguel DrillHole Composites (Chihuahua) . . . . . . . . . . . . . . . . . . . . . . . . . . . . . . . . . . . . . . . 12
Table 17. - ICP Metals Analysis Results, San Miguel San Francisco Composites . . . . . 13Table 18. - ICP Metals Analysis Results, Chihuahua Composite Feeds and
Flotation Products . . . . . . . . . . . . . . . . . . . . . . . . . . . . . . . . . . . . . . . . . . . . . . . . 14
DIRECT AGITATED CYANIDATION TEST PROCEDURES AND RESULTS . . . . . . . 15Table 19. - Overall Metallurgical Results, Direct Agitated Cyanidation Tests,
San Miguel Project Drill Hole Composites, P8075µm Feeds . . . . . . . . . . . . . . . . 16Figure 1. - Gold and Silver Leach Rate Profiles, Direct Agitated Cyanidation
Tests, San Miguel Project Drill Hole Composites, P8075µm Mesh Feeds . . . . . . . . . . . . . . . . . . . . . . . . . . . . . . . . . . . . . . . . 16
Table 20. - Triplicate Tail Assay Results, Leached Residues, Cyanidation Tests,San Miguel Project Drill Hole Composites, P8075µm Feeds . . . . . . . . . . . . . . . . 16
Table 21. - Overall Metallurgical Results, Direct Agitated Cyanidation Tests,San Miguel Project Drill Hole Composites, P8075µm Feeds . . . . . . . . . . . . . . . . 17Figure 2. - Gold and Silver Leach Rate Profiles, Direct Agitated Cyanidation Tests,
San Miguel Project Drill Hole Composites, P8075µm Feeds . . . . . . . . . . 17Table 22. - Triplicate Tail Assay Results, Leached Residues, Cyanidation Tests,
San Miguel Project Drill Hole Composites, P8075µm Feeds . . . . . . . . . . . . . . . . 17Table 23. - Overall Metallurgical Results, Direct Agitated Cyanidation Tests,
San Miguel Project Drill Hole Composites, P8075µm Feeds . . . . . . . . . . . . . . . . 18Figure 3. - Gold and Silver Leach Rate Profiles, Direct Agitated Cyanidation
Tests, San Miguel Project Drill Hole Composites, P8075µm Feeds . . . . . 18Table 24. - Triplicate Tail Assay Results, Leached Residues, Cyanidation Tests,
San Miguel Project Drill Hole Composites, P8075µm Feeds . . . . . . . . . . . . . . . . 18Table 25. - Overall Metallurgical Results, Direct Agitated Cyanidation Tests,
Chihuahua Composites, P8075µm (200M) Feeds . . . . . . . . . . . . . . . . . . . . . . . . . 19Figure 4. - Gold Leach Rate Profiles, Direct Agitated Cyanidation Tests,
Chihuahua Composites, P8075µm (200M) Feeds . . . . . . . . . . . . . . . . . . . 19Table 26. - Tail Assay Results, Cyanide Leached Residues, Chihuahua
Composites, P8075µm (200M) Feeds . . . . . . . . . . . . . . . . . . . . . . . . . . . . . . . . . . 19
Mr. Chris Crupi / Paramount Gold and Silver Corp.Table of Contents - April 4, 2011
iii
McCLELLAND LABORATORIES, INC.
BULK SULFIDE FLOTATION TEST PROCEDURES AND RESULTS . . . . . . . . . . . . . 20Table 27. - Overall Metallurgical Results, Bulk Sulfide Flotation Tests,
San Miguel Project Drill Hole Composites, P8075µm Mesh . . . . . . . . . . . . . . . . 21Table 28. - Overall Metallurgical Results, Bulk Sulfide Rougher Flotation Test
Calculations, San Miguel Project Drill Hole Composites, P8075µm Mesh . . . . . 22Table 29. - Ro. Tail Assay Results, Bulk Sulfide Flotation Tests,
San Miguel Project Drill Hole Composites, P8075µm Mesh Feeds . . . . . . . . . . . 23Table 30. - Bulk Sulfide Flotation Test Results for Au and Ag, Chihuahua
Hi Au Sample, P8075µm Feed . . . . . . . . . . . . . . . . . . . . . . . . . . . . . . . . . . . . . . . 23Table 31. - Bulk Sulfide Flotation Test Results for Au and Ag, Chihuahua
Hi Ag, Low Au, P8075µm Feed . . . . . . . . . . . . . . . . . . . . . . . . . . . . . . . . . . . . . . 23Table 32. - Ro. Tail Assay Results, Bulk Sulfide Flotation Tests, Chihuahua
Hi Au and Hi Ag, Low Au Samples, P8075µm Feeds . . . . . . . . . . . . . . . . . . . . . 24Table 33. - Bulk Sulfide Flotation Test Results for Cu, Pb, Zn, Fe and S (Total),
Chihuahua Hi Au Sample, P8075µm Feed . . . . . . . . . . . . . . . . . . . . . . . . . . . . . . 24Table 34. - Bulk Sulfide Flotation Test Results for Cu, Pb, Zn, Fe and S (Total),
Chihuahua Hi Ag, Low Au Sample, P8075µm Feed . . . . . . . . . . . . . . . . . . . . . . 24
CONCLUSIONS . . . . . . . . . . . . . . . . . . . . . . . . . . . . . . . . . . . . . . . . . . . . . . . . . . . . . . . . . . . . 25
RECOMMENDATION . . . . . . . . . . . . . . . . . . . . . . . . . . . . . . . . . . . . . . . . . . . . . . . . . . . . . . . 25
In association with H.J. Heinen
McCLELLAND LABORATORIES, INC. 1016 Greg Street, Sparks, Nevada 89431 (775) 356-1300
FAX (775) 356-8917E-MAIL [email protected]
Reporton
Metallurgical Evaluation -11 San Miguel Drill Hole Composites
MLI Job No. 3463April 4, 2011
for
Mr. Chris CrupiParamount Gold and Silver Corp.
665 Anderson Street Winnemucca, Nevada 89445
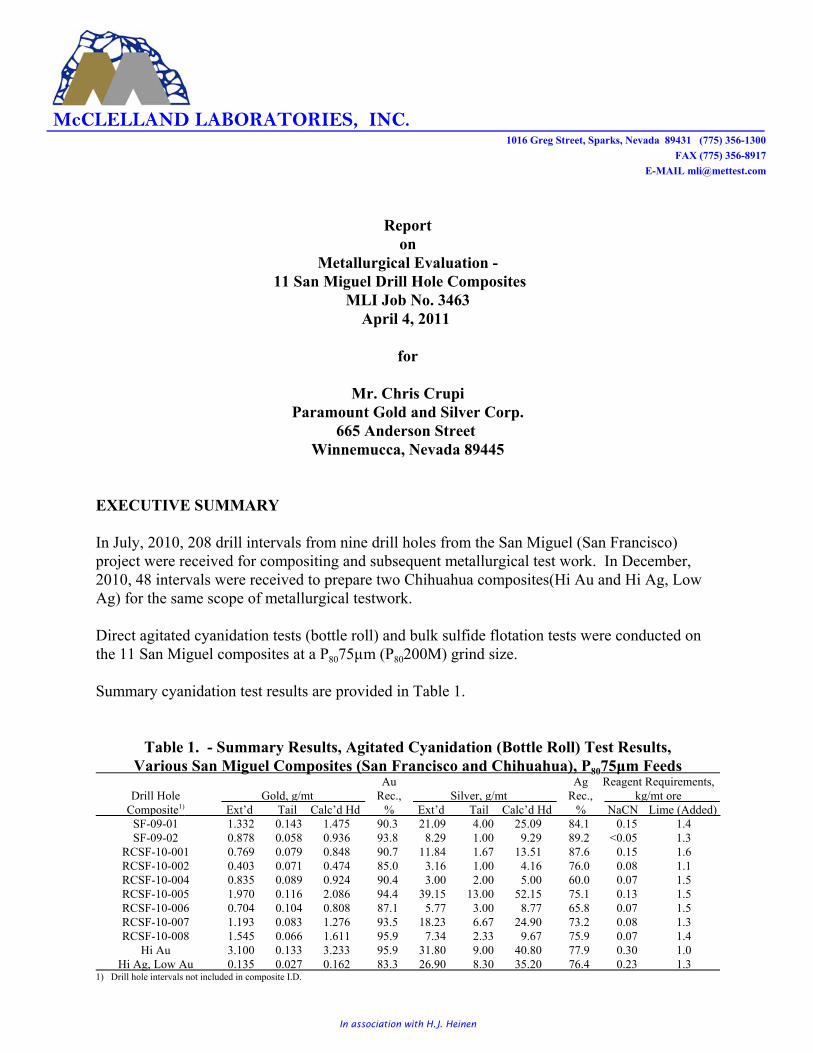
EXECUTIVE SUMMARY
In July, 2010, 208 drill intervals from nine drill holes from the San Miguel (San Francisco)project were received for compositing and subsequent metallurgical test work. In December,2010, 48 intervals were received to prepare two Chihuahua composites(Hi Au and Hi Ag, LowAg) for the same scope of metallurgical testwork.
Direct agitated cyanidation tests (bottle roll) and bulk sulfide flotation tests were conducted onthe 11 San Miguel composites at a P8075µm (P80200M) grind size.
Summary cyanidation test results are provided in Table 1.
Table 1. - Summary Results, Agitated Cyanidation (Bottle Roll) Test Results,Various San Miguel Composites (San Francisco and Chihuahua), P8075µm Feeds
Au Ag Reagent Requirements,Drill Hole Gold, g/mt Rec., Silver, g/mt Rec., kg/mt ore
Composite1) Ext’d Tail Calc’d Hd % Ext’d Tail Calc’d Hd % NaCN Lime (Added)SF-09-01 1.332 0.143 1.475 90.3 21.09 4.00 25.09 84.1 0.15 1.4SF-09-02 0.878 0.058 0.936 93.8 8.29 1.00 9.29 89.2 <0.05 1.3
RCSF-10-001 0.769 0.079 0.848 90.7 11.84 1.67 13.51 87.6 0.15 1.6RCSF-10-002 0.403 0.071 0.474 85.0 3.16 1.00 4.16 76.0 0.08 1.1RCSF-10-004 0.835 0.089 0.924 90.4 3.00 2.00 5.00 60.0 0.07 1.5RCSF-10-005 1.970 0.116 2.086 94.4 39.15 13.00 52.15 75.1 0.13 1.5RCSF-10-006 0.704 0.104 0.808 87.1 5.77 3.00 8.77 65.8 0.07 1.5RCSF-10-007 1.193 0.083 1.276 93.5 18.23 6.67 24.90 73.2 0.08 1.3RCSF-10-008 1.545 0.066 1.611 95.9 7.34 2.33 9.67 75.9 0.07 1.4
Hi Au 3.100 0.133 3.233 95.9 31.80 9.00 40.80 77.9 0.30 1.0Hi Ag, Low Au 0.135 0.027 0.162 83.3 26.90 8.30 35.20 76.4 0.23 1.3
1) Drill hole intervals not included in composite I.D.
Mr. Chris Crupi / Paramount Gold and Silver Corp.MLI Job No. 3463 - April 4, 2011
2
McCLELLAND LABORATORIES, INC.
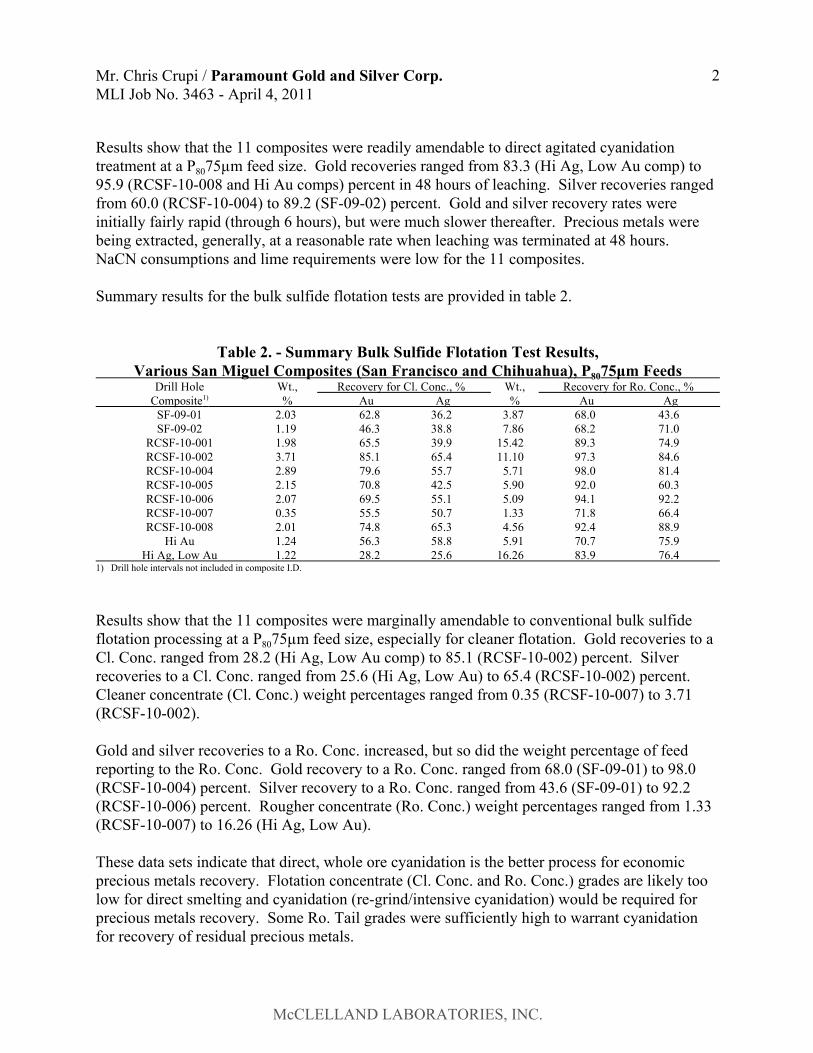
Results show that the 11 composites were readily amendable to direct agitated cyanidationtreatment at a P8075µm feed size. Gold recoveries ranged from 83.3 (Hi Ag, Low Au comp) to95.9 (RCSF-10-008 and Hi Au comps) percent in 48 hours of leaching. Silver recoveries rangedfrom 60.0 (RCSF-10-004) to 89.2 (SF-09-02) percent. Gold and silver recovery rates wereinitially fairly rapid (through 6 hours), but were much slower thereafter. Precious metals werebeing extracted, generally, at a reasonable rate when leaching was terminated at 48 hours. NaCN consumptions and lime requirements were low for the 11 composites.
Summary results for the bulk sulfide flotation tests are provided in table 2.
Table 2. - Summary Bulk Sulfide Flotation Test Results,Various San Miguel Composites (San Francisco and Chihuahua), P8075µm Feeds
Drill Hole Wt., Recovery for Cl. Conc., % Wt., Recovery for Ro. Conc., %Composite1) % Au Ag % Au Ag
SF-09-01 2.03 62.8 36.2 3.87 68.0 43.6SF-09-02 1.19 46.3 38.8 7.86 68.2 71.0
RCSF-10-001 1.98 65.5 39.9 15.42 89.3 74.9RCSF-10-002 3.71 85.1 65.4 11.10 97.3 84.6RCSF-10-004 2.89 79.6 55.7 5.71 98.0 81.4RCSF-10-005 2.15 70.8 42.5 5.90 92.0 60.3RCSF-10-006 2.07 69.5 55.1 5.09 94.1 92.2RCSF-10-007 0.35 55.5 50.7 1.33 71.8 66.4RCSF-10-008 2.01 74.8 65.3 4.56 92.4 88.9
Hi Au 1.24 56.3 58.8 5.91 70.7 75.9Hi Ag, Low Au 1.22 28.2 25.6 16.26 83.9 76.4
1) Drill hole intervals not included in composite I.D.
Results show that the 11 composites were marginally amendable to conventional bulk sulfideflotation processing at a P8075µm feed size, especially for cleaner flotation. Gold recoveries to aCl. Conc. ranged from 28.2 (Hi Ag, Low Au comp) to 85.1 (RCSF-10-002) percent. Silverrecoveries to a Cl. Conc. ranged from 25.6 (Hi Ag, Low Au) to 65.4 (RCSF-10-002) percent. Cleaner concentrate (Cl. Conc.) weight percentages ranged from 0.35 (RCSF-10-007) to 3.71(RCSF-10-002).
Gold and silver recoveries to a Ro. Conc. increased, but so did the weight percentage of feedreporting to the Ro. Conc. Gold recovery to a Ro. Conc. ranged from 68.0 (SF-09-01) to 98.0(RCSF-10-004) percent. Silver recovery to a Ro. Conc. ranged from 43.6 (SF-09-01) to 92.2(RCSF-10-006) percent. Rougher concentrate (Ro. Conc.) weight percentages ranged from 1.33(RCSF-10-007) to 16.26 (Hi Ag, Low Au).
These data sets indicate that direct, whole ore cyanidation is the better process for economicprecious metals recovery. Flotation concentrate (Cl. Conc. and Ro. Conc.) grades are likely toolow for direct smelting and cyanidation (re-grind/intensive cyanidation) would be required forprecious metals recovery. Some Ro. Tail grades were sufficiently high to warrant cyanidationfor recovery of residual precious metals.
Mr. Chris Crupi / Paramount Gold and Silver Corp.MLI Job No. 3463 - April 4, 2011
3
McCLELLAND LABORATORIES, INC.
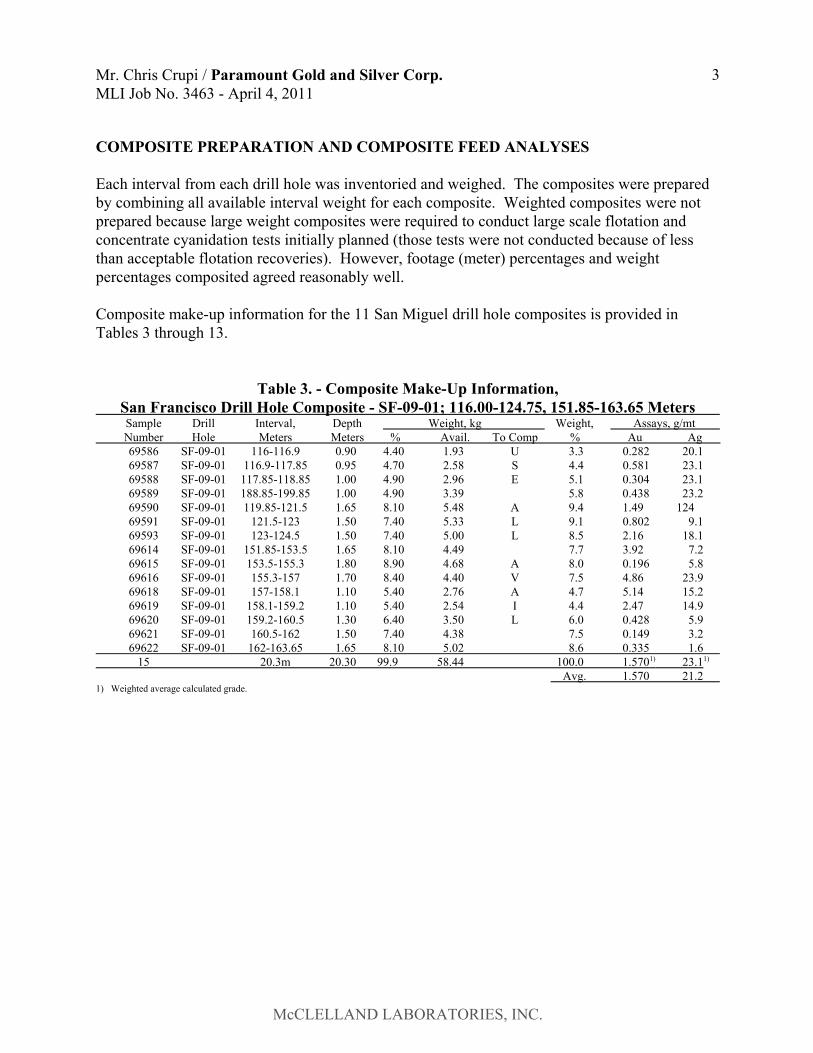
COMPOSITE PREPARATION AND COMPOSITE FEED ANALYSES
Each interval from each drill hole was inventoried and weighed. The composites were preparedby combining all available interval weight for each composite. Weighted composites were notprepared because large weight composites were required to conduct large scale flotation andconcentrate cyanidation tests initially planned (those tests were not conducted because of lessthan acceptable flotation recoveries). However, footage (meter) percentages and weightpercentages composited agreed reasonably well.
Composite make-up information for the 11 San Miguel drill hole composites is provided inTables 3 through 13.
Table 3. - Composite Make-Up Information,San Francisco Drill Hole Composite - SF-09-01; 116.00-124.75, 151.85-163.65 MetersSample Drill Interval, Depth Weight, kg Weight, Assays, g/mtNumber Hole Meters Meters % Avail. To Comp % Au Ag69586 SF-09-01 116-116.9 0.90 4.40 1.93 U 3.3 0.282 20.169587 SF-09-01 116.9-117.85 0.95 4.70 2.58 S 4.4 0.581 23.169588 SF-09-01 117.85-118.85 1.00 4.90 2.96 E 5.1 0.304 23.169589 SF-09-01 188.85-199.85 1.00 4.90 3.39 5.8 0.438 23.269590 SF-09-01 119.85-121.5 1.65 8.10 5.48 A 9.4 1.49 12469591 SF-09-01 121.5-123 1.50 7.40 5.33 L 9.1 0.802 9.169593 SF-09-01 123-124.5 1.50 7.40 5.00 L 8.5 2.16 18.169614 SF-09-01 151.85-153.5 1.65 8.10 4.49 7.7 3.92 7.269615 SF-09-01 153.5-155.3 1.80 8.90 4.68 A 8.0 0.196 5.869616 SF-09-01 155.3-157 1.70 8.40 4.40 V 7.5 4.86 23.969618 SF-09-01 157-158.1 1.10 5.40 2.76 A 4.7 5.14 15.269619 SF-09-01 158.1-159.2 1.10 5.40 2.54 I 4.4 2.47 14.969620 SF-09-01 159.2-160.5 1.30 6.40 3.50 L 6.0 0.428 5.969621 SF-09-01 160.5-162 1.50 7.40 4.38 7.5 0.149 3.269622 SF-09-01 162-163.65 1.65 8.10 5.02 8.6 0.335 1.6
15 20.3m 20.30 99.9 58.44 100.0 1.5701) 23.11)
Avg. 1.570 21.21) Weighted average calculated grade.
Mr. Chris Crupi / Paramount Gold and Silver Corp.MLI Job No. 3463 - April 4, 2011
4
McCLELLAND LABORATORIES, INC.
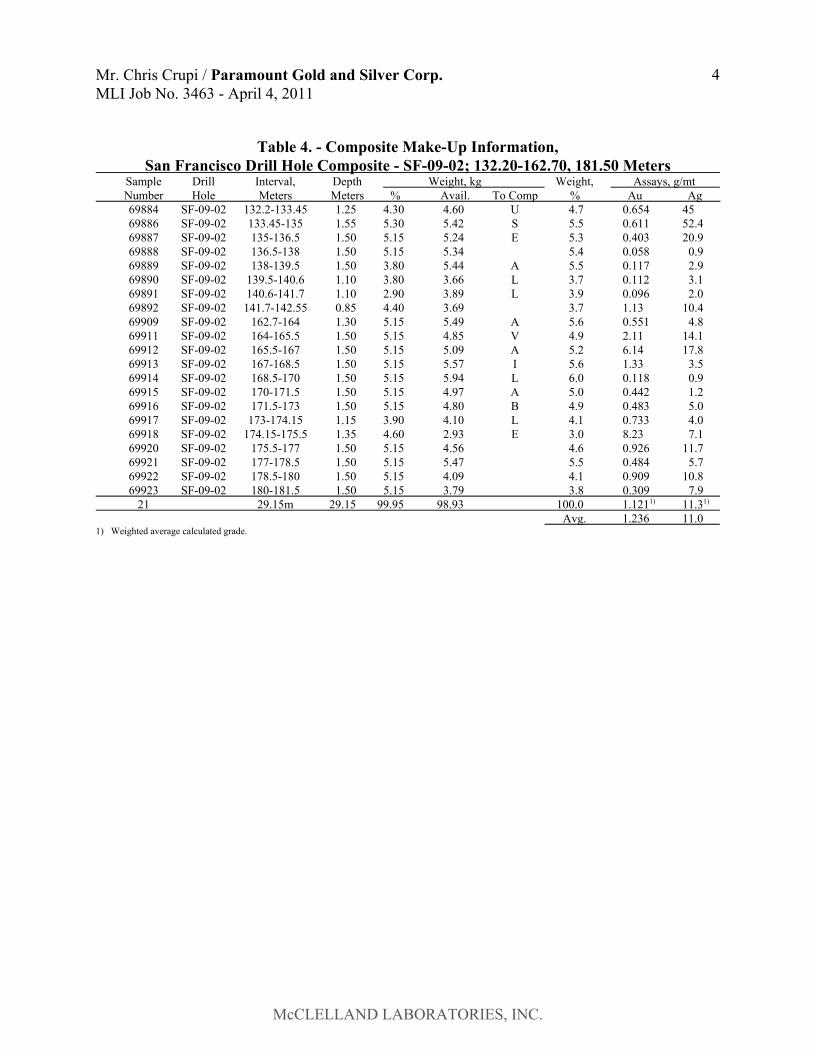
Table 4. - Composite Make-Up Information,San Francisco Drill Hole Composite - SF-09-02; 132.20-162.70, 181.50 Meters
Sample Drill Interval, Depth Weight, kg Weight, Assays, g/mtNumber Hole Meters Meters % Avail. To Comp % Au Ag69884 SF-09-02 132.2-133.45 1.25 4.30 4.60 U 4.7 0.654 4569886 SF-09-02 133.45-135 1.55 5.30 5.42 S 5.5 0.611 52.469887 SF-09-02 135-136.5 1.50 5.15 5.24 E 5.3 0.403 20.969888 SF-09-02 136.5-138 1.50 5.15 5.34 5.4 0.058 0.969889 SF-09-02 138-139.5 1.50 3.80 5.44 A 5.5 0.117 2.969890 SF-09-02 139.5-140.6 1.10 3.80 3.66 L 3.7 0.112 3.169891 SF-09-02 140.6-141.7 1.10 2.90 3.89 L 3.9 0.096 2.069892 SF-09-02 141.7-142.55 0.85 4.40 3.69 3.7 1.13 10.469909 SF-09-02 162.7-164 1.30 5.15 5.49 A 5.6 0.551 4.869911 SF-09-02 164-165.5 1.50 5.15 4.85 V 4.9 2.11 14.169912 SF-09-02 165.5-167 1.50 5.15 5.09 A 5.2 6.14 17.869913 SF-09-02 167-168.5 1.50 5.15 5.57 I 5.6 1.33 3.569914 SF-09-02 168.5-170 1.50 5.15 5.94 L 6.0 0.118 0.969915 SF-09-02 170-171.5 1.50 5.15 4.97 A 5.0 0.442 1.269916 SF-09-02 171.5-173 1.50 5.15 4.80 B 4.9 0.483 5.069917 SF-09-02 173-174.15 1.15 3.90 4.10 L 4.1 0.733 4.069918 SF-09-02 174.15-175.5 1.35 4.60 2.93 E 3.0 8.23 7.169920 SF-09-02 175.5-177 1.50 5.15 4.56 4.6 0.926 11.769921 SF-09-02 177-178.5 1.50 5.15 5.47 5.5 0.484 5.769922 SF-09-02 178.5-180 1.50 5.15 4.09 4.1 0.909 10.869923 SF-09-02 180-181.5 1.50 5.15 3.79 3.8 0.309 7.9
21 29.15m 29.15 99.95 98.93 100.0 1.1211) 11.31)
Avg. 1.236 11.01) Weighted average calculated grade.
Mr. Chris Crupi / Paramount Gold and Silver Corp.MLI Job No. 3463 - April 4, 2011
5
McCLELLAND LABORATORIES, INC.
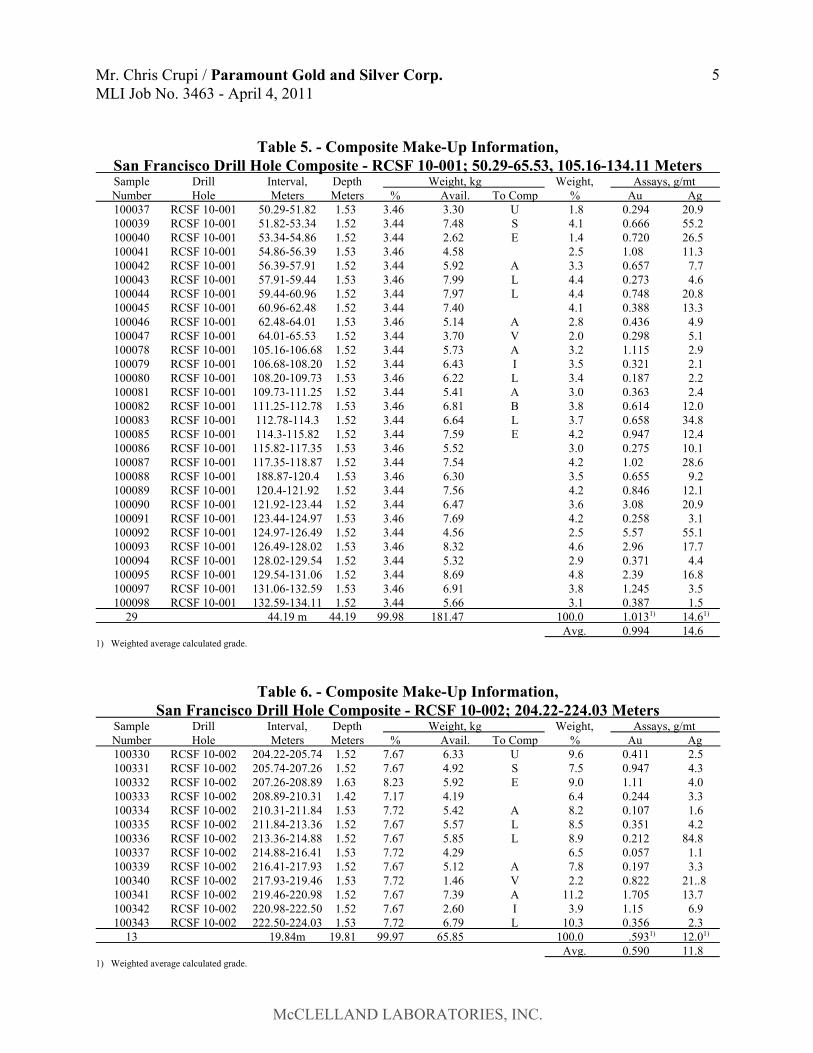
Table 5. - Composite Make-Up Information,San Francisco Drill Hole Composite - RCSF 10-001; 50.29-65.53, 105.16-134.11 MetersSample Drill Interval, Depth Weight, kg Weight, Assays, g/mtNumber Hole Meters Meters % Avail. To Comp % Au Ag100037 RCSF 10-001 50.29-51.82 1.53 3.46 3.30 U 1.8 0.294 20.9100039 RCSF 10-001 51.82-53.34 1.52 3.44 7.48 S 4.1 0.666 55.2100040 RCSF 10-001 53.34-54.86 1.52 3.44 2.62 E 1.4 0.720 26.5100041 RCSF 10-001 54.86-56.39 1.53 3.46 4.58 2.5 1.08 11.3100042 RCSF 10-001 56.39-57.91 1.52 3.44 5.92 A 3.3 0.657 7.7100043 RCSF 10-001 57.91-59.44 1.53 3.46 7.99 L 4.4 0.273 4.6100044 RCSF 10-001 59.44-60.96 1.52 3.44 7.97 L 4.4 0.748 20.8100045 RCSF 10-001 60.96-62.48 1.52 3.44 7.40 4.1 0.388 13.3100046 RCSF 10-001 62.48-64.01 1.53 3.46 5.14 A 2.8 0.436 4.9100047 RCSF 10-001 64.01-65.53 1.52 3.44 3.70 V 2.0 0.298 5.1100078 RCSF 10-001 105.16-106.68 1.52 3.44 5.73 A 3.2 1.115 2.9100079 RCSF 10-001 106.68-108.20 1.52 3.44 6.43 I 3.5 0.321 2.1100080 RCSF 10-001 108.20-109.73 1.53 3.46 6.22 L 3.4 0.187 2.2100081 RCSF 10-001 109.73-111.25 1.52 3.44 5.41 A 3.0 0.363 2.4100082 RCSF 10-001 111.25-112.78 1.53 3.46 6.81 B 3.8 0.614 12.0100083 RCSF 10-001 112.78-114.3 1.52 3.44 6.64 L 3.7 0.658 34.8100085 RCSF 10-001 114.3-115.82 1.52 3.44 7.59 E 4.2 0.947 12.4100086 RCSF 10-001 115.82-117.35 1.53 3.46 5.52 3.0 0.275 10.1100087 RCSF 10-001 117.35-118.87 1.52 3.44 7.54 4.2 1.02 28.6100088 RCSF 10-001 188.87-120.4 1.53 3.46 6.30 3.5 0.655 9.2100089 RCSF 10-001 120.4-121.92 1.52 3.44 7.56 4.2 0.846 12.1100090 RCSF 10-001 121.92-123.44 1.52 3.44 6.47 3.6 3.08 20.9100091 RCSF 10-001 123.44-124.97 1.53 3.46 7.69 4.2 0.258 3.1100092 RCSF 10-001 124.97-126.49 1.52 3.44 4.56 2.5 5.57 55.1100093 RCSF 10-001 126.49-128.02 1.53 3.46 8.32 4.6 2.96 17.7100094 RCSF 10-001 128.02-129.54 1.52 3.44 5.32 2.9 0.371 4.4100095 RCSF 10-001 129.54-131.06 1.52 3.44 8.69 4.8 2.39 16.8100097 RCSF 10-001 131.06-132.59 1.53 3.46 6.91 3.8 1.245 3.5100098 RCSF 10-001 132.59-134.11 1.52 3.44 5.66 3.1 0.387 1.5
29 44.19 m 44.19 99.98 181.47 100.0 1.0131) 14.61)
Avg. 0.994 14.61) Weighted average calculated grade.
Table 6. - Composite Make-Up Information,San Francisco Drill Hole Composite - RCSF 10-002; 204.22-224.03 Meters
Sample Drill Interval, Depth Weight, kg Weight, Assays, g/mtNumber Hole Meters Meters % Avail. To Comp % Au Ag100330 RCSF 10-002 204.22-205.74 1.52 7.67 6.33 U 9.6 0.411 2.5100331 RCSF 10-002 205.74-207.26 1.52 7.67 4.92 S 7.5 0.947 4.3100332 RCSF 10-002 207.26-208.89 1.63 8.23 5.92 E 9.0 1.11 4.0100333 RCSF 10-002 208.89-210.31 1.42 7.17 4.19 6.4 0.244 3.3100334 RCSF 10-002 210.31-211.84 1.53 7.72 5.42 A 8.2 0.107 1.6100335 RCSF 10-002 211.84-213.36 1.52 7.67 5.57 L 8.5 0.351 4.2100336 RCSF 10-002 213.36-214.88 1.52 7.67 5.85 L 8.9 0.212 84.8100337 RCSF 10-002 214.88-216.41 1.53 7.72 4.29 6.5 0.057 1.1100339 RCSF 10-002 216.41-217.93 1.52 7.67 5.12 A 7.8 0.197 3.3100340 RCSF 10-002 217.93-219.46 1.53 7.72 1.46 V 2.2 0.822 21..8100341 RCSF 10-002 219.46-220.98 1.52 7.67 7.39 A 11.2 1.705 13.7100342 RCSF 10-002 220.98-222.50 1.52 7.67 2.60 I 3.9 1.15 6.9100343 RCSF 10-002 222.50-224.03 1.53 7.72 6.79 L 10.3 0.356 2.3
13 19.84m 19.81 99.97 65.85 100.0 .5931) 12.01)
Avg. 0.590 11.81) Weighted average calculated grade.
Mr. Chris Crupi / Paramount Gold and Silver Corp.MLI Job No. 3463 - April 4, 2011
6
McCLELLAND LABORATORIES, INC.
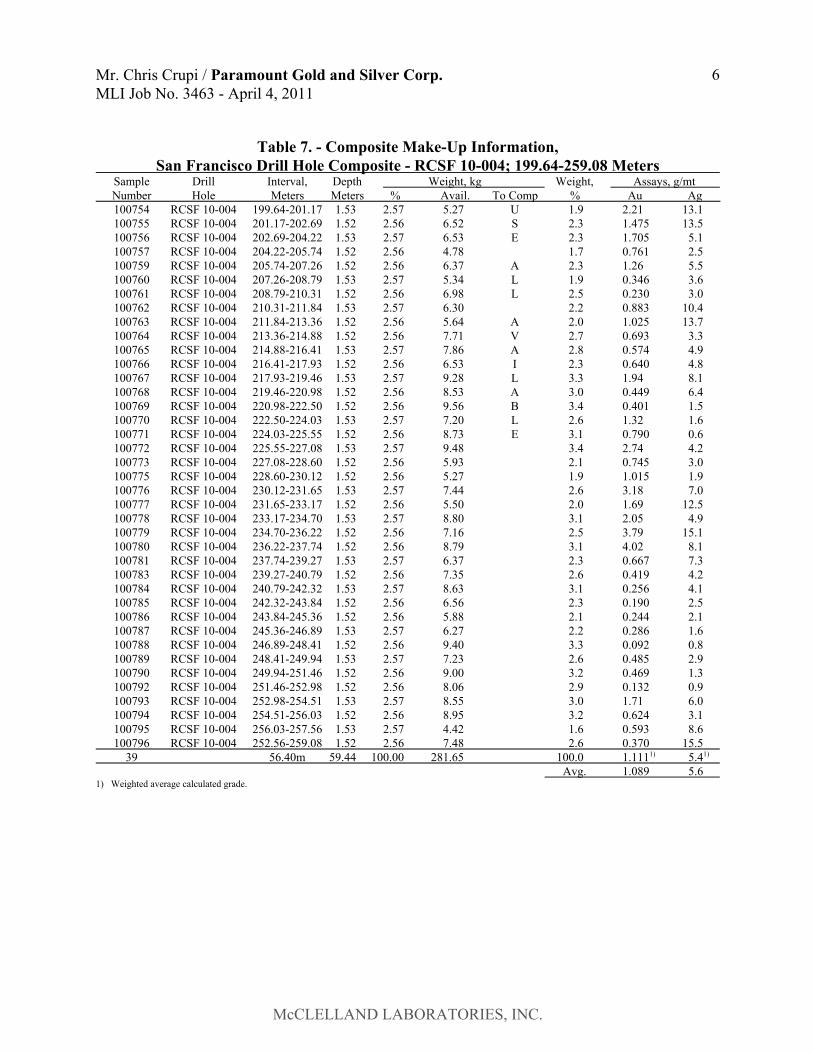
Table 7. - Composite Make-Up Information,San Francisco Drill Hole Composite - RCSF 10-004; 199.64-259.08 Meters
Sample Drill Interval, Depth Weight, kg Weight, Assays, g/mtNumber Hole Meters Meters % Avail. To Comp % Au Ag100754 RCSF 10-004 199.64-201.17 1.53 2.57 5.27 U 1.9 2.21 13.1100755 RCSF 10-004 201.17-202.69 1.52 2.56 6.52 S 2.3 1.475 13.5100756 RCSF 10-004 202.69-204.22 1.53 2.57 6.53 E 2.3 1.705 5.1100757 RCSF 10-004 204.22-205.74 1.52 2.56 4.78 1.7 0.761 2.5100759 RCSF 10-004 205.74-207.26 1.52 2.56 6.37 A 2.3 1.26 5.5100760 RCSF 10-004 207.26-208.79 1.53 2.57 5.34 L 1.9 0.346 3.6100761 RCSF 10-004 208.79-210.31 1.52 2.56 6.98 L 2.5 0.230 3.0100762 RCSF 10-004 210.31-211.84 1.53 2.57 6.30 2.2 0.883 10.4100763 RCSF 10-004 211.84-213.36 1.52 2.56 5.64 A 2.0 1.025 13.7100764 RCSF 10-004 213.36-214.88 1.52 2.56 7.71 V 2.7 0.693 3.3100765 RCSF 10-004 214.88-216.41 1.53 2.57 7.86 A 2.8 0.574 4.9100766 RCSF 10-004 216.41-217.93 1.52 2.56 6.53 I 2.3 0.640 4.8100767 RCSF 10-004 217.93-219.46 1.53 2.57 9.28 L 3.3 1.94 8.1100768 RCSF 10-004 219.46-220.98 1.52 2.56 8.53 A 3.0 0.449 6.4100769 RCSF 10-004 220.98-222.50 1.52 2.56 9.56 B 3.4 0.401 1.5100770 RCSF 10-004 222.50-224.03 1.53 2.57 7.20 L 2.6 1.32 1.6100771 RCSF 10-004 224.03-225.55 1.52 2.56 8.73 E 3.1 0.790 0.6100772 RCSF 10-004 225.55-227.08 1.53 2.57 9.48 3.4 2.74 4.2100773 RCSF 10-004 227.08-228.60 1.52 2.56 5.93 2.1 0.745 3.0100775 RCSF 10-004 228.60-230.12 1.52 2.56 5.27 1.9 1.015 1.9100776 RCSF 10-004 230.12-231.65 1.53 2.57 7.44 2.6 3.18 7.0100777 RCSF 10-004 231.65-233.17 1.52 2.56 5.50 2.0 1.69 12.5100778 RCSF 10-004 233.17-234.70 1.53 2.57 8.80 3.1 2.05 4.9100779 RCSF 10-004 234.70-236.22 1.52 2.56 7.16 2.5 3.79 15.1100780 RCSF 10-004 236.22-237.74 1.52 2.56 8.79 3.1 4.02 8.1100781 RCSF 10-004 237.74-239.27 1.53 2.57 6.37 2.3 0.667 7.3100783 RCSF 10-004 239.27-240.79 1.52 2.56 7.35 2.6 0.419 4.2100784 RCSF 10-004 240.79-242.32 1.53 2.57 8.63 3.1 0.256 4.1100785 RCSF 10-004 242.32-243.84 1.52 2.56 6.56 2.3 0.190 2.5100786 RCSF 10-004 243.84-245.36 1.52 2.56 5.88 2.1 0.244 2.1100787 RCSF 10-004 245.36-246.89 1.53 2.57 6.27 2.2 0.286 1.6100788 RCSF 10-004 246.89-248.41 1.52 2.56 9.40 3.3 0.092 0.8100789 RCSF 10-004 248.41-249.94 1.53 2.57 7.23 2.6 0.485 2.9100790 RCSF 10-004 249.94-251.46 1.52 2.56 9.00 3.2 0.469 1.3100792 RCSF 10-004 251.46-252.98 1.52 2.56 8.06 2.9 0.132 0.9100793 RCSF 10-004 252.98-254.51 1.53 2.57 8.55 3.0 1.71 6.0100794 RCSF 10-004 254.51-256.03 1.52 2.56 8.95 3.2 0.624 3.1100795 RCSF 10-004 256.03-257.56 1.53 2.57 4.42 1.6 0.593 8.6100796 RCSF 10-004 252.56-259.08 1.52 2.56 7.48 2.6 0.370 15.5
39 56.40m 59.44 100.00 281.65 100.0 1.1111) 5.41)
Avg. 1.089 5.61) Weighted average calculated grade.
Mr. Chris Crupi / Paramount Gold and Silver Corp.MLI Job No. 3463 - April 4, 2011
7
McCLELLAND LABORATORIES, INC.
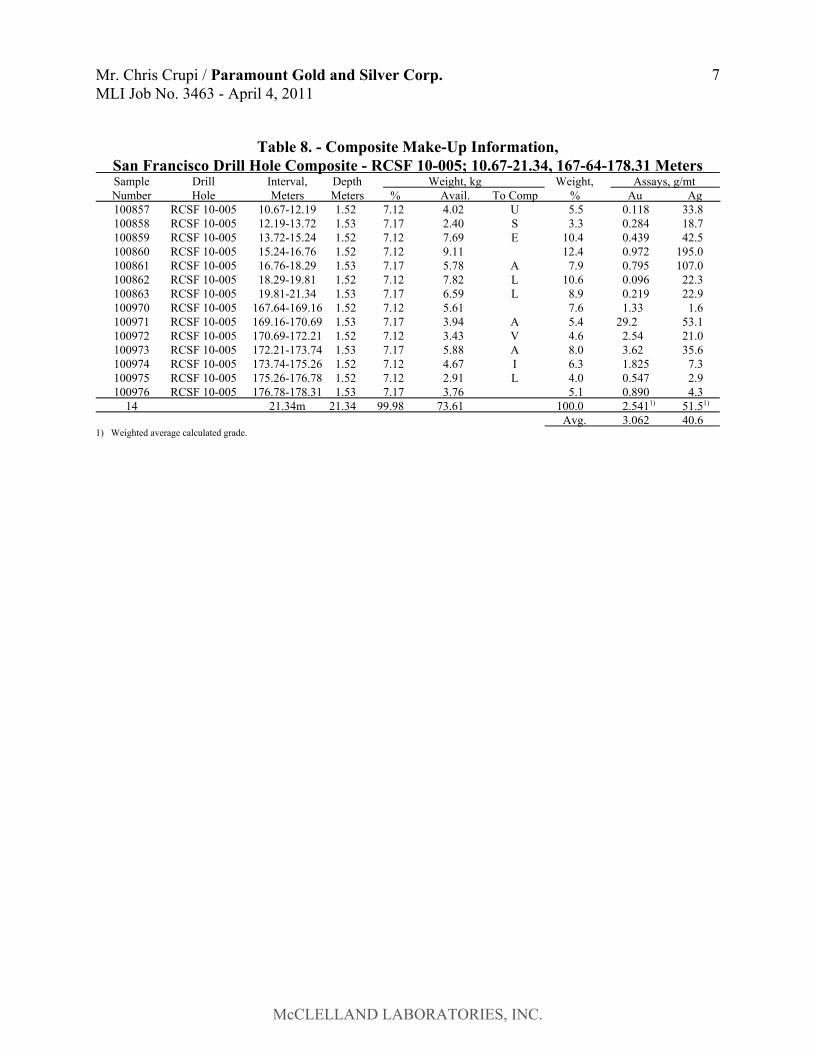
Table 8. - Composite Make-Up Information,San Francisco Drill Hole Composite - RCSF 10-005; 10.67-21.34, 167-64-178.31 MetersSample Drill Interval, Depth Weight, kg Weight, Assays, g/mtNumber Hole Meters Meters % Avail. To Comp % Au Ag100857 RCSF 10-005 10.67-12.19 1.52 7.12 4.02 U 5.5 0.118 33.8100858 RCSF 10-005 12.19-13.72 1.53 7.17 2.40 S 3.3 0.284 18.7100859 RCSF 10-005 13.72-15.24 1.52 7.12 7.69 E 10.4 0.439 42.5100860 RCSF 10-005 15.24-16.76 1.52 7.12 9.11 12.4 0.972 195.0100861 RCSF 10-005 16.76-18.29 1.53 7.17 5.78 A 7.9 0.795 107.0100862 RCSF 10-005 18.29-19.81 1.52 7.12 7.82 L 10.6 0.096 22.3100863 RCSF 10-005 19.81-21.34 1.53 7.17 6.59 L 8.9 0.219 22.9100970 RCSF 10-005 167.64-169.16 1.52 7.12 5.61 7.6 1.33 1.6100971 RCSF 10-005 169.16-170.69 1.53 7.17 3.94 A 5.4 29.2 53.1100972 RCSF 10-005 170.69-172.21 1.52 7.12 3.43 V 4.6 2.54 21.0100973 RCSF 10-005 172.21-173.74 1.53 7.17 5.88 A 8.0 3.62 35.6100974 RCSF 10-005 173.74-175.26 1.52 7.12 4.67 I 6.3 1.825 7.3100975 RCSF 10-005 175.26-176.78 1.52 7.12 2.91 L 4.0 0.547 2.9100976 RCSF 10-005 176.78-178.31 1.53 7.17 3.76 5.1 0.890 4.3
14 21.34m 21.34 99.98 73.61 100.0 2.5411) 51.51)
Avg. 3.062 40.61) Weighted average calculated grade.
Mr. Chris Crupi / Paramount Gold and Silver Corp.MLI Job No. 3463 - April 4, 2011
8
McCLELLAND LABORATORIES, INC.
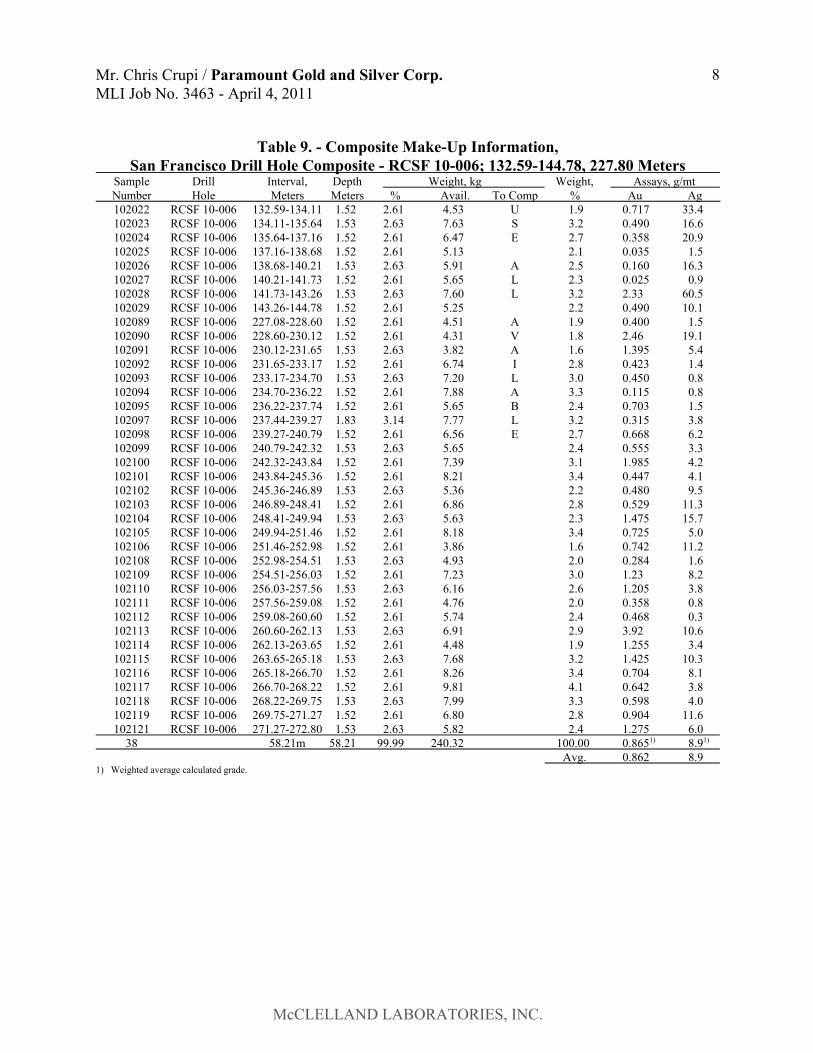
Table 9. - Composite Make-Up Information,San Francisco Drill Hole Composite - RCSF 10-006; 132.59-144.78, 227.80 Meters
Sample Drill Interval, Depth Weight, kg Weight, Assays, g/mtNumber Hole Meters Meters % Avail. To Comp % Au Ag102022 RCSF 10-006 132.59-134.11 1.52 2.61 4.53 U 1.9 0.717 33.4102023 RCSF 10-006 134.11-135.64 1.53 2.63 7.63 S 3.2 0.490 16.6102024 RCSF 10-006 135.64-137.16 1.52 2.61 6.47 E 2.7 0.358 20.9102025 RCSF 10-006 137.16-138.68 1.52 2.61 5.13 2.1 0.035 1.5102026 RCSF 10-006 138.68-140.21 1.53 2.63 5.91 A 2.5 0.160 16.3102027 RCSF 10-006 140.21-141.73 1.52 2.61 5.65 L 2.3 0.025 0.9102028 RCSF 10-006 141.73-143.26 1.53 2.63 7.60 L 3.2 2.33 60.5102029 RCSF 10-006 143.26-144.78 1.52 2.61 5.25 2.2 0.490 10.1102089 RCSF 10-006 227.08-228.60 1.52 2.61 4.51 A 1.9 0.400 1.5102090 RCSF 10-006 228.60-230.12 1.52 2.61 4.31 V 1.8 2.46 19.1102091 RCSF 10-006 230.12-231.65 1.53 2.63 3.82 A 1.6 1.395 5.4102092 RCSF 10-006 231.65-233.17 1.52 2.61 6.74 I 2.8 0.423 1.4102093 RCSF 10-006 233.17-234.70 1.53 2.63 7.20 L 3.0 0.450 0.8102094 RCSF 10-006 234.70-236.22 1.52 2.61 7.88 A 3.3 0.115 0.8102095 RCSF 10-006 236.22-237.74 1.52 2.61 5.65 B 2.4 0.703 1.5102097 RCSF 10-006 237.44-239.27 1.83 3.14 7.77 L 3.2 0.315 3.8102098 RCSF 10-006 239.27-240.79 1.52 2.61 6.56 E 2.7 0.668 6.2102099 RCSF 10-006 240.79-242.32 1.53 2.63 5.65 2.4 0.555 3.3102100 RCSF 10-006 242.32-243.84 1.52 2.61 7.39 3.1 1.985 4.2102101 RCSF 10-006 243.84-245.36 1.52 2.61 8.21 3.4 0.447 4.1102102 RCSF 10-006 245.36-246.89 1.53 2.63 5.36 2.2 0.480 9.5102103 RCSF 10-006 246.89-248.41 1.52 2.61 6.86 2.8 0.529 11.3102104 RCSF 10-006 248.41-249.94 1.53 2.63 5.63 2.3 1.475 15.7102105 RCSF 10-006 249.94-251.46 1.52 2.61 8.18 3.4 0.725 5.0102106 RCSF 10-006 251.46-252.98 1.52 2.61 3.86 1.6 0.742 11.2102108 RCSF 10-006 252.98-254.51 1.53 2.63 4.93 2.0 0.284 1.6102109 RCSF 10-006 254.51-256.03 1.52 2.61 7.23 3.0 1.23 8.2102110 RCSF 10-006 256.03-257.56 1.53 2.63 6.16 2.6 1.205 3.8102111 RCSF 10-006 257.56-259.08 1.52 2.61 4.76 2.0 0.358 0.8102112 RCSF 10-006 259.08-260.60 1.52 2.61 5.74 2.4 0.468 0.3102113 RCSF 10-006 260.60-262.13 1.53 2.63 6.91 2.9 3.92 10.6102114 RCSF 10-006 262.13-263.65 1.52 2.61 4.48 1.9 1.255 3.4102115 RCSF 10-006 263.65-265.18 1.53 2.63 7.68 3.2 1.425 10.3102116 RCSF 10-006 265.18-266.70 1.52 2.61 8.26 3.4 0.704 8.1102117 RCSF 10-006 266.70-268.22 1.52 2.61 9.81 4.1 0.642 3.8102118 RCSF 10-006 268.22-269.75 1.53 2.63 7.99 3.3 0.598 4.0102119 RCSF 10-006 269.75-271.27 1.52 2.61 6.80 2.8 0.904 11.6102121 RCSF 10-006 271.27-272.80 1.53 2.63 5.82 2.4 1.275 6.0
38 58.21m 58.21 99.99 240.32 100.00 0.8651) 8.91)
Avg. 0.862 8.91) Weighted average calculated grade.
Mr. Chris Crupi / Paramount Gold and Silver Corp.MLI Job No. 3463 - April 4, 2011
9
McCLELLAND LABORATORIES, INC.
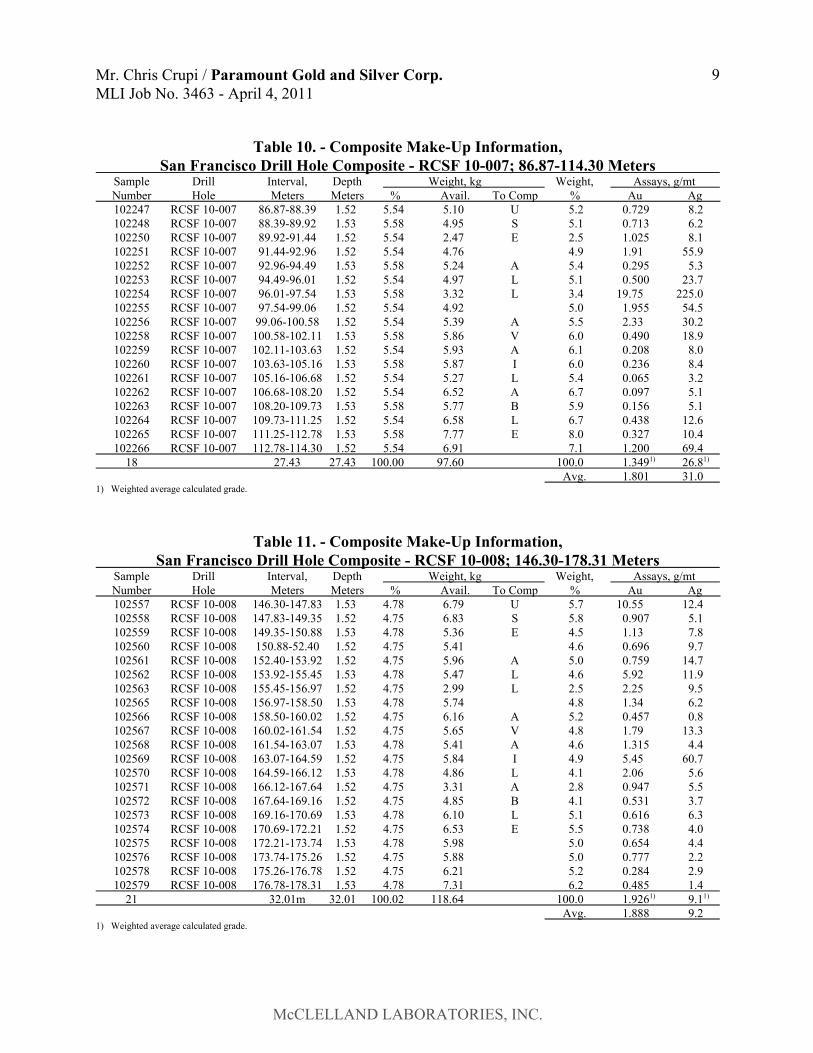
Table 10. - Composite Make-Up Information,San Francisco Drill Hole Composite - RCSF 10-007; 86.87-114.30 Meters
Sample Drill Interval, Depth Weight, kg Weight, Assays, g/mtNumber Hole Meters Meters % Avail. To Comp % Au Ag102247 RCSF 10-007 86.87-88.39 1.52 5.54 5.10 U 5.2 0.729 8.2102248 RCSF 10-007 88.39-89.92 1.53 5.58 4.95 S 5.1 0.713 6.2102250 RCSF 10-007 89.92-91.44 1.52 5.54 2.47 E 2.5 1.025 8.1102251 RCSF 10-007 91.44-92.96 1.52 5.54 4.76 4.9 1.91 55.9102252 RCSF 10-007 92.96-94.49 1.53 5.58 5.24 A 5.4 0.295 5.3102253 RCSF 10-007 94.49-96.01 1.52 5.54 4.97 L 5.1 0.500 23.7102254 RCSF 10-007 96.01-97.54 1.53 5.58 3.32 L 3.4 19.75 225.0102255 RCSF 10-007 97.54-99.06 1.52 5.54 4.92 5.0 1.955 54.5102256 RCSF 10-007 99.06-100.58 1.52 5.54 5.39 A 5.5 2.33 30.2102258 RCSF 10-007 100.58-102.11 1.53 5.58 5.86 V 6.0 0.490 18.9102259 RCSF 10-007 102.11-103.63 1.52 5.54 5.93 A 6.1 0.208 8.0102260 RCSF 10-007 103.63-105.16 1.53 5.58 5.87 I 6.0 0.236 8.4102261 RCSF 10-007 105.16-106.68 1.52 5.54 5.27 L 5.4 0.065 3.2102262 RCSF 10-007 106.68-108.20 1.52 5.54 6.52 A 6.7 0.097 5.1102263 RCSF 10-007 108.20-109.73 1.53 5.58 5.77 B 5.9 0.156 5.1102264 RCSF 10-007 109.73-111.25 1.52 5.54 6.58 L 6.7 0.438 12.6102265 RCSF 10-007 111.25-112.78 1.53 5.58 7.77 E 8.0 0.327 10.4102266 RCSF 10-007 112.78-114.30 1.52 5.54 6.91 7.1 1.200 69.4
18 27.43 27.43 100.00 97.60 100.0 1.3491) 26.81)
Avg. 1.801 31.01) Weighted average calculated grade.
Table 11. - Composite Make-Up Information,San Francisco Drill Hole Composite - RCSF 10-008; 146.30-178.31 Meters
Sample Drill Interval, Depth Weight, kg Weight, Assays, g/mtNumber Hole Meters Meters % Avail. To Comp % Au Ag102557 RCSF 10-008 146.30-147.83 1.53 4.78 6.79 U 5.7 10.55 12.4102558 RCSF 10-008 147.83-149.35 1.52 4.75 6.83 S 5.8 0.907 5.1102559 RCSF 10-008 149.35-150.88 1.53 4.78 5.36 E 4.5 1.13 7.8102560 RCSF 10-008 150.88-52.40 1.52 4.75 5.41 4.6 0.696 9.7102561 RCSF 10-008 152.40-153.92 1.52 4.75 5.96 A 5.0 0.759 14.7102562 RCSF 10-008 153.92-155.45 1.53 4.78 5.47 L 4.6 5.92 11.9102563 RCSF 10-008 155.45-156.97 1.52 4.75 2.99 L 2.5 2.25 9.5102565 RCSF 10-008 156.97-158.50 1.53 4.78 5.74 4.8 1.34 6.2102566 RCSF 10-008 158.50-160.02 1.52 4.75 6.16 A 5.2 0.457 0.8102567 RCSF 10-008 160.02-161.54 1.52 4.75 5.65 V 4.8 1.79 13.3102568 RCSF 10-008 161.54-163.07 1.53 4.78 5.41 A 4.6 1.315 4.4102569 RCSF 10-008 163.07-164.59 1.52 4.75 5.84 I 4.9 5.45 60.7102570 RCSF 10-008 164.59-166.12 1.53 4.78 4.86 L 4.1 2.06 5.6102571 RCSF 10-008 166.12-167.64 1.52 4.75 3.31 A 2.8 0.947 5.5102572 RCSF 10-008 167.64-169.16 1.52 4.75 4.85 B 4.1 0.531 3.7102573 RCSF 10-008 169.16-170.69 1.53 4.78 6.10 L 5.1 0.616 6.3102574 RCSF 10-008 170.69-172.21 1.52 4.75 6.53 E 5.5 0.738 4.0102575 RCSF 10-008 172.21-173.74 1.53 4.78 5.98 5.0 0.654 4.4102576 RCSF 10-008 173.74-175.26 1.52 4.75 5.88 5.0 0.777 2.2102578 RCSF 10-008 175.26-176.78 1.52 4.75 6.21 5.2 0.284 2.9102579 RCSF 10-008 176.78-178.31 1.53 4.78 7.31 6.2 0.485 1.4
21 32.01m 32.01 100.02 118.64 100.0 1.9261) 9.11)
Avg. 1.888 9.21) Weighted average calculated grade.
Mr. Chris Crupi / Paramount Gold and Silver Corp.MLI Job No. 3463 - April 4, 2011
10
McCLELLAND LABORATORIES, INC.
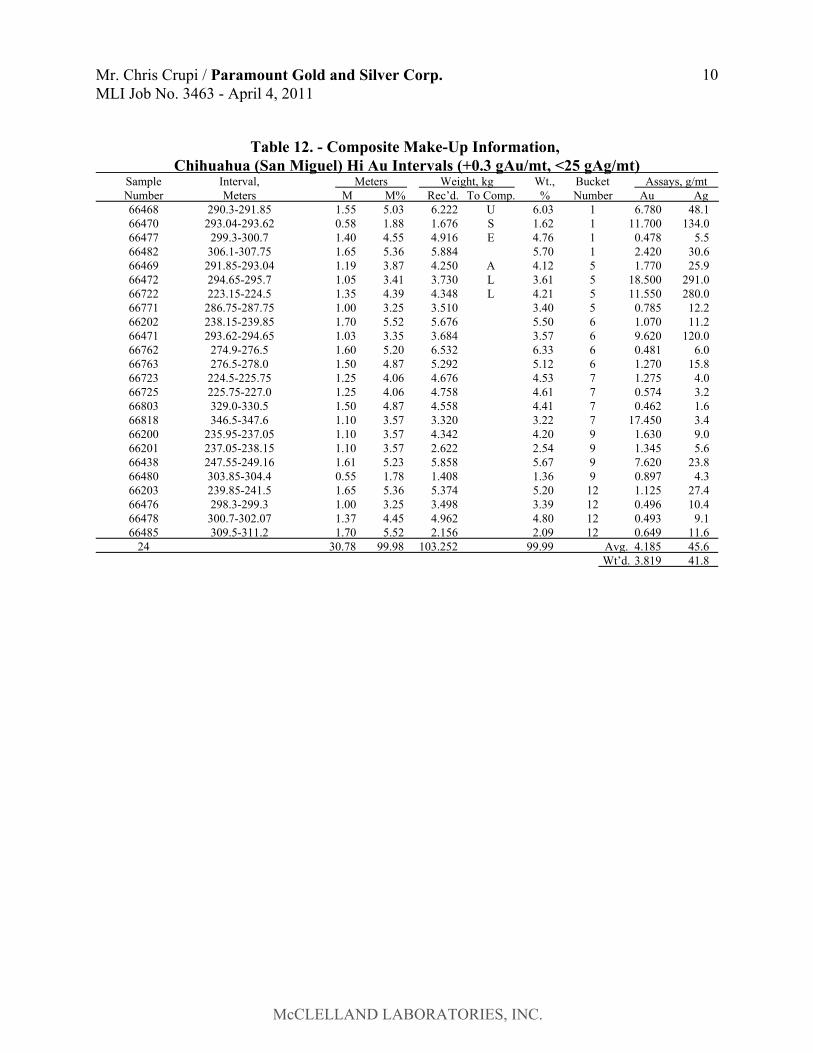
Table 12. - Composite Make-Up Information, Chihuahua (San Miguel) Hi Au Intervals (+0.3 gAu/mt, <25 gAg/mt)
Sample Interval, Meters Weight, kg Wt., Bucket Assays, g/mtNumber Meters M M% Rec’d. To Comp. % Number Au Ag66468 290.3-291.85 1.55 5.03 6.222 U 6.03 1 6.780 48.166470 293.04-293.62 0.58 1.88 1.676 S 1.62 1 11.700 134.066477 299.3-300.7 1.40 4.55 4.916 E 4.76 1 0.478 5.566482 306.1-307.75 1.65 5.36 5.884 5.70 1 2.420 30.666469 291.85-293.04 1.19 3.87 4.250 A 4.12 5 1.770 25.966472 294.65-295.7 1.05 3.41 3.730 L 3.61 5 18.500 291.066722 223.15-224.5 1.35 4.39 4.348 L 4.21 5 11.550 280.066771 286.75-287.75 1.00 3.25 3.510 3.40 5 0.785 12.266202 238.15-239.85 1.70 5.52 5.676 5.50 6 1.070 11.266471 293.62-294.65 1.03 3.35 3.684 3.57 6 9.620 120.066762 274.9-276.5 1.60 5.20 6.532 6.33 6 0.481 6.066763 276.5-278.0 1.50 4.87 5.292 5.12 6 1.270 15.866723 224.5-225.75 1.25 4.06 4.676 4.53 7 1.275 4.066725 225.75-227.0 1.25 4.06 4.758 4.61 7 0.574 3.266803 329.0-330.5 1.50 4.87 4.558 4.41 7 0.462 1.666818 346.5-347.6 1.10 3.57 3.320 3.22 7 17.450 3.466200 235.95-237.05 1.10 3.57 4.342 4.20 9 1.630 9.066201 237.05-238.15 1.10 3.57 2.622 2.54 9 1.345 5.666438 247.55-249.16 1.61 5.23 5.858 5.67 9 7.620 23.866480 303.85-304.4 0.55 1.78 1.408 1.36 9 0.897 4.366203 239.85-241.5 1.65 5.36 5.374 5.20 12 1.125 27.466476 298.3-299.3 1.00 3.25 3.498 3.39 12 0.496 10.466478 300.7-302.07 1.37 4.45 4.962 4.80 12 0.493 9.166485 309.5-311.2 1.70 5.52 2.156 2.09 12 0.649 11.6
24 30.78 99.98 103.252 99.99 Avg. 4.185 45.6Wt’d. 3.819 41.8
Mr. Chris Crupi / Paramount Gold and Silver Corp.MLI Job No. 3463 - April 4, 2011
11
McCLELLAND LABORATORIES, INC.
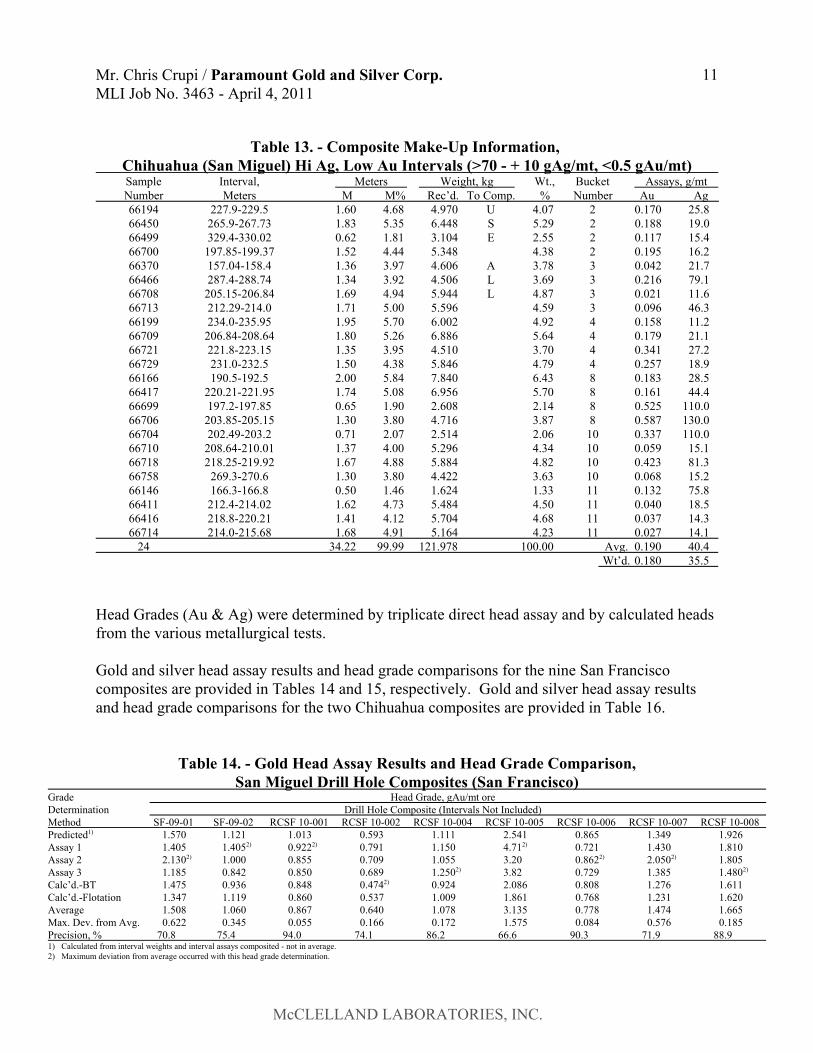
Table 13. - Composite Make-Up Information, Chihuahua (San Miguel) Hi Ag, Low Au Intervals (>70 - + 10 gAg/mt, <0.5 gAu/mt)Sample Interval, Meters Weight, kg Wt., Bucket Assays, g/mtNumber Meters M M% Rec’d. To Comp. % Number Au Ag66194 227.9-229.5 1.60 4.68 4.970 U 4.07 2 0.170 25.866450 265.9-267.73 1.83 5.35 6.448 S 5.29 2 0.188 19.066499 329.4-330.02 0.62 1.81 3.104 E 2.55 2 0.117 15.466700 197.85-199.37 1.52 4.44 5.348 4.38 2 0.195 16.266370 157.04-158.4 1.36 3.97 4.606 A 3.78 3 0.042 21.766466 287.4-288.74 1.34 3.92 4.506 L 3.69 3 0.216 79.166708 205.15-206.84 1.69 4.94 5.944 L 4.87 3 0.021 11.666713 212.29-214.0 1.71 5.00 5.596 4.59 3 0.096 46.366199 234.0-235.95 1.95 5.70 6.002 4.92 4 0.158 11.266709 206.84-208.64 1.80 5.26 6.886 5.64 4 0.179 21.166721 221.8-223.15 1.35 3.95 4.510 3.70 4 0.341 27.266729 231.0-232.5 1.50 4.38 5.846 4.79 4 0.257 18.966166 190.5-192.5 2.00 5.84 7.840 6.43 8 0.183 28.566417 220.21-221.95 1.74 5.08 6.956 5.70 8 0.161 44.466699 197.2-197.85 0.65 1.90 2.608 2.14 8 0.525 110.066706 203.85-205.15 1.30 3.80 4.716 3.87 8 0.587 130.066704 202.49-203.2 0.71 2.07 2.514 2.06 10 0.337 110.066710 208.64-210.01 1.37 4.00 5.296 4.34 10 0.059 15.166718 218.25-219.92 1.67 4.88 5.884 4.82 10 0.423 81.366758 269.3-270.6 1.30 3.80 4.422 3.63 10 0.068 15.266146 166.3-166.8 0.50 1.46 1.624 1.33 11 0.132 75.866411 212.4-214.02 1.62 4.73 5.484 4.50 11 0.040 18.566416 218.8-220.21 1.41 4.12 5.704 4.68 11 0.037 14.366714 214.0-215.68 1.68 4.91 5.164 4.23 11 0.027 14.1
24 34.22 99.99 121.978 100.00 Avg. 0.190 40.4Wt’d. 0.180 35.5
Head Grades (Au & Ag) were determined by triplicate direct head assay and by calculated headsfrom the various metallurgical tests.
Gold and silver head assay results and head grade comparisons for the nine San Franciscocomposites are provided in Tables 14 and 15, respectively. Gold and silver head assay resultsand head grade comparisons for the two Chihuahua composites are provided in Table 16.
Table 14. - Gold Head Assay Results and Head Grade Comparison,San Miguel Drill Hole Composites (San Francisco)
Grade Head Grade, gAu/mt oreDetermination Drill Hole Composite (Intervals Not Included)Method SF-09-01 SF-09-02 RCSF 10-001 RCSF 10-002 RCSF 10-004 RCSF 10-005 RCSF 10-006 RCSF 10-007 RCSF 10-008Predicted1) 1.570 1.121 1.013 0.593 1.111 2.541 0.865 1.349 1.926Assay 1 1.405 1.4052) 0.9222) 0.791 1.150 4.712) 0.721 1.430 1.810Assay 2 2.1302) 1.000 0.855 0.709 1.055 3.20 0.8622) 2.0502) 1.805Assay 3 1.185 0.842 0.850 0.689 1.2502) 3.82 0.729 1.385 1.4802)
Calc’d.-BT 1.475 0.936 0.848 0.4742) 0.924 2.086 0.808 1.276 1.611Calc’d.-Flotation 1.347 1.119 0.860 0.537 1.009 1.861 0.768 1.231 1.620Average 1.508 1.060 0.867 0.640 1.078 3.135 0.778 1.474 1.665Max. Dev. from Avg. 0.622 0.345 0.055 0.166 0.172 1.575 0.084 0.576 0.185Precision, % 70.8 75.4 94.0 74.1 86.2 66.6 90.3 71.9 88.91) Calculated from interval weights and interval assays composited - not in average.2) Maximum deviation from average occurred with this head grade determination.
Mr. Chris Crupi / Paramount Gold and Silver Corp.MLI Job No. 3463 - April 4, 2011
12
McCLELLAND LABORATORIES, INC.
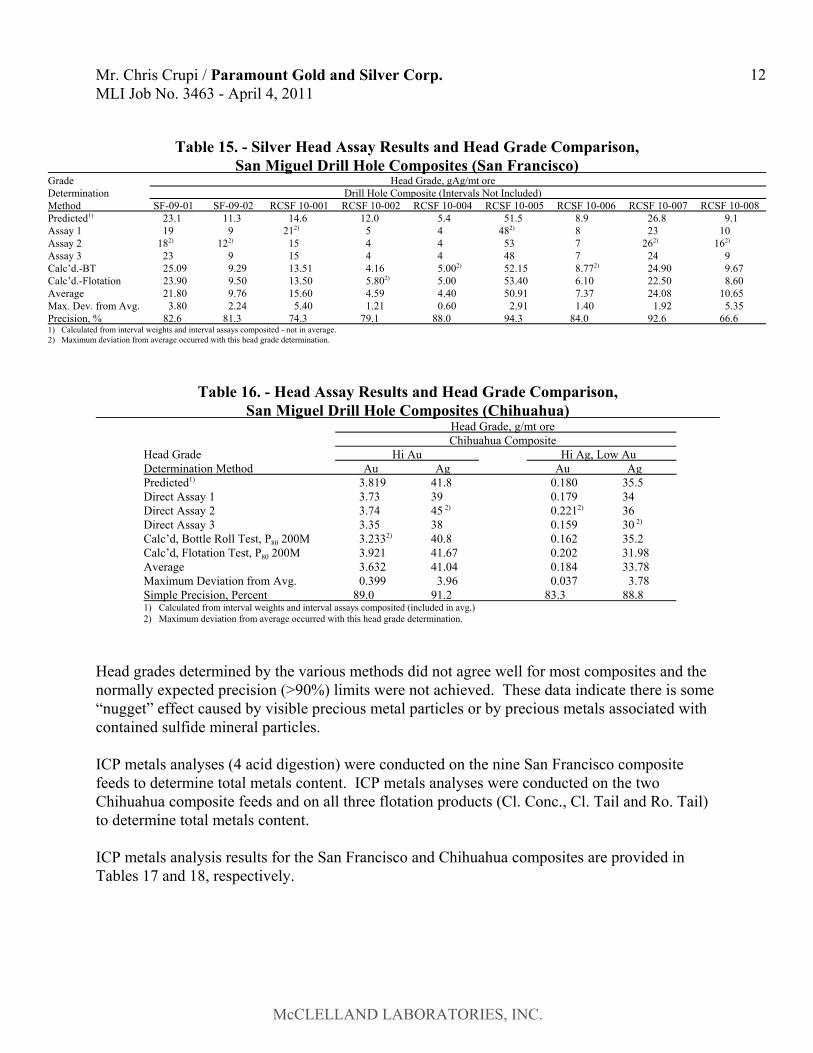
Table 15. - Silver Head Assay Results and Head Grade Comparison,San Miguel Drill Hole Composites (San Francisco)
Grade Head Grade, gAg/mt oreDetermination Drill Hole Composite (Intervals Not Included)Method SF-09-01 SF-09-02 RCSF 10-001 RCSF 10-002 RCSF 10-004 RCSF 10-005 RCSF 10-006 RCSF 10-007 RCSF 10-008Predicted1) 23.1 11.3 14.6 12.0 5.4 51.5 8.9 26.8 9.1Assay 1 19 9 212) 5 4 482) 8 23 10Assay 2 182) 122) 15 4 4 53 7 262) 162)
Assay 3 23 9 15 4 4 48 7 24 9Calc’d.-BT 25.09 9.29 13.51 4.16 5.002) 52.15 8.772) 24.90 9.67Calc’d.-Flotation 23.90 9.50 13.50 5.802) 5.00 53.40 6.10 22.50 8.60Average 21.80 9.76 15.60 4.59 4.40 50.91 7.37 24.08 10.65Max. Dev. from Avg. 3.80 2.24 5.40 1.21 0.60 2.91 1.40 1.92 5.35Precision, % 82.6 81.3 74.3 79.1 88.0 94.3 84.0 92.6 66.61) Calculated from interval weights and interval assays composited - not in average.2) Maximum deviation from average occurred with this head grade determination.
Table 16. - Head Assay Results and Head Grade Comparison,San Miguel Drill Hole Composites (Chihuahua)
Head Grade, g/mt oreChihuahua Composite
Head Grade Hi Au Hi Ag, Low AuDetermination Method Au Ag Au AgPredicted1) 3.819 41.8 0.180 35.5Direct Assay 1 3.73 39 0.179 34Direct Assay 2 3.74 45.2) 0.2212) 36Direct Assay 3 3.35 38 0.159 30.2)
Calc’d, Bottle Roll Test, P80 200M 3.2332) 40.8 0.162 35.2Calc’d, Flotation Test, P80 200M 3.921 41.67 0.202 31.98Average 3.632 41.04 0.184 33.78Maximum Deviation from Avg. 0.399 3.96 0.037 3.78Simple Precision, Percent 89.0 91.2 83.3 88.81) Calculated from interval weights and interval assays composited (included in avg.)2) Maximum deviation from average occurred with this head grade determination.
Head grades determined by the various methods did not agree well for most composites and thenormally expected precision (>90%) limits were not achieved. These data indicate there is some“nugget” effect caused by visible precious metal particles or by precious metals associated withcontained sulfide mineral particles.
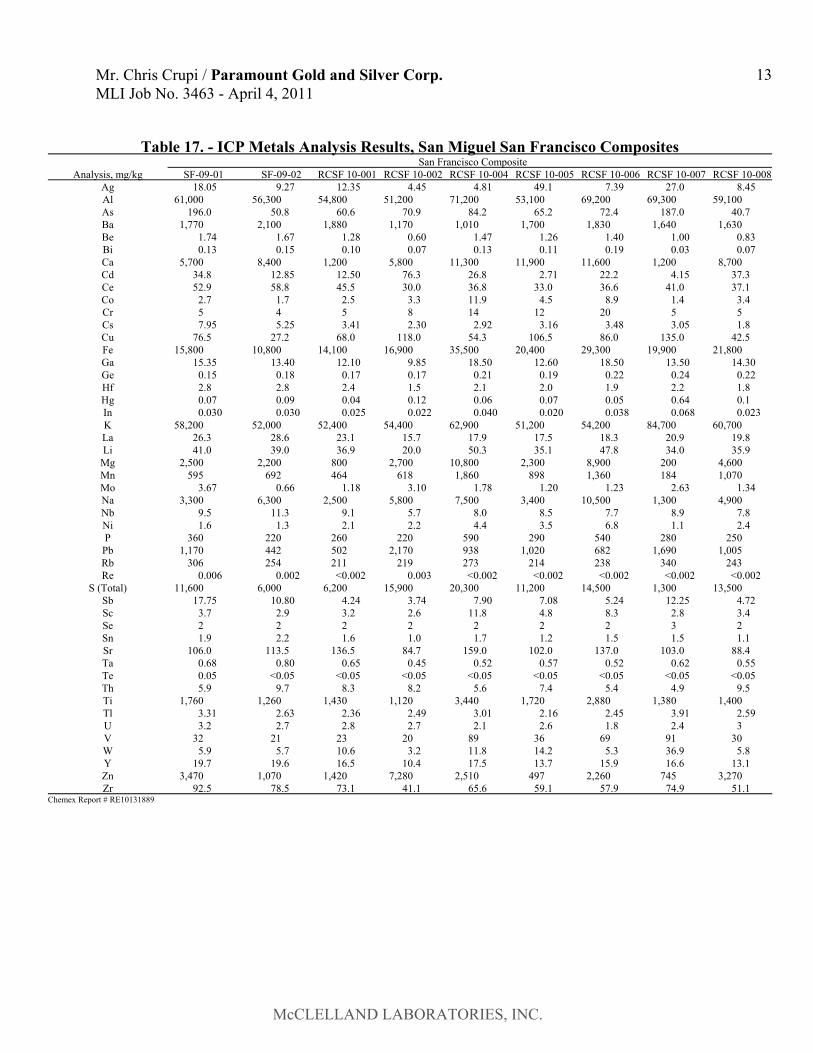
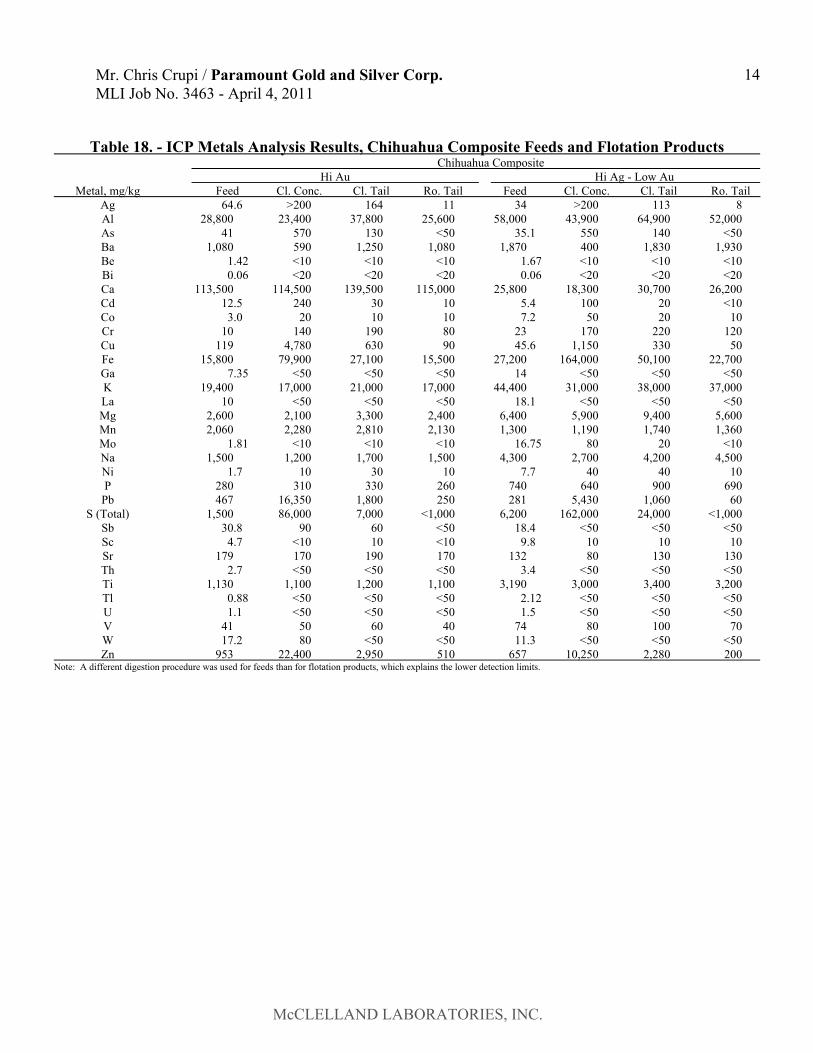
ICP metals analyses (4 acid digestion) were conducted on the nine San Francisco compositefeeds to determine total metals content. ICP metals analyses were conducted on the twoChihuahua composite feeds and on all three flotation products (Cl. Conc., Cl. Tail and Ro. Tail)to determine total metals content.
ICP metals analysis results for the San Francisco and Chihuahua composites are provided inTables 17 and 18, respectively.
Mr. Chris Crupi / Paramount Gold and Silver Corp.MLI Job No. 3463 - April 4, 2011
13
McCLELLAND LABORATORIES, INC.
Table 17. - ICP Metals Analysis Results, San Miguel San Francisco CompositesSan Francisco Composite
Analysis, mg/kg SF-09-01 SF-09-02 RCSF 10-001 RCSF 10-002 RCSF 10-004 RCSF 10-005 RCSF 10-006 RCSF 10-007 RCSF 10-008Ag 18.05 9.27 12.35 4.45 4.81 49.1 7.39 27.0 8.45Al 61,000 56,300 54,800 51,200 71,200 53,100 69,200 69,300 59,100As 196.0 50.8 60.6 70.9 84.2 65.2 72.4 187.0 40.7Ba 1,770 2,100 1,880 1,170 1,010 1,700 1,830 1,640 1,630Be 1.74 1.67 1.28 0.60 1.47 1.26 1.40 1.00 0.83Bi 0.13 0.15 0.10 0.07 0.13 0.11 0.19 0.03 0.07Ca 5,700 8,400 1,200 5,800 11,300 11,900 11,600 1,200 8,700Cd 34.8 12.85 12.50 76.3 26.8 2.71 22.2 4.15 37.3Ce 52.9 58.8 45.5 30.0 36.8 33.0 36.6 41.0 37.1Co 2.7 1.7 2.5 3.3 11.9 4.5 8.9 1.4 3.4Cr 5 4 5 8 14 12 20 5 5Cs 7.95 5.25 3.41 2.30 2.92 3.16 3.48 3.05 1.8Cu 76.5 27.2 68.0 118.0 54.3 106.5 86.0 135.0 42.5Fe 15,800 10,800 14,100 16,900 35,500 20,400 29,300 19,900 21,800Ga 15.35 13.40 12.10 9.85 18.50 12.60 18.50 13.50 14.30Ge 0.15 0.18 0.17 0.17 0.21 0.19 0.22 0.24 0.22Hf 2.8 2.8 2.4 1.5 2.1 2.0 1.9 2.2 1.8Hg 0.07 0.09 0.04 0.12 0.06 0.07 0.05 0.64 0.1In 0.030 0.030 0.025 0.022 0.040 0.020 0.038 0.068 0.023K 58,200 52,000 52,400 54,400 62,900 51,200 54,200 84,700 60,700La 26.3 28.6 23.1 15.7 17.9 17.5 18.3 20.9 19.8Li 41.0 39.0 36.9 20.0 50.3 35.1 47.8 34.0 35.9Mg 2,500 2,200 800 2,700 10,800 2,300 8,900 200 4,600Mn 595 692 464 618 1,860 898 1,360 184 1,070Mo 3.67 0.66 1.18 3.10 1.78 1.20 1.23 2.63 1.34Na 3,300 6,300 2,500 5,800 7,500 3,400 10,500 1,300 4,900Nb 9.5 11.3 9.1 5.7 8.0 8.5 7.7 8.9 7.8Ni 1.6 1.3 2.1 2.2 4.4 3.5 6.8 1.1 2.4P 360 220 260 220 590 290 540 280 250Pb 1,170 442 502 2,170 938 1,020 682 1,690 1,005Rb 306 254 211 219 273 214 238 340 243Re 0.006 0.002 <0.002 0.003 <0.002 <0.002 <0.002 <0.002 <0.002
S (Total) 11,600 6,000 6,200 15,900 20,300 11,200 14,500 1,300 13,500Sb 17.75 10.80 4.24 3.74 7.90 7.08 5.24 12.25 4.72Sc 3.7 2.9 3.2 2.6 11.8 4.8 8.3 2.8 3.4Se 2 2 2 2 2 2 2 3 2Sn 1.9 2.2 1.6 1.0 1.7 1.2 1.5 1.5 1.1Sr 106.0 113.5 136.5 84.7 159.0 102.0 137.0 103.0 88.4Ta 0.68 0.80 0.65 0.45 0.52 0.57 0.52 0.62 0.55Te 0.05 <0.05 <0.05 <0.05 <0.05 <0.05 <0.05 <0.05 <0.05Th 5.9 9.7 8.3 8.2 5.6 7.4 5.4 4.9 9.5Ti 1,760 1,260 1,430 1,120 3,440 1,720 2,880 1,380 1,400Tl 3.31 2.63 2.36 2.49 3.01 2.16 2.45 3.91 2.59U 3.2 2.7 2.8 2.7 2.1 2.6 1.8 2.4 3V 32 21 23 20 89 36 69 91 30W 5.9 5.7 10.6 3.2 11.8 14.2 5.3 36.9 5.8Y 19.7 19.6 16.5 10.4 17.5 13.7 15.9 16.6 13.1Zn 3,470 1,070 1,420 7,280 2,510 497 2,260 745 3,270Zr 92.5 78.5 73.1 41.1 65.6 59.1 57.9 74.9 51.1
Chemex Report # RE10131889
Mr. Chris Crupi / Paramount Gold and Silver Corp.MLI Job No. 3463 - April 4, 2011
14
McCLELLAND LABORATORIES, INC.
Table 18. - ICP Metals Analysis Results, Chihuahua Composite Feeds and Flotation ProductsChihuahua Composite
Hi Au Hi Ag - Low AuMetal, mg/kg Feed Cl. Conc. Cl. Tail Ro. Tail Feed Cl. Conc. Cl. Tail Ro. Tail
Ag 64.6 >200 164 11 34 >200 113 8Al 28,800 23,400 37,800 25,600 58,000 43,900 64,900 52,000As 41 570 130 <50 35.1 550 140 <50Ba 1,080 590 1,250 1,080 1,870 400 1,830 1,930Be 1.42 <10 <10 <10 1.67 <10 <10 <10Bi 0.06 <20 <20 <20 0.06 <20 <20 <20Ca 113,500 114,500 139,500 115,000 25,800 18,300 30,700 26,200Cd 12.5 240 30 10 5.4 100 20 <10Co 3.0 20 10 10 7.2 50 20 10Cr 10 140 190 80 23 170 220 120Cu 119 4,780 630 90 45.6 1,150 330 50Fe 15,800 79,900 27,100 15,500 27,200 164,000 50,100 22,700Ga 7.35 <50 <50 <50 14 <50 <50 <50K 19,400 17,000 21,000 17,000 44,400 31,000 38,000 37,000La 10 <50 <50 <50 18.1 <50 <50 <50Mg 2,600 2,100 3,300 2,400 6,400 5,900 9,400 5,600Mn 2,060 2,280 2,810 2,130 1,300 1,190 1,740 1,360Mo 1.81 <10 <10 <10 16.75 80 20 <10Na 1,500 1,200 1,700 1,500 4,300 2,700 4,200 4,500Ni 1.7 10 30 10 7.7 40 40 10P 280 310 330 260 740 640 900 690
Pb 467 16,350 1,800 250 281 5,430 1,060 60S (Total) 1,500 86,000 7,000 <1,000 6,200 162,000 24,000 <1,000
Sb 30.8 90 60 <50 18.4 <50 <50 <50Sc 4.7 <10 10 <10 9.8 10 10 10Sr 179 170 190 170 132 80 130 130Th 2.7 <50 <50 <50 3.4 <50 <50 <50Ti 1,130 1,100 1,200 1,100 3,190 3,000 3,400 3,200Tl 0.88 <50 <50 <50 2.12 <50 <50 <50U 1.1 <50 <50 <50 1.5 <50 <50 <50V 41 50 60 40 74 80 100 70W 17.2 80 <50 <50 11.3 <50 <50 <50Zn 953 22,400 2,950 510 657 10,250 2,280 200
Note: A different digestion procedure was used for feeds than for flotation products, which explains the lower detection limits.
Mr. Chris Crupi / Paramount Gold and Silver Corp.MLI Job No. 3463 - April 4, 2011
15
McCLELLAND LABORATORIES, INC.
DIRECT AGITATED CYANIDATION TEST PROCEDURES AND RESULTS
Direct agitated cyanidation tests were conducted on all 11 San Miguel drill hole composites at aP8075µm grind size to determine precious metals recovery, recovery rate, reagent requirementsand amenability to milling/cyanidation processing. “Whole ore” cyanidation tests wereconducted using the following summarized procedure.• Stage grind 2 kg composite charges in a stainless steel laboratory ball mill to a P8075µm grind
size.• Settle in grind water to achieve a 40 weight percent solids pulp density.• Measure natural pulp pH at 40% solids pulp density.• Slowly add high calcium hydrated lime (HCHL) to adjust pulp pH to between pH 10.8 and
11.2.• Add NaCN, equivalent to 1.0 gNaCN/L of solution to the alkaline pulps.• Leach by rolling (agitation) in bottles on the laboratory rolls for 48 hours.• Obtain pulp samples at 2, 6, 12, 24 and 48 hours. Filter pulp samples at each sampling
interval, return solids (filter cake) immediately to leaching, and analyze preg solution(filtrate) for Au, Ag, pH, NaCN and dissolved oxygen (DO). Pregs from the two Chihuahuacomposites were analyzed also for Cu.
• Add make-up water, equivalent to that withdrawn (100 mL), to the pulps and resume rolling.• Maintain NaCN concentration and pH at initial levels during leaching.• After 48 hours, filter leached pulps to separate liquids and solids and measure final preg
volumes.• Wash (1-repulp, 5-displacements) dry, weigh and assay leached/washed residues in triplicate
for Au and Ag. Leached residues were blended and split three times to obtain three separatesamples for triplicate tail assay.
Overall metallurgical results from “Whole Ore” cyanidation tests are provided in odd numberedTables 19, 21, 23 and 25. Gold and silver leach rate profiles are shown graphically in Figures 1through 4. Triplicate tail assay results are provided in even numbered Tables 20, 22, 24 and 26.
Mr. Chris Crupi / Paramount Gold and Silver Corp.MLI Job No. 3463 - April 4, 2011
16
McCLELLAND LABORATORIES, INC.
0102030405060708090
100
0 10 20 30 40 50 60
Leach Time, hours
Cum
ulat
ive
Rec
over
y, %
of t
otal ..
...
...
SF-09-01 Au SF-09-02 Au RCSF 10-001 AuSF-09-01 Ag SF-09-02 Ag RCSF 10-001 Ag
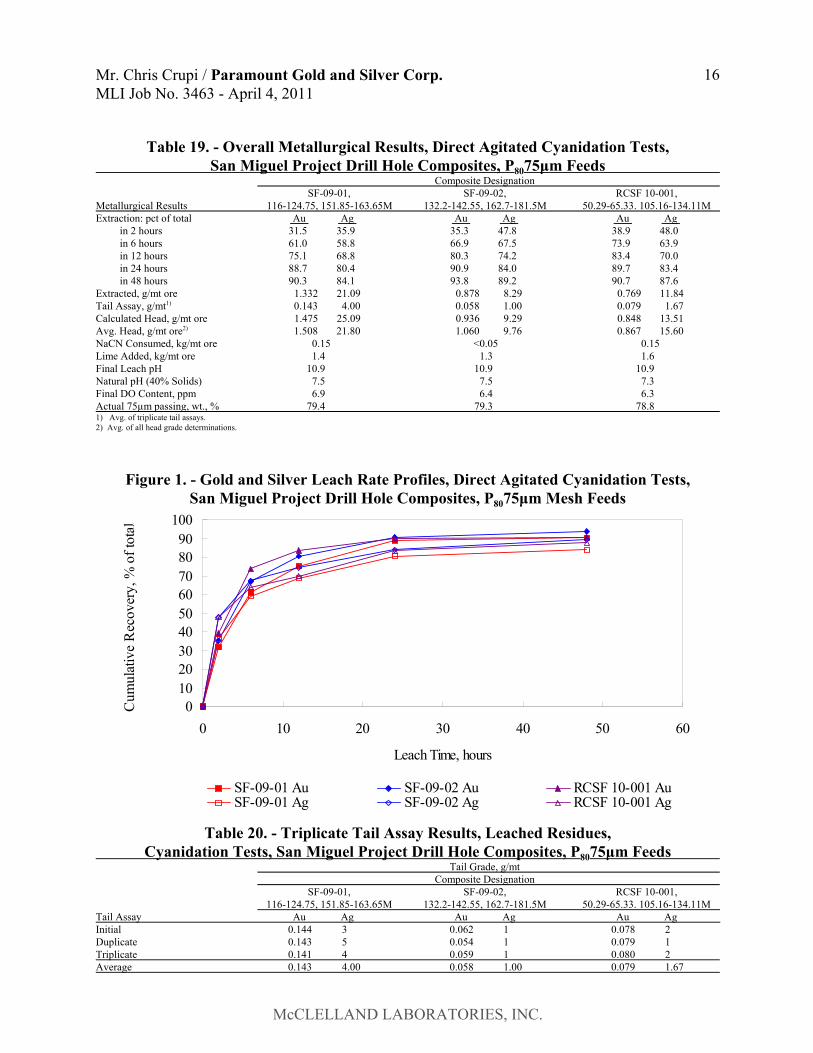
Table 19. - Overall Metallurgical Results, Direct Agitated Cyanidation Tests,San Miguel Project Drill Hole Composites, P8075µm Feeds
Composite DesignationSF-09-01, SF-09-02, RCSF 10-001,
Metallurgical Results 116-124.75, 151.85-163.65M 132.2-142.55, 162.7-181.5M 50.29-65.33. 105.16-134.11MExtraction: pct of total Au Ag Au Ag Au Ag
in 2 hours 31.5 35.9 35.3 47.8 38.9 48.0in 6 hours 61.0 58.8 66.9 67.5 73.9 63.9in 12 hours 75.1 68.8 80.3 74.2 83.4 70.0in 24 hours 88.7 80.4 90.9 84.0 89.7 83.4in 48 hours 90.3 84.1 93.8 89.2 90.7 87.6
Extracted, g/mt ore 1.332 21.09 0.878 8.29 0.769 11.84Tail Assay, g/mt1) 0.143 4.00 0.058 1.00 0.079 1.67Calculated Head, g/mt ore 1.475 25.09 0.936 9.29 0.848 13.51Avg. Head, g/mt ore2) 1.508 21.80 1.060 9.76 0.867 15.60NaCN Consumed, kg/mt ore 0.15 <0.05 0.15Lime Added, kg/mt ore 1.4 1.3 1.6Final Leach pH 10.9 10.9 10.9Natural pH (40% Solids) 7.5 7.5 7.3Final DO Content, ppm 6.9 6.4 6.3Actual 75µm passing, wt., % 79.4 79.3 78.81) Avg. of triplicate tail assays.2) Avg. of all head grade determinations.
Figure 1. - Gold and Silver Leach Rate Profiles, Direct Agitated Cyanidation Tests,San Miguel Project Drill Hole Composites, P8075µm Mesh Feeds
Table 20. - Triplicate Tail Assay Results, Leached Residues,Cyanidation Tests, San Miguel Project Drill Hole Composites, P8075µm Feeds
Tail Grade, g/mtComposite Designation
SF-09-01, SF-09-02, RCSF 10-001,116-124.75, 151.85-163.65M 132.2-142.55, 162.7-181.5M 50.29-65.33. 105.16-134.11M
Tail Assay Au Ag Au Ag Au Ag Initial 0.144 3 0.062 1 0.078 2Duplicate 0.143 5 0.054 1 0.079 1Triplicate 0.141 4 0.059 1 0.080 2Average 0.143 4.00 0.058 1.00 0.079 1.67
Mr. Chris Crupi / Paramount Gold and Silver Corp.MLI Job No. 3463 - April 4, 2011
17
McCLELLAND LABORATORIES, INC.
0102030405060708090
100
0 10 20 30 40 50 60
Leach Time, hours
Cum
ulat
ive
Rec
over
y, %
of t
otal ..
...
...
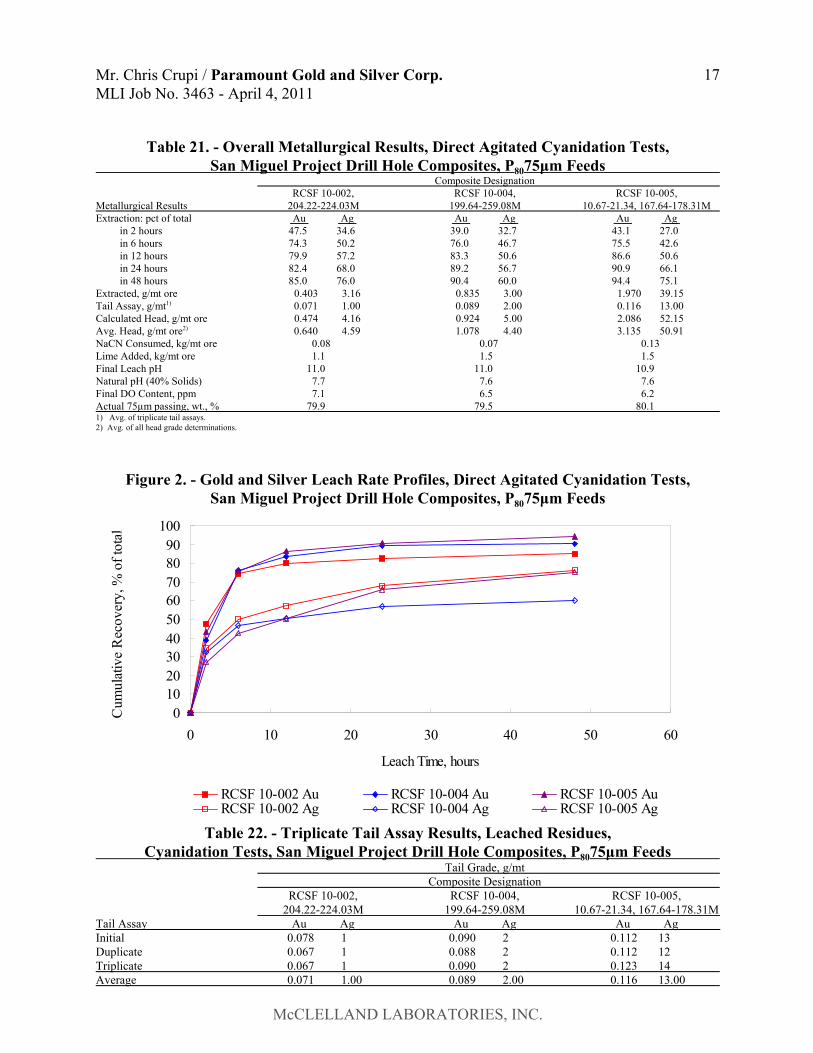
RCSF 10-002 Au RCSF 10-004 Au RCSF 10-005 Au RCSF 10-002 Ag RCSF 10-004 Ag RCSF 10-005 Ag
Table 21. - Overall Metallurgical Results, Direct Agitated Cyanidation Tests,San Miguel Project Drill Hole Composites, P8075µm Feeds
Composite DesignationRCSF 10-002, RCSF 10-004, RCSF 10-005,
Metallurgical Results 204.22-224.03M 199.64-259.08M 10.67-21.34, 167.64-178.31MExtraction: pct of total Au Ag Au Ag Au Ag
in 2 hours 47.5 34.6 39.0 32.7 43.1 27.0in 6 hours 74.3 50.2 76.0 46.7 75.5 42.6in 12 hours 79.9 57.2 83.3 50.6 86.6 50.6in 24 hours 82.4 68.0 89.2 56.7 90.9 66.1in 48 hours 85.0 76.0 90.4 60.0 94.4 75.1
Extracted, g/mt ore 0.403 3.16 0.835 3.00 1.970 39.15Tail Assay, g/mt1) 0.071 1.00 0.089 2.00 0.116 13.00Calculated Head, g/mt ore 0.474 4.16 0.924 5.00 2.086 52.15Avg. Head, g/mt ore2) 0.640 4.59 1.078 4.40 3.135 50.91NaCN Consumed, kg/mt ore 0.08 0.07 0.13Lime Added, kg/mt ore 1.1 1.5 1.5Final Leach pH 11.0 11.0 10.9Natural pH (40% Solids) 7.7 7.6 7.6Final DO Content, ppm 7.1 6.5 6.2Actual 75µm passing, wt., % 79.9 79.5 80.11) Avg. of triplicate tail assays.2) Avg. of all head grade determinations.
Figure 2. - Gold and Silver Leach Rate Profiles, Direct Agitated Cyanidation Tests,San Miguel Project Drill Hole Composites, P8075µm Feeds
Table 22. - Triplicate Tail Assay Results, Leached Residues,Cyanidation Tests, San Miguel Project Drill Hole Composites, P8075µm Feeds
Tail Grade, g/mtComposite Designation
RCSF 10-002, RCSF 10-004, RCSF 10-005,204.22-224.03M 199.64-259.08M 10.67-21.34, 167.64-178.31M
Tail Assay Au Ag Au Ag Au Ag Initial 0.078 1 0.090 2 0.112 13Duplicate 0.067 1 0.088 2 0.112 12Triplicate 0.067 1 0.090 2 0.123 14Average 0.071 1.00 0.089 2.00 0.116 13.00
Mr. Chris Crupi / Paramount Gold and Silver Corp.MLI Job No. 3463 - April 4, 2011
18
McCLELLAND LABORATORIES, INC.
0102030405060708090
100
0 10 20 30 40 50 60
Leach Time, hours
Cum
ulat
ive
Rec
over
y, %
of t
otal ..
...
...
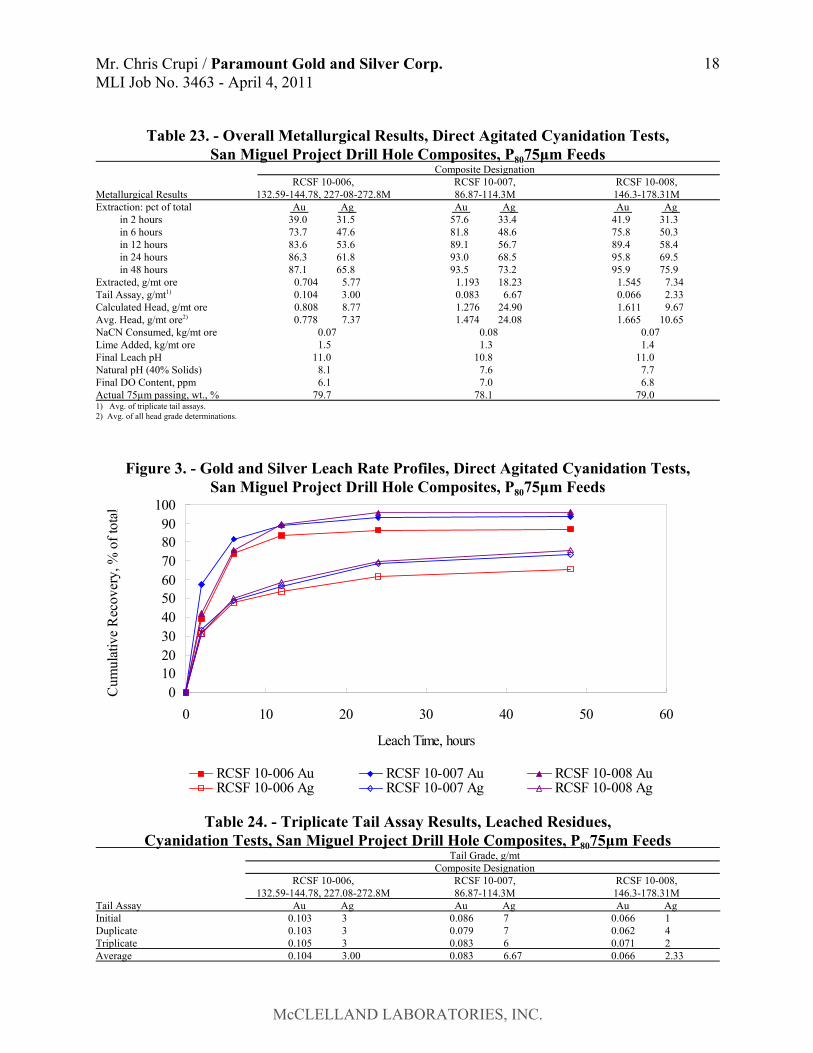
RCSF 10-006 Au RCSF 10-007 Au RCSF 10-008 Au RCSF 10-006 Ag RCSF 10-007 Ag RCSF 10-008 Ag
Table 23. - Overall Metallurgical Results, Direct Agitated Cyanidation Tests,San Miguel Project Drill Hole Composites, P8075µm Feeds
Composite DesignationRCSF 10-006, RCSF 10-007, RCSF 10-008,
Metallurgical Results 132.59-144.78, 227-08-272.8M 86.87-114.3M 146.3-178.31MExtraction: pct of total Au Ag Au Ag Au Ag
in 2 hours 39.0 31.5 57.6 33.4 41.9 31.3in 6 hours 73.7 47.6 81.8 48.6 75.8 50.3in 12 hours 83.6 53.6 89.1 56.7 89.4 58.4in 24 hours 86.3 61.8 93.0 68.5 95.8 69.5in 48 hours 87.1 65.8 93.5 73.2 95.9 75.9
Extracted, g/mt ore 0.704 5.77 1.193 18.23 1.545 7.34Tail Assay, g/mt1) 0.104 3.00 0.083 6.67 0.066 2.33Calculated Head, g/mt ore 0.808 8.77 1.276 24.90 1.611 9.67Avg. Head, g/mt ore2) 0.778 7.37 1.474 24.08 1.665 10.65NaCN Consumed, kg/mt ore 0.07 0.08 0.07Lime Added, kg/mt ore 1.5 1.3 1.4Final Leach pH 11.0 10.8 11.0Natural pH (40% Solids) 8.1 7.6 7.7Final DO Content, ppm 6.1 7.0 6.8Actual 75µm passing, wt., % 79.7 78.1 79.01) Avg. of triplicate tail assays.2) Avg. of all head grade determinations.
Figure 3. - Gold and Silver Leach Rate Profiles, Direct Agitated Cyanidation Tests,San Miguel Project Drill Hole Composites, P8075µm Feeds
Table 24. - Triplicate Tail Assay Results, Leached Residues,Cyanidation Tests, San Miguel Project Drill Hole Composites, P8075µm Feeds
Tail Grade, g/mtComposite Designation
RCSF 10-006, RCSF 10-007, RCSF 10-008,132.59-144.78, 227.08-272.8M 86.87-114.3M 146.3-178.31M
Tail Assay Au Ag Au Ag Au Ag Initial 0.103 3 0.086 7 0.066 1Duplicate 0.103 3 0.079 7 0.062 4Triplicate 0.105 3 0.083 6 0.071 2Average 0.104 3.00 0.083 6.67 0.066 2.33
Mr. Chris Crupi / Paramount Gold and Silver Corp.MLI Job No. 3463 - April 4, 2011
19
McCLELLAND LABORATORIES, INC.
0102030405060708090
100
0 10 20 30 40 50 60
Leach Time, hours
Cum
ulat
ive
Rec
over
y, %
of t
otal ..
...
...
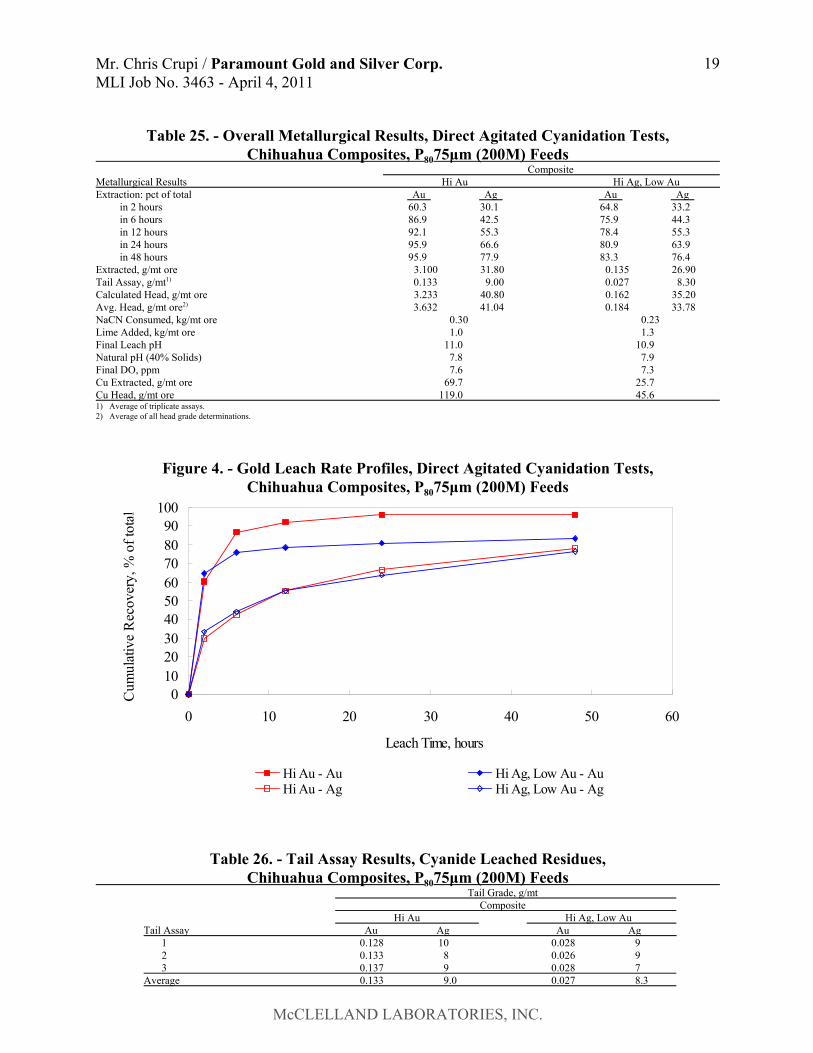
Hi Au - Au Hi Ag, Low Au - AuHi Au - Ag Hi Ag, Low Au - Ag
Table 25. - Overall Metallurgical Results, Direct Agitated Cyanidation Tests,Chihuahua Composites, P8075µm (200M) Feeds
CompositeMetallurgical Results Hi Au Hi Ag, Low AuExtraction: pct of total Au Ag Au Ag
in 2 hours 60.3 30.1 64.8 33.2in 6 hours 86.9 42.5 75.9 44.3in 12 hours 92.1 55.3 78.4 55.3in 24 hours 95.9 66.6 80.9 63.9in 48 hours 95.9 77.9 83.3 76.4
Extracted, g/mt ore 3.100 31.80 0.135 26.90Tail Assay, g/mt1) 0.133 9.00 0.027 8.30Calculated Head, g/mt ore 3.233 40.80 0.162 35.20Avg. Head, g/mt ore2) 3.632 41.04 0.184 33.78NaCN Consumed, kg/mt ore 0.30 0.23Lime Added, kg/mt ore 1.0 1.3Final Leach pH 11.0 10.9Natural pH (40% Solids) 7.8 7.9Final DO, ppm 7.6 7.3Cu Extracted, g/mt ore 69.7 25.7Cu Head, g/mt ore 119.0 45.61) Average of triplicate assays.2) Average of all head grade determinations.
Figure 4. - Gold Leach Rate Profiles, Direct Agitated Cyanidation Tests,Chihuahua Composites, P8075µm (200M) Feeds
Table 26. - Tail Assay Results, Cyanide Leached Residues,Chihuahua Composites, P8075µm (200M) Feeds
Tail Grade, g/mtComposite
Hi Au Hi Ag, Low AuTail Assay Au Ag Au Ag
1 0.128 10 0.028 92 0.133 8 0.026 93 0.137 9 0.028 7
Average 0.133 9.0 0.027 8.3
Mr. Chris Crupi / Paramount Gold and Silver Corp.MLI Job No. 3463 - April 4, 2011
20
McCLELLAND LABORATORIES, INC.
Overall metallurgical results show that all 11 San Miguel composites were readily amenable tomilling/cyanidation treatment at the P80 75µm grind size. Gold recoveries ranged from 83.3 to95.9 percent, and averaged 90.9 percent for the 11 composites with 48 hours of leaching. Silverrecoveries ranged from 60.0 to 89.2 percent, and averaged 76.5 percent in 48 hours. Preciousmetal recovery rates were fairly rapid through 6 hours, and extraction was substantially completein 24 hours. Additional values were extracted at a reasonable rate after 24 hours until leachingwas terminated at 48 hours. Recovery rate data indicate that precious metal recovery wouldincrease with a leaching cycle longer than 48 hours. The generally slow leach rate will dictate afairly long retention time for commercial cyanidation to maximize recovery.
NaCN consumptions were low and ranged from <0.05 to 0.30 kg/mt of ore. Lime requirements(HCHL added) were also low and ranged from 1.0 to 1.6 kg/mt ore. Controlling pH duringleaching was not difficult and 91.7% (avg. of all 11 tests) of the total lime required was addedduring initial pulp pH adjustment procedures. The remainder (~ 8%) was added during the leachcycle.
BULK SULFIDE FLOTATION TEST PROCEDURES AND RESULTS
Conventional bulk sulfide flotation tests were conducted on the 11 San Miguel drill holecomposites at a P8075µm grind size to determine precious metal recovery, concentrate grade andconcentration ratios. The flotation test procedure is summarized as follows.• Stage grind the 2 kg splits to P8075µm in size using a stainless steel laboratory ball mill.• Settle in grinding water to achieve 25 weight percent solids slurry density. Initiate float
immediately after staged grinding.• Condition slurry with CuSO4 - 5H2O (0.25 kg/mt) for 10 minutes.• After conditioning, float in 5 stages with incremental addition of potassium amylxanthate
(PAX) collector and Aero 208 (gold promoter), 0.005 kg/mt of each reagent at each stage fora total addition of 0.025 kg/mt of ore of each reagent. Add Aerofroth 65 as frother tomaintain adequate froth the 5 flotation stages (0.13 kg/mt ore total addition).
• Combine the 5 stages of float product into a Ro. Conc., and filter, dry, weigh and assay Ro.Tail in triplicate for Au and Ag.
• Clean the Ro. Conc. in a smaller flotation cell (only frother added) to produce a Cl. Conc.and Cl. Tail. Dry, weigh and assay Cl. Conc. and Cl. Tail in entirety to determine preciousmetal content.
Overall metallurgical results from flotation tests on the 9 San Francisco composites are providedin Table 27. Cyanide shake test results are included in Table 27. Back calculated data forrougher flotation is provided in Table 28. Ro. Tail triplicate tail assay results are provided inTable 29.
Mr. Chris Crupi / Paramount Gold and Silver Corp.MLI Job No. 3463 - April 4, 2011
21
McCLELLAND LABORATORIES, INC.
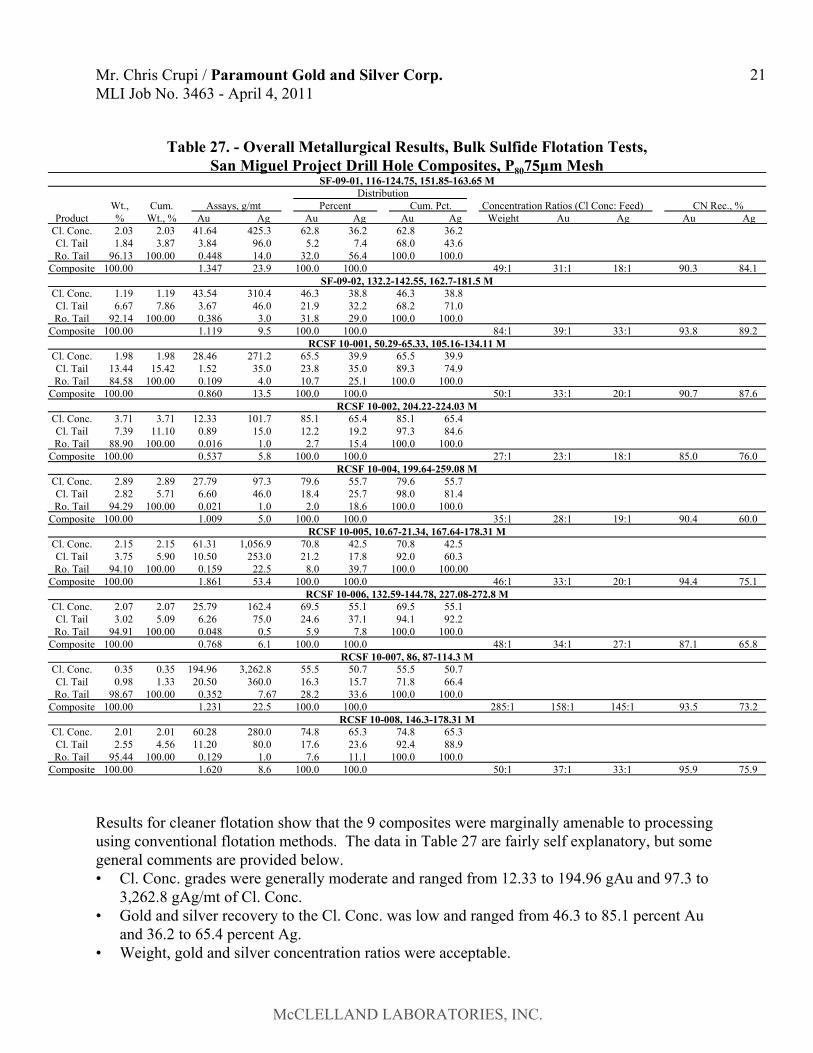
Table 27. - Overall Metallurgical Results, Bulk Sulfide Flotation Tests,San Miguel Project Drill Hole Composites, P8075µm Mesh
SF-09-01, 116-124.75, 151.85-163.65 MDistribution
Wt., Cum. Assays, g/mt Percent Cum. Pct. Concentration Ratios (Cl Conc: Feed) CN Rec., %Product % Wt., % Au Ag Au Ag Au Ag Weight Au Ag Au Ag
Cl. Conc. 2.03 2.03 41.64 425.3 62.8 36.2 62.8 36.2Cl. Tail 1.84 3.87 3.84 96.0 5.2 7.4 68.0 43.6Ro. Tail 96.13 100.00 0.448 14.0 32.0 56.4 100.0 100.0
Composite 100.00 1.347 23.9 100.0 100.0 49:1 31:1 18:1 90.3 84.1SF-09-02, 132.2-142.55, 162.7-181.5 M
Cl. Conc. 1.19 1.19 43.54 310.4 46.3 38.8 46.3 38.8Cl. Tail 6.67 7.86 3.67 46.0 21.9 32.2 68.2 71.0Ro. Tail 92.14 100.00 0.386 3.0 31.8 29.0 100.0 100.0
Composite 100.00 1.119 9.5 100.0 100.0 84:1 39:1 33:1 93.8 89.2RCSF 10-001, 50.29-65.33, 105.16-134.11 M
Cl. Conc. 1.98 1.98 28.46 271.2 65.5 39.9 65.5 39.9Cl. Tail 13.44 15.42 1.52 35.0 23.8 35.0 89.3 74.9Ro. Tail 84.58 100.00 0.109 4.0 10.7 25.1 100.0 100.0
Composite 100.00 0.860 13.5 100.0 100.0 50:1 33:1 20:1 90.7 87.6RCSF 10-002, 204.22-224.03 M
Cl. Conc. 3.71 3.71 12.33 101.7 85.1 65.4 85.1 65.4Cl. Tail 7.39 11.10 0.89 15.0 12.2 19.2 97.3 84.6Ro. Tail 88.90 100.00 0.016 1.0 2.7 15.4 100.0 100.0
Composite 100.00 0.537 5.8 100.0 100.0 27:1 23:1 18:1 85.0 76.0RCSF 10-004, 199.64-259.08 M
Cl. Conc. 2.89 2.89 27.79 97.3 79.6 55.7 79.6 55.7Cl. Tail 2.82 5.71 6.60 46.0 18.4 25.7 98.0 81.4Ro. Tail 94.29 100.00 0.021 1.0 2.0 18.6 100.0 100.0
Composite 100.00 1.009 5.0 100.0 100.0 35:1 28:1 19:1 90.4 60.0RCSF 10-005, 10.67-21.34, 167.64-178.31 M
Cl. Conc. 2.15 2.15 61.31 1,056.9 70.8 42.5 70.8 42.5Cl. Tail 3.75 5.90 10.50 253.0 21.2 17.8 92.0 60.3Ro. Tail 94.10 100.00 0.159 22.5 8.0 39.7 100.0 100.00
Composite 100.00 1.861 53.4 100.0 100.0 46:1 33:1 20:1 94.4 75.1RCSF 10-006, 132.59-144.78, 227.08-272.8 M
Cl. Conc. 2.07 2.07 25.79 162.4 69.5 55.1 69.5 55.1Cl. Tail 3.02 5.09 6.26 75.0 24.6 37.1 94.1 92.2Ro. Tail 94.91 100.00 0.048 0.5 5.9 7.8 100.0 100.0
Composite 100.00 0.768 6.1 100.0 100.0 48:1 34:1 27:1 87.1 65.8RCSF 10-007, 86, 87-114.3 M
Cl. Conc. 0.35 0.35 194.96 3,262.8 55.5 50.7 55.5 50.7Cl. Tail 0.98 1.33 20.50 360.0 16.3 15.7 71.8 66.4Ro. Tail 98.67 100.00 0.352 7.67 28.2 33.6 100.0 100.0
Composite 100.00 1.231 22.5 100.0 100.0 285:1 158:1 145:1 93.5 73.2RCSF 10-008, 146.3-178.31 M
Cl. Conc. 2.01 2.01 60.28 280.0 74.8 65.3 74.8 65.3Cl. Tail 2.55 4.56 11.20 80.0 17.6 23.6 92.4 88.9Ro. Tail 95.44 100.00 0.129 1.0 7.6 11.1 100.0 100.0
Composite 100.00 1.620 8.6 100.0 100.0 50:1 37:1 33:1 95.9 75.9
Results for cleaner flotation show that the 9 composites were marginally amenable to processingusing conventional flotation methods. The data in Table 27 are fairly self explanatory, but somegeneral comments are provided below.• Cl. Conc. grades were generally moderate and ranged from 12.33 to 194.96 gAu and 97.3 to
3,262.8 gAg/mt of Cl. Conc.• Gold and silver recovery to the Cl. Conc. was low and ranged from 46.3 to 85.1 percent Au
and 36.2 to 65.4 percent Ag.• Weight, gold and silver concentration ratios were acceptable.
Mr. Chris Crupi / Paramount Gold and Silver Corp.MLI Job No. 3463 - April 4, 2011
22
McCLELLAND LABORATORIES, INC.
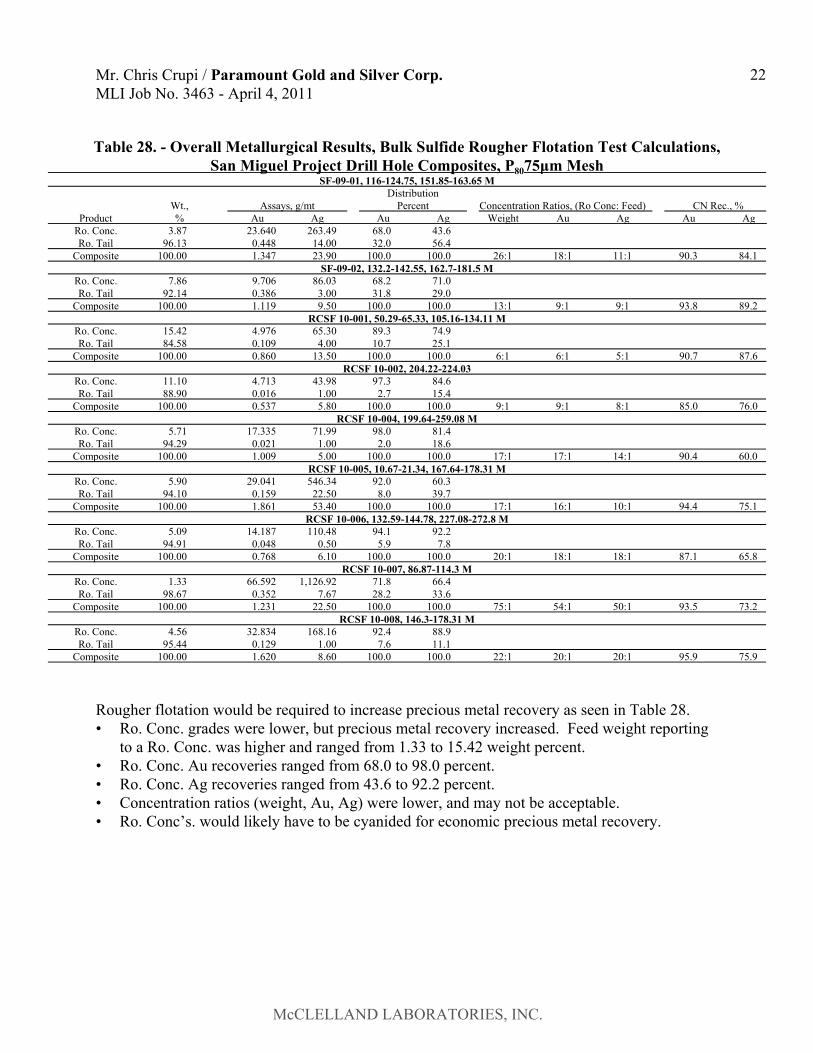
Table 28. - Overall Metallurgical Results, Bulk Sulfide Rougher Flotation Test Calculations,San Miguel Project Drill Hole Composites, P8075µm Mesh
SF-09-01, 116-124.75, 151.85-163.65 MDistribution
Wt., Assays, g/mt Percent Concentration Ratios, (Ro Conc: Feed) CN Rec., %Product % Au Ag Au Ag Weight Au Ag Au Ag
Ro. Conc. 3.87 23.640 263.49 68.0 43.6Ro. Tail 96.13 0.448 14.00 32.0 56.4
Composite 100.00 1.347 23.90 100.0 100.0 26:1 18:1 11:1 90.3 84.1SF-09-02, 132.2-142.55, 162.7-181.5 M
Ro. Conc. 7.86 9.706 86.03 68.2 71.0Ro. Tail 92.14 0.386 3.00 31.8 29.0
Composite 100.00 1.119 9.50 100.0 100.0 13:1 9:1 9:1 93.8 89.2RCSF 10-001, 50.29-65.33, 105.16-134.11 M
Ro. Conc. 15.42 4.976 65.30 89.3 74.9Ro. Tail 84.58 0.109 4.00 10.7 25.1
Composite 100.00 0.860 13.50 100.0 100.0 6:1 6:1 5:1 90.7 87.6RCSF 10-002, 204.22-224.03
Ro. Conc. 11.10 4.713 43.98 97.3 84.6Ro. Tail 88.90 0.016 1.00 2.7 15.4
Composite 100.00 0.537 5.80 100.0 100.0 9:1 9:1 8:1 85.0 76.0RCSF 10-004, 199.64-259.08 M
Ro. Conc. 5.71 17.335 71.99 98.0 81.4Ro. Tail 94.29 0.021 1.00 2.0 18.6
Composite 100.00 1.009 5.00 100.0 100.0 17:1 17:1 14:1 90.4 60.0RCSF 10-005, 10.67-21.34, 167.64-178.31 M
Ro. Conc. 5.90 29.041 546.34 92.0 60.3Ro. Tail 94.10 0.159 22.50 8.0 39.7
Composite 100.00 1.861 53.40 100.0 100.0 17:1 16:1 10:1 94.4 75.1RCSF 10-006, 132.59-144.78, 227.08-272.8 M
Ro. Conc. 5.09 14.187 110.48 94.1 92.2Ro. Tail 94.91 0.048 0.50 5.9 7.8
Composite 100.00 0.768 6.10 100.0 100.0 20:1 18:1 18:1 87.1 65.8RCSF 10-007, 86.87-114.3 M
Ro. Conc. 1.33 66.592 1,126.92 71.8 66.4Ro. Tail 98.67 0.352 7.67 28.2 33.6
Composite 100.00 1.231 22.50 100.0 100.0 75:1 54:1 50:1 93.5 73.2RCSF 10-008, 146.3-178.31 M
Ro. Conc. 4.56 32.834 168.16 92.4 88.9Ro. Tail 95.44 0.129 1.00 7.6 11.1
Composite 100.00 1.620 8.60 100.0 100.0 22:1 20:1 20:1 95.9 75.9
Rougher flotation would be required to increase precious metal recovery as seen in Table 28.• Ro. Conc. grades were lower, but precious metal recovery increased. Feed weight reporting
to a Ro. Conc. was higher and ranged from 1.33 to 15.42 weight percent.• Ro. Conc. Au recoveries ranged from 68.0 to 98.0 percent.• Ro. Conc. Ag recoveries ranged from 43.6 to 92.2 percent.• Concentration ratios (weight, Au, Ag) were lower, and may not be acceptable.• Ro. Conc’s. would likely have to be cyanided for economic precious metal recovery.
Mr. Chris Crupi / Paramount Gold and Silver Corp.MLI Job No. 3463 - April 4, 2011
23
McCLELLAND LABORATORIES, INC.
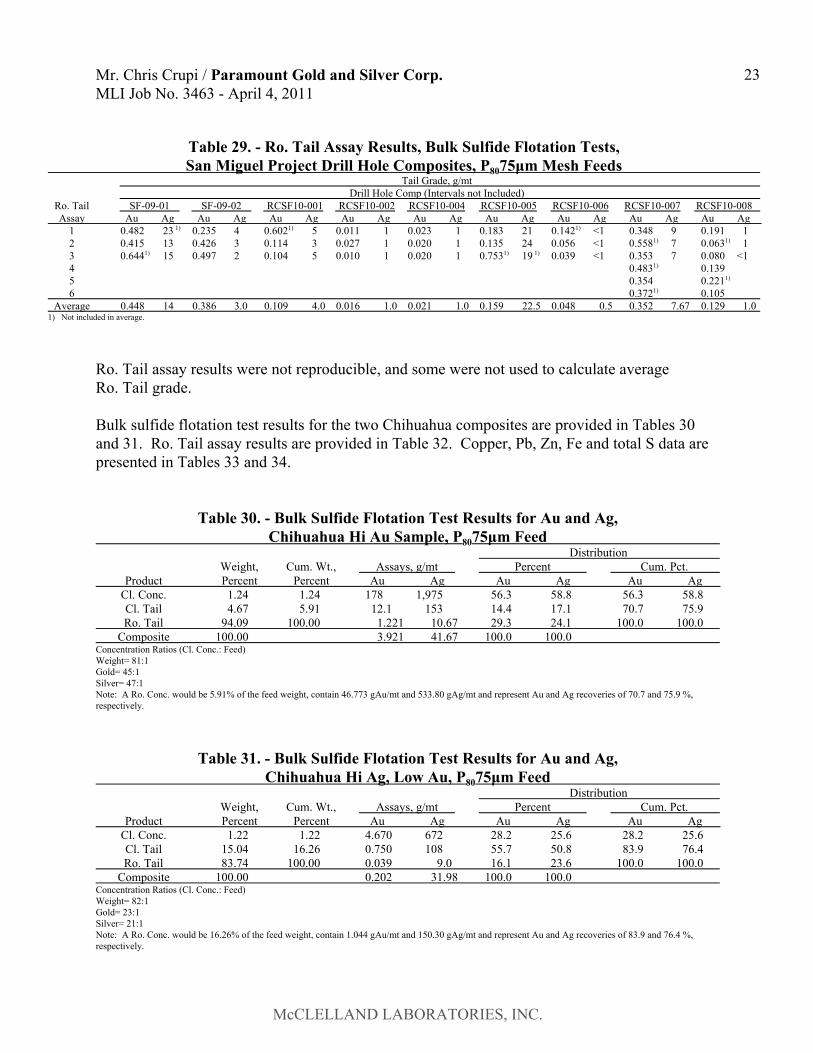
Table 29. - Ro. Tail Assay Results, Bulk Sulfide Flotation Tests,San Miguel Project Drill Hole Composites, P8075µm Mesh Feeds
Tail Grade, g/mtDrill Hole Comp (Intervals not Included)
Ro. Tail SF-09-01 SF-09-02 RCSF10-001 RCSF10-002 RCSF10-004 RCSF10-005 RCSF10-006 RCSF10-007 RCSF10-008Assay Au Ag Au Ag Au Ag Au Ag Au Ag Au Ag Au Ag Au Ag Au Ag
1 0.482 23.1) 0.235 4 0.6021) 5 0.011 1 0.023 1 0.183 21 0.1421) <1 0.348 9 0.191 12 0.415 13 0.426 3 0.114 3 0.027 1 0.020 1 0.135 24 0.056 <1 0.5581) 7 0.0631) 13 0.6441) 15 0.497 2 0.104 5 0.010 1 0.020 1 0.7531) 19.1) 0.039 <1 0.353 7 0.080 <14 0.4831) 0.1395 0.354 0.2211)
6 0.3721) 0.105Average 0.448 14 0.386 3.0 0.109 4.0 0.016 1.0 0.021 1.0 0.159 22.5 0.048 0.5 0.352 7.67 0.129 1.0
1) Not included in average.
Ro. Tail assay results were not reproducible, and some were not used to calculate average Ro. Tail grade.
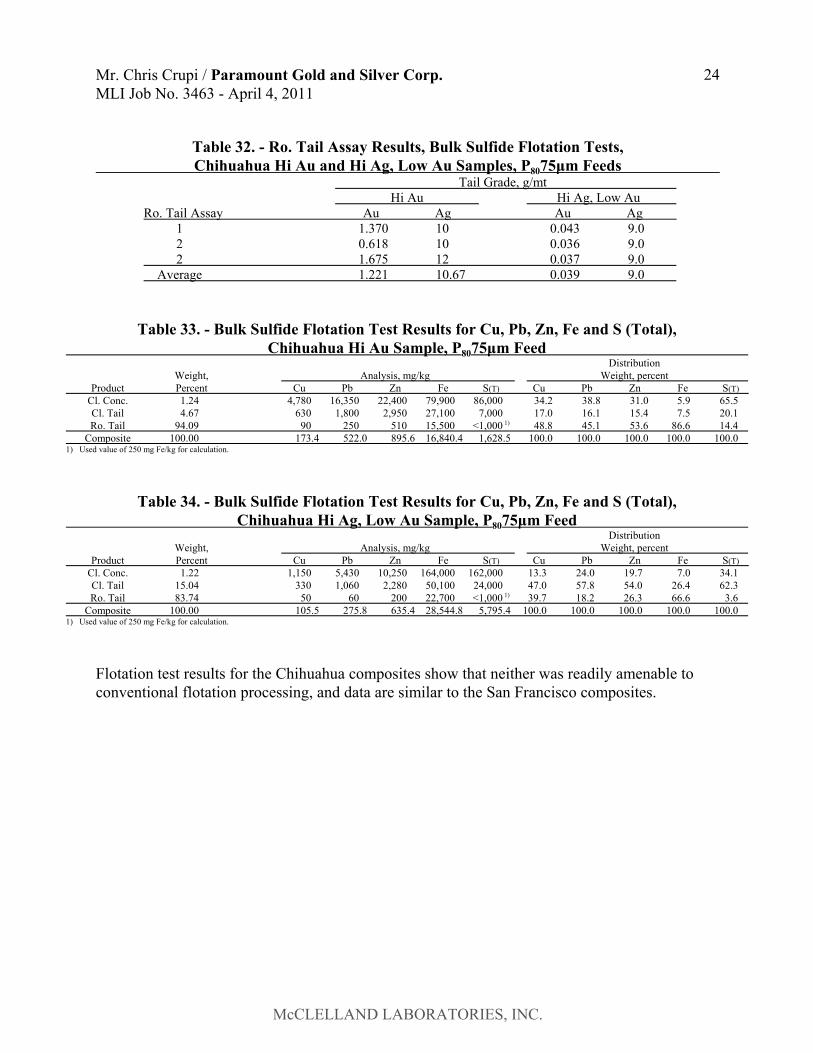
Bulk sulfide flotation test results for the two Chihuahua composites are provided in Tables 30and 31. Ro. Tail assay results are provided in Table 32. Copper, Pb, Zn, Fe and total S data arepresented in Tables 33 and 34.
Table 30. - Bulk Sulfide Flotation Test Results for Au and Ag,Chihuahua Hi Au Sample, P8075µm Feed
DistributionWeight, Cum. Wt., Assays, g/mt Percent Cum. Pct.
Product Percent Percent Au Ag Au Ag Au AgCl. Conc. 1.24 1.24 178 1,975 56.3 58.8 56.3 58.8Cl. Tail 4.67 5.91 12.1 153 14.4 17.1 70.7 75.9Ro. Tail 94.09 100.00 1.221 10.67 29.3 24.1 100.0 100.0
Composite 100.00 3.921 41.67 100.0 100.0Concentration Ratios (Cl. Conc.: Feed)Weight= 81:1Gold= 45:1Silver= 47:1Note: A Ro. Conc. would be 5.91% of the feed weight, contain 46.773 gAu/mt and 533.80 gAg/mt and represent Au and Ag recoveries of 70.7 and 75.9 %,respectively.
Table 31. - Bulk Sulfide Flotation Test Results for Au and Ag,Chihuahua Hi Ag, Low Au, P8075µm Feed
DistributionWeight, Cum. Wt., Assays, g/mt Percent Cum. Pct.
Product Percent Percent Au Ag Au Ag Au AgCl. Conc. 1.22 1.22 4.670 672 28.2 25.6 28.2 25.6Cl. Tail 15.04 16.26 0.750 108 55.7 50.8 83.9 76.4Ro. Tail 83.74 100.00 0.039 9.0 16.1 23.6 100.0 100.0
Composite 100.00 0.202 31.98 100.0 100.0Concentration Ratios (Cl. Conc.: Feed)Weight= 82:1Gold= 23:1Silver= 21:1Note: A Ro. Conc. would be 16.26% of the feed weight, contain 1.044 gAu/mt and 150.30 gAg/mt and represent Au and Ag recoveries of 83.9 and 76.4 %,respectively.
Mr. Chris Crupi / Paramount Gold and Silver Corp.MLI Job No. 3463 - April 4, 2011
24
McCLELLAND LABORATORIES, INC.
Table 32. - Ro. Tail Assay Results, Bulk Sulfide Flotation Tests,Chihuahua Hi Au and Hi Ag, Low Au Samples, P8075µm Feeds
Tail Grade, g/mtHi Au Hi Ag, Low Au
Ro. Tail Assay Au Ag Au Ag1 1.370 10 0.043 9.02 0.618 10 0.036 9.02 1.675 12 0.037 9.0
Average 1.221 10.67 0.039 9.0
Table 33. - Bulk Sulfide Flotation Test Results for Cu, Pb, Zn, Fe and S (Total),Chihuahua Hi Au Sample, P8075µm Feed
DistributionWeight, Analysis, mg/kg Weight, percent
Product Percent Cu Pb Zn Fe S(T) Cu Pb Zn Fe S(T)Cl. Conc. 1.24 4,780 16,350 22,400 79,900 86,000 34.2 38.8 31.0 5.9 65.5Cl. Tail 4.67 630 1,800 2,950 27,100 7,000 17.0 16.1 15.4 7.5 20.1Ro. Tail 94.09 90 250 510 15,500 <1,000.1) 48.8 45.1 53.6 86.6 14.4
Composite 100.00 173.4 522.0 895.6 16,840.4 1,628.5 100.0 100.0 100.0 100.0 100.01) Used value of 250 mg Fe/kg for calculation.
Table 34. - Bulk Sulfide Flotation Test Results for Cu, Pb, Zn, Fe and S (Total),Chihuahua Hi Ag, Low Au Sample, P8075µm Feed
DistributionWeight, Analysis, mg/kg Weight, percent
Product Percent Cu Pb Zn Fe S(T) Cu Pb Zn Fe S(T)Cl. Conc. 1.22 1,150 5,430 10,250 164,000 162,000 13.3 24.0 19.7 7.0 34.1Cl. Tail 15.04 330 1,060 2,280 50,100 24,000 47.0 57.8 54.0 26.4 62.3Ro. Tail 83.74 50 60 200 22,700 <1,000.1) 39.7 18.2 26.3 66.6 3.6
Composite 100.00 105.5 275.8 635.4 28,544.8 5,795.4 100.0 100.0 100.0 100.0 100.01) Used value of 250 mg Fe/kg for calculation.
Flotation test results for the Chihuahua composites show that neither was readily amenable toconventional flotation processing, and data are similar to the San Francisco composites.
Mr. Chris Crupi / Paramount Gold and Silver Corp.MLI Job No. 3463 - April 4, 2011
25
McCLELLAND LABORATORIES, INC.
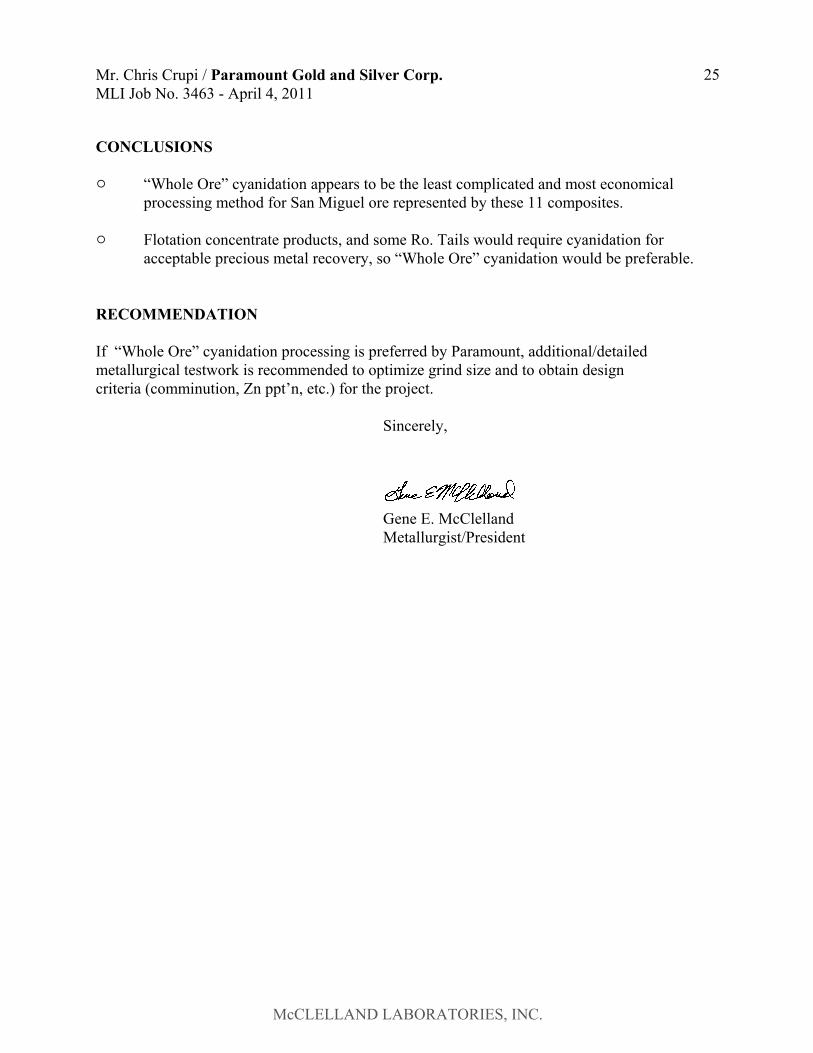
CONCLUSIONS
" “Whole Ore” cyanidation appears to be the least complicated and most economicalprocessing method for San Miguel ore represented by these 11 composites.
" Flotation concentrate products, and some Ro. Tails would require cyanidation foracceptable precious metal recovery, so “Whole Ore” cyanidation would be preferable.
RECOMMENDATION
If “Whole Ore” cyanidation processing is preferred by Paramount, additional/detailedmetallurgical testwork is recommended to optimize grind size and to obtain designcriteria (comminution, Zn ppt’n, etc.) for the project.
Sincerely,
Gene E. McClellandMetallurgist/President