
MBA PROFESSIONAL REPORT - Defense Technical … · Kurt Miles Chivers, Lieutenant Commander, United...
135
MONTEREY, CALIFORNIA MBA PROFESSIONAL REPORT Pacific Fleet Regional Inventory Stocking Model (PRISM) By: Gregory Pekari Kurt Miles Chivers Brian G. Erickson Robert C. Belcher Vitalii Kartashov June 2003 Advisors: Raymond Franck Keebom Kang Dan Dolk Approved for public release; distribution is unl mited. i
Transcript of MBA PROFESSIONAL REPORT - Defense Technical … · Kurt Miles Chivers, Lieutenant Commander, United...
MONTEREY, CALIFORNIA
MBA PROFESSIONAL REPORT
Pacific Fleet Regional Inventory Stocking Model (PRISM)
By: Gregory Pekari Kurt Miles Chivers Brian G. Erickson Robert C. Belcher Vitalii Kartashov
June 2003
Advisors: Raymond Franck Keebom Kang
Dan Dolk
Approved for public release; distribution is unl mited. i

THIS PAGE INTENTIONALLY LEFT BLANK

REPORT DOCUMENTATION PAGE Form Approved OMB No. 0704-0188 Public reporting burden for this collection of information is estimated to average 1 hour per response, including the time for reviewing instruction, searching existing data sources, gathering and maintaining the data needed, and completing and reviewing the collection of information. Send comments regarding this burden estimate or any other aspect of this collection of information, including suggestions for reducing this burden, to Washington headquarters Services, Directorate for Information Operations and Reports, 1215 Jefferson Davis Highway, Suite 1204, Arlington, VA 22202-4302, and to the Office of Management and Budget, Paperwork Reduction Project (0704-0188) Washington DC 20503. 1. AGENCY USE ONLY (Leave blank)
2. REPORT DATE June 2003
3. REPORT TYPE AND DATES COVERED MBA Professional Report
4. TITLE AND SUBTITLE: PACFLT Regional Inventory Stocking Model (PRISM) 6. AUTHOR(S) LCDR Gregory Pekari, LCDR Kurt Miles Chivers, LT Brian Erickson, LT Robert Belcher, MAJ Vitalii Kartashov
5. FUNDING NUMBERS
7. PERFORMING ORGANIZATION NAME(S) AND ADDRESS(ES) Naval Postgraduate School Monterey, CA 93943-5000
8. PERFORMING ORGANIZATION REPORT NUMBER
9. SPONSORING / MONITORING AGENCY NAME(S) AND ADDRESS(ES) Captain Thomas Tichy, CDR Douglas Eades Commander Submarine Force Pacific Fleet
1430 Morton Street, Bldg 619, Pearl Harbor, HI 96860-4664
10. SPONSORING / MONITORING AGENCY REPORT NUMBER
11. SUPPLEMENTARY NOTES. The views expressed in this report are those of the author(s) and do not reflect the official policy or position of the Department of Defense or the U.S. Government. 12a. DISTRIBUTION / AVAILABILITY STATEMENT Approved for public release; distribution is unlimited.
12b. DISTRIBUTION CODE
13. ABSTRACT (maximum 200 words) This following project describes and assesses the current inventory-stocking model used by Commander Submarine Pacific (CSP) to manage its SSN repair parts stocking levels during a deployment work-up period. We also introduce a proposed demand based inventory management tool called Pacific Regional Inventory Stocking Model (PRISM), and compare it with the model currently being used within CSP. This analysis will then evaluate the effectiveness of each system as a management tool utilizing data from CSP’s SSN-688 Fast-Attack Submarines. Decision criteria estimated are operational readiness and cost. The results of this comparison also demonstrate a management tool that optimizes inventory stocking. This will increase an SSN-688 submarine’s operational readiness while on station and potentially achieve cost savings through optimizing onboard inventory. Recommendations will be provided, based on the results of the comparison, with respect to the feasibility of implementing PRISM, maintaining CSP’s current stocking system, or developing a new submarine stocking system to replace the status quo.
15. NUMBER OF PAGES
135
14. SUBJECT TERMS FLSIP, .5FLSIP, COSAL, AVCAL, Database, PRISM, Inventory Stocking, Modeling, Submarine, Deployment Cycles, EXCEL, Crystal Ball
16. PRICE CODE
17. SECURITY CLASSIFICATION OF REPORT
Unclassified
18. SECURITY CLASSIFICATION OF THIS PAGE
Unclassified
19. SECURITY CLASSIFICATION OF ABSTRACT
Unclassified
20. LIMITATION OF ABSTRACT
UL
i

THIS PAGE INTENTIONALLY LEFT BLANK
ii

Approved for public release; distribution is unlimited.
AN ANALYSIS COMPARING COMMANDER SUBMARINE FORCE U.S. PACIFIC FLEET (CSP) CURRENT INVENTORY MANAGEMENT TOOL VERSUS PACFLT
REGIONAL INVENTORY STOCKING MODEL (PRISM), A PROPOSED DEMAND-BASED MANAGEMENT TOOL
Gregory Pekari, Lieutenant Commander, United States Navy Kurt Miles Chivers, Lieutenant Commander, United States Navy
Brian G. Erickson, Lieutenant, United States Navy Robert C. Belcher, Lieutenant, United States Navy
Vitalii Kartashov, Major, Ukrainian Air Force
Submitted in partial fulfillment of the requirements for the degree of
MASTER OF BUSINESS ADMINISTRATION
from the
NAVAL POSTGRADUATE SCHOOL
June 2003
Delete all the lines Authors: ______________________________________________________
Gregory Pekari ______________________________________________________
Kurt Miles Chivers ______________________________________________________
Brian Erickson ______________________________________________________ Robert Belcher ______________________________________________________ Vitalii Kartashov
Approved by: ______________________________________________________ Raymond Franck, Lead Advisor
______________________________________________________ Keebom Kang, Support Advisor ________________________________________________________
Dan Dolk, Support Advisor __________________________________________________________
Douglas A. Brook, Dean, Graduate School of Business and Public Policy
iii

THIS PAGE INTENTIONALLY LEFT BLANK
iv
AN ANALYSIS COMPARING COMMANDER SUBMARINE FORCE U.S. PACIFIC FLEET (CSP) CURRENT INVENTORY MANAGEMENT TOOL
VERSUS PACFLT REGIONAL INVENTORY STOCKING MODEL (PRISM), A PROPOSED DEMAND-BASED MANAGEMENT TOOL
ABSTRACT
This following project describes and assesses the current inventory stocking tool
used by Commander U.S. Submarine Force Pacific Fleet (CSP), Mission Essential Spare
Support (MESS), to manage its SSN stocking levels during a deployment work-up
period. We also introduce a proposed demand based inventory management tool, Pacific
Regional Inventory Stocking Model (PRISM), and compare it with the tools currently
being used within CSP.
This analysis will then evaluate the effectiveness of each system as a management
tool using data from CSP’s SSN-688 Fast-Attack Submarines. The decision criteria
estimated are operational readiness and associated inventory costs. Statistical simulation
modeling will be employed to compare these evaluated criteria as determine by MESS
and PRISM. This analysis provides evidence that with the inclusion of repair part
demand data, cost savings will be realized for a specified inventory service level.
Recommendations will be provided, based on the results of the comparison, as to the
feasibility of implementing PRISM, maintaining MESS, or developing a new submarine
stocking system to replace the status quo.
v

THIS PAGE INTENTIONALLY LEFT BLANK
vi

TABLE OF CONTENTS
EXECUTIVE SUMMARY .............................................................................................1
I. INTRODUCTION ...............................................................................................51
A. PURPOSE................................................................................................51
B. HISTORY ................................................................................................51
1. SSN Operations.........................................................................51
2. SSN Logistics Process ..............................................................52
C. BACKGROUND .....................................................................................53
1. FLSIP Inventory Control System .............................................53
a. .5FLSIP Plus ....................................................................54
b. MESS ...............................................................................54
2. AVCAL.....................................................................................55
D. COMMANDER SUBMARINE FORCE U.S. PACIFIC FLEET
CURRENT EXPEDITING MANAGEMENT PROCESS......................55
II. PRISM DEVELOPMENT...................................................................................59
A. OVERVIEW ............................................................................................59
B. ORIGINAL MESS REPORT ..................................................................59
C. PRISM REPORT .....................................................................................61
D. QTRAVDMD vs. ALW...........................................................................63
E. QTRAVDMD vs. OHQTY......................................................................63
III. PRISM VALIDATION AND INVENTORY SIMULATION............................67
A. PURPOSE OF SIMULATION................................................................67
B. SIMULATION SOFTWARE PACKAGE ..............................................67
vii

C. ASSUMPTIONS......................................................................................67
D. POISSON DISTRIBUTION....................................................................68
E. CRYSTAL BALL® SIMULATION.......................................................69
1. Simulation Description .............................................................69
2. Procedure ..................................................................................70
F. SIMULATION RESULTS ......................................................................72
IV. RECOMMENDATIONS AND CONCLUSIONS ..............................................77
A. RECOMMENDATIONS FOR IMPLEMENTATION ...........................77
B. RECOMMENDATIONS FOR FOLLOW-ON RESEARCH .................78
C. CONCLUSION........................................................................................78
APPENDIX – PRISM DATABASE ............................................................................81
A. INTRODUCTION.......................................................................................81
B. ASSUMPTIONS .........................................................................................82
C. REQUIREMENTS ANALYSIS .................................................................82
1. Stakeholder ...............................................................................82
2. Report Requirements ................................................................82
3. Query Requirements .................................................................82
D. RELATIONS, RELATIONSHIPS AND CONSTRAINTS........................82
1. Entity Relation Diagram ...........................................................83
2. Semantic Object Model.............................................................83
3. Table / Column .........................................................................84
4. Microsoft Access Relationships................................................85
E. INPUTS, OUTPUTS AND USER INTERFACE .......................................85
viii

1. Inputs.........................................................................................85
2. Outputs......................................................................................86
3. User Interface............................................................................87
F. DATABASE ADMINISTRATION ............................................................87
1. Security Measures.....................................................................87
2. Back Up and Recovery Procedures...........................................87
3. Resource Locking Procedures...................................................88
4. Transaction Processing Considerations ....................................89
BIBLIOGRAPHY............................................................................................................117
LIST OF REFERENCES.................................................................................................119
INITIAL DISTRIBUTION LIST ....................................................................................121
ix

THIS PAGE INTENTIONALLY LEFT BLANK
x
LIST OF FIGURES
1. MESS / PRISM – Section 1......................................................................................61
2. PRISM – Section 2 ...................................................................................................64
3. PRISM – Section 3 ...................................................................................................65
4. Poisson Distribution Graphic....................................................................................69
5. Cost Versus Service Level Graphic..........................................................................69
6. PRISM Simulation – Section 4.................................................................................70
7. PRISM Simulation –Section 5..................................................................................72
8. USS Pasadena, D-60 – Section 4..............................................................................73
9. Comparison of MESS and PRISM Based on Average Inventory Cost ....................74
10. Entity Relation Diagram for PRISM Database.........................................................90
11. Semantic Object Model for PRISM Database ..........................................................91
12. Table/Column for PRISM Database.........................................................................92
13. Microsoft Access Relationship for PRISM Database...............................................93
14. Example Input Screen for PRISM Database ............................................................94
15. Example Output Screen for PRISM Database..........................................................95
16. Microsoft Access Privilege Matrix for PRISM(S) Database....................................96
17. PRISM Main Menu...................................................................................................98
18. Fleet Inventory Management Form ..........................................................................99
19. Master Parts List Input Form....................................................................................100
20. Master Parts List Update Form.................................................................................101
21. Fleet Inventory Management Reports Form.............................................................102
22. Ship Deployment Information Update Form............................................................104
xi

23. Ship Information Input Form....................................................................................105
24. Fleet Inventory Management Form ..........................................................................106
25. Ship Deployment Inventory Update Form ...............................................................107
26. Master Parts List by APL Report..............................................................................109
27. Master Parts List by NIIN.........................................................................................110
28. Fleet - Ship Deployment Report ...............................................................................111
29. Fleet - Ship Information Report................................................................................112
30. Ship Inventory Report...............................................................................................114
31. Ship Inventory Report by Inventory ID Number......................................................115
32. Ship Information Report ...........................................................................................116
xii
EXECUTIVE SUMMARY
The following executive summary is provided in the form of a Microsoft®
Power Point presentation, and acts as the centerpiece to this professional report. The
format of this presentation is one slide per page with its accompanying notes section.
Within each notes section is an abstract that provides an overview for the slide, the
associated briefing script for each slide, and presenter notes that provide additional
explanatory language or specific references.
1
Slide 1
1
PACFLT Regional InventoryPACFLT Regional InventoryStocking ModelStocking Model
Kurt ChiversVitalii Kartashov Greg PekariBrian EricksonRob Belcher
2
Slide 2
2
AgendaAgenda
♦ Project Objectives♦ Introduction♦ Inventory Stocking Models &Tools♦ Current COMSUBPAC Process♦ PRISM Spreadsheets (Excel)♦ PRISM Crystal Ball Simulation♦ PRISM Results♦ Recommendations♦ Conclusions
Abstract: Agenda for presentation
3

Slide 3
3
Project ObjectivesProject Objectives
I. To create an optimal stocking level to help maintain or increase a submarines operational readiness on-station
II. Achieve cost savings through reduction of onboard inventory due to optimal part stocking
Abstract: Project objectives slide
Briefing Script:
These objectives are complementary. A new method might achieve more effective
supply support with the same inventory investment.
4

Slide 4
4
IntroductionIntroductionPast SSN Operational CyclePast SSN Operational Cycle
♦ Six month deployment every 24 months♦ Inter-deployment period:
– SRA– Week to several month operations– Training– Deployment work-up and qualification
However…
Abstract: The Typical Past Operating Environment
Briefing Script:
The operational tempo (OPTEMPO) of an SSN traditionally consists of one a six-
month deployment every 24 months. In some cases the six month deployment is split
into two three month theater deployments. The SSN will undergo an extended
maintenance period call Submarine Refit Availability (SRA) during which major systems
are repaired, replaced or updated. The 18 month turn-around period between deployments
consists of one week to several months of operations composed of exercises, contingency
operations, training and diplomatic missions. Approximately six months to a year before
an SSN extended deployment, the ship will commence a work up, otherwise known as an
extended training period, in which the crew and ship prepares and qualifies for the
upcoming operations.
*Note: See Chapter I, section B, paragraph 1.
5

Slide 5
5
SSN Current EnvironmentSSN Current Environment♦ Shortened turn-around times for deployment
♦ Increasing amounts of technology installs onboard the submarines prior to deployment
♦Diversity of missions post 9/11
♦ Potential inability of .5FLSIP Plus to adequately stock proper repair parts onboard before deployment based on above
Abstract: The SSN Current Operating Environment
Briefing Script:
Inter-deployment turnaround times have shortened (due to 9/11, Afghan war, and
Iraqi war) from 18 months to as low as every 12 months. Based upon the increased
operational tempo, new systems are being installed at an increasing rate without the
ability of the ship to adequately test for its own usage rate. Due to the above, the
.5FLSIP Plus stocking model relies on the engineers BRF (Best Replacement factor) as
an allowance.
6
Slide 6
6
Abstract: Evolution of FLSIP modeling
7

Slide 7
7
The equation for FLSIP isUR = Pop * BRF
fwhere UR=Usage Rate,
Pop=Population of part on board, BRF=Best Replacement
Factor, and f is the current FLSIP constant.
FLSIP Equation
Abstract : This is the standard FLSIP equation for outfitting spares.
Briefing Script:
Explain equation and components.
*Note: See Chapter I, section C, paragraph 1.
8

Slide 8
8
4
The Study …COSAL Models
• Fleet Logistics Supply Improvement Program – Attempt to improve readiness … early 80s– Provided demand based allowance product– .25 Demand criteria …
– MOD FLSIP … late 80’s … fix high CASREP rate– Targeted primary mission area equipment– Lowered demand criteria … went to 1 demand in 10 yrs
for critical systems … Sonar System, periscopes etc– Drove 27% increase in spare parts inventory costs!
.25 FLSIP & Mod FLSIP
Source:Source:www.spear.nav y.mil/fleet maintenance/FM-ESC/2001-11/Cosal%20Study% 20Update%20(7%20nov%202001).ppt
The equation for FLSIP isUR = Pop * BRF / #, where UR=Usage Rate, Pop=Population of part
on board, and BRF=Best Replacement Factor.
1 hit expected in 4 years (1/.25)
Abstract: FLSIP equation and evolution of the FLSIP program.
Briefing Script:
FLSIP was created during the early 1980’s and was initially called .25FLSIP. It
focused primarily on increasing readiness of the fleet. The predicted repair component
usage rate threshold for .25FLSIP was set at one failure in four years to achieve the
required stocking level. This was a best guess stocking level upon implementation of the
FLSIP system. In the late 1980s, there was a push to decrease the CASREP (Casualty
Report) rate within the surface and submarine force, especially in the area of primary
mission equipment. As a result, the FLSIP model was to incorporate these changes and
renamed MOD FLSIP, which lowered the demand criteria from one failure in four years
to one failure in ten years for critical systems (sonar systems, periscopes, etc…). The
result of MOD FLSIP was a dramatic increase in the number of repair parts held onboard
ship, with a respective spike in increased repair parts spending.
9

Slide 9
9
.5 FLSIP… Plus.5 FLSIP… Plus
Source: Maritime Allowance Review
♦ Reduced cost by eliminating dead stock♦ .5FLSIP .5FLSIP Demand criteria … 1 failure in 2 yrs
– (rather than 1 in 4 years (.25FLSIP) or 1 in 10 years FLSIP (MOD))
♦ Other Criteria … the “Plus”– Engineering-based allowance decisions (PMS, Safety, RBS,
MAMs)– Tailored add-backs based on actual ship class/group
3M/CASREP♦ Result/Impact:
– 25% reduction in shipboard allowances (approx. $200Macross fleet) … 3-5% decline in effectiveness
The Current ModelThe Current Model
Abstract: Explaining .5FLSIP and the Current Model now used in the fleet, .5FLSIP
“Plus”.
Briefing Script:
The .5FLSIP system replaced the MOD FLSIP system. The predicted usage rate
threshold of .5FLSIP was set at one failure in two years to achieve prescribed stocking
levels, thereby dramatically decreasing the number of spares held onboard submarines as
compared to the MOD system.
With continual improvement in stocking algorithms, FLSIP evolved, yet again, into
an even more streamlined, cost-effective stocking model called .5FLSIP Plus. Today’s
standard, .5FLSIP Plus, is a simple algorithm that utilizes the entire submarine
communities’ demand for repair components to predict future usage rates. It stocks
quantities based on high and low limits. Any allowance candidate whose usage rate (UR)
failed the .5FLSIP threshold criteria (one failure in two years) was deleted from the initial
stocking then compared to a newly created demand-based data file.
*Note: See Chapter I, section C, paragraph 1a.
10

Slide 10
10
++
Abstract: Lead-in slide to MESS
11
Slide 11
11
(Old) MESS(Old) MESS(Mission Essential Spares Support)
PeriscopeSonar
Fire control system
Torpedo tubes
Nuclear stuff
Approx. 8-10 critical systems are thoroughly reviewed for 100% parts support
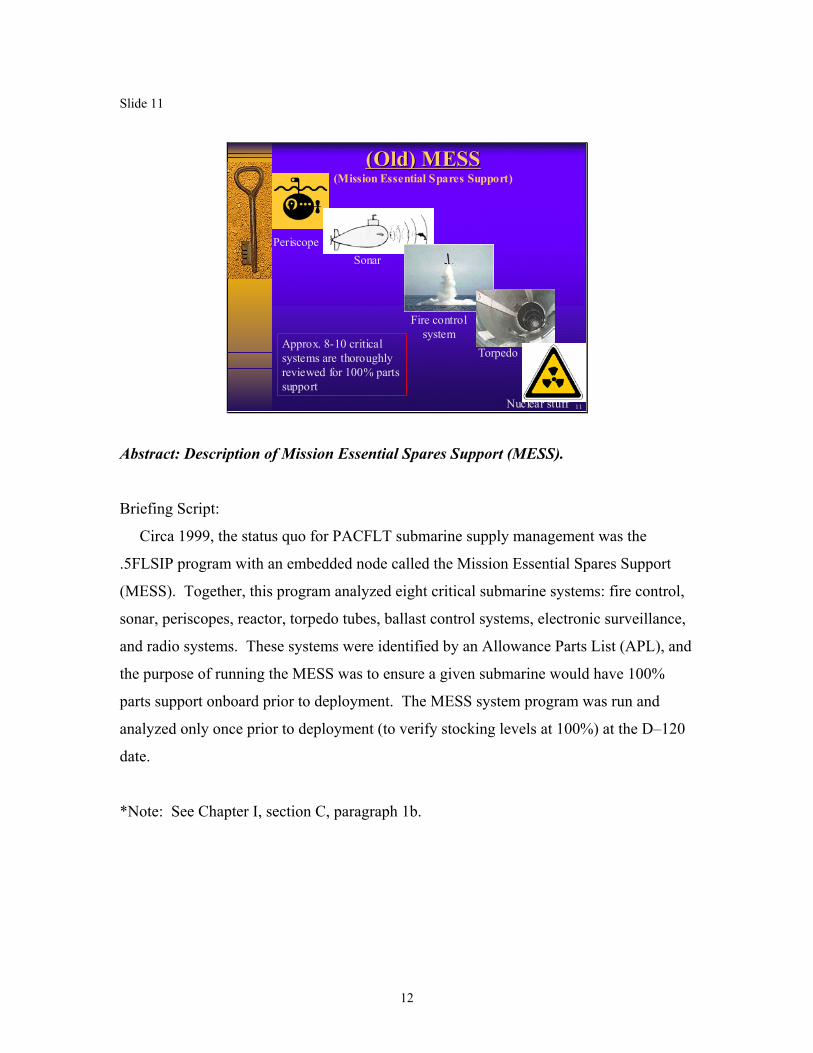
Abstract: Description of Mission Essential Spares Support (MESS).
Briefing Script:
Circa 1999, the status quo for PACFLT submarine supply management was the
.5FLSIP program with an embedded node called the Mission Essential Spares Support
(MESS). Together, this program analyzed eight critical submarine systems: fire control,
sonar, periscopes, reactor, torpedo tubes, ballast control systems, electronic surveillance,
and radio systems. These systems were identified by an Allowance Parts List (APL), and
the purpose of running the MESS was to ensure a given submarine would have 100%
parts support onboard prior to deployment. The MESS system program was run and
analyzed only once prior to deployment (to verify stocking levels at 100%) at the D–120
date.
*Note: See Chapter I, section C, paragraph 1b.
12
Slide 12
12
AVCAL StockingAVCAL Stocking
AVCAL additions based upon• “Real time” deployed demand data used
•Like platforms only
• Additions added immediately to AVCAL
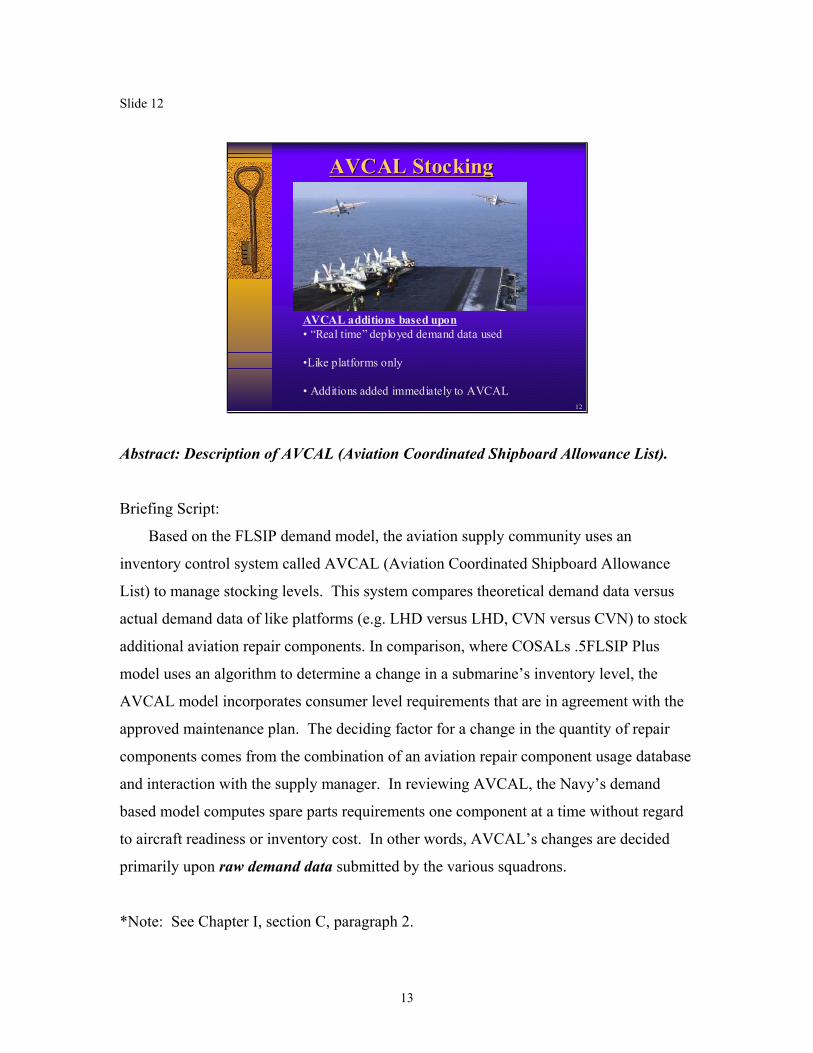
Abstract: Description of AVCAL (Aviation Coordinated Shipboard Allowance List).
Briefing Script:
Based on the FLSIP demand model, the aviation supply community uses an
inventory control system called AVCAL (Aviation Coordinated Shipboard Allowance
List) to manage stocking levels. This system compares theoretical demand data versus
actual demand data of like platforms (e.g. LHD versus LHD, CVN versus CVN) to stock
additional aviation repair components. In comparison, where COSALs .5FLSIP Plus
model uses an algorithm to determine a change in a submarine’s inventory level, the
AVCAL model incorporates consumer level requirements that are in agreement with the
approved maintenance plan. The deciding factor for a change in the quantity of repair
components comes from the combination of an aviation repair component usage database
and interaction with the supply manager. In reviewing AVCAL, the Navy’s demand
based model computes spare parts requirements one component at a time without regard
to aircraft readiness or inventory cost. In other words, AVCAL’s changes are decided
primarily upon raw demand data submitted by the various squadrons.
*Note: See Chapter I, section C, paragraph 2.
13

Slide 13
13
COMSUBPAC’s Current Process
(A Modified Version of MESS)
Abstract: Lead-in slide to CSP’s current inventory process
14
Slide 14
4 Looks4 LooksDD--120120DD--9090DD--6060DD--3030
Prior to Prior to DeploymentDeployment
By the BOATBy the BOAT
Boats submit Boats submit 3M Demand Data 3M Demand Data
Monthly to Monthly to NAVICPNAVICP
FOXPRO Current Demand
Database (COMSUBPAC)Secure InternetSecure Internet
Transmit Reorder Requisitions
Receive
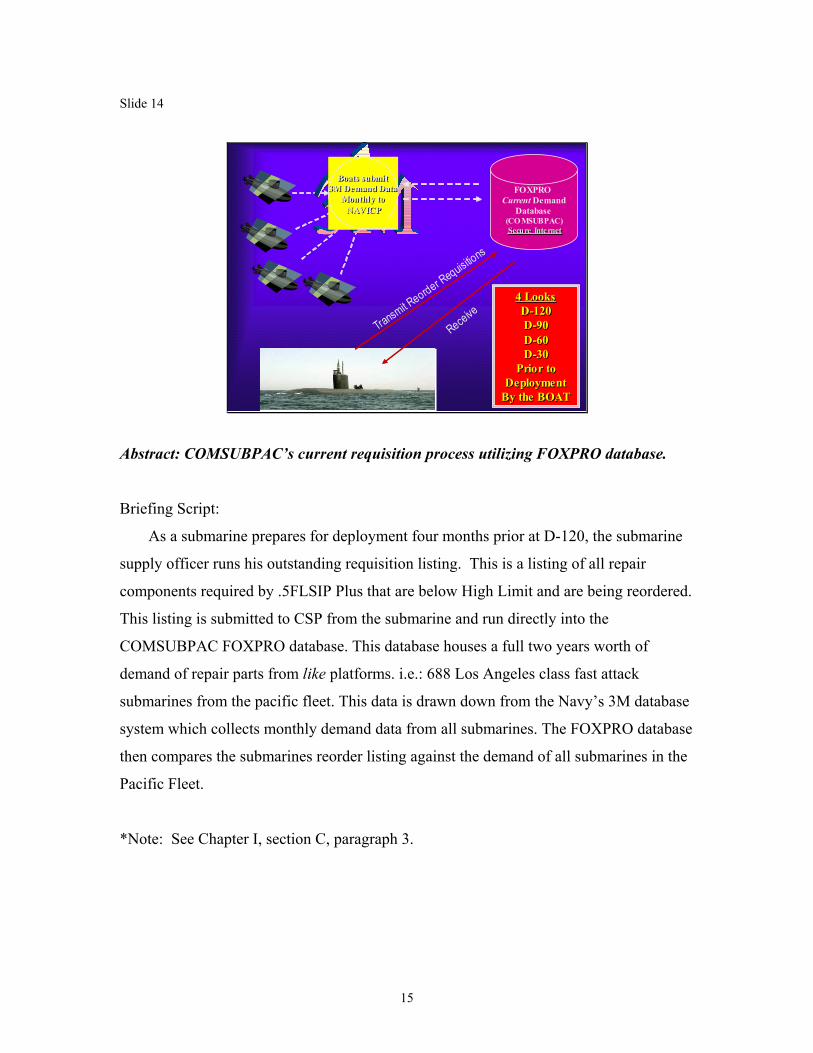
Abstract: COMSUBPAC’s current requisition process utilizing FOXPRO database.
Briefing Script:
As a submarine prepares for deployment four months prior at D-120, the submarine
supply officer runs his outstanding requisition listing. This is a listing of all repair
components required by .5FLSIP Plus that are below High Limit and are being reordered.
This listing is submitted to CSP from the submarine and run directly into the
COMSUBPAC FOXPRO database. This database houses a full two years worth of
demand of repair parts from like platforms. i.e.: 688 Los Angeles class fast attack
submarines from the pacific fleet. This data is drawn down from the Navy’s 3M database
system which collects monthly demand data from all submarines. The FOXPRO database
then compares the submarines reorder listing against the demand of all submarines in the
Pacific Fleet.
*Note: See Chapter I, section C, paragraph 3.
15

Slide 15
15
CSP Current ProcessCSP Current Process
(Includes two years worth of PACFLT fast attack Submarine demand data for all parts ordered)
Theory
.5FLSIP Plus .5FLSIP Plus Allowance Allowance
Computation Computation ModelModel
Real TimeReal Time Allowance Allowance AdditionsAdditions
Abstract: This is the CSP Current Process continued. This is a Modified Version of
MESS that CSP uses.
Briefing Script:
In 1999, COMSUBPAC terminated the MESS node, desiring a different, more
functional program to replace it. The follow on program would be capable of analyzing
all systems and parts onboard a submarine versus only the selected eight (MESS). The
emergent program was a merger of two inventory control systems, AVCAL stocking
theory and the current .5FLSIP Plus. This merger would take AVCALs real time demand
data theory and compare it to the .5FLSIP Plus stocking model data, depositing the
resultant submarine usage rate into a FOXPRO database management system.
*Note: Note: See Chapter I, section C, paragraph 3.
16
Slide 16
CSPDMD CSPQTY EFD ALW OHQTY95 148 HYDRAULIC CONTROL-FWD 1 082 6322 Gasket 2 inch hyd. 61 075 81 GAS GENERATION-OXYGEN PLA 1 075 81 GAS GENERATION-OXYGEN PLA 1 072 743 FRESH WATER SYSTEM-AUXILI 4 068 644 DISTILLING PLANT-MAIN 8 067 95 WEAPON SYSTEM-MK67 LAUNCH 2 064 12581 SANITATION-TRASH COMPACTE 3 037 89 FIRE FIGHTING-HOSE 0 036 120 CONDENSING SYSTEM-MAIN CO 3 034 55 AN/WIC-2( ) INTERCOMMUNIC 1 033 IC-CIRCUIT KEH 1 033 39 IC-CIRCUIT KEH 1 033 67 IC-CIRCUIT MC INTEGRATED 1 028 31 TRIM X DRAIN SYSTEM-DRAIN 1 026 32 CO2 REMOVAL SYSTEM 0 018 26 FIRE FIGHTING-HOSE 5 013 16 FRESH WATER SYSTEM-AUXILI 1 012 29 AM-2210( )/WTC AUDIO FREQ 1 010 10 NANCY 1 010 18 IC-CIRCUIT MC INTEGRATED 3 0
FOXPRO demand data fr om PACFLT 688’s .5 FLSIP Plus
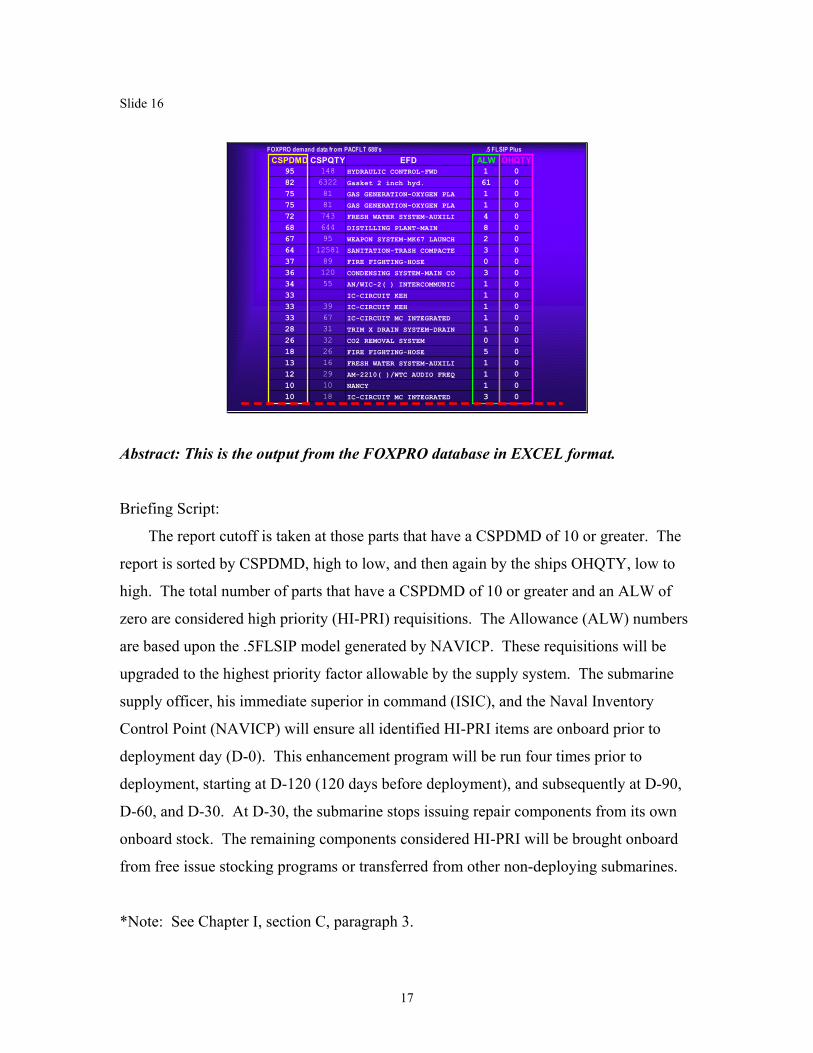
Abstract: This is the output from the FOXPRO database in EXCEL format.
Briefing Script:
The report cutoff is taken at those parts that have a CSPDMD of 10 or greater. The
report is sorted by CSPDMD, high to low, and then again by the ships OHQTY, low to
high. The total number of parts that have a CSPDMD of 10 or greater and an ALW of
zero are considered high priority (HI-PRI) requisitions. The Allowance (ALW) numbers
are based upon the .5FLSIP model generated by NAVICP. These requisitions will be
upgraded to the highest priority factor allowable by the supply system. The submarine
supply officer, his immediate superior in command (ISIC), and the Naval Inventory
Control Point (NAVICP) will ensure all identified HI-PRI items are onboard prior to
deployment day (D-0). This enhancement program will be run four times prior to
deployment, starting at D-120 (120 days before deployment), and subsequently at D-90,
D-60, and D-30. At D-30, the submarine stops issuing repair components from its own
onboard stock. The remaining components considered HI-PRI will be brought onboard
from free issue stocking programs or transferred from other non-deploying submarines.
*Note: See Chapter I, section C, paragraph 3.
17

Slide 17
17
Abstract: An example of a FOXPRO database summary sheet from CSP.
Briefing Script:
This is a summary sheet that is provided to the ISIC and to the Submarine Supply
Officer after a report has been run through the FOXPRO database. It is a breakdown of
the number of requisitions that are currently outstanding and required to be onboard prior
to deployment. Note that this is only an expediting tool. There are no changes being
made to the .5FLSIP allowances of the individual submarine.
18
Slide 18
18
LimitationsLimitations
♦ Expediting tool only
♦ Does not take into account cost effectiveness issues
♦ Does not optimize onboard inventory as well as it could, hence our proposal
Abstract: Limitations of CSP’s current process and management tools.
Briefing Script:
Expediting Tool only: Affects only high demand items with CSPDMD of 10 or
greater. Only looks at a submarines OHQTY of zero. Does not take into account the cost
of inventory, potential adds or deletes. Extreme amounts of data available, however, data
mining issues are non-existent.
19
Slide 19
19
Our Project…Our Project…
PRISMPRISMPACFLT Regional Inventory PACFLT Regional Inventory
Stocking ModelStocking Model
Abstract: Our project lead-in slide
20

Slide 20
20
++
Abstract: Our proposed model as evolved from .5FLSIP Plus
21
Slide 21
1020.252.001
1020.252.001
1120.251.002
1460.752.003
3650.631.673
40101.255.002
44202.5010.002
4910.131.001
5812415.5013.789
6630.381.003
286303.752.5012
36623929.885.8341
CSPDMDSHIPQTYSHIPUSRT
PARTS/QTRSHIP2YRAVDMD reqnsSHIPDMD
Individual Ship DataIndividual Ship DataSHIPQTY/8
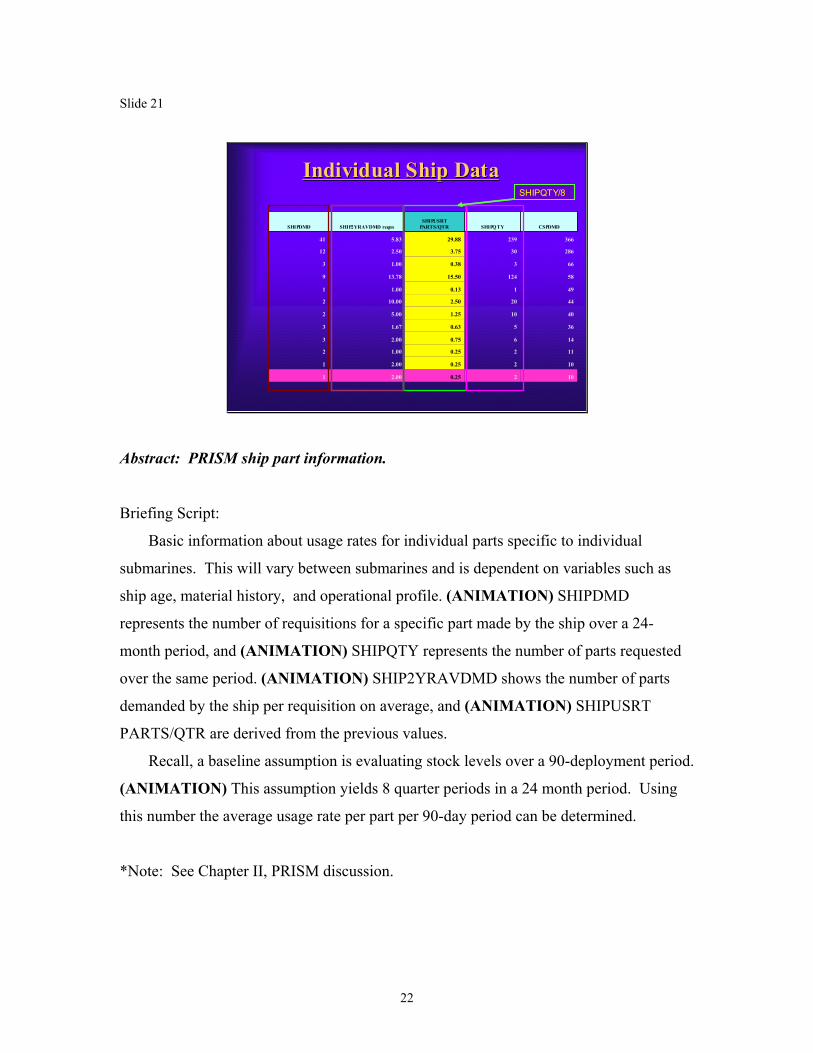
Abstract: PRISM ship part information.
Briefing Script:
Basic information about usage rates for individual parts specific to individual
submarines. This will vary between submarines and is dependent on variables such as
ship age, material history, and operational profile. (ANIMATION) SHIPDMD
represents the number of requisitions for a specific part made by the ship over a 24-
month period, and (ANIMATION) SHIPQTY represents the number of parts requested
over the same period. (ANIMATION) SHIP2YRAVDMD shows the number of parts
demanded by the ship per requisition on average, and (ANIMATION) SHIPUSRT
PARTS/QTR are derived from the previous values.
Recall, a baseline assumption is evaluating stock levels over a 90-deployment period.
(ANIMATION) This assumption yields 8 quarter periods in a 24 month period. Using
this number the average usage rate per part per 90-day period can be determined.
*Note: See Chapter II, PRISM discussion.
22

Slide 22
CSP 24CSP 24--month Demand Datamonth Demand Data
48LUBE OIL SYSTEM-MN SHAFT370.184.638
14VENTILATION SYSTEM-HYDROG210.102.1010
01LUBE OIL SYSTEM-EMERGENCY130.061.1811
24VERTICAL LAUNCH SYSTEM-TO300.142.1414
01HYDRAULIC CONTROL-STEERIN6092.9340.6015
01TRIM X DRAIN SYSTEM-AUX D210.101.0021
5758AN/BQQ-5( )( ) S0NAR SYST1640.797.4522
1315AIR SUPPLY-HIGH PRESSURE-690.332.3030
23GAS GENERATION-OXYGEN PLA800.382.2236
010LUBE OIL SYSTEM-EMERGENCY3741.809.3540
3248DAMAGE CONTROL-LANTERN6963.3512.0058
27AIR CONDITIONING-PLANT1020.491.5566
12HYDRAULIC CONTROL-STEERIN4942.386.6874
1516VERTICAL LAUNCH SYSTEM-TO1880.901.9696
1314HYDRAULIC CONTROL-STEERIN1640.791.61102
16NANCY3481.673.11112
57AIR CONDITIONING-PLANT2101.011.63129
2080ELECTRIC POWER SUPPLY-BAT635430.5544.75142
322WEAPON SYSTEM-MK67 LAUNCH6152.963.87159
132134HYDRAULIC CONTROL-STEERIN7223.472.52286
5360PERISCOPE NO 210274.942.81366
OHQTYALWEFDCSPQTYQTRAVDMD PartsAV2YRDMD reqnsCSPDMD
(CSPQTY/8)*(1/n)
Abstract: Slide shows the creation of CSP PRISM data and comparisons to the FLSIP
allowance and ship stocking levels.
Briefing Script:
Derived from the MESS report CSP 24-month aggregate data is filtered, augmented,
and calculated to create 90-day demand data. CSPDMD and CSPQTY values are carried
over from the original MESS report as are ALW and OHQTY. Two new columns are
introduced in the PRISM report. First, (ANIMATION) AV2YRDMD represents the
average parts per requisition over two years. Second, (ANIMATION) QTRAVDMD
represents the average number of parts demanded per 90-days (the assumed evaluation
period) per ship (n, assumed to be 26), and are baseline demand values.
Once the part demand data has been calculated, initial snapshot comparisons are
available to the inventory manager; (ANIMATION) QTRAVDMD vs. ALW, and
QTRAVDMD vs. OHQTY.
*Note: See Chapter II PRISM discussion.
23

Slide 23
Demand Comparison between Demand Comparison between Individual Ships and CSPIndividual Ships and CSP
572101.011.63129232.881.3517
2080635430.5544.7514255469.2513.5141
688704.186.04144263.258.673
3226152.963.87159243.002.1811
111416337.8510.27159111.381.577
683171.521.98160202.501.1817
1321347223.472.52286303.752.5012
21247213.472.40300121.501.717
536010274.942.8136623929.885.8341
OHQTYALWCSPQTYQTRAVDMD
PartsAV2YRDMD
reqnsCSPDMDSHIPQTYSHIPUSRT
PARTS/QTRSHIP2YRAVDM
D reqnsSHIPDMD
Abstract: Slide shows how ship demand compares to CSP average demand, ALW and
OHQTY.
Briefing Script:
Combining both the ship and CSP PRISM report elements provides the inventory
manager with the first management tool product. This PRISM tool is a snapshot
comparison between ship demand (SHIPUSRT), CSP demand (QTRAVDMD), FLSIP
allowance (ALW), and stock level (OHQTY).
First, (ANIMATION) comparing ship demand to CSP demand can show a match;
Second, (ANIMATION) here mismatches are noted between demand levels. In all cases
it is seen the FLSIP allowance level does not match either demand level (CSP or Ship).
This data and the subsequent comparisons set up the premise for model construction and
simulations involved with determining optimal stocking levels.
Note: Chapter II, PRISM discussion.
24

Slide 24
Allowance in Excess of CSP DemandAllowance in Excess of CSP Demand
22232
N/AnoN/AnoN/AnoN/AnoOK
N/AnoN/AnoN/AnoN/AnoOK
N/AnoN/AnoN/AnoN/AnoOK
N/AnoN/AnoN/Ano1.80YES!OK
N/AnoN/AnoN/AnoN/AnoOK
N/AnoN/AnoN/AnoN/AnoOK
N/AnoN/AnoN/AnoN/AnoOK
N/AnoN/AnoN/AnoN/AnoOK
N/AnoN/AnoN/AnoN/AnoOK
0.15YES!11.90YES!23.64YES!35.38YES!OK
N/AnoN/AnoN/AnoN/AnoWHY?
N/AnoN/AnoN/AnoN/AnoOK
0.20YES!4.26YES!8.31YES!12.36YES!WHY?
N/AnoN/AnoN/AnoN/AnoOK
N/AnoN/AnoN/AnoN/AnoOK
N/AnoN/AnoN/AnoN/AnoOK
N/AnoN/AnoN/AnoN/AnoOK
N/AnoN/AnoN/AnoN/AnoOK
Add'l CostsALW<.25(QTRAV
DMD)Add'l CostsALW<.5(QTRAV
DMD)Add'lCostsALW<.75(QTRAVDM
D)Add'l CostsALW<100%(QTRAV
DMD)BAL
$ 0.36 $ 16.15 $ 31.95 $ 49.55
Abstract: PRISM Section 2, FLSIP allowance in excess of CSP demand
(QTRAVDMD)
Briefing Script:
Section 2 of the PRISM report identifies if OHQTY is less than CSP Demand (seen
in BAL), identifies if the FLSIP allowance is below a specific quartile level of CSP
demand (QTRAVDMD), and identifies the individual part and aggregate costs of
increasing part allowances to match the CSP demand levels.
The advantage of evaluating ALW and costs against quartile levels is it provides
information to the inventory manager that helps them manage risk while making stocking
decisions.
*Note: Chapter II, PRISM section 2 discussion.
25

Slide 25
$ 3,620.64 $ 7,241.28 $ 10,861.92 $ 14,482.57 655%
$ 865.07 0.47$ 1,730.14 0.70$ 2,595.22 0.93$ 3,460.29 0%
$ 43.44 0.94$ 86.88 1.42$ 130.31 1.89$ 173.75 904%
$ 7.66 0.46$ 15.32 0.69$ 22.98 0.92$ 30.63 0%
$ 1,279.76 0.46$ 2,559.52 0.69$ 3,839.28 0.91$ 5,119.04 0%
$ 50.17 401.38$ 100.35 602.08$ 150.52 802.77$ 200.69 8561%
$ 0.76 6.34$ 1.52 9.51$ 2.28 12.68$ 3.04 2794%
$ 60.62 1.86$ 121.25 2.79$ 181.87 3.72$ 242.49 0%
$ 0.44 0.43$ 0.89 0.64$ 1.33 0.85$ 1.77 0%
$ 114.84 0.39$ 229.68 0.59$ 344.52 0.79$ 459.36 0%
$ 1.58 0.41$ 3.15 0.62$ 4.73 0.83$ 6.31 0%
$ 74.31 5.65$ 148.63 8.47$ 222.94 11.30$ 297.25 855%
$ 13.59 2.75$ 27.19 4.13$ 40.78 5.51$ 54.38 161%
$ 102.09 2.64$ 204.18 3.96$ 306.28 5.27$ 408.37 0%
$ 4.63 0.70$ 9.25 1.05$ 13.88 1.39$ 18.50 0%
$ 471.49 14.82$ 942.97 22.23$ 1,414.46 29.63$ 1,885.95 1226%
$ 36.34 42.02$ 72.69 63.03$ 109.03 84.03$ 145.38 100%
$ 134.43 54.42$ 268.85 81.63$ 403.28 108.85$ 537.70 1836%
$ 183.67 3.46$ 367.34 5.19$ 551.01 6.92$ 734.68 289%
$ 103.41 1.51$ 206.82 2.26$ 310.23 3.02$ 413.63 306%
25% SavingsQtyDec50% SavingsQtyDec75% SavingsQtyDec100% Savings% Overstock*
Matching ALW to DemandMatching ALW to Demand
Abstract: This slide shows the level of inventory overstock (compared to CSP demand),
and the cost savings and inventory adjustments required to match FLSIP allowance to
CSP demand.
Briefing Script:
This slide depicts section three of the PRISM report. Section three consists of three
parts. First, %Overstock compares current ship stock levels to CSP demand quantities.
Second, savings are displayed that would result from adjusting the FLSIP allowance to
match the specified CSP demand level. Third, the amount of inventory adjustment
required to match ALW to CSP quarterly demand levels.
The value of this section lies in the dollar numbers evident at each requisition period
that can be realized if ALW levels are matched to observed average demand levels.
Additionally, when coupled with the levels provided by the following model, optimal
stocking levels can be determined that will maximize operational readiness (based on the
managers desired risk level) and cost savings.
*Note: Chapter II, PRISM section 3 discussion.
26

Slide 26
26
PRISMPRISMCrystal Ball (CB) Crystal Ball (CB)
SimulationSimulation
Abstract: Proposed Crystal Ball simulation model
27

Slide 27
27
Simulation Assumptions1. Prepared for mission critical spare parts with a demand
of 10 or greater and a current zero on-hand inventory quantity.
2. Worse case scenario application - The maximum submarine deployment cycle is 90 days without a re-supply.
3. The Poisson distribution was chosen as the baseline assumption because individual part failures are random in nature and difficult to predict.
4. The protection level was set to 0.99 for each individual part.
5. All parts with a demand of 10 or greater are considered independent of one other, equally mission critical, and non-repairable onboard the submarine.
Abstract: Assumptions for Crystal Ball simulation
Briefing Script:
The simulation was prepared for mission critical spare parts with a demand of 10 or
greater and a current zero on-hand inventory quantity.
The maximum submarine deployment cycle is ninety days without a re-supply.
A period of ninety days was chosen based upon historical information provided by CSP
Supply Department and is chosen for the worse case scenario application.
Within the context of the Crystal Ball software, assumptions represent the probability
distributions utilized in creating and analyzing simulations. Because individual part
failures are random in nature and difficult to predict, the Poisson distribution was chosen
as the baseline assumption. This distribution involves counting the number of times a
random event occurs during a fixed time period; i.e., distance, area, etc. For the purpose
of this analysis the mean used in the Poisson distribution equates to usage rate for a
particular part over the evaluated period.
While running simulations to estimate the desired inventory level, the protection
level was set to 0.99 for each individual part. With this level of certainty, a submarine
will experience a stockout 1 out of every 100 cases.
28

All parts with a demand of 10 or greater are considered independent of one other,
equally mission critical, and non-repairable onboard the submarine.
Mission critical spare parts are defined as those parts that, if failure should occur, would
cause a submarine to come off-station in the event of an inventory stockout.
*Note: See Chapter III, section C, paragraphs 1-5.
29

Slide 28
Logic of Simulation
Cost comparison .5 FLSIP ALW vs. PRISM MIX while maxi mizing readiness
Abstract: Simulation table
Briefing Script:
Generated by the Crystal Ball, predicted average demand for 90 days deployment
(PAVDMD) needs to be compare with quarterly average demand (QAVDMD) and pick
up a higher number. It allows to maintain the same level of readiness because we
compare predicted average demand of a particular submarine vs. quarterly average
demand among all submarine USS 688 class on PACFLT. The result of the comparison is
displayed in the “MIX” column. This column represents PRISM allowance that is
recommended to have on board of submarine for 90 days deployment.
In order to compare PRISM and .5FLSIP we compare two allowances, one is
.5FLSIP (“ALW” column) and PRISM (“MIX” column). The difference is presented in
the column “ALW-MIX”.
Costs were assigned to the results of comparisons and presented at the bottom of the
table. Check point was designed to give information about recommendation to increase
.5 FLSIP allowance in case if it is lower than PRISM allowance
*Note: See Chapter III for more information.
30

Slide 29
Simulation Process
PRISM ACPL .5FLSIP ACPL
Abstract: Definition of the Usage Rate distribution
Briefing Script:
This slide shows a beginning of the simulation by defining the distribution of the
given usage rate for a particular part. In order to define the distribution of the usage rate
we are highlighting the column DUSRT, which represent defined usage rate and click on
the “CELL” on the control panel. Then we choose “Define Assumption” from the pop-
up menu options.
31
Slide 30
Simulation Process
PRISM ACPL .5FLSIP ACPL
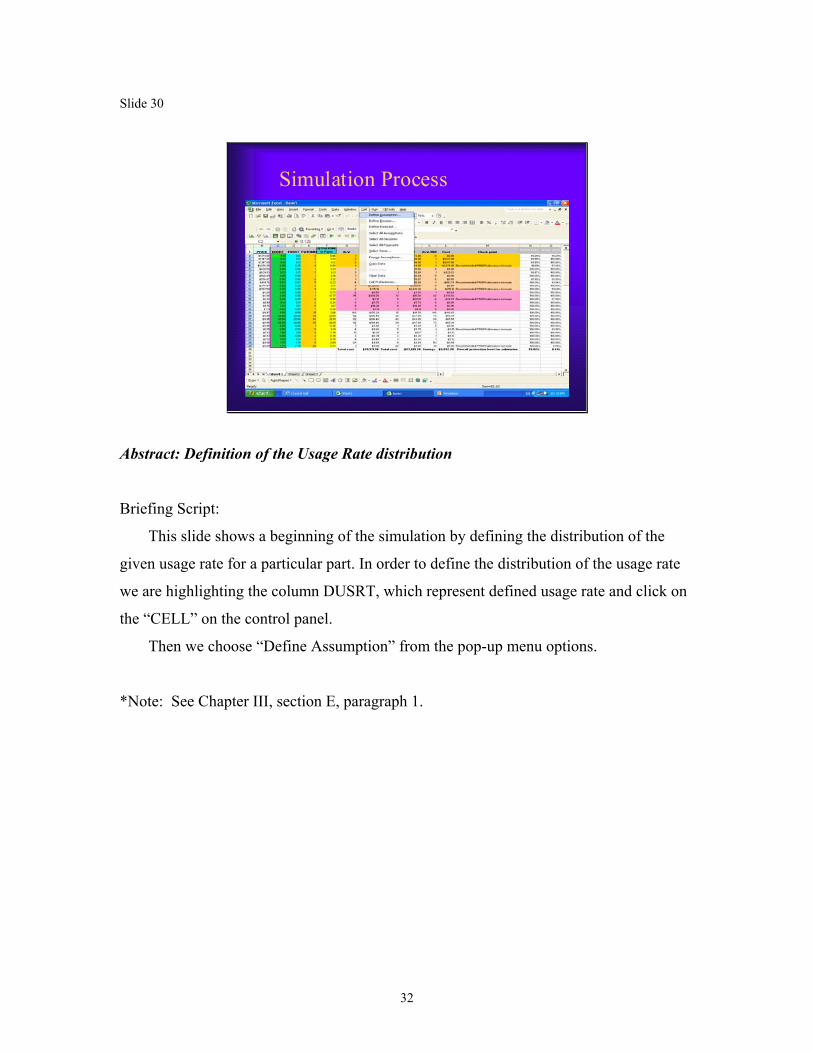
Abstract: Definition of the Usage Rate distribution
Briefing Script:
This slide shows a beginning of the simulation by defining the distribution of the
given usage rate for a particular part. In order to define the distribution of the usage rate
we are highlighting the column DUSRT, which represent defined usage rate and click on
the “CELL” on the control panel.
Then we choose “Define Assumption” from the pop-up menu options.
*Note: See Chapter III, section E, paragraph 1.
32

Slide 31
Simulation Process
PRISM ACPL .5FLSIP ACPL
Abstract: Choosing a Poisson distribution for usage rate
Briefing Script:
This slide represents a gallery function of the Crystal Ball, which allows us to choose
a distributing function for parts usage rate. We pick up Poisson distribution from the
gallery
*Note: See Chapter III for more information
33

Slide 32
Simulation Process
PRISM ACPL .5FLSIP ACPL
Abstract: Definition of the Poisson function
Briefing Script:
This slide shows a pop-up menu with options to define the mean (usage rate) for
Poisson distribution. Crystal ball automatically defines the mean for the Poisson
distribution based on the usage rate represented in the column “AT” of the Excel
spreadsheet.
34

Slide 33
Simulation Process
PRISM ACPL .5FLSIP ACPL
Abstract: Definition of the forecasted cell
Briefing Script:
This slide shows the process of defining the forecasted cell. In order to define the
forecasted usage rate we are highlighting the column “FUSRT”, which represent
forecasted usage rate and click on the “CELL” on the control panel. Then we choose
“Define Forecast” from the pop-up menu options.
35

Slide 34
Simulation Process
PRISM ACPL .5FLSIP ACPL
Abstract: Definition of the forecast name
Briefing Script:
This slide shows the definition of the name for our forecasted usage rate, which can
be automatically picked by the Crystal Ball.
36

Slide 35
Simulation Process
PRISM ACPL .5FLSIP ACPL
Abstract: Creating the simulation results column
Briefing Script:
This slide shows the formula in the formula bar that we have to put in the Excel
spreadsheet to retrieve the result of the simulation from the Crystal Ball and place it into
the spreadsheet.
*Note: See Chapter III for formula explanation.
37

Slide 36
Simulation Process
PRISM ACPL .5FLSIP ACPL
Abstract: Definition of the “MIX” column
Briefing Script:
This slide shows the format of the formula that was placed in the “MIX” column to
determine the best mix between simulated average demand and given quarterly average
demand.
*Note: See Chapter III for more information.
38
Slide 37
Simulation Process
PRISM ACPL .5FLSIP ACPL
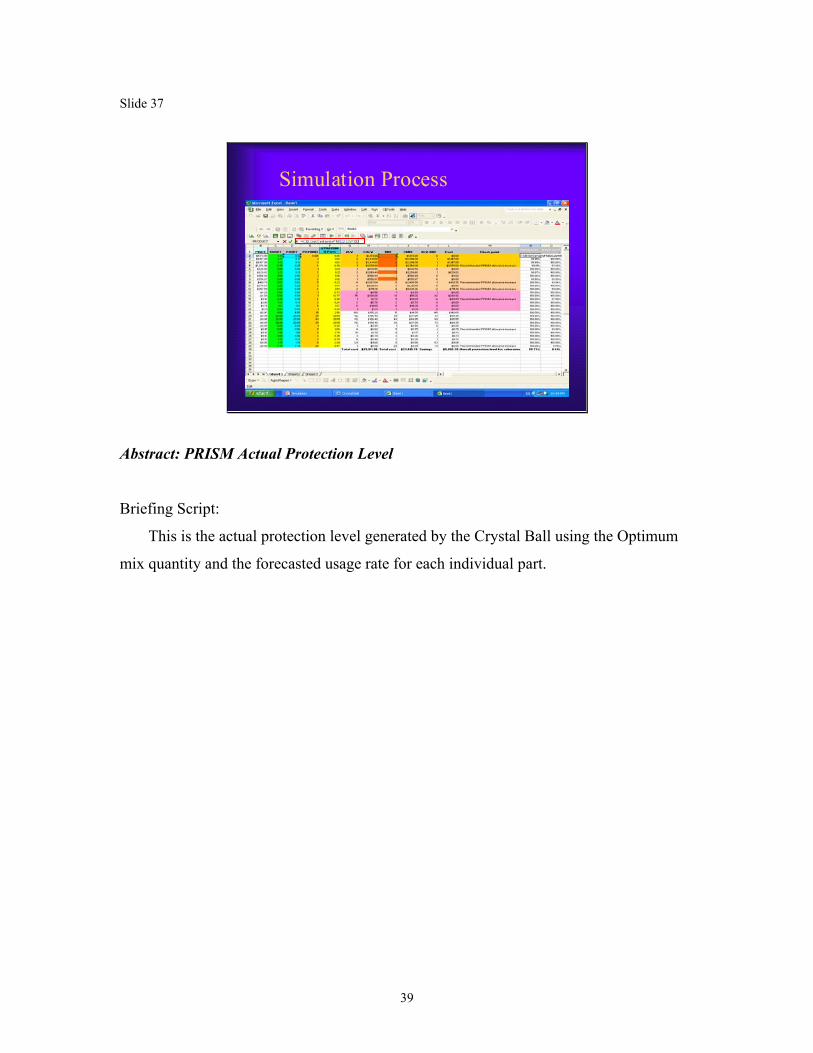
Abstract: PRISM Actual Protection Level
Briefing Script:
This is the actual protection level generated by the Crystal Ball using the Optimum
mix quantity and the forecasted usage rate for each individual part.
39

Slide 38
PRISM ACPL .5FLSIP ACPL
Simulation Process
Abstract: Overall Submarine Protection Level
Briefing Script:
Overall submarine protection level can be found by multiplying all individual
protection level percentages together.
40

Slide 39
Simulation Process
PRISM ACPL .5FLSIP ACPL
Abstract: .5FLSIP Actual Protection Level
Briefing Script:
This is the actual protection level generated by the Crystal Ball using the .5FLSIP
allowance quantity and the forecasted usage rate for each individual part.
41
Slide 40
Simulation Process
PRISM ACPL .5FLSIP ACPL
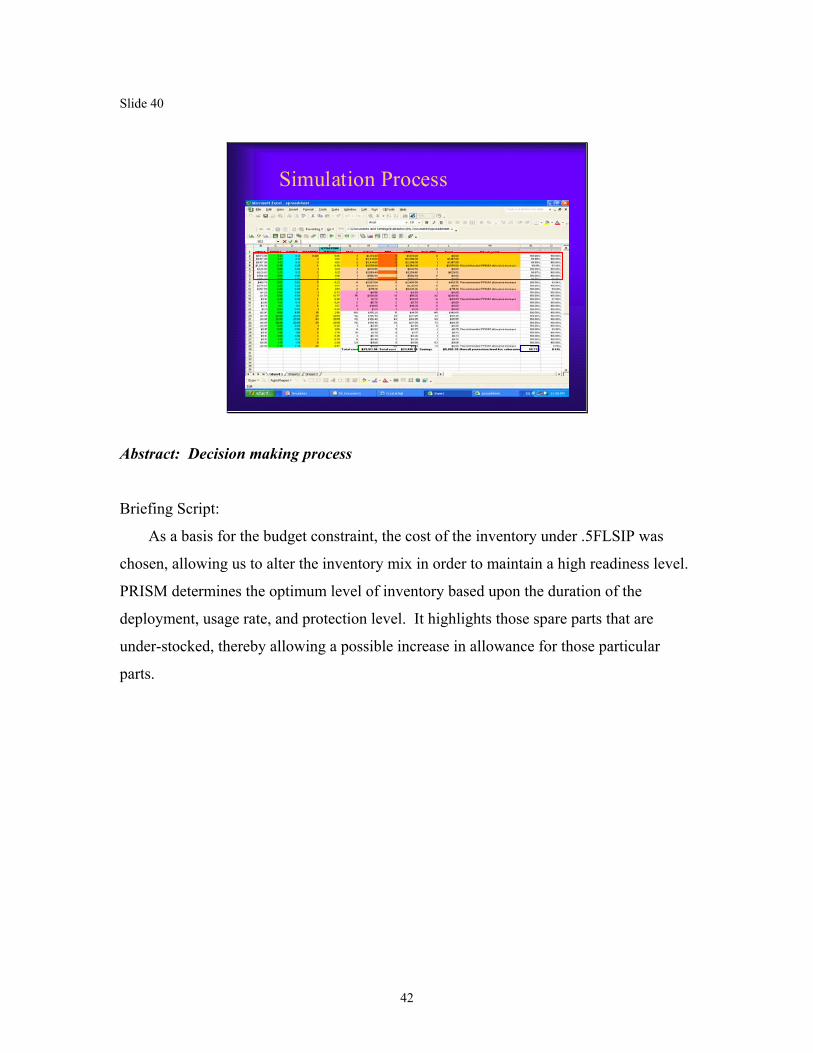
Abstract: Decision making process
Briefing Script:
As a basis for the budget constraint, the cost of the inventory under .5FLSIP was
chosen, allowing us to alter the inventory mix in order to maintain a high readiness level.
PRISM determines the optimum level of inventory based upon the duration of the
deployment, usage rate, and protection level. It highlights those spare parts that are
under-stocked, thereby allowing a possible increase in allowance for those particular
parts.
42
Slide 41
41
Simulation Results
$0.00
$10,000.00
$20,000.00
$30,000.00
$40,000.00
$50,000.00
$60,000.00
$70,000.00
.5FLSIPPRISM
.5FLSIP $29,511.90 $69,562.55 $54,498.55
PRISM $23,619.70 $45,375.24 $41,299.14
D-120 D-90 D-30 Average protection level:.5FLSIP = 67.03%PRISM = 99.67%
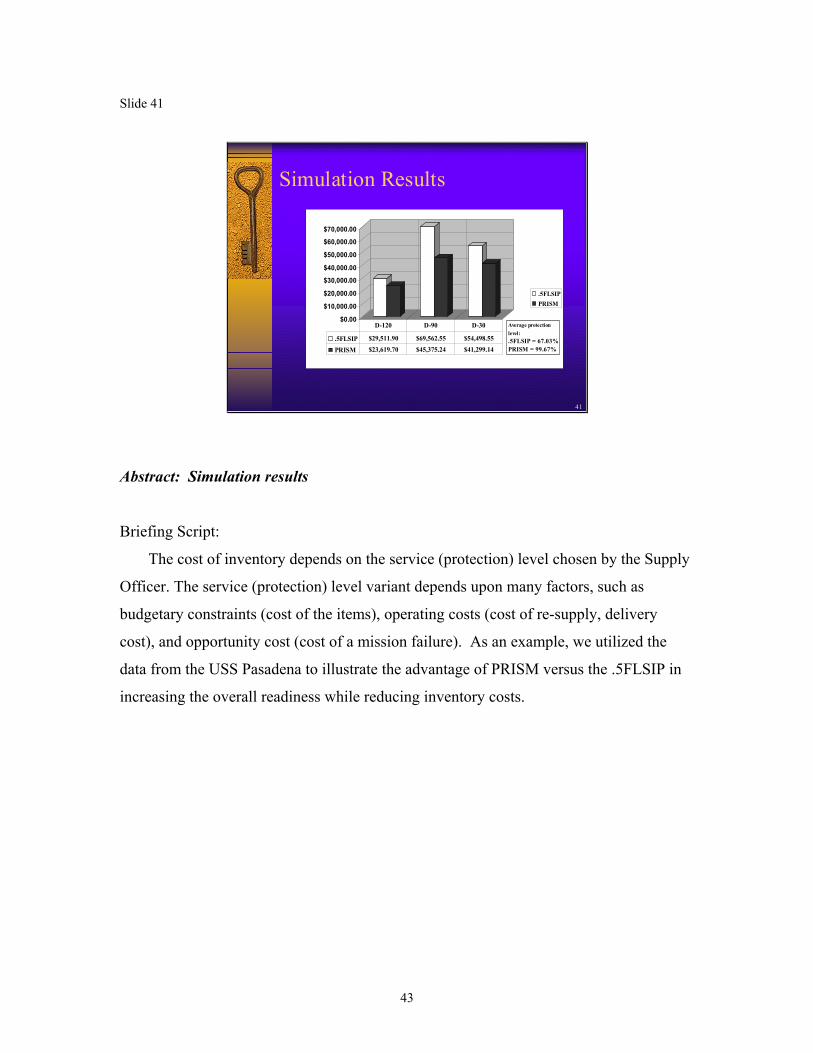
Abstract: Simulation results
Briefing Script:
The cost of inventory depends on the service (protection) level chosen by the Supply
Officer. The service (protection) level variant depends upon many factors, such as
budgetary constraints (cost of the items), operating costs (cost of re-supply, delivery
cost), and opportunity cost (cost of a mission failure). As an example, we utilized the
data from the USS Pasadena to illustrate the advantage of PRISM versus the .5FLSIP in
increasing the overall readiness while reducing inventory costs.
43

Slide 42
42
Simulation Results
$0.00
$10,000.00
$20,000.00
$30,000.00
$40,000.00
$50,000.00
$60,000.00
$70,000.00
$80,000.00
.5FLSIP cost of inventory on average $51,191.00 $19,332.32 $21,650.64 $67,509.96 $78,255.51
PRISM cost of inventory on average $36,764.69 $12,449.86 $15,417.74 $59,764.83 $66,093.11
Savings on average $14,426.31 $6,882.46 $6,232.90 $7,745.13 $12,162.40
USS PasadenaUSS Los Angeles
USS Olympia USS Columbia USS Chicago
Abstract: Simulation results
Briefing Script:
The results shown above is a comparison in inventory costs using both .5FLSIP and
PRISM allowances. The information used to determine the average cost of inventory was
provided by the CSP D-120/90/60/30 submarine data reports and separated between
.5FLSIP and PRISM. As a basis for the budget constraint, the cost of the inventory under
.5FLSIP was chosen, allowing us to alter the inventory mix in order to maintain a high
readiness level. PRISM determines the optimum level of inventory based upon the
duration of the deployment, usage rate, and service (protection) level.
*Note: See Chapter III
44

Slide 43
43
Recommendations and Conclusion
45

Slide 44
44
Alternatives1. Maintain the status quo by continuing to use CSP’s current
inventory management process.
2. Maintain the status quo while conducting further research with PRISM as a means to enhance operational readiness and cost savings.
3. Maintain the status quo while researching ways to improve upon .5FLSIP Plus and MESS.
4. Maintain the status quo while researching and developing a totally new logistics process.
Abstract: Alternatives to using PRISM.
Briefing Script:
Proper inventory management can impact submarine operational readiness as
significantly as proper training and personnel leadership. Introduction of new inventory
management tools demands careful development and consideration prior to replacing
current legacy systems. In light of the import associated with properly managing
submarine inventories, alternatives are offered to implementing PRISM as a standalone
product.
*Note: See Chapter IV, Section A, paragraphs 1-4.
46
Slide 45
45
Recommendations Recommendations
• Implementing PRISM versus the current CSP process
• Purchasing the site license for the Crystal Ball simulation program or similar modeling program to run the PRISM simulation
• Utilize the Poisson distribution tables as a secondary tool when a modeling program like Crystal ball is not available
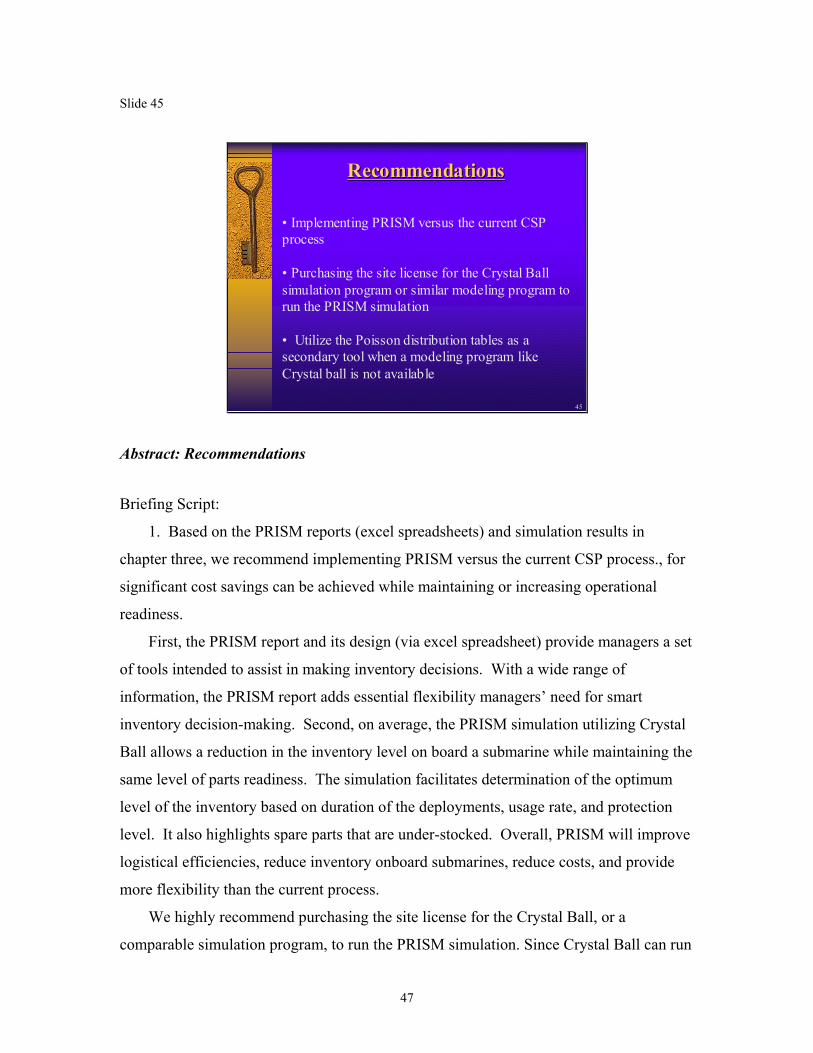
Abstract: Recommendations
Briefing Script:
1. Based on the PRISM reports (excel spreadsheets) and simulation results in
chapter three, we recommend implementing PRISM versus the current CSP process., for
significant cost savings can be achieved while maintaining or increasing operational
readiness.
First, the PRISM report and its design (via excel spreadsheet) provide managers a set
of tools intended to assist in making inventory decisions. With a wide range of
information, the PRISM report adds essential flexibility managers’ need for smart
inventory decision-making. Second, on average, the PRISM simulation utilizing Crystal
Ball allows a reduction in the inventory level on board a submarine while maintaining the
same level of parts readiness. The simulation facilitates determination of the optimum
level of the inventory based on duration of the deployments, usage rate, and protection
level. It also highlights spare parts that are under-stocked. Overall, PRISM will improve
logistical efficiencies, reduce inventory onboard submarines, reduce costs, and provide
more flexibility than the current process.
We highly recommend purchasing the site license for the Crystal Ball, or a
comparable simulation program, to run the PRISM simulation. Since Crystal Ball can run
47

a simulation model thousands of times, it is able to output a level of uncertainty around a
probability in a given problem.
We recommend using the Poisson distribution tables as a secondary tool when
Crystal ball is not available. The Poisson distribution tables achieve similar results;
however, the tables do not provide the accuracy of the Crystal Ball simulation, especially
after thousands of trial runs.
*Note: See Chapter IV, sections A, paragraphs 1-3.
48

Slide 46
46
♦ Follow-on research to apply these methodologies to an entire submarines Master Stock Status Listing
♦ Follow-on integration of PRISM database into the FOXPRO database to run automatically
♦ Follow-on research in applying PRISM to other warfare communities
Recommendations for Recommendations for Further ResearchFurther Research
Abstract: Recommendations for further research.
Briefing Script:
1. FLSIP provides stocking allowances for all repair parts onboard these
submarines. It is therefore feasible to acknowledge the possibility that PRISM could run
demand data against all repair parts assigned to a submarine. With usage rates provided
by each submarine, Crystal ball could set a new target allowance for each item onboard,
for each individual submarine, within the parameters set by CSP.
2. The equations and processes that enable us to predict allowances for a period of
time can be accomplished in a timelier manner by implementing this program into one of
the previously stated programs. Crystal ball works extremely well with Microsoft’s’
EXCEL spreadsheet program, and therefore can be created to tie in and run processes
automatically, eliminating the human interface portion.
3. This endeavor may take a significant amount of energy and resources, but
providing the other warfare communities with a better inventory management tool than
they currently possess will be time and money well spent.
*Note: See Chapter IV, section B, paragraphs 1-3.
49

Slide 47
47
Conclusion♦ Ongoing reviews of the Navy’s logistic processes and its
current stocking models are a must to help affect the military’s transformation to a more efficient and effective fighting force.
♦ The PRISM model is an effective way to better understand a ship’s true inventory requirement through real-time demand data.
♦ PRISM has optimized onboard inventory without experiencing stock out over 90 days, and, in most cases, reduced the inventory level onboard submarine thereby achieving cost savings.
Abstract: Summary slide
50

I. INTRODUCTION
A. PURPOSE
Since 11 September 2001, the United States (U.S.) Military has operated in an
extremely dynamic environment where combating asymmetric threats has strained
available resources; personnel end strength has decreased 1.03%1 over the past decade as
compared to an ever-increasing Operational Tempo (OPTEMPO) over the same period.
This dichotomy presents a quandary to the senior military leaders in terms of optimizing
resources to meet increasing global requirements. With a seemingly perpetual
engagement in the “War on Terrorism,” it is imperative senior military management
employ fiscal responsibilities in an effort to transform our forces to meet these new
challenges.
This professional report will describe the current inventory stocking tool used by
Commander Submarine Force U.S. Pacific Fleet (CSP) (Mission Essential Spares
Support (MESS)), introduce a proposed demand based inventory management tool,
Pacific Regional Inventory Stocking Model (PRISM), then compare the effectiveness of
the two options. Our objective is to determine which model, MESS or PRISM, more
efficiently optimizes inventory stocking levels precluding any negative resultants (e.g.
reduced readiness).
B. HISTORY
1. SSN Operations
On April 11th, 1900, the face of naval warfare was forever changed with the
delivery of the first ever British submarine built by John Holland. Considered
a Revolution in Military Affairs (RMA), the Holland VI submarine quickly
evolved as the weapon of choice throughout the 20th Century. Designed as a
multi-mission platform, and capable of operating in forward deployed theaters,
the Holland VI exercised U.S. policy, ultimately promoting our strength and
will. Roughly 54 years later, another RMA occurred with the commissioning of
the first nuclear powered submarine – U.S.S. Nautilus. Since the Nautilus,
1 Department of Defense, DoD Active Duty Military Personnel Strength Levels Fiscal Years 1950-2002, <http://web1.whs.osd.mil/mmid/military/ms9.pdf>, accessed 22 May, 2003.
51

many submarine variants have followed, helping ensure the freedom and
liberties we have grown accustomed to. Today, two distinct U.S. Navy
submarine platforms exist, the SSN and SSBN (with the SSGN on the horizon),
which are continuing the evolution and ensuring our countries sovereignty.
Developed from its roots, in 1954, with the launching of the Nautilus, the
SSN fleet has emerged as a naval platform of choice. The SSN (fast-attack
submarine) fleet consists of over 50 Los Angeles 688 class submarines, two
Seawolf class submarines and one special operations submarine. SSN
submarine mission profiles include anti-submarine and surface warfare,
intelligence gathering, battle group escort, mining, cruise missile operations,
special operations, and rescue/humanitarian operations.
The diversity in SSN mission profiles makes it very difficult to identify a
single standard for operations. The OPTEMPO of an SSN traditionally consists
of one six-month deployment every twenty-four months. In some cases the six
month deployment is split into two three month theater deployments. The
eighteen month turn-around period between deployments consists of one week
to several months of operations composed of exercises, contingency operations,
training and diplomatic missions in addition to those listed above.
Additionally, the SSN will undergo an extended maintenance period call
Submarine Refit Availability (SRA) during which major systems are repaired,
replaced or updated. Approximately six months to a year before an SSN
extended deployment, the ship will commence a work up, otherwise known as
an extended training period, in which the crew and ship prepares and qualifies
for the upcoming operations.
2. SSN Logistics Process
During a period of fiscal constraints and world events requiring U.S.
participation in multiple theaters, it becomes increasingly necessary to
maximize operational readiness with minimum negative logistical impacts. To
achieve this, logistical support must identify the most effective product mix in
terms of parts, maintenance schedules and system repairs, to prepare a
submarine for both short and long term deployments. Logistics must be highly
52

congruent with all systems to ensure it does not become a bottleneck within the
critical path of the submarines effectiveness. In other words, failing to
properly outfit a submarine, prior to deployment, could jeopardize critical
missions and ship safety. This, perhaps, might be due to system failures where
the submarine may not be correctly equipped to perform necessary repairs,
requiring the boat to pull off station. Therefore, a need to properly prepare the
submarine, in terms of stocking high demand parts prior to deployment, exists.
The following section will identify the historical approach to the ongoing saga
of the submarine logistical problem.
C. BACKGROUND
1. FLSIP Inventory Control System
The Navy’s submarine fleet uses the Naval Inventory Control Points
(NAVICP) Fleet Logistics Supply Improvement Program (FLSIP) inventory
control system, which is based on the Coordinated Shipboard Allowance List
(COSAL). The COSAL is that portion of the spare and repair parts inventory that is
maintained onboard a ship or submarine and is sometimes referred to as onboard repair
parts (OBRP).2 The FLSIP inventory control system is based on the following
equation:
Usage Rate = (Population * Best Replacement Factor)/f
Here, “Population” is the number of times (frequency) a particular repair
component or like item is installed in any onboard system (e.g., a periscope).
The “Best Replacement Factor” (BRF) is an exponentially smoothed, annually
forecasted replacement rate. BRF is based on both the initial failure rate data
which is provided by the contractor, and the annual component failure updates
(using historical demand data) collected through the Material Maintenance
Management (3M) system for individual components.3 Finally, the constant “f”
represents the current FLSIP model measurement of part failures observed over
2 Naval Supply Systems Command, NAVSUP PUB 485, ch. 4, p. 38, 2000.
53

the relevant period. The 3M system is a collection of monthly demand rates per
submarine of requested repair parts used during the month.4
a. .5FLSIP Plus
The “.5FLSIP Plus” model, an iteration of the FLSIP stocking model, is
currently used for the non-steam and electric, hull, mechanical and electrical parts (i.e.,
non-propulsion plant related parts which are hull, mechanical or electrical in nature) for
the SSN-688 Los Angeles Class submarines. Once an allowance objective was
established by FLSIP, any allowance candidate whose usage rate (UR) failed the .5FLSIP
threshold criterion (one failure in two years) was deleted from the initial stocking
inventory. In the .5FLSIP model, a part qualifying as a demand-based allowance item
(item depth to satisfy 90 percent of demand over a 90-day period) must have an expected
usage greater than once per quarter. Items with less than this expected usage but greater
than once every two years qualify as insurance items for mission vital systems/parts and
are stocked at a depth of one replacement unit. An insurance item is an essential item for
which no failure is predicted through normal usage, but, if failure is expected or loss
occurs through an accident, abnormal equipment/system failure or other unexpected
occurrences, lack of an immediately available replacement would seriously hamper the
operational capability of the weapon system. The “Plus” term refers to additional parts
that are added based on casualty reports (CASREP) or 3M usage data or technical
overrides.
b. MESS
Circa 1999, the PACFLT submarine supply management was the .5FLSIP
program with an embedded node called the Mission Essential Spares Support (MESS)
program. The MESS pre-deployment program utilized the FLSIP inventory
control system used by both ships and submarines within the United States
Navy. In total, these programs analyzed approximately eight critical submarine systems:
fire control, sonar, periscopes, reactor, torpedo tubes, ballast control systems, electronic
surveillance, and radio systems, which were identified by an Allowance Parts List (APL).
The purpose of running the MESS program was to ensure a deploying submarine would
4 Chief of Naval Operations, OPNAVINST 4790.4C, http://www.spear.navy.mil/3-M/.
54
have 100% parts support onboard for these critical systems prior to deployment. The
MESS program was run and analyzed only once prior to deployment (to verify stocking
levels at 100%) at the D–120 date. Once these parts were identified, the remainder of the
days prior to deployment day was spent expediting them to the submarine for stocking.5
2. AVCAL
The aviation supply community uses an inventory control system called Aviation
Coordinated Allowance List (AVCAL) to manage stocking levels for their respective
aircraft. The AVCAL represents items that are required to maintain support of an Air
Wing and its squadrons, again, based upon the FLSIP model. The AVCAL is a specific
allowance of repairable items, subassemblies and repair parts which are required for
support of the assigned aircraft. It is tailored in accordance with the maintenance profile
of any big deck (e.g. LHD and CVN), and is designed to ensure maximum support
effectiveness in a combat environment for a period of 90 days.
In comparison, where COSALs .5FLSIP Plus model uses an algorithm to determine a
change in a submarine’s inventory level, any additions to the AVCAL model incorporates
consumer level requirements that are in agreement with the approved maintenance plan.
The AVCAL process takes into account not only the particular ship’s usage and demand
data, but also the usage and demand data of like ships with the same type and number of
aircraft (e.g. LHD versus LHD, CVN versus CVN). The deciding factor for a change in
the quantity of repair components comes from the combination of an aviation repair
component usage database and interaction with the supply manager. In reviewing
additions to the AVCAL, the Navy’s demand based model computes spare parts
requirements one component at a time without regard to aircraft readiness or inventory
cost. In other words, AVCAL’s changes are based primarily upon raw demand data
submitted by the various squadrons.6
D. COMMANDER SUBMARINE FORCE U.S. PACIFIC FLEET CURRENT EXPEDITING MANAGEMENT PROCESS In 1999, CSP terminated the MESS node, desiring a different, more functional
program to replace it. The follow on program would be capable of analyzing all systems
and parts onboard a submarine versus only selected eight, mission critical items (MESS). 5 Commander Submarine Force U.S. Pacific Fleet, CSPINST 4406.1E, Submarine Supply Procedures Manual. 6 Ibid., 4-44.
55

The emergent program was to be a merger of two inventory control stocking theories , the
AVCAL stocking theory and the current .5FLSIP Plus. This merger would take
AVCAL’s real time demand data theory and compare it to the .5FLSIP Plus stocking
model data, depositing the resultant submarine usage rate into a FOXPRO database
management system. This combinatory effect created a modified, all encompassing
version of the old MESS. This process has since been utilized as an expediting tool in
order to highlight high demanded items to be brought onboard prior to deployment day.
Four months prior to deployment (D-120), a submarine supply officer runs an
outstanding requisition listing, identifying all repair components required by .5FLSIP
Plus that are below the .5FLSIP allowance or the Selected Item Management (SIM)
demand based high limit. After submission of the outstanding requisition reorder into the
supply system, this listing is also submitted to CSP by the submarine which is then
processed directly into the CSP FOXPRO database. This database houses a full two years
worth of demand of repair parts from like platforms. i.e.: 688 Los Angeles class fast
attack submarines from the Pacific Fleet. This compilation of data is drawn down from
the Navy’s 3M database system which collects monthly demand data from all
submarines. The FOXPRO database then compares the submarines reorder listing against
the demand of all submarines in the Pacific Fleet.7
The output derived from FOXPRO is in EXCEL spreadsheet format and compares
demand data of the resident submarine against all like CSP SSN-688’s. This tool utilizes
two input variables, CSP Demand (CSPDMD) and a resident boats on-hand quantity
(OHQTY), to determine the status of repair parts stock. CSP has deemed a CSPDMD of
ten or greater (≥ 10) as their measure, since any repair part that meets this criteria in
addition to an allowance (ALW)8 of zero is considered a high priority (HI-PRI)
requisition. In other words, these items have a high demand usage rate without any
required safety stock onboard. Upon identification and labeled HI-PRI, these requisitions
will then be upgraded to the highest priority factor allowable by the supply system for a
deploying SSN, priority 02 (PRI 02). Working in unison, the submarine supply officer,
his immediate superior in command (ISIC), and the NAVICP will ensure all identified
7 Adam Black, FOXPRO Database Information, interview by Kurt Chivers, CSP Pearl Harbor, HI, March 31, 2003. 8 ALW numbers are based upon the .5FLSIP model generated by NAVICP.
56

HI-PRI items are onboard prior to deployment day (D-0). Executed at four specific
periodicities (D-120, D-90, D-60, D-30), this program identifies the requisite outstanding
repair parts causing a supply re-order signal to be sent. At D-30, the submarine stops
issuing repair components from its own onboard stock, in order to preserve their levels,
and embarks on a free issue stocking program, where inter-ship transfers from non-
deploying subs occurs.9
9 George Aoki, Repair Part Re-issuing Procedures Post D-30, interview by Kurt Chivers, CSP Pearl Harbor, HI, March 31, 2003.
57

THIS PAGE INTENTIONALLY LEFT BLANK
58
II. PRISM DEVELOPMENT
A. OVERVIEW
Validation of PRISM will be conducted using baseline data provided by CSP Supply
in the form of a MESS report. Information in the MESS report will be sorted and
augmented to incorporate parts usage rate (based on individual ship), fleet demand rates
(based on two year data for individual parts), and comparisons between ship stocking
levels and demand levels. All augmentations will be conducted in the format of the
original MESS report (Microsoft Excel) for each CSP submarine across each of its four
pre-deployment requisition periods. Once augmented, the resultant report provides the
PRISM dataset. After the PRISM dataset is constructed two separate models will be built
to provide an analysis of optimal stocking levels and the effect on operational readiness
and savings. The final PRISM product is a basic database that is constructed as a tool to
assist managers (ship, squadron and fleet) in making inventory stocking decisions.
B. ORIGINAL MESS REPORT
As discussed in chapter one, the CSP MESS report utilizes two years of demand data
maintained in a FOXPRO database. Recall, MESS is an enhanced inventory requisition
expediting tool that analyzes captured demand data from the CSP Los Angeles class
submarine community (SSN-688), and compares it to the combined yearly average
demand data for a single CSP SSN repair components allowance. Figure 1 below
provides an overview of the MESS spreadsheet and includes descriptions of each column.
The following information provides details used in assessing CSP’s MESS.
Four months prior to a submarine deployment (D-120), the supply officer runs his
outstanding requisition listing. This is a listing of all repair components required by
.5FLSIP Plus that are below the high limit and need reordering. A copy of this listing is
aggregated into CSP’s FOXPRO database, where comparisons are made, and critical
repair components are highlighted by MESS. The FOXPRO database houses two years
worth of all CSP SSN 688 repair part demands. Essentially, the FOXPRO database
output (MESS report) compares an individual submarine’s reorder listing against the
demand of all submarines in the Pacific Fleet.
59
The MESS report is initially sorted and used as follows to identify high demand parts
relative to individual ship stock levels. First, the report is sorted by CSPDMD, in
descending order, and then again by the ships OHQTY, this in ascending order. This
report can be quite long, so the report cutoff is taken at those parts that have a CSPDMD
of 10 or greater, and serves as the report cutoff point.
Once the data is sorted, a final MESS report is produced which is then used as a
requisition expediting tool. The report is useful in its current form, providing valuable
static information to inventory managers. However, usefulness of the data contained in
the MESS report can be further enhance by manipulating and augmenting the data in a
manner that allows managers to identify key decision variables. The next section
discusses how the PRISM report data is manipulated and augmented to produce such a
management tool.
60

61
C. PRISM REPORT
The PRISM report continues to build upon MESS data provided by CSP,
and provides the backbone for constructing the models used in the validation
and analysis portions of this report. The basic PRISM report is comprised of
Figure 1: MESS/PRISM – Section 1 RI COG NIIN QTY UIC JD SERI SUF SUPADR
RI = Routing Identifier, a code of who is going to receive the requisition COG = Cognizant Manager, a code of who owns the material and stocks it NIIN = National Identification Item Number includes the NSN (Nat’l Stock Number) UIC = Unit Identification Code Each ship/sub in the US military has this ID’ing them JD = Julian date SERI = Serial number which is assigned to a requisition *Note: that the UIC, JD, and SERI make up the requisition number. SUF = Suffix code, used to distinguish separate supply actions under a single document. They are assigned by activities processing MILSTRIP/MILSTRAP transactions. SUPADR = Supplementary Address usually assigned by the ship to identify where the part is to be stored FC PRJ PRICE STATLINE LCAV
FC = Fund Code used for financial reporting, indicating what whether the part is a repairable, consumable, medical, etc. PRJ = Project code, identifies requisitions, shipments, and related documentation to special projects, operations, exercises, and maneuvers STATLINE = Status line, lists the latest status of the part LCAV = Logistics Customer Asset Visibility provides visibility of material receipt and delivery information to fleet customers, improves the Navy’s Stock in Transit tracking process, end records, and reports on logistics report time
SHIPDMD SHIP2YRAVDMD
reqns SHIPUSRT
PARTS/QTR SHIPQTY CSPDMDAV2YRDMD
reqns QTRAVDMD
Parts CSPQTY
SHIPDMD = Total ship demand data, the number of times ordered SHIP2YRAVDMD reqns = Ship average parts per requisition (based on two years data) (PRISM) SHIPUSRT PARTS/QTR = Ship use rate for specific part (90 day period) (PRISM) SHIPQTY = Total ship qty ordered for total of all demands CSPDMD = COMSUBPAC Demand for all subs in PACFLT, the total number of times ordered AV2YRDMD reqns = Average parts per requisition at CSP level (based on two years data) (PRISM) QTRAVDMD Parts = Average number of parts demanded per ship in CSP (based on two years data) (PRISM) CSPQTY = CSP total qty ordered for all fleet submarine (total demand)
APL EFD COSAL SIM ALW OHQTY APL = Allowance parts list, a number given to each piece of equipment onboard a ship EFD = Equipment Functional Description COSAL = Coordinated Shipboard Allowance List (HM&E = Hull, Maintenance, and Electrical, Q = Nuclear) for our reports, its all HM&E, designated H SIM = Selected Item Management; the R-supply computer will manage fast moving items, and if a part has 2 hits within 6 months, it qualifies for SIM, and gets its own High/Low limit. The part will only need to have one hit within 12 months to remain a “SIM” item. ALW = Allowance, the FLSIP computed quantity that is stocked onboard OHQTY = On-hand Quantity, the actually quantity that is currently onboard the sub
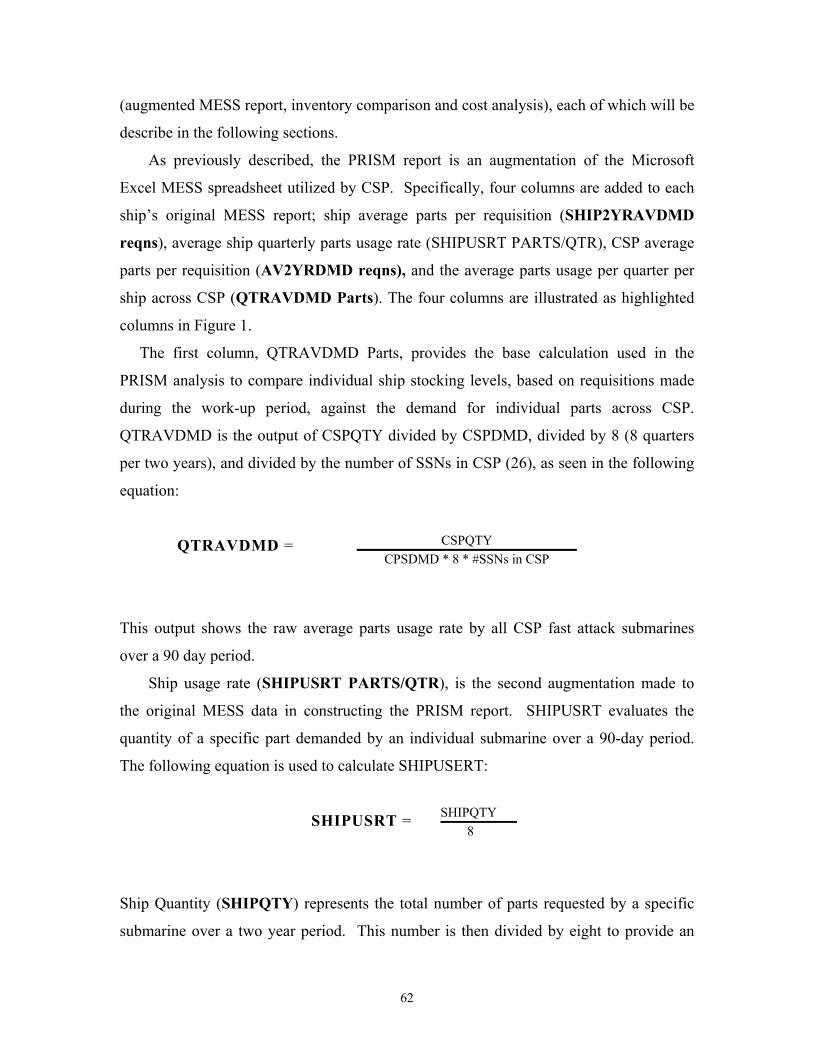
(augmented MESS report, inventory comparison and cost analysis), each of which will be
describe in the following sections.
As previously described, the PRISM report is an augmentation of the Microsoft
Excel MESS spreadsheet utilized by CSP. Specifically, four columns are added to each
ship’s original MESS report; ship average parts per requisition (SHIP2YRAVDMD
reqns), average ship quarterly parts usage rate (SHIPUSRT PARTS/QTR), CSP average
parts per requisition (AV2YRDMD reqns), and the average parts usage per quarter per
ship across CSP (QTRAVDMD Parts). The four columns are illustrated as highlighted
columns in Figure 1.
The first column, QTRAVDMD Parts, provides the base calculation used in the
PRISM analysis to compare individual ship stocking levels, based on requisitions made
during the work-up period, against the demand for individual parts across CSP.
QTRAVDMD is the output of CSPQTY divided by CSPDMD, divided by 8 (8 quarters
per two years), and divided by the number of SSNs in CSP (26), as seen in the following
equation:
CSPQTY
CPSDMD * 8 * #SSNs in CSP QTRAVDMD =
This output shows the raw average parts usage rate by all CSP fast attack submarines
over a 90 day period.
Ship usage rate (SHIPUSRT PARTS/QTR), is the second augmentation made to
the original MESS data in constructing the PRISM report. SHIPUSRT evaluates the
quantity of a specific part demanded by an individual submarine over a 90-day period.
The following equation is used to calculate SHIPUSERT:
SHIPQTY 8
SHIPUSRT =
Ship Quantity (SHIPQTY) represents the total number of parts requested by a specific
submarine over a two year period. This number is then divided by eight to provide an
62
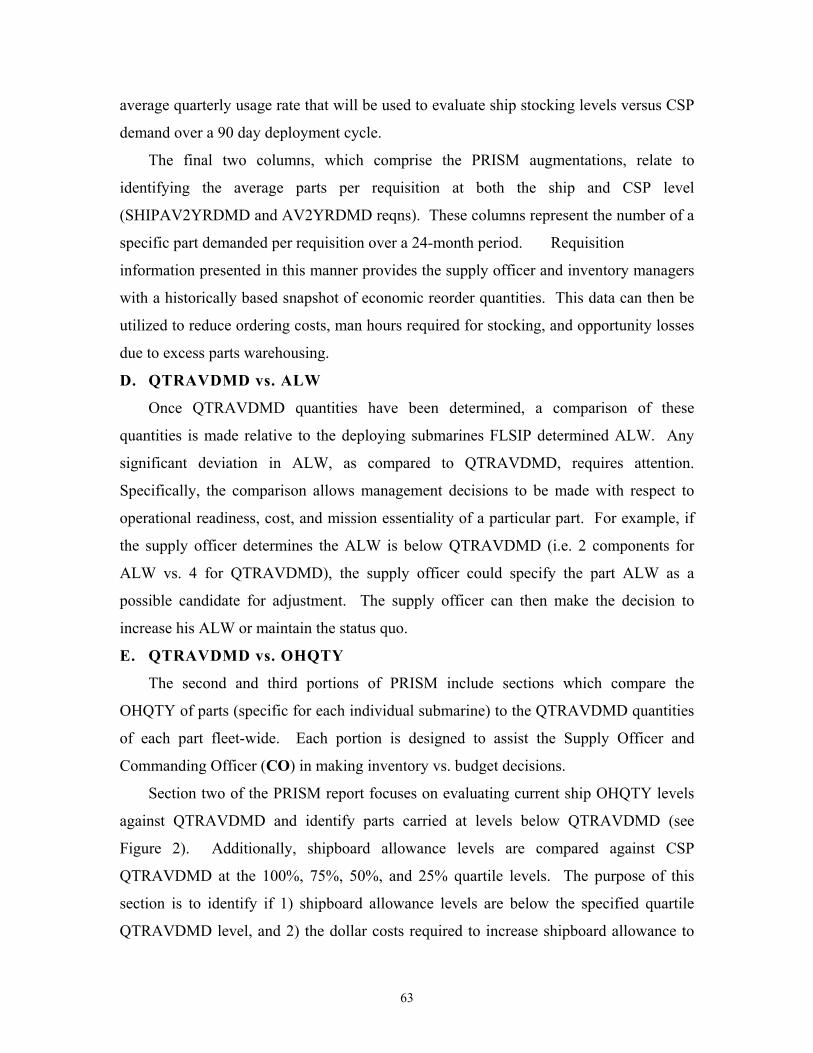
average quarterly usage rate that will be used to evaluate ship stocking levels versus CSP
demand over a 90 day deployment cycle.
The final two columns, which comprise the PRISM augmentations, relate to
identifying the average parts per requisition at both the ship and CSP level
(SHIPAV2YRDMD and AV2YRDMD reqns). These columns represent the number of a
specific part demanded per requisition over a 24-month period. Requisition
information presented in this manner provides the supply officer and inventory managers
with a historically based snapshot of economic reorder quantities. This data can then be
utilized to reduce ordering costs, man hours required for stocking, and opportunity losses
due to excess parts warehousing.
D. QTRAVDMD vs. ALW
Once QTRAVDMD quantities have been determined, a comparison of these
quantities is made relative to the deploying submarines FLSIP determined ALW. Any
significant deviation in ALW, as compared to QTRAVDMD, requires attention.
Specifically, the comparison allows management decisions to be made with respect to
operational readiness, cost, and mission essentiality of a particular part. For example, if
the supply officer determines the ALW is below QTRAVDMD (i.e. 2 components for
ALW vs. 4 for QTRAVDMD), the supply officer could specify the part ALW as a
possible candidate for adjustment. The supply officer can then make the decision to
increase his ALW or maintain the status quo.
E. QTRAVDMD vs. OHQTY
The second and third portions of PRISM include sections which compare the
OHQTY of parts (specific for each individual submarine) to the QTRAVDMD quantities
of each part fleet-wide. Each portion is designed to assist the Supply Officer and
Commanding Officer (CO) in making inventory vs. budget decisions.
Section two of the PRISM report focuses on evaluating current ship OHQTY levels
against QTRAVDMD and identify parts carried at levels below QTRAVDMD (see
Figure 2). Additionally, shipboard allowance levels are compared against CSP
QTRAVDMD at the 100%, 75%, 50%, and 25% quartile levels. The purpose of this
section is to identify if 1) shipboard allowance levels are below the specified quartile
QTRAVDMD level, and 2) the dollar costs required to increase shipboard allowance to
63

the evaluated level. Following the itemized evaluation of each part in section two, values
are aggregated and reported for the dollar costs for adjusting allowances to specified
levels, and a count of the items which are carried onboard at an allowance level below a
particular QTRAVDMD quartile.
Figure 2: PRISM – Section 2
BAL = Displays “OK” if OHQTY greater than QTRAVDMD ALW<X%( QTRAVDMD) = Yes! or no if shipboard ALW is < specified quartile level of QTRAVDMD as listed in column label Add’l Costs = The dollar amount required to purchase required parts to raise allowance to specified quartile level of QTRAVDMD
Section three of the PRISM report compares QTRAVDMD levels for each stocked
part against the OHQTY maintained on-board the individual SSN at the time of the
requisition report (see Figure 3). This section provides a report of the percentage amount
the OHQTY varies from QTRAVDMD at evaluated quartile levels. Additionally, section
three provides dollar savings and the associated inventory adjustments required to
achieve a stocking level matching CSP observed demand at each quartile level.
The PRISM report provides managers, shipboard and shore side, a set of tools
designed to assist in making inventory decisions. By weighing parts requisition requests
against real-time demand data (represented by QTRAVDMD and SHIPUSRT), managers
are empowered to make informed parts stocking decisions. Managers can submit
requisitions with operational readiness, budgetary, and opportunity cost considerations
fully visible.
64

The PRISM design enhances flexibility, providing managers with a range of
information designed to assist with inventory decision-making. Specifically, it provides
decision makers the ability to tie parts requisitions to mission criticality. Additionally,
individual managers are provided information allowing them to tailor requisitions based
on their confidence levels through the inclusion of several stocking level options
(represented by QTRAVDMD quartile levels). The report presents information
snapshots on the status of shipboard inventory overstock/understocks when evaluating
ship readiness for pending deployment periods. Finally, as seen in the following sections,
PRISM provides a backbone for the creation of robust models which can evaluate real-
time demand data, inventory stock levels, and their effect on operational
readiness.
Figure 3: PRISM – Section 3
% Overstock = Percentage OHQTY exceeds the 24 month CSP AVYRDMD quantity X%Savings = Dollar amount of savings if OHQTY reduced to specified quartile level of QTRAVDMD; Aggregate total listed at bottom of each respective column QtyDec = The unit quantity of each part reduced to achieve evaluated quartile level of QTRAVDMD
65

THIS PAGE INTENTIONALLY LEFT BLANK
66

III. PRISM VALIDATION AND INVENTORY SIMULATION
As identified in the problem statement, a requirement has been identified to include
real time demand in order to adequately predict the stocking level necessary to maximize
the operational readiness over a 90-day deployment period.
A. PURPOSE OF SIMULATION
The comparison of PRISM as an inventory management tool versus MESS and the .5
FLSIP determined levels was accomplished by using the Crystal Ball® simulation
program. The purpose of the simulations are to determine how many individual repair
parts, deemed mission critical based upon high demand, are required by a submarine in
order to stay on patrol for 90 days without experiencing a stock out.
The results of the simulations were utilized to determine which management tool
contains a more efficient inventory level.
B. SIMULATION SOFTWARE PACKAGE
Crystal Ball® 2000 Standard is an easy-to-use simulation program that assists in
analyzing the risks and uncertainties associated with Microsoft® Excel spreadsheet
models10. The Crystal Ball® software was chosen for several reasons:
• It allows the incorporation of all assumptions made for simulation purposes
• It can be utilized with Microsoft Excel, which is an IT-2111 standard for all U.S.
governmental agencies, as an embedded tool package
• It allows multiple replications as needed to avoid randomness
• It incorporates a confidence level for data sensitivity analysis
• It provides a means of analyzing data by utilizing dissimilar distributions
exclusive of the probability distribution functions.
C. ASSUMPTIONS
The following assumptions represent the foundation for the design, execution, and
analysis of the simulations associated with this project:
1.
The simulation was prepared for mission critical spare parts with a demand of 10
or greater and a current zero on-hand inventory quantity.12
10 http://www.crystalball.com/crystal_ball/index.html, May 15, 2003 11 INFORMATION TECHNOLOGY FOR THE 21ST CENTURY, GENADMIN/CMC WASHINGTON DC, DTG 061900Z APR 98.
67

2.
3.
4.
5.
The maximum submarine deployment cycle is ninety days without a re-supply.
A period of ninety days was chosen based upon historical information provided
by CSP Supply Department and is chosen for the worse case scenario application.
Within the context of the Crystal Ball® software, assumptions represent the
probability distributions utilized in creating and analyzing simulations. Because
individual part failures are random in nature and difficult to predict, the Poisson
distribution was chosen as the baseline assumption. This distribution involves
counting the number of times a random event occurs during a fixed time period;
i.e., distance, area, etc. For the purpose of this analysis the mean used in the
Poisson distribution equates to usage rate for a particular part over the evaluated
period.
To estimate the desired inventory level, a minimum protection level of 99.99%
was set for each repair part as one input variable for Crystal Ball® simulation.
All spare parts are considered independent of one other, equally mission critical,
and non-repairable onboard the submarine.
D. POISSON DISTRIBUTION
The Poisson distribution is a one–parameter, discrete distribution that takes into
account non-negative integer values. The parameter, , is both the mean and the variance
of the distribution.
The distribution mass function for Poisson distribution is:
λλ −= ex
yx
!, where λ , is the sample mean, and x = 0,1,2,3…
Graphically, the Poisson distribution, with λ as the sample mean, can be presented as:
12 Mission critical spare parts are defined as those parts that, if failure should occur, would cause a submarine to come off-station in the event of an inventory stockout.
68

x
Figure 4y
This service (protection) level can be varied based upon the decision made by a Supply
Officer assigned to a particular submarine. The distribution of cost vs. protection level is
generally illustrated in Figure 5. The inventory cost exponentially increases as the
protection level approaches 1.
Figure 5
Inventory cost
1
Protection Level
E. CRYSTAL BALL® SIMULATION
1. Simulation Description
The following section describes the process and design of the simulation used to
evaluate demand data applicability for inventory stocking decisions. As discussed, the
Crystal Ball® simulation add-on to Microsoft Excel was used to run the stocking
simulations. Figure 6 below describes the columns and the functions present in each
spreadsheet, as they apply to the simulation. Simulations are run for each individual
submarine during respective workup requisition reviews. The simulation data and
assumptions are further augmentations of the original MESS reports, and use the
previously described PRISM datasets (see Chapter II).
69
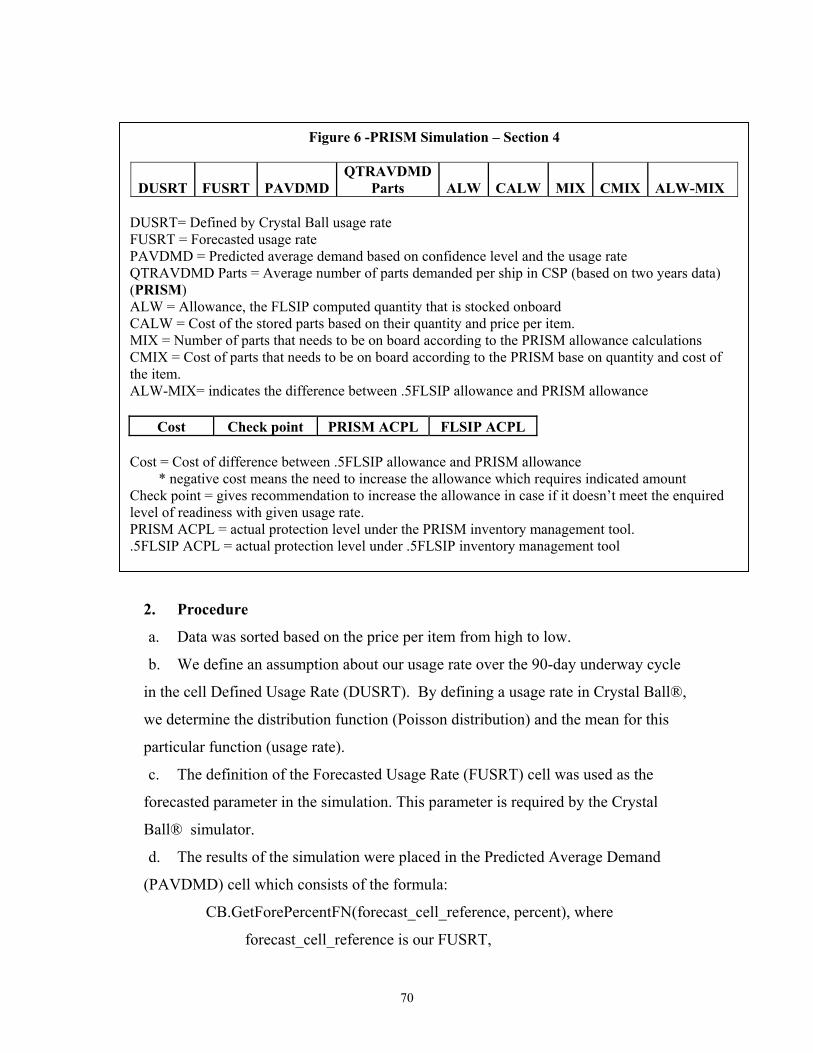
DUSRT FUSRT PAVD DUSRT= Defined by CrystalFUSRT = Forecasted usage rPAVDMD = Predicted averaQTRAVDMD Parts = Averag(PRISM) ALW = Allowance, the FLSICALW = Cost of the stored pMIX = Number of parts that nCMIX = Cost of parts that nethe item. ALW-MIX= indicates the dif
Cost Check point Cost = Cost of difference bet * negative cost means thCheck point = gives recommelevel of readiness with given PRISM ACPL = actual protec.5FLSIP ACPL = actual prote
2. Procedure
a. Data was sorted bas
b. We define an assum
in the cell Defined Usage
we determine the distribu
particular function (usag
c. The definition of th
forecasted parameter in t
Ball® simulator.
d. The results of the si
(PAVDMD) cell which c
CB.GetForePe
forecast_
Figure 6 -PRISM Simulation – Section 4
MDQTRAVDMD
Parts ALW CALW MIX CMIX ALW-MIX
Ball usage rate ate ge demand based on confidence level and the usage rate e number of parts demanded per ship in CSP (based on two years data)
P computed quantity that is stocked onboard arts based on their quantity and price per item. eeds to be on board according to the PRISM allowance calculations
eds to be on board according to the PRISM base on quantity and cost of
ference between .5FLSIP allowance and PRISM allowance
PRISM ACPL FLSIP ACPL
ween .5FLSIP allowance and PRISM allowance e need to increase the allowance which requires indicated amount ndation to increase the allowance in case if it doesn’t meet the enquired
usage rate. tion level under the PRISM inventory management tool. ction level under .5FLSIP inventory management tool
ed on the price per item from high to low.
ption about our usage rate over the 90-day underway cycle
Rate (DUSRT). By defining a usage rate in Crystal Ball®,
tion function (Poisson distribution) and the mean for this
e rate).
e Forecasted Usage Rate (FUSRT) cell was used as the
he simulation. This parameter is required by the Crystal
mulation were placed in the Predicted Average Demand
onsists of the formula:
rcentFN(forecast_cell_reference, percent), where
cell_reference is our FUSRT,
70

percent represents a minimum desired protection level
e. Cell QTRAVDMD gives us information about average quarterly demand for a
particular spare part for all SSN-688 class submarines in the Pacific Fleet.
QTRAVDMD was then compared with the Predicted Average Demand (PAVDMD)
for a 90 day underway cycle. The result was made on the assumption that if the
simulated PAVDMD was larger than QTRAVDMD, we used simulated PAVDMD,
otherwise QTRAVDMD was utilized. The reason for choosing the larger of the two
numbers is based upon maintaining the desired level of readiness.
f. The resultant comparison of the larger value of QTRAVDMD and PAVDMD
was put in the cell named MIX. We believe that MIX is an optimal level of inventory
that should be on board a submarine to maintain 99.99% protection level in our
simulation. However, we assumed that the FLSIP cost of inventory was a budget
constraint for the PRISM model. Based on that assumption, it was possible to find
the optimum mix of inventory while staying within the budget constraint and reach
the maximum possible readiness state.
g. We defined the cost of the inventory of the .5FLSIP allowance and PRISM
simulation in cells CALW and CMIX.
h. We determined the total cost of inventory for .5FLSIP and PRISM.
i. We also found the differences in the level of inventory between .5FLSIP and
PRISM and assigned a cost to this difference.
j. Actual Protection Levels (ACPL) for PRISM and .5FLSIP, given a particular
periodicity (D-120/90/60/30), was derived through multiplying each individual
ACPLs (e.g. ACPL1*ACPL2*….ACPLn = overall ACPL). Figure 7 identifies the
overall ACPL for both PRISM (99.73%) and .5FLSIP (94.22%) following this
procedure. The resultant states that an individual submarine will experience a PRISM
stockout in 1 out of every 100 cases, while the same submarine would stockout more
frequently (6 of every 100 cases) given an inventory stocked by .5FLSIP.
71

Check point = Displays “RecomTotal cost = Displays the dolla(CMIX) respectfully. Savings = Displays the dollar aOverall submarine protection l
F. SIMULATION RESULT
1. The cost of inventory
Supply Officer. The service (p
budgetary constraints (cost o
cost), and opportunity cost (c
data from the USS Pasadena
increasing the overall readin
identifies comparative cos
methodologies (PRISM and
periodicity (D-120/90/60/30)
inventory management tool
information to the FoxPro
inventory readiness level with
to the segmented nature of th
tool and explained in Chapter
Figure 7 - PRISM Simulation –Section 5
mended PRISM allowance increase” only if ALW < MIX r amount of inventory on board under .5FLSIP (CALW) and PRISM
mount that can be saved by using PRISM inventory stocking model evel= actual submarine protection level for a specific D-(120/90/60/30)
S
depends on the service (protection) level chosen by the
rotection) level variant depends upon many factors, such as
f the items), operating costs (cost of re-supply, delivery
ost of a mission failure). As an example, we utilized the
to illustrate the advantage of PRISM versus the .5FLSIP in
ess while reducing inventory costs. Below, Figure 8
t figures associated with both inventory stocking
.5FLSIP) across pre-deployment periodicities. Each
identifies a pre-determined re-supply point, signaling the
(PRISM or .5FLSIP) to send aggregated repair part
database. Each look (D-120/90/60/30) categorizes an
its associated cost. The noted differences can be attributed
e periodicity as defined by .5FLSIP inventory management
I.
72
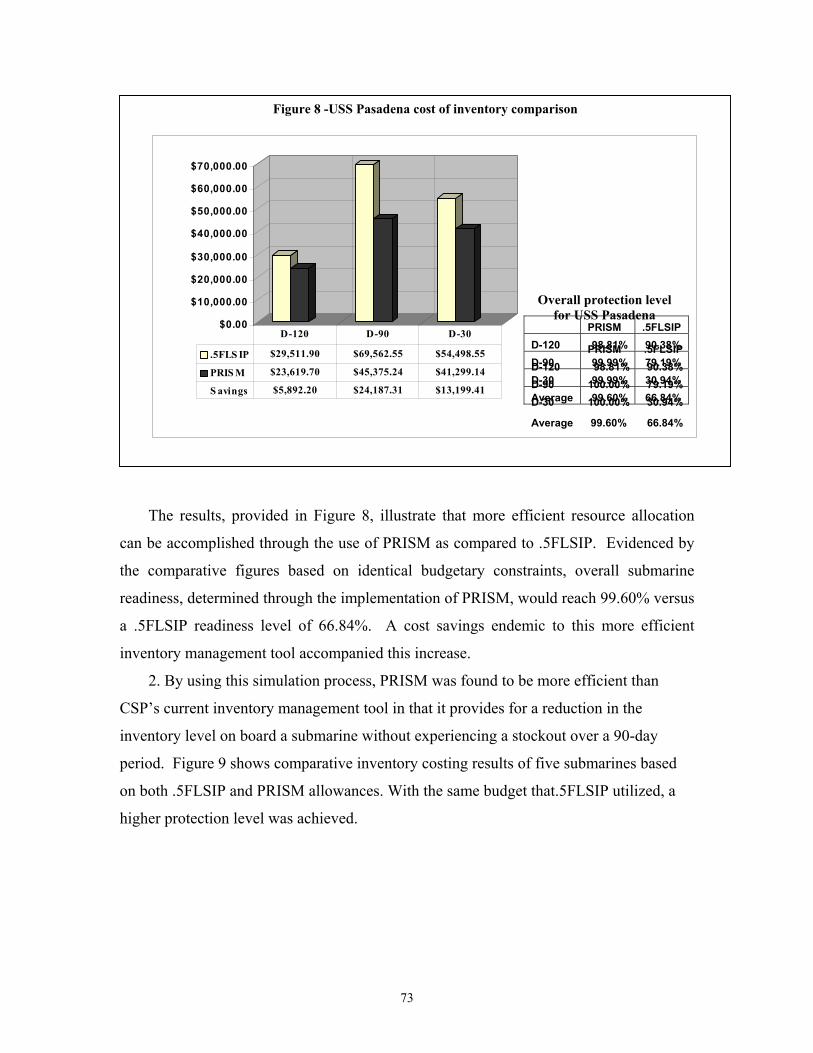
$0.00
$10,000.00
$20,000.00
$30,000.00
$40,000.00
$50,000.00
$60,000.00
$70,000.00
.5FLS IP $29,511.90 $69,562.55 $54,498.55
PRIS M $23,619.70 $45,375.24 $41,299.14
S avings $5,892.20 $24,187.31 $13,199.41
D-120 D-90 D-30
Overall protection level for USS Pasadena
P
1
D-30 100.00% 30.94%
Average 99.60% 66.84%
Avera 99.60% 66.84%
RISM .5FLSIP D-120 98.81% 90.38% D-90 00.00% 79.19%
PRISM .5FLSIP D-120 98.81% 90.38% D-90 99.99% 79.19% D-30 99.99% 30.94%
ge
Figure 8 -USS Pasadena cost of inventory comparison
The results, provided in Figure 8, illustrate that more efficient resource allocation
can be accomplished through the use of PRISM as compared to .5FLSIP. Evidenced by
the comparative figures based on identical budgetary constraints, overall submarine
readiness, determined through the implementation of PRISM, would reach 99.60% versus
a .5FLSIP readiness level of 66.84%. A cost savings endemic to this more efficient
inventory management tool accompanied this increase.
2. By using this simulation process, PRISM was found to be more efficient than
CSP’s current inventory management tool in that it provides for a reduction in the
inventory level on board a submarine without experiencing a stockout over a 90-day
period. Figure 9 shows comparative inventory costing results of five submarines based
on both .5FLSIP and PRISM allowances. With the same budget that.5FLSIP utilized, a
higher protection level was achieved.
73

$0.00
$10,000.00
$20,000.00
$30,000.00
$40,000.00
$50,000.00
$60,000.00
$70,000.00
$80,000.00
.5FLSIP cost of inventory on average $51,191.00 $19,332.32 $21,650.64 $67,509.96 $78,255.51
PRISM cost of inventory on average $36,764.69 $12,449.86 $15,417.74 $59,764.83 $66,093.11
Savings on average $14,426.31 $6,882.46 $6,232.90 $7,745.13 $12,162.40
Inventory cost reduction in percentage 28.18% 35.60% 28.79% 11.47% 15.54%
USS PasadenaUSS Los Angeles
USS OlympiaUSS
ColumbiaUSS Chicag
Figure 9 - Comparison of MESS and PRISM based on average inventory cost
o
With employment of PRISM, inventory cost reductions in percentage were achieved
for each boat. Specifically, a 28.18% reduction was captured by the USS Pasadena,
35.60% for the USS Los Angeles, 28.79% for the USS Olympia, 11.47% for the USS
Columbia, and 15.54% for the USS Chicago. Additionally, an average (per boat) savings
of $9,489.84 was identified by aggregating total savings then dividing this sum by the
number of boats (in our case 5). Continuing this methodology across the entire CSP fleet
(twenty-six fast-attack submarines), an average savings of $237,495.95 can be achieved.
Furthermore, additional savings could be achieved by analyzing the entire onboard
inventory using the PRISM inventory management tool as opposed to limiting our
analysis to assumption 1.
In summary, PRISM allows the redistribution of the cost of inventory, thereby
achieving a higher submarine readiness as opposed to .5FLSIP. It also provides a basis
for Readiness Based Sparing (RBS) allowing the decision maker to redistribute inventory
74

to meet the required budget and readiness constraints (e.g. manipulating the protection
levels for spare parts for increased cost savings and/or readiness). Based upon the
simulation results, the validation point was made that the PRISM inventory management
tool is more efficient and cost-effective than .5FLSIP.
75

THIS PAGE INTENTIONALLY LEFT BLANK
76
IV. RECOMMENDATIONS AND CONCLUSION
A. RECOMMENDATIONS FOR IMPLEMENTATION
1. Based on the PRISM reports (excel spreadsheets) and simulation results in
chapter three, we recommend implementing PRISM versus the current CSP process. A
significant cost savings can be achieved while maintaining or increasing operational
readiness.
First, the PRISM report and its design (via excel spreadsheet) provide managers a set
of tools intended to assist in making inventory decisions. With a wide range of
information, the PRISM report adds essential flexibility managers’ need for smart
inventory decision-making. Second, on average, the PRISM simulation utilizing Crystal
Ball® allows a reduction in the inventory level on board a submarine while maintaining
the same level of readiness. The simulation facilitates determination of the optimum
level of the inventory based on duration of the deployments, usage rate, and protection
level. It also highlights spare parts that are under-stocked. Overall, PRISM will improve
logistical efficiencies, reduce inventory onboard submarines, reduce costs, and provide
more flexibility than the current process.
2. We highly recommend purchasing the site license for the Crystal Ball®, or a
comparable simulation program, to run the PRISM simulation. Use of the Crystal Ball®
simulation program allowed the group to adequately predict a value based upon certain
parameters due to the Law of Large Numbers. Since Crystal Ball® can run a simulation
model thousands of times, it is able to output a level of uncertainty around a probability
in a given problem. Using our project as an example, probability assumptions represent
the uncertainty of whether or not a specific part will fail over a 90-day time span. Both
CSP and the NSSC supply department can utilize the Crystal Ball® simulation package.
3. We recommend using the Poisson distribution tables as an alternative method
when Crystal Ball® is not available. The advantage of using Crystal Ball® is that it can
be accommodated when the demand for the inventory is non-Poisson distributed.
77

B. RECOMMENDATIONS FOR FOLLOW-ON RESEARCH
1. The PRISM project utilized data based upon mission critical, highly demanded
items captured from the 3M database. This group recommends further research applying
its theories to each individual submarine Master Stock Status List (MSSL). FLSIP
provides stocking allowances for all repair parts onboard these submarines. It is therefore
feasible to acknowledge the possibility that PRISM could run demand data against all
repair parts assigned to a submarine. With usage rates provided by each submarine,
Crystal Ball could set a new target allowance for each item onboard, for each individual
submarine, within the parameters set by CSP.
2. This group recommends follow-on research to integrate PRISM and/or its
concepts into the FOXPRO and/or 3M database, or use the FOXPRO/3M data to
integrate into this group’s own spreadsheets and database. The equations and processes
that enable us to predict allowances for a period of time can be accomplished in a timelier
manner by implementing this program into one of the previously stated programs.
Crystal ball works extremely well with Microsoft’s’ EXCEL spreadsheet program, and
therefore can be created to tie in and run processes automatically, eliminating the human
interface portion.
3. The group recommends further research by other groups on whether PRISM can
be applied to other communities, such as naval aviation or surface warfare. This
endeavor may take a significant amount of energy and resources, but providing the other
warfare communities with a better inventory management tool than they currently
possess will be time and money well spent.
C. CONCLUSION
The environment of the Cold War era is quite unlike the operating environment of
post 9/11 where uncertainty prevails in a world of increasing terrorism and asymmetric
warfare. Our ship and submarine fleets are operating in a highly dynamic and up-tempo
environment where shortened turnaround deployment cycles are now the norm rather
than the exception. In addition, new technology implementation within the U.S. Navy’s
warships is expanding exponentially. The U.S. military must transition and transform to
78

meet the challenges of the new millennium or risk losing its competitive military
advantage. "If your environment is changing, you must change with it. If you don't, you
perish."13
As a result of the post 9/11 environment and to affect our transformation to a more
efficient and effective military force, ongoing reviews of our logistic processes and its
current stocking models are required. Utilizing the PRISM model is an effective way to
better understand a ship’s true inventory requirement through real-time demand data,
which FOXPRO (via the 3M database) already provides. Real-time demand has enabled
the group to set benchmark usage rates, which is most useful when based upon newly
installed systems. When these usage rates are compared to a deploying submarine, they
highlight potentially inefficient stocking levels. PRISM, with its spreadsheets and
simulations, will assist CSP and the Department of the Navy in its progress toward a
more efficient and effective fighting force.
13 Sahakian, Curtis. Strategic Alliances and Partnering Quotes: Change and Speed of Adaptation. http://www.corporate-partnering.com/info/strategic-alliances-and-partnerings-quotes2.htm, accessed 22 May, 2003.
79

THIS PAGE INTENTIONALLY LEFT BLANK
80

APPENDIX – PRISM DATABASE
A. INTRODUCTION
The U.S. Navy submarine force is arguably the most important operational segment
in the fleet as the nature of operations lends itself to discontinuity in terms of utility. In
other words, due to the “silent” nature of the submarine mission (e.g. submerged to
protect location) any necessary requirements post D-0 would result in possible safety
related issues inconsistent with policy. For example, when a boat leaves port, it must
remain submerged to exploit its tactical advantage. If for some reason a particular repair
part were not on-board and required for the safe evolution of the submarine, the boat
would need to pull off station and restock. This makes the boat vulnerable and at risk to
any number of safety related evolutions. These unnecessary risks, as they relate to repair
part stocking, can be mitigated by effective employment of the PRISM. One specific
utility derived from PRISM is a database that attempts to increase system wide
functionality of Pacific Fleet stocking methodologies accomplished through “functional
blueprinting.”14
One potential output from PRISM is a menu driven database (DB) controlled by the
user, where various objects serve as units of interest (in the context of this chapter, the
acronym PRISM will refer to the database). Each object contains relational constraints
which are enforced through the use of security and integrity methodologies, allowing the
end user to derive information through programmable queries associated with his
permissions level. The following will (1) identify a requirements analysis with
assumptions, (2) give a brief description of relations, relationships and constraints, (3)
provide a description of the system’s inputs, outputs and user interface, (4) and discuss
four areas of database administration (DBA) that apply directly to technical aspects of
PRISM within a multi-user environment. Additionally, each form and report that was
generated in the creation of PRISM will be discussed in terms of its functionality and
usefulness.
14 Functional Blueprinting is a method whereby a database designer engages the end user to ensure terminal functionality is built into the model before work begins.
81
B. ASSUMPTIONS
1. Part information represents information carried at the fleet supply level. Stock
item represents information at the ship level.
2. Inventory information is associated with a ship and a ship’s deployment. This
information is necessary for determining operational readiness as affected by
stock outs.
C. REQUIREMENTS ANALYSIS
1. Stakeholders
The stakeholders in the system are the primary operators (submarine community
Supply Corps Officers) and secondary users (senior leadership or operational
readiness decision makers).
2. Report Requirements
The primary stakeholder requires reports which identify current on board
quantity of mission essential spare parts that are requisite for the operation of a
specific submarine.
The secondary stakeholder requires reports that will identify the demand for
these mission essential parts (based on real time data of combinatory stocking and
use information from the submarine fleet), and help forecast a realistic stocking level
for each.
3. Query Requirements
The primary stakeholder requires queries such as inventory levels, demand
levels, stocking history, and costs.
The secondary stakeholder requires queries such as those mentioned above in
addition to off station time due to inadequate supply, readiness levels as compared to
inventory level, and costs versus product mix ratios.
D. RELATIONS, RELATIONSHIPS AND CONSTRAINTS
Database design is a dynamic series of iterative improvements that increase
functionality in the aggregate. To preclude implementation problems, the DB architect
must ensure the blueprint is a viable baseline for project initiation. Figures 9-12 show
four baseline models, (1) Entity Relationship Diagram (ERD), (2) Semantic Object
Model (SOM), (3) Table/Column, and (4) Microsoft® Access Relationships which
82
identify the relations, relationships, and constraints that were identified through the
functional blueprinting process. Each diagram represents roughly the same material,
however, these show a progression from blueprint to employment. In other words, we
employed the ERD as our functional blueprint; applied the graphical concepts to
Tabledesigner® (a tool for producing a SOM); ensured our model was represented in the
4th normal form (table/column); and transposed the SOM into a Microsoft® Access DB
whereby the relationships were generated. The relationships represent the final product
at the time of this project. The following will discuss the highlights of each model.
1. Entity Relationship Diagram
The ERD is graphical schemata used to represent entities and their relationships (see
Figure 9). Entities are normally shown in squares or rectangles, and relationships are
shown in diamonds. The cardinality of the relationship is shown inside the diamond.15
Here, our attempt was to identify the entities16 deemed necessary for DB implementation
(i.e. ship, inventory, deployment, part). Within each entity, attributes17 exist which
describe what the entities consist of. For example, the entity ship has attributes Hull
Type, Ship Name, Hull Number, etc… the values of which specifically identify that
particular ship. Without attributes, the requisite level of specificity would not allow for
proper DB implementation. Lastly, relationships18 bridge the gap between entities. Each
relationship has within it a minimum and maximum cardinality19 which, in a binary
relationship, identifies the number of elements allowed on each side of the relationship20.
PRISM has four such relationships that further enhance model granularity.
2. Semantic Object Model
Next, we translated the graphics of the ERD into a SOM (see Figure 10) permitted
through the functionality built into TD®. Here, each ERD entity, attribute and
relationship/cardinality is transformed into its equivalent within TD® (i.e. object, data
item, data group and object link attributes). This allows the user to further specify
15 David M. Kroenke, Database Processing: Fundamentals, Design and Implementation (Upper Saddle River, NJ: Prentice-Hall, 2002), 640. 16 Entity: something of importance to a user that needs to be represented in a database 17 Attribute: properties that describe the entities’ characteristics 18 Relationship: an association between two entities, objects, or rows of relations 19 Cardinality: Maximum can be 1:1, 1:N, N:1, or N:M. Minimum can be optional-optional, optional-mandatory, mandatory-optional, or mandatory-mandatory. 20 Ibid., p. 635.
83

granularity in addition to efficiently adjusting inputs into the most user friendly segments.
Figure 10 shows five objects containing numerous data items describing that particular
object. For example, ShipInformation contains items that describe the particulars of a
ship. In this case, HullNumber, ShipName, Squadron and ShipType are all items that
describe ShipInformation. Furthermore, HullNumber is annotated with a double asterisk
** (viewed in the vertical in TD®) that identifies that particular data item as the key21.
As with the ERD, SOM also employs the cardinality principle as it specifies the number
of allowable instances on either side of a two-way relationship, and whether an instance
is required. Within ShipInformation, the key data item is HullNumber and is annotated
with a cardinality or 1:1. This tells the DB designer that ShipInformation is identified
uniquely by HullNumber and there will be one and only one instance of a particular
HullNumber. To increase efficiency we are able to employ object links that allow us to
create an association or relationship between a pair of objects in the same model. Once
the link is created, links between objects appear as items in each object and when finally
transposed into a DB, the links are represented by foreign keys or an intersection table.22
3. Table/Column
When the SOM is complete and nearly ready for DB implantation, it is imperative to
ensure the model meets normal form23 requirements. We ensured PRISM met the fourth
normal form by requiring every multi-valued dependency to be a functional dependency.
This can be seen in Figure 11 where we constructed the corresponding tables and
columns relevant to our conceptual model. Here, each SOM object is identified as a bold-
typed, upper case word prior to the parentheses. To the right of the parentheses is the key
data item (identified in bold-type, lower case, underlined) followed by any simple data
items (standard type), and any composite keys for the multi-valued data item (repeating
group) relations. In order to comply with the 4NF requirement, we must create another
table for our repeating group, SHIPINVENTORYITEM, where the keys become the key
21 Key: a group of one or more attributes identifying a unique row in a relation. Because relations may not have duplicate rows, every relation must have at least one key, which is the composite of all of the attributes in the relation. 22 Tabledesigner® help function 23 Normal Form: A rule or set of rules governing the allowed structure of relations. The rules apply to attributes, functional dependencies, multi-value dependencies, domains, and constraints. The most important normal forms are the 1NF, 2NF, 3NF, BoyceCodd NF, 4NF, 5NF and domain/key normal forms.
84

of the object in which it is contained, in addition to the key of the group. This process
helps minimize data anomalies within the DB.
4. Microsoft Access Relationships
Finally, when the model is ready for DB implementation, we again employ the
functionality built into TD®, by using the create database function. This function takes
the completed SOM and translates it into a viable Microsoft® Access Database. When
complete, and the Access file is opened, a link to relationships becomes available (see
Figure 12). Once opened, the relationship window is an immensely useful management
tool whereby the DB manager can efficiently identify objects and their relations in both
graphical and functional ways. As one can see from Figure 12, TD®, correctly
transposed each object, data item and data link into their respective Access relationship
table, and added a sixth table, ShipInventoryItem, which represents the data group
embedded in ShipInventory. Access calls this an intersection table, where the primary
keys for the table are the foreign keys of both ShipInventory and MasterPartsList. From
this page, DB managers can add, remove or edit relationships (identified by the lines
connecting the tables), to ensure the most efficient DB. For example, by double clicking
on a relationship, the DB manager can choose to select referential integrity24 which
ensures the validity of relationships between records in related tables. PRISM employs
this technique in addition to utilizing the cascade function that updates related fields and
deletes related rows when the parent field or row is updated or deleted respectively. This
further ensures that data integrity is maintained. Many other techniques were used to
enhance the level of specificity within PRISM but are beyond the scope of this chapter.
The following section will identify inputs, outputs and user interfaces designed to meet
the requirements of dictated through the functional blueprinting process.
E. INPUTS, OUTPUTS AND USER INTERFACE
1. Inputs
PRISM was designed for multi-user functionality, which is to say whereas one end
user will require a particular output, yet another may require something vastly different.
24 Referential integrity is a system of rules that Microsoft Access uses to ensure that relationships between records in related tables are valid, and that you don't accidentally delete or change related data. Microsoft Access Help Function.
85

With this in mind, and with sound employment of the functional blueprinting process, we
engaged upon selecting input screens (forms) that would allow the user to search, enter
and modify data in a simplified, yet deliberate manner. Seen in Figure 13, the input
screen permits the user to search for data by HullNumber, HullType, ShipName or
Squadron. This level of granularity makes it less cumbersome for the user as he is not
required to input all data about a particular boat, only the information he can recall. For
example, if he can only recall the boat’s name, but not the hull number, the DB can
search on this single criterion. Of course, the DBA can set the security limits to whatever
specifications they desire. When the input has been entered, the DB will search all
related fields and return the information denoted in the Ship Details viewing pane.
Currently, PRISM has twelve input screens that allow each user in a multi-user
environment to obtain a great deal of information about all submarines in the DB. The
twelve forms are divided between two specific groups of users (fleet and ship). These
two groups require access to varying degrees of information and separate levels of
granularity. Further explanation will be provided in the database administration security
section.
2. Outputs
Information is power and managers demand accurate, timely information in the
process of making effective decisions. Since gathering and compiling data is oftentimes
costly and inefficient, leading to hasty and misinformed decisions, managers search for
tools that will increase productivity. Microsoft® Access provides the capability of
building reports which aggregate data into components desired by end users. Seen in
Figure 14, output variables (APL, NIIN, Nomenclature, etc…) requested by the end user
have been aggregated into a single report, identified by specific HullNumber or
ShipName. The user can customize reports in a manner that is most efficient to him.
This ability to customize pays rather large dividends in that a manager can make sound
decisions based on vast amounts of data accessed through the casual data mining
capabilities a DB allows. PRISM utilizes six outputs for the aggregation of reportable
information. In order for these outputs to be compiled, the user must be able to navigate
to the specific location. The following section will discuss the user interface employed
by PRISM.
86

3. User Interface
PRISM is employed in a multi-user environment where two specific users have
been identified. Data integrity remains a grave concern, so we have segregated the
two users, employing the Principle of Least Privilege (POLP)25 concept, allowing
the fleet DBA to access the information pertinent to him (higher privilege) while
limiting the ships DBA to only ship relevant data. Each user will enter the PRISM
main menu, but preset privileges allow the fleet DBA to navigate through the entire
DB using whatever control buttons he desires. The ship’s DBA will be denied
access to the fleet information, but be allowed to navigate the control buttons within
the ship side. Each form has a control button that allows for easy movement to and
from the main menu, to include a previous form button if the user entered the wrong
screen. Upon exiting, the DB is automatically updated and saved. In a database
environment, security and data integrity are very important; these and other
administrative topics will be addressed next.
F. DATABASE ADMINISTRATION
1. Security Measures
In addition to server, directory, and file security, specific DB security measures are
employed to ensure sound integrity is maintained throughout the entire model. PRISM
employs a subject-based security protocol which will prevent unauthorized users from
“adjusting” fields they do not have permissions for. Microsoft Access enables the DBA
to set specific security protocols through implementation of the “user-level security
wizard” function. This will ensure no DB replication within a multi-user environment as
one must possess an administrative password to replicate the DB, change passwords, or
change startup properties. The access privilege matrix shown in Figure 15 will provide
the PRISM DBA with a functional chart allowing for a clean view of associated
personnel and their permissions level.
2. Back Up and Recovery Procedures
A systematic backup plan is a necessary requirement for any DB. It is our belief that
PRISM should utilize a backup plan that consists of the primary DB, a secondary or
25 Principle of Least Privilege (POLP) is a computer theory that attempts to curb problems associated with giving access rights to everyone versus only those that truly need it. (J.D. Fulp, Professor Naval Postgraduate School).
87

mirror DB, a transaction log, and audit log as insurance against the four predominant
failures associated with a Database Management System (DBMS): (1) transaction failure,
(2) DB destruction, (3) system failure, and (4) erroneous transactions. Additionally,
PRISM utilizes macro-defined control buttons that will force the user to save and close
the DB upon completion. This is a specific recommendation, identified by Microsoft
Access that should be employed within a multi-user environment. Lastly, checkpoints
are used to “tag” specific transaction periodicities making recovery procedures timelier.
If a DB failure occurs and recovery is in order, PRISM employs rollback/roll
forward procedures whereby a search for the last valid checkpoint within the transaction
log ensues, restoring the DB to a point where all transactions are valid.
3. Resource Locking Policies
To prevent lost updates within the DB, PRISM employs the resource locking26
functions available in Microsoft Access as they apply to the defined portion. In other
words, PRISM is made up of two halves (Fleet Inventory and Ship Inventory) where each
will have its own specific locking features specific.
The Fleet Inventory Management portion of PRISM employs explicit locks27 with
low granularity as the system will be accessed by a number of users. This way, it is less
likely that there will be a conflict that would prevent the disparate users from completing
their query or transaction. Additionally, share locks28 are used to prevent data in the DB
from being changed by others users until the lock is released. This will ensure the end
user receives the exact number of parts that his transaction identified. This is imperative
for operational commands, since a part with an MEC code of 1 (very important), not on
the ship when requested, can seriously hamper operational readiness.
The Ship Inventory Management portion of PRISM employs implicit locks29 with
high granularity as the system will be accessed by a single user aboard the particular ship.
Here, no conflicts will arise as a single user will not be in competition with anyone else
for the data inherent to his ship. Additionally, exclusive locks are used in order to 26 Resource Locking: the process whereby resources lock while a query is in action. This prevents multiple users from simultaneously accessing the same resources thereby preventing the possibility of a lock out, misinformation, or denial of service (DoS). 27 Explicit lock: A lock requested by a command from an application program. (Kroenke p. 640) 28 Share lock: A lock against a data resource in which only one transaction may update the data, but many transactions can concurrently read that data. (Kroenke p. 651) 29 Implicit lock: A lock that is automatically placed by the DBMS. (Kroenke p. 642)
88

prohibit all sharing of the resource by any other user. Our vision is that the Supply
Officer aboard U.S.S. Pasadena will be in control of his database, only sharing with those
specific personnel that he chooses.
4. Transaction Processing Considerations
A DBA must be acutely aware of the transactions that occur within his/her DB and
how even simple, logical operations can corrupt an entire DB. “A batch transaction
guarantees that information in the database is logically consistent at all times, even when
a single logical operation contains multiple database operations.” 30 PRISM ensures the
batch transaction function of MS Access is enabled so as to help prevent any DB integrity
issues. As the creators of PRISM, we set the Batch Updates property to Yes, allowing
the value of Commit On Close to be set to Yes and Commit On Navigation set to No.
This will force the user to commit only when the form or main form is closed, or a user
clicks the Save All Records command on the records menu. Ultimately this will provide
consistency and recoverability of DB transactions in case of a system failure increasing
overall reliability and integrity of the vast amounts of data.
30 Microsoft Access Help function
89

Figure 10: Entity Relation Diagram for PRISM Database
NIIN
MinLEvel
MissionEssential
Ship
PartDeployment
Inventory
HullType ShipName
OperationalDaysDownDays
InventoryID
HullNumber
DateEnd
DateStart
DeploymentNumber
CommissionDate
ShipBuilder
1:N
1:N
M:N
Cost
PartName
MaxLevel
AvgFleetDemand
ContainsContained within a
Co
nsists of
Ma
ke u
p
Is Ma
de B
y
Ma
kes
11
10
01
1:1
1
1
Carried On
Car
rie
s
90

Figure 11: Semantic Object Model for PRISM Database
91

Figure 12: Table/Column for PRISM Database
SHIPINFORMATION(HullNumber, HullType, ShipName, Squadron)
DEPLOYMENT(DeploymentID, DateStart, DateEnd, OperationalDays, DownDays, ShipHullNumber_FK, InventoryID_FK)
SHIPDETAILS(HullNumber_FK, CommisionDate, ShipBuilder, Street, City, State, Zip, PhoneNumber)
MASTERPARTSLIST(NIIN, Nomenclature, MaxLevel, MinLevel, MissionEssentialcode, AvgFltDemand, Cost, UsageRate)
SHIPINVENTORY(InventoryID, HullNumberID_FK, DeploymentID_FK)
SHIPINVENTORYITEM(NIIN_FK , InventoryID_FK, OnHandQty, Allowance, Stockouts, Location)
92

Figure 13: Microsoft Access Relationship for PRISM Database
93

Figure 14: Example Input Screen for PRISM Database
94
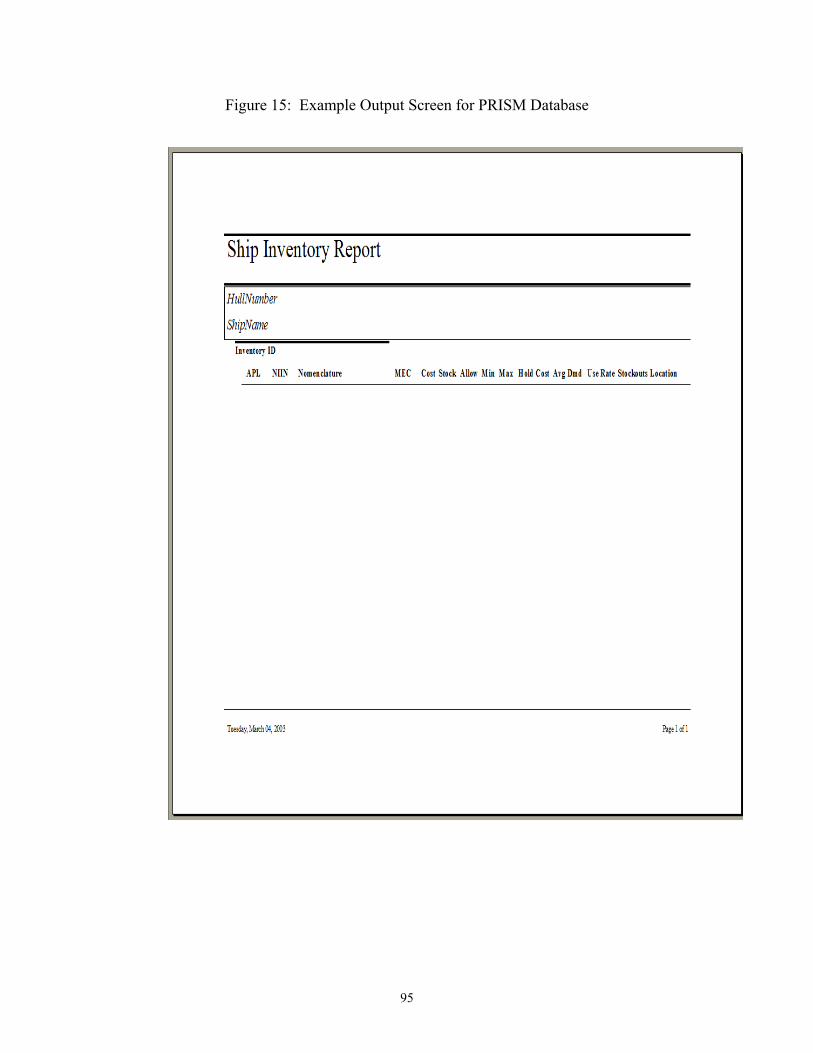
Figure 15: Example Output Screen for PRISM Database
95

Figure 16: Microsoft Access Privilege Matrix for PRISM(S) Database
ReadAddWriteWriteFull Control
Ship Inventory
UserRead & AddSupplyReadShipWriteFleetFull ControlAdmin
Fleet InventorySubject
96

Fleet Forms
97

Figure 17: PRISM Main Menu
This form is the main menu for the database, acting as the interface where the user can navigate between forms and reports. Functionality is gained through the user of control buttons as seen above. Security functions are implemented where a fleet user will have access to the fleet quadrants, likewise the ship user will have access to the ship quadrants. The following forms depict the fleet forms, followed by the user forms.
98

Figure 18: Fleet Inventory Management Form
Upon entry into the system, the fleet DBA will arrive at this form. Here, five specific functionalities exist which will help the DBA appropriately configure his data. Each control button sends the user to the specific form or report. The add inventory control button from is shown next.
99

Figure 19: Master Parts List Input Form
Upon clicking on the add inventory control button, the user enters this form, which allows the fleet DBA to add, remove or edit new part information as it arrives into NAVICP. This form will only be utilized by the DBA as to ensure the security and relevance of the data. The Master Parts List will host relevant information for every part within CSP. The listed inputs above identify specific to each part. The edit inventory form is next.
100

Figure 20: Master Parts List Update Form
Upon clicking on the edit inventory control button, the user enters this form, which allows the fleet DBA to edit current part information that exists in the Master Parts List. The difference between these two forms is that some of the functionality has been removed from this form to prevent the user from making a mistake that may affect the MPL (POLP concept). This form will only be utilized by the DBA as to ensure the security and relevance of the data. The listed inputs above identify specifics to each part. The ship deployment information update form is next.
101

Figure 21: Fleet Inventory Management Reports Form
This form allows the fleet DBA to aggregate the data he desires and print a report based on his specifications. Each specific report will be described in the reports section.
102

Ship Forms
103

Figure 22: Ship Deployment Information Update Form
This form gives the fleet DBA a concise deployment history of the particular boat. The DBA can retrieve specifics such as operational days the ship was deployed and compare that number to the amount of down days due to inventory stockouts, and how it ultimately affected readiness. This information will help the manager determine what measures must be taken to increase readiness, and see which parts were problematic. The ship information input form is next.
104

Figure 23: Ship Information Input Form
This form allows the DBA to input or update ship information in case of a port change or recent commissioning/de-commissioning. We will now focus on forms specific to the ship user. The first form is the Fleet Inventory Management Form.
105

Figure 24: Fleet Inventory Management Form
This form allows the ships DBA to access either forms or reports to edit or retrieve data. This is the entry form off the PRISM main menu. The next form is the Ship Deployment Inventory Update Form.
106
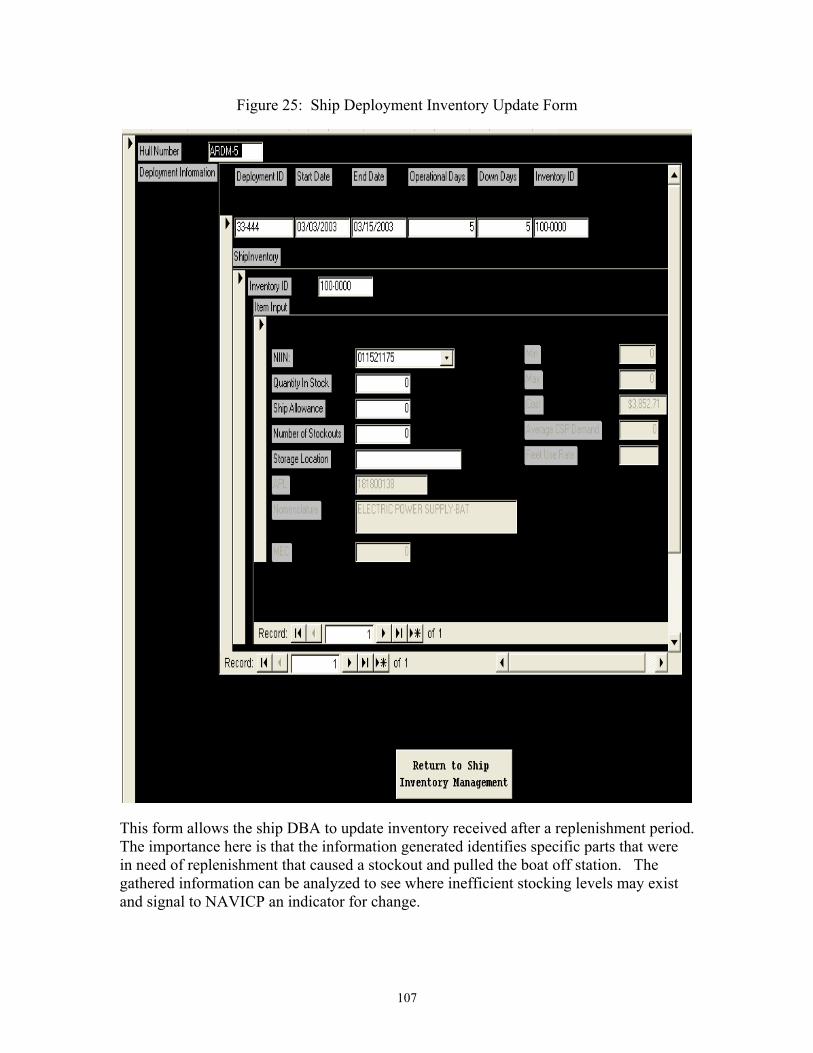
Figure 25: Ship Deployment Inventory Update Form
This form allows the ship DBA to update inventory received after a replenishment period. The importance here is that the information generated identifies specific parts that were in need of replenishment that caused a stockout and pulled the boat off station. The gathered information can be analyzed to see where inefficient stocking levels may exist and signal to NAVICP an indicator for change.
107

Fleet Reports
108

Figure 26: Master Parts List by APL Report
This report provides the user with information concerning all parts associated with a specific APL. An APL is specific piece of equipment that may have multiple parts associated. For example, a generator might have a casing, brushes, bearings and connectors all required for operation. If one bearing seizes, the piece of equipment is broken until the new bearing is replaced. A NAVICP officer can pull the report of exactly which parts constitute this specific piece of equipment.
109
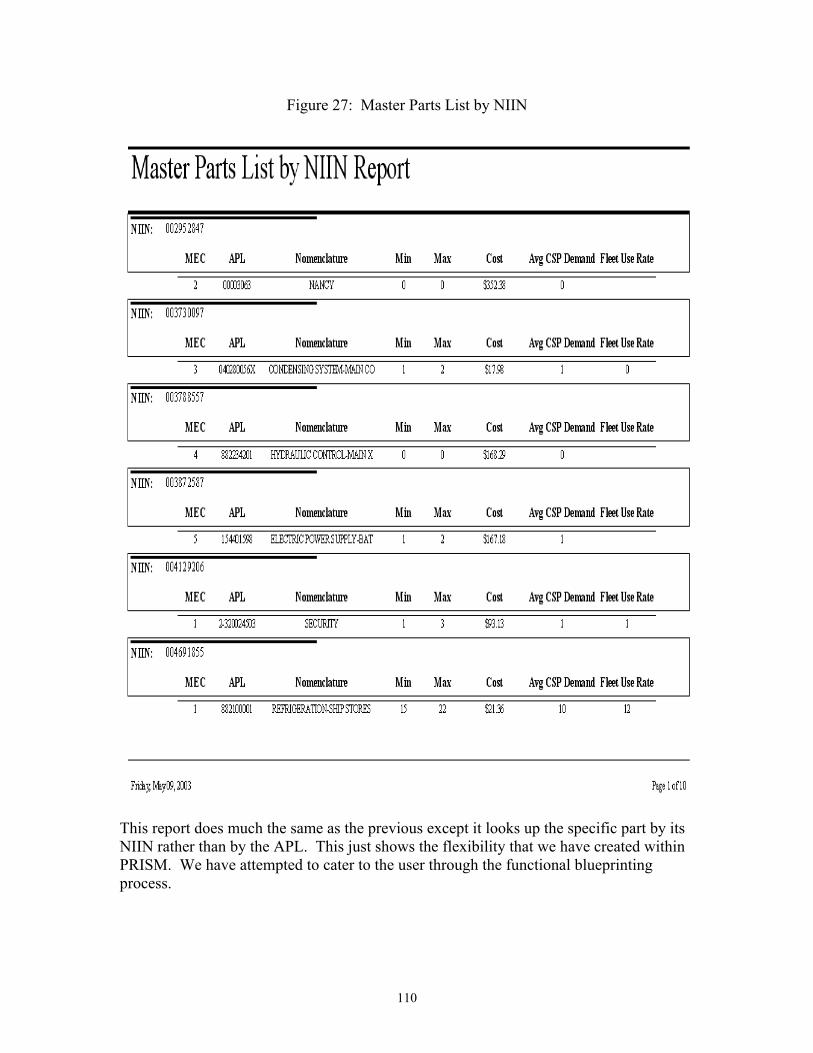
Figure 27: Master Parts List by NIIN
This report does much the same as the previous except it looks up the specific part by its NIIN rather than by the APL. This just shows the flexibility that we have created within PRISM. We have attempted to cater to the user through the functional blueprinting process.
110
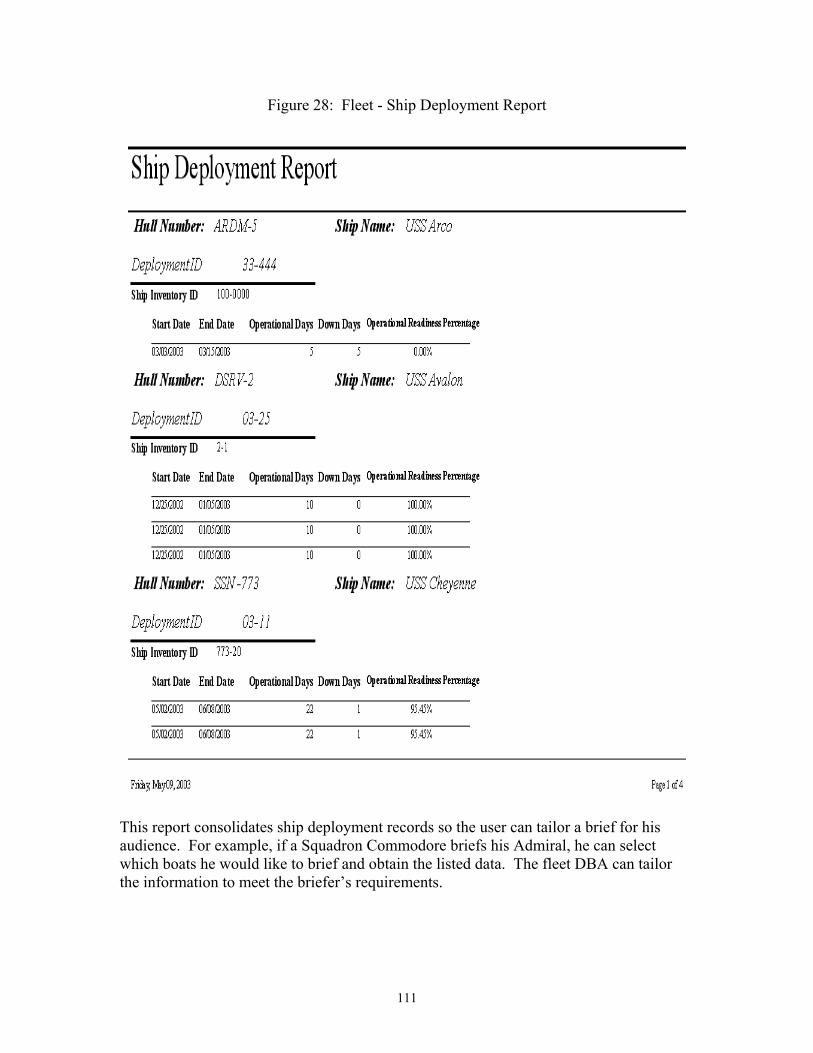
Figure 28: Fleet - Ship Deployment Report
This report consolidates ship deployment records so the user can tailor a brief for his audience. For example, if a Squadron Commodore briefs his Admiral, he can select which boats he would like to brief and obtain the listed data. The fleet DBA can tailor the information to meet the briefer’s requirements.
111

Figure 29: Fleet - Ship Information Report
This report provides the user with a consolidated look at the entire fleet of submarines. A good tool for the Commodore, he can easily view the listed information.
112

Ship Reports
113

Figure 30: Ship Inventory Report
This report gives the Supply Officer an aggregate listing of parts by Hull Number. Upon entering this report, the Safety Officer must specify (input) the boats name or hull number and the report selects the information from the on hand MPL and dispenses the report in the aggregate.
114

Figure 31: Ship Inventory Report by Inventory ID Number
This report does the same thing as the one above, however the lookup is via the inventory ID number. The advantage to this is that if the Supply Officer wants to view only the parts that came on during replenishment, to diagnose if there are stockout issues associated with any particular part, he can do by limiting the search to just the inventory ID. The only parts that will display on the report are those issued for that ID number.
115

Figure 32: Ship Information Report
This is the same report as seen in the fleet section. A concise report that allows the Supply Officer or CO the location, phone number, address, etc… of the boats he is interested in.
116

BIBLIOGRAPHY Department of Defense. DoD Active Duty Military Personnel Strength Levels Fiscal
Years 1950-2002. <http://web1.whs.osd.mil/mmid/military/ms9.pdf>, accessed 22 May 2003.
Fulp, J.D. “Introduction to Information Assurance (IA): Computer Security.” MBA
class discussion, 9 April 2003. Naval Postgraduate School, Monterey, CA. Kroenke, David M. Database Processing: Fundamentals, Design and Implementation.
Upper Saddle River, NJ: Prentice-Hall, 2002. Roche, Don. Microsoft® Access 2000 Bible Quick Start. New York, NY: Wiley
Publishing, 1999. Sahakian, Curtis. Strategic Alliances and Partnering Quotes: Change and Speed of
Adaptation. http://www.corporate-partnering.com/info/strategic-alliances-and-partnerings-quotes2.htm, accessed 22 May 2003.
117

THIS PAGE INTENTIONALLY LEFT BLANK
118

LIST OF REFERENCES Albright, S. C., W. Winston, and C. Zappe. Data Analysis and Decision Making with Microsoft Excel. Pacific Grove, CA: Duxbury Press, 2002. Anupindi, R., S. Chopra, S. Deshmukh, J. Van Mieghem, E. Zemel. Managing Business Process Flows. Upper Saddle River, NJ: Prentice Hall, 1999. Aoki, G., COMSUBPAC Inventory Logistics Policy/Operations Officer. Interview by author on 31 March 2003. Black, A., Naval Sea Systems Command (NAVSEA) HM&E REP DET. Interview by author on 28 March 2003. Cochran, J. K. and Lewis, T.P. “Computing Small Fleet Aircraft Availabilities Including Redundancy and Spares,” Computers and Operations Research 29:1, pp. 529-540, 2002. Coordinated Shipboard Allowance List (COSAL) [Use & Maintenance Manual], Supply Readiness Objectives and Milestones (SPCCINST 4441.170). COMSUBLANT/COMSUBPACINST 4406.1F, Submarine Supply Procedures Manual, 01 August 2001. Department of Defense. DoD Active Duty Military Personnel Strength Levels Fiscal Years 1950-2002. <http://web1.whs.osd.mil/mmid/military/ms9.pdf> accessed 22 May 2003. Eades, D., CDR, COMSUBPAC Assistant Supply Officer, USN. Interview by author on 28 March 2003. Frishkorn, J., Naval Sea Systems Command (NAVSEA) QCOSAL REP DET, Interview by author on 31 March 2003. Harvard Business School. “Citation Guide for MBA Students.” Harvard Business School Website. <http://www.library.hbs.edu/guides/citationguide.pdf> accessed 11 May 2003. Honeker, K. S. “An Analysis of Using Intelligent Digital Data to Reduce the Spare and Repair Parts Inventory for the New Attack Submarine.” MS thesis, Naval Postgraduate School, 1977. Konicki, S. “E-Logistics Gets the Kinks Out of Supply Chains.” Information Week, November, pp. 64-66, 2001. Kroenke, D. M. Database Processing: Fundamentals, Design and Implementation. Upper Saddle River, NJ: Prentice-Hall, 2002.
119

Leiphart, K.L. “Creating a Military Supply Chain Management Model.” Army Logistician 33:4, pp. 25-31, 2001. Leopard, G. L. “AVCAL Reduction Analysis Model.” MS Thesis, Naval Postgraduate School, 1991. Lopez, A. A. “Incentive Contracts: Taking the Guesswork Out of Setting Fleet Aviation Consolidated Allowances (AVCALS).” MS Thesis, Naval Postgraduate School, 1998. Mundell, R. J., CAPT, COMSUBLANT Supply Officer, USN. Phone interview by author on 07 January 2003. Navy Provisioning, Allowance, and Fitting Out Support. [Policies and Procedures Manual]. (NAVSEA Tech Spec 9090-1500). Naval Supply Systems Command (NAVSUP). Inventory Management. NAVSUP Publication 485, 2000. OPNAVINST 4790.4C. Maintenance, Material, Management Manual. Pawley, M.D. “A Comparative Efficiency Analysis of the Point Five FLSIP Plus COSAL Inventory Model.” MS Thesis, Naval Postgraduate School, 1995. Peiburn, J., CDR, Naval Inventory Control Point, USN. Phone interview by author on 21 November 2002. Pfleeger, C.P. Security in Computing. Upper Saddle River, NJ: Prentice-Hall, 2003. Roche, D. Microsoft® Access 2000 Bible Quick Start. New York, NY: Wiley Publishing, 1999. Silver, E.A. “Multi-item Economic Order Quantity Model with an Initial Stock of Convertible Units.” Engineering Economist, 46:2, pp. 130-139, 2001. Sullivan, M.D. “An Analysis of Three AVCAL Inventory Models Using the Tiger Simulation Model.” MS thesis, Naval Postgraduate School, 1984. Tichey, T., CAPT, COMSUBPAC Supply Officer, USN. Interview by author on 31 March 2003. Wickard, A., CDR, Supply Officer NAVSUP 056, USN. Phone interview by author on 10 December 2002.
120
121
INITIAL DISTRIBUTION LIST
1. Defense Technical Information Center
Ft. Belvoir, Virginia
2. Dudley Knox Library Naval Postgraduate School Monterey, California
3. Commander Submarine Force Pacific Supply Department Pearl Harbor, Hawaii
4. Professor Raymond Franck
Naval Postgraduate School Monterey, California
5. Professor Keebom Kang
Naval Postgraduate School Monterey, California
6. Professor Dan Dolk
Naval Postgraduate School Monterey, California