Mayor’s 2030 Transportation Task Force Transportation & Land Use Integration Long Term...
15
Mayor’s 2030 Transportation Task Force Transportation & Land Use Integration Long Term Transportation Vision 04 | 30 | 2013 SAN FRANCISCO, CALIFORNIA SFMTA | Municipal Transportation Agency Image: Market and Geary Streets, circa 1920s, Muni Centennial logo
-
Upload
darleen-lucas -
Category
Documents
-
view
213 -
download
0
Transcript of Mayor’s 2030 Transportation Task Force Transportation & Land Use Integration Long Term...

Mayor’s 2030 Transportation Task Force
Transportation & Land Use Integration
Long Term Transportation Vision
04 | 30 | 2013 SAN FRANCISCO, CALIFORNIA
SFMTA | Municipal Transportation Agency Image: Market and Geary Streets, circa 1920s, Muni Centennial logo

Priority Development Areas in San Francisco
3
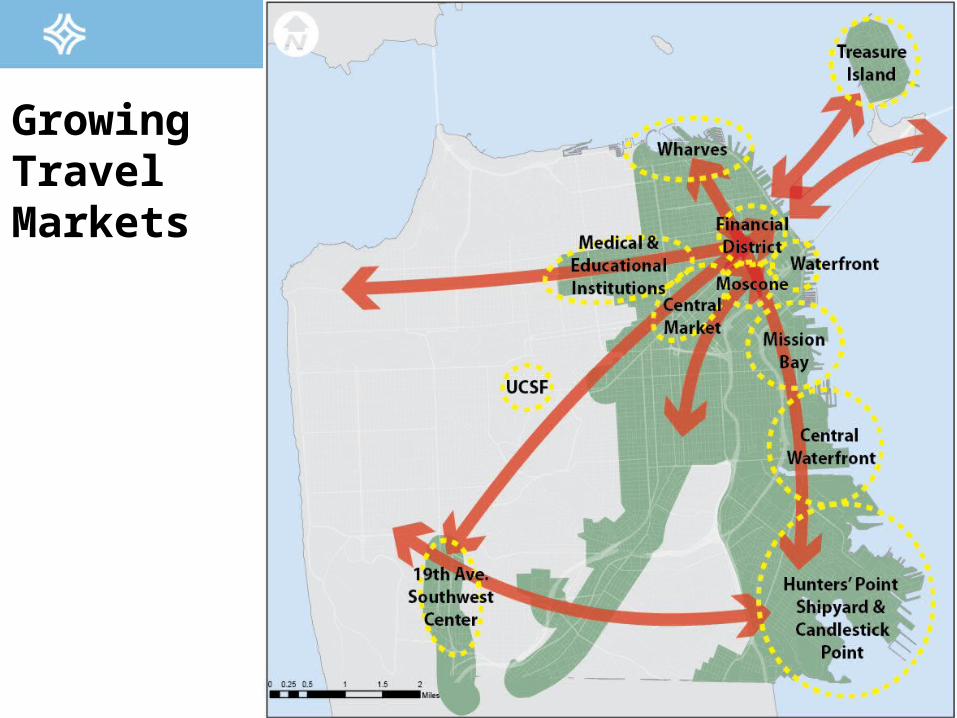
GrowingTravel Markets

Major Urban Planning Initiatives at the SFMTA
Creating partnerships to
plan for and implement transportation improvements
Treasure Island/Yerba Buena
Island
Hunters Point Shipyard &Candlestick
Point
Parkmerced
America’s Cup & Waterfront
Projects

5
Recent Urban Planning Initiatives Projects
Hunters’ Point Shipyard & Candlestick Point:– Major job/housing/open space neighborhood– New transitways, bikeways and street grid
Parkmerced: – Redesign into mixed-use transit village– Realign M line into Parkmerced village– 19th Ave. multi-modal improvements
Treasure Island/Yerba Buena Island :– Major mixed-use sustainable neighborhood– Congestion pricing pilot, ferry, shared public
ways
34th America’s Cup:– Legacy transportation and development
projects– Piloted transportation demand management
tools

6
6666
Three Major Development/Transportation Project Opportunities
Waterfront Transportation Assessment
6
SWL 330 /Arena & Event
Center
Pier 70SWL 337
Mission Rock

7
Van Ness Bus Rapid Transit– Improve transit travel time/reliability– Pedestrian enhancements
Geary Bus Rapid Transit– Improve 38 travel time/reliability– Pedestrian enhancements
Better Market Street– Improve transit travel time (40% of
transit service uses Market Street)– Pedestrian enhancements – Improve bicycle comfort
Major Complete Street Projects

ExistingNetwork (post-TEP)
Network:• Rail• Rapid Network• Local Service• Historic Network
Increasing growth & congestion can lead to: • Reliability & travel
time variability• Slower operating
speeds • Vehicle capacity/
crowding• Network
vulnerability• Hotspots &
bottlenecks

48th Ave to Market/3rd:35 min-45 min
Ocean Beach to Embarcadero:
40-50 min
Third St., Bayshoreto Embarcadero:
40-50 min
Caltrain, Bayshore to 4th/King:
15 min (+9 toEmbarcadero)
BART, Daly City to
Embarcadero:17 min
19th/Holloway to Embarcadero:
30-45 min
Network:• Rail• Rapid Network• Local Service• Historic Network
ExistingNetwork (post-TEP)
Travel Time

ExistingNetwork (post-TEP)
Core Capacity Needs
Rail Pinch-Points
West Portal
Market & Van Ness
Embarcadero
4th/King
Church & Duboce
Balboa Park
Network:• Rail• Rapid Network• Local Service• Historic Network

ExistingNetwork (post-TEP)
ConnectingGrowth Areas
Network:• Rail• Rapid Network• Local Service• Historic Network

Long-Term Planning Principles
• Build upon the existing network• Improve service to existing customers and
provide connections to growth areas• Match travel times closer to BART on key lines
to be more competitive with auto• Reduce rail transit bottlenecks and pinch
points• Distribute peak period passenger loads by
closing gaps in network • Increase rail transit capacity (fleet size, rights
of way, yards) with a tiered rail network • Create network redundancy so fleets are more
resilient and can easily move between yards. 12

13
Long-termTransitVision
Upgrade thecore capacitylines
DRAFT

14
Long-termTransitVisionUpgrade key transit corridorsto support thecore capacitynetwork
DRAFT

Long-termTransitVision 48th Ave to
Market/3rd:25 min
Ocean Beach to
Embarcadero :
25 min
Wharves to Moscone:
10 min
Daly Cityto
Embarcadero:
25 min
Bayshore & Hunters
Point to Market
St.:25 min
DRAFT