MAY 31, 2011 - mdh.diva-portal.orgmdh.diva-portal.org/smash/get/diva2:432504/FULLTEXT01.pdf · MAY...
43
SCHOOL OF SUSTAINABLE DEVELOPMENT OF SOCIETY AND TECHNOLOGY, MALARDALEN UNIVERSITY, VÄSTERÅS, SWEDEN. BACHELOR OF SCIENCE (B.sc) IN BUSINESS ADMINISTRATION MAY 31, 2011 LONG TERM EFFECTS OF SALES PROMOTION ON THE SALES OF BEVERAGES BY OLUFEMI OBAWOLE (SSN: 1982-07-25) Supervisor: Jean-Charles Languilaire Examiner: Ole Liljefors
-
Upload
hoangthuan -
Category
Documents
-
view
216 -
download
2
Transcript of MAY 31, 2011 - mdh.diva-portal.orgmdh.diva-portal.org/smash/get/diva2:432504/FULLTEXT01.pdf · MAY...

SCHOOL OF SUSTAINABLE DEVELOPMENT OF SOCIETY AND
TECHNOLOGY, MALARDALEN UNIVERSITY, VÄSTERÅS, SWEDEN.
BACHELOR OF SCIENCE (B.sc) IN BUSINESS ADMINISTRATION
MAY 31, 2011
LONG TERM EFFECTS OF SALES PROMOTION ON THE
SALES OF BEVERAGES
BY
OLUFEMI OBAWOLE (SSN: 1982-07-25)
Supervisor: Jean-Charles Languilaire
Examiner: Ole Liljefors

1
Dedication
To God Almighty, Ronke Obawole and Tunde Obawole (Late): This work would never be
achieved without you guys.

2
Abstract
This project work studies the long term effect of sales promotion on the sales of beverages.
Quantitative analysis of the promotional periods in relation to the quantity of beverages sold is
used to address two research questions;
1) What is the effect of sales promotion on the sales of beverages
2) If Yes, does the result of sales promotion go beyond the promotional period
With the reported results, the implication has been drawn for pricing, promotional periods and
the promotional policies. The short term and the long term which are used in this project work as
before and after the promotional period respectively are determined. The derived results are
consistent with the formulated hypothesis that consumers wants cheaper price and they are also
promotion sensitive over time.
Purpose of the research: The purpose of this study is to analyse and discuss the effects of
sales promotion on the sales of beverages and unfold the benefit in sales increase that is inherent
in the use of sales promotion after the promotional period.
Keywords: Sales Promotion, Beverages, Sales, Periods.

3
Table of Contents 1 INTRODUCTION .......................................................................................................................................... 1
1.1 Background ......................................................................................................................................... 1
1.2 Problem discussion ............................................................................................................................. 2
1.3 Purpose ......................................................................................................................................... 3
1.4 Research Question .............................................................................................................................. 3
1.5 Methodology ....................................................................................................................................... 4
1.6. Delimitation ....................................................................................................................................... 4
1.7. Thesis Structure ................................................................................................................................. 4
2 THEORETICAL FRAMEWORK ...................................................................................................................... 5
2.1 Sales Promotion .................................................................................................................................. 5
2.1.1 What is Sales Promotion .................................................................................................................. 5
2.1.2 The purpose of sales promotion ...................................................................................................... 5
2.1.3 Limitations of Sales Promotion ........................................................................................................ 6
2.2 The Effects of Sales Promotion ........................................................................................................... 6
2.2.1 Long Term and Short Term effect of Sales Promotion .................................................................... 6
2.2.2 Effects of Sales Promotion on Consumer Buying Behavior ............................................................. 8
2.3 Sales Promotion Activities .................................................................................................................. 9
2.4 Measurements of Sales Promotion................................................................................................... 11
3 METHODS ................................................................................................................................................. 12
3.1 Selection of Empirical Setting ..................................................................................................... 12
3.1.1 Selection of Research topic ............................................................................................................ 12
3.1.2 Selection and Presentation of the chosen Company ..................................................................... 12
3.1.3 Approach to the Research method ................................................................................................ 14
3.2 Methods to collect Secondary data ............................................................................................ 14
3.3 Methods to collect Primary data ...................................................................................................... 15
3.3.1 Data frame ..................................................................................................................................... 15
3.3.2 Research Instrument ...................................................................................................................... 15
3.4 Methods to analyze data .................................................................................................................. 16
3.4.1 Statistical Tool ................................................................................................................................ 16
3.4.2 Statistical Technique ...................................................................................................................... 17
3.5 Validity and Reliability ....................................................................................................................... 18

4
4 EMPIRICAL MATERIAL .............................................................................................................................. 20
4.1 Presentation of the Data collected ................................................................................................... 20
4.1.1 DURING THE PROMOTIONAL PERIOD ............................................................................................ 20
4.1.2 AFTER THE PROMOTIONAL PERIOD ............................................................................................... 21
5 ANALYSIS AND INTERPRETATION ............................................................................................................. 22
5.1 Interpretation of the Data Collected ................................................................................................ 22
5.2 Hypothesis Testing ............................................................................................................................ 24
6 SUMMARY, CONCLUSION AND RECOMMENDATION .............................................................................. 31
6.1 Summary and Conclusion ................................................................................................................. 31
6.2 Recommendations ............................................................................................................................ 32
REFERENCES (S) ........................................................................................................................................... 33
APPENDICES ................................................................................................................................................ 35


1
1 INTRODUCTION In this chapter, background information is presented, the problem statement is also
discussed, and the purpose is formulated as well as the research question.
1.1 Background
Almost everyone, every company or even the larger organization can be influenced to a
certain degree with a price change, special discounts or quantity purchase scheme for the same
price or lower, by sales promotion and other forms of promotion which includes advertisements.
„„A decade ago, the advertising to sales promotion ratio was far beyond little reaching up to
60:40‟‟ (Cummings, 1997, p.3), this means consumers from different segments watch and hear
advertisements on the Television and Radio on a daily basis. Consumers criticize some
advertisements while some accepts it in good faith, some will not even want to take
advertisements on the papers, (Ingen Reklam as it is popularly stated in Swedish language when
an individual does not want to take the free distributed advertisement (aftonbladet.se)). But today
in many retail industries, especially with the retailers that sells convenience goods such as
beverages which Kotler et al., (2005, p.540) define as „„the consumer goods that the consumers
will buy frequently, immediately and with a minimum of comparison and buying effort‟‟. Sales
promotion accounts for more than average of the combined budget and the fast growth rate is
expected to continue (Kotler et al., 1997). Different tools of sales promotion exists such as
Coupons, Sweepstakes and price-cuts (Kotler et al., 2006). The promotional tools are all around
us every day and entirely try to make beverages as a type of convenience goods more appealing
for us to make a purchase. The promotional tools have competitively catapulted the different
kinds of beverages into market. In other words, sales promotion is greatly important and its
effects on the marketing of beverages cannot be taken for granted especially in the period of
economic recession when market planners devised new means of pushing products to the
customers in other to sustain the competitive advantage in the market place.
As Sales promotion has been seen to be a proven method through which manufacturers and
retailers can communicate effectively with consumers (Chris, 2005), Consumer perception in
terms of the derived benefits from the offered sales promotion can be seen in different ways,
Kotler et al., (2005, p.674) discusses customer‟s perceptions to the price and value of a product.
„„The price that is set for the products must be buyer oriented as Consumers will use the value of

2
the product to evaluate a product price‟‟. The benefits (Value) that the consumers intend to have
from the purchased product must not be less than the exchange value (Price). In other words,
Kotler et al., (2005, p.674) suggests that marketers must try to understand the consumer‟s
reasons for buying the product and should learn to also set the promotional price according to
consumer perceptions of the product‟s value.
1.2 Problem discussion
Sales promotion involves a close range of short-term tactical tools (strategies that are meant
to last for a short stated period) that can play a vital complementary role in long term
promotional mix strategy. This activity is meant to introduce extra value to the product or service
beyond what the product offers. This in turn creates an overly great inducement to buy or try it.
Although, sales promotion are usually suggested to be a short term tactical promotional mix
measures, but generally, as an element of the promotional mix, it has been increasingly
recognized as a valid strategic tool, working alongside and supporting other promotional
elements (Brassington, 2000).
The clear picture of the problem in this research work is based on two variables (Sales
quantity and Price) which are being contended upon by two actors respectively (The Marketers
and Customers). Customers behave differently in relation to making decisions whether to go
ahead with a purchase or not. Consumer behavior is study of the processes involved when
individuals or groups select, purchase, use or dispose of products, services, ideas or experiences
to satisfy needs and desires (Michael et al., 2010). Firstly, average economic citizens or
sometimes as a result of poverty, „„consumers benefit from cheaper products‟‟ (Bureau et al.,
1998, p.452) and this benefit is one thing that a potential consumer (rich or poor) will also put
into consideration to look for a quality cheap product. In addition to this, there are quite a
number of consumers that are opportunist which are those customers seeking self interest with
guile (Ping, 1993). The opportunist customers do not care about the product but they are only
interested in buying this product because of the promotion on it. Some will buy more than they
need and store them in their homes for later use because they got it cheap. Some customers are
addicted to this product whether it comes with discounts or not. Also the possibilities of having a
cheaper kind of beverage like soft drinks (known to contain a calculated amount of readily
absorbable sugars (JAMA. 2004; 292)), example as in funlight drink has been another reason

3
towards the need to market other soft drinks like Cocacola and Premier to customers. Funlight
drink can be diluted with a quantity of water and thus seen to be cheaper than buying the
expensive beverage (Soda, example as in Cocacola) that may last for a while and for a few
number of people, Critical consideration from the seller‟s point of view reveals that they want to
produce and sell as much as they can for profits. As consumers‟ choices are numerous and as
competition amongst the sellers become bigger, they are faced with more problems in achieving
their target. Kotler et al., (2005) supports the argument that consumers will base the judgement
of a product‟s value on the prices that competitors charge for similar products. This problem
makes it more important for sellers to look for better alternatives and as result of this, sales
promotion is one of the strategies that can be used. It is a marketing activity that are usually
specific to a time period, place or customer group, that encourage a direct response from
consumer or marketing intermediaries, through the offer of additional benefits (Peattie & Peattie
1994). Sellers may get it right with this strategy while it does not still work for some, but for the
sellers it would work for; there is another threat to its total success, what would happen to this
business and its sales after the promotion is ended?
These problems have led the researcher to ask few questions as far as the research work is
concerned which are:
What are the effects of sales promotion on sales of beverages? Have these effects been able to
influence sales positively or negatively? How can a seller be sure if sales promotion is the right
promotional mix to be used in order to be successful? What more can be done to make this
strategy yield better result for the seller?
1.3 Purpose
The purpose of this study is to analyse and discuss the effects of sales promotion on the sales
of beverages and unfold the benefit in sales increase that is inherent in the use of sales promotion
after the promotional period.
1.4 Research Question
In line with the problem statement and the purpose in this study, the researcher has set up
two questions which will be the research questions and those are:
1. What is the effect of sales Promotion on the sales of Beverages?

4
2. Does the result of sales promotion go beyond the promotional period?
1.5 Methodology
The empirical study will be conducted as a quantitative research that compares different time
promotional periods with respect to the prices, quantities of beverages sold. Lind, Marchal and
Wathen (2008) defines quantitative variable as the variable that can be reported numerically.
Quantitative data will be used in the analysis of this project work and thus quantitative research
will be done. Bryman and Bell, (2007) discusses that quantitative research can be seen as a
research strategy which emphatically suggest quantification in the collection and analysis of the
data and thereby a deductive approach is being put to play in other to understand the relationship
between the theory and research, Bryman continued with his argument that quantitative research
embodies a view of social reality as an external, objective reality. However, Qualitative research
is seen as a research strategy that usually emphasizes words rather than quantification in the
collection and analysis of data and it predominantly emphasize an inductive approach to the
relationship between theory and research (Bryman and Bell, 2007).
1.6. Delimitation
Axfood Snabbgross has twenty retail stores spread across Sweden with the headquarter
office located in Stockholm. In this research work, the researcher will limit his data findings to
the retail branch in Västerås. Each retail store has a right to organize its own promotion at a
chosen period. Hence, this research work will be limited to the activities that have taken place at
the branch in Västerås.
1.7. Thesis Structure
Having introduced this project work, the next chapter will focus on the conceptual theories
employed. Chapter three will explain the methods that are used in the thesis, in chapter four, the
empirical findings is being presented while chapter five presents the proper analysis of the
empirical materials in connection to the conceptual theories stated. Chapter six has the
conclusion and the recommendation.

5
2 THEORETICAL FRAMEWORK This chapter deals with the review of relevant academic literature. The concepts
discussed focuses on the Selling strategy (Sales Promotion), Sales quantity as the end reason
behind the usage of the sales promotion strategy from the seller’s point of view and Consumer
behaviour to buying as the researcher believes it has an effect on sales when consumers are
taking a buying decision.
In addition to this, the researcher will discuss the purpose, the effects, the activities involved,
the measurement, the consumer buying behaviour and the Limitations to the use of sales
promotion.
2.1 Sales Promotion
Different scholars have described what sales promotion is, but while different opinion
have flooded the academic world on what effect it can have on sales, the after effect of the
strategy itself has not yet been known precisely.
2.1.1 What is Sales Promotion
Sellers in the habit of trying to sell their products as much quickly as possible would
employ sales promotion strategy as a type of the promotional mix strategies. The American
marketing association defines sale promotion as those marketing activities other than personal
selling, advertising and publicity, that stimulate consumer purchasing and dealer effectiveness,
such as displays, shows and expositions, exhibitions and various non-current selling efforts not
in the ordinary routine (Kotler, 2003). „„The pressure to achieve short term results is growing as
sales promotion can be devised and implemented far more quickly than other forms of
promotional mix‟‟ (Cummings, 1997, P.5). Cummings also stated that „„sales promotion far from
being the Cinderella of the marketing world; it is one of the most useful tools for acquiring and
retaining customers‟‟ (Cummings, 1997, P.5).
2.1.2 The purpose of sales promotion
The purpose of sales promotion explains the reason why sales promotion is being used by
retailers. Marketers use sales promotion for different reasons (Belch and Belch, 1998). A free
sample will encourage customers from trying, while a free advisory service would stimulate a

6
long term relationship with a retailer. Sellers often propose the sales promotion strategy to build
up brand loyalty as advertisement is also designed to build up brand loyalty (Kotler, 2003).
There are quite a number of sales promotions tools that can be used to achieve a single goal or
set of goals. The most widely used form of sales promotion is that of the manufacturer's special
offer to businesses or to the consumers. These deals usually take the form of a temporary "price-
off" per unit sold or of a coupon introduced for a brief period in the package to enhance the unit
value (Vithala et al., 1973).
2.1.3 Limitations of Sales Promotion
While different opinions abounds, researchers have found out that there are limits to the
success of using the sales promotion strategy. One limit as described by Vithala et al., (1973)
discusses the dynamic model for sales promotion which explains that the marketing
communication tools which include advertising, sales promotion, personal selling and publicity
that sometimes should be combined in other to have a successful sales promotion campaign. In
other words, sales promotion is a part of the promotional mix and therefore, the inclusion of
other promotional mix would make it more successful. Another opinion suggests that Sales
Promotion cannot be used for a product that is out of its season, taking an umbrella for instance,
a campaign for it in the spring might be very good but in the summer would be bad. Also, not
having to put enough time for proper planning can limit the success of sales promotion. It
requires a long term planning to achieve a desirable result (Cummins, 1998).
2.2 The Effects of Sales Promotion
The effect of sales promotion on sales explains what sales promotion would do in achieving
a successful promotional campaign on the sales of products. Sales promotion adds in a number of
ways to achieving an overall promotional objective (Palmer, 1994). The effects of sales
promotion can then be seen to become an invitation for customers to want to buy now than later.
2.2.1 Long Term and Short Term effect of Sales Promotion
The mood or physiological condition when a customer is at the point of purchase can have an
impact on what is bought and can also affect the evaluation of the products (Solomon, 2010).
The usage of sales promotion can affect the mood of a customer as Solomon (2010) upholds that

7
a specific mood is some combination of pleasure and arousal. Figure 1 below presents the
processes involved from the antecedent stage (a stimulating stage for later decision) till when the
purchase is done (Short term) and the effect which the promotions will have on the post purchase
experience (Long term).
Antecedent states Purchase Environment Post-Purchase
Situational factors Shopping experience Consumer satisfaction
Usage Contexts
Time Pressure Point of purchase stimuli Product Disposal
Mood
Shopping Orientation Sales Promotion Alternative Markets
Figure 1: Sales Promotion impact, Solomon (2010).
„„One reason for the antecedent stage has been reasoned to be that consumer behavior is directed
towards certain goal states‟‟ (Solomon et al., 2010, p.60). These goals are any factor that would
bring about product satisfaction after the purchase. Three options of post purchase experience
would be the satisfaction of the customers, product disposal or the customers look for an
alternative market. Satisfied customers tend to repurchase a product and the satisfaction can
come from the role that Sales promotion plays which is an important part of the stimulating
factor that increases sales or decreases it. John Kay writes „„I see the firm as a set of relationships
between its various stakeholders, that is the employees, customers, investors, shareholders and
the successful firm is one that operates in an environment which maximizes the value of that
distinctiveness‟‟ (Cummins, 1998, p.11). The values created by the seller may be a factor that
decides on its long term relationship or the short term with its esteemed customers. The effect of
employing sales promotion strategy in market communication can gain new users when
consumers are satisfied. Dissatisfied customers tends to look for alternative market where they
could get valued products at the cheapest price. The success that has been seen with the use of
sales promotion has made it unavoidable for companies to neglect. A company that wants to
withstand the test of time is almost compelled to use sales promotions that aligns with those of
other major competitors, whether retailers or other manufacturers (Harrell and Frazier, 1998).

8
More of the roles that sales promotion takes in marketing communication are the short term
financial focus, managerial accountability, brand performance and brand expansion (Chris, 2005)
2.2.2 Effects of Sales Promotion on Consumer Buying Behavior
Consumer decision-making process is adjusted according to the complexity of the purchase.
Decision making in more complex offerings include more information search and evaluation
than decisions in simple offerings and thus the process lasts longer (Kotler, 2005). In an extreme
situation, consumer can even feel that the service offered through the promotional activity is too
complicated and decides not to purchase at all. On the contrary, decision making in simple
products can be very straightforward. When a need is actualized, consumer might move straight
to buying without searching information or evaluating alternatives. In these situations, consumer
just buys the product that is familiar or reaches in for a competing product (Kotler, 2006, p.157).
Harrel and Frazier (1998) contend that sales promotion is an excellent tool for organizations.
Harrel (1998) went on to explain that a category of customers that switches from one product to
another would purchase a number of different brands and that switchers cut their overall
expenditures by finding the best deal at a time. The customers would regularly switch or
sometimes switch once they see an opportunity to increase value or decrease price. Sales
promotion would certainly work on the switchers since they are prone to purchase opportunities.
Sales promotions make decision-making easier for consumers as it makes cognitive shoppers
selects brands that offers increased value and improves the „„level of convenience associated
with the shopping experience‟‟ (Chris, 2005, p.639). Different scholars have debated on what
happens with consumer decision to buying after sales promotion activity is withdrawn. Chris
(2005) argues that once a promotion is withdrawn, satisfied customers will return to the brand
not supported by sales promotion but still with other forms of promotion like advertisement.
Chris (2005) claims that advertisement is most necessary as an additional activity in order to
maintain an awareness of the brand and its existing values. However, Davis et al., (1992)
reasoned that price promotions do not have effect on consumers´ quality perceptions and
promotions do not change the long-term purchase patterns of an established brand. Davis et al.,
(1992) further explained that there are some consumers that are already loyal to certain products
and all they want more is value adding promotion which gives them something extra to benefit

9
from the product and not a price cut or any other kind of promotion. A typical example of what
could happen will be realised in this project work.
2.3 Sales Promotion Activities „„The consequence of having sales promotion can result in large sales effects for a certain
type of a product or products‟‟ (Neslin 2002, p.12), which can increase the sales in the short-
term. However sales increase that happens as a result of sales promotion activities in the short-
term, does not necessarily mean that it can always be beneficial for long-term period (Heerde et
al., 2004). But since sales promotion result in large sales effects in short-term period, that could
make manufacturer or retailers to use such activity.
Sales Promotion activities are numerous. It can be broken down into two categories; consumer-
oriented promotions and trade-oriented promotions (Belch and Belch, 1998).
1. Consumer Oriented Sales Promotions: Research has shown that sales promotions increase
the likelihood for repeat purchases. If consumers are satisfied with the brand that is being
promoted, it is more likely that they will also buy it later after the promotion is over.
(Peattie & Peattie, 1993). Activities in consumer oriented sales promotion involve
sampling, couponing, premiums, contests and sweepstakes, event sponsorship and price
offs (Belch and Belch, 1998). The customers are the final purchaser of these goods that
are being promoted.
2. Trade-Oriented Promotions: Industries use several promotional tools (Kotler et al, 2005).
These includes Point of purchase displays, sales training programs, dealer incentives,
contests, trade allowances and co-operative advertising. A close relationship between
trade and consumer promotion in the retail trade must be assured. „If a promotion with a
trade succeeds, but lacks a strong consumer element, it may still succeed with the
consumer simply because of the display and volume of support of the retailer‟ (Cummins,
1998).

10
Table 1: Sales Promotion Activities
Activities Definition Contribution to sales
Coupons „„Coupons are certificates that
gives buyers a saving when
they purchase specified
products‟‟ (Kotler et al., 2005,
p.788)
Coupons are mostly known for
its role in stimulating sales of
a mature brand or a new
brand. But, excessive use of it
could result in a decline in the
redemption rate. Hence careful
consideration must be given to
the campaign when taking the
usage of coupons into
consideration
Samples „„Samples are offers of a trial
amount of a product‟‟ (Kotler
et al.,2005, p.788)
Sampling has been considered
to be the effective tool of sales
promotion but it has also been
tagged to be the most
expensive way to introduce a
new product. In practice, it is
seen to be a loss if after giving
out this samples, consumers
fail to turn up to purchase
Premiums „„Premiums are goods offered
either free or at low costs as
an incentive to buy a product‟‟
(Kotler et al., 2005, p.788)
Premium and samples are
somewhat related in its
activities as they both include
offers either for free or at a
low cost. The difference in
premiums and samples is in
the fact that sampling does not
have to go with a product
while premium is seen to be
offered with the product to
buy
Point of Purchase „„POP promotions include
displays and demonstrations
that take place at the point of
purchase or sale‟‟ (Kotler et
al., 2005, p.788)
As it is becoming a nightmare
for retailers to handle the
hundreds of displays, offering
POP by trying them on the
television and offering to set
them up has become a
necessity for the manufacturer
Sweepstakes „„Sweepstakes are promotions
that offer customers the
chance to win something
(cash, goods or trips) by luck
or extra effort‟‟ (Kotler et al.,
2005, p.788)
A sweepstake calls for
consumers to submit their
names for a draw

11
Price packs „„Price packs offer consumers
savings off the regular price of
a product‟‟ (Kotler et al.,
2005, p.788)
Price packs are very effective
even more so than coupons in
stimulating short term sales
(Kotler et al., 2005, p.788)
Sales contests „„A contest for sales people or
dealers to urge their sales
force to increase their efforts
over a given period‟‟ (Kotler
et al., 2005, p.791)
Sales contests are seen to
work better when they are tied
to measurable and achievable
sales objectives. It has also
been seen to motivate and
recognize companies that
perform better (Kotler et al.,
2005, p.791).
2.4 Measurements of Sales Promotion
Measurement in sales promotion is very important in considering its usefulness. A good
evaluation system is used by all those in the organization who runs promotions (Cummins, 1998,
p.107). Cummins (1998) further stresses that there are clearly the planning aspect to take into
consideration which has the time required to organize and evaluate the test as the most important
factor. Primarily, there are three measures of the results of a promotion (Cummins, 1998, p.109).
They are:
1. Promotional Response: According to Cummins (1998), promotional response includes
consumer uptake of the promotion, results of any market research or surveys undertaken,
trade or sales force comment.
2. Sales: According to Cummins (1998), The quantity sold itself is very vital in the actual
measurement, the sales figure for the periods before, during and after the promotion and
the relevant figures for competitors products are two measures of sales promotion when
sales is to be used as a measuring factor.
3. Finance: According to Cummins (1998), The cost incurred in organizing and executing
the sales promotion and the trade discount would also double as a count in the
measurement

12
3 METHODS This chapter explains the processes that were executed in writing this thesis. It further
describes the conditions as regards to the reasons behind the selection of the empirical material
used and chosen methods used in gathering and analyzing data obtained.
3.1 Selection of Empirical Setting
3.1.1 Selection of Research topic
The research topic has been an interesting topic debated upon by many scholars today in
other to know the precise aftermath effect of employing Sales promotion strategy on the quantity
sold. Almost every company would want to use the sales promotion strategy since it has been
suggested to work in the short-term but companies do not really know what happens afterwards.
This topic is interesting since companies differ from one another in the kind of businesses they
run. Some servicing companies like banks and credit service firms would still use promotional
strategy in keeping up their service sales. A company like Resurs Bank would send an offer to a
customer to seek for loan for a particular amount within a specific period claiming to reduce the
interest that will be charged on this loan if applied for within the stated period. Manufacturers
and Retailers would rather put up a sales promotion strategy as well since Profit maximization is
their main goal.
3.1.2 Selection and Presentation of the chosen Company
Axfood conducts retail and wholesale trade in Sweden. Axfood Snabbgross, Västerås is a
branch of this business chain. The retail business is conducted through the wholly owned Willys,
Hemköp and PrisXtra chains. The Group owns 230 stores. In addition, Axfood collaborates with
a large number of proprietor-run stores that are tied to Axfood through agreements. These
include stores within the Hemköp and Willys chains as well as stores run under the Handlar‟n
and Tempo trademarks. In all, Axfood collaborates with approximately 840 proprietor-run stores.
Wholesale business is conducted through Dagab and Axfood Närlivs. Axfood is listed on Nasdaq
OMX Stockholm AB‟s Large Cap list. Axel Johnson AB is the principal owner with
approximately 46% of the shares. Axfood has an approximate 20% share of the food retail
market in Sweden. Axfood‟s organization is characterized by few decision-making levels and
strong focus on low administrative costs. At the central level the Group achieves economies of
scale in such functions as purchasing, private label products, logistics, IT, finance, human

13
resources and business development. The management teams of the individual chains are
responsible for store operations, marketing, and product range and pricing strategies. The
individual store managers/proprietors interact with their customers on a daily basis and have day-
to-day responsibility for ensuring that their stores are appealing and well-stocked, and for
treating customers in a professional manner in accordance with the profile of their respective
chains.
Table 2: Axfood ANNUAL REPORT 2010 sourced from www.Axfood.se
2010 2009 2008 2007 20061
Net sales 34,260 32,378 31,663 29,189 28,808
Operating profit 1,209 1,128 1,077 1,121 1,204
Operating margin, % 1) 3.5 3.5 3.4 3.8 3.9
Profit after financial items 1,172 1,082 1,011 1,086 1,183
Profit after tax 862 793 737 781 852
Earnings per share, SEK 16.42 15.13 14.05 14.88 16.03
Equity ratio, % 38.8 36.7 30.7 32.6 39.8
Ordinary dividend2 12.00 10.00 8.00 12.00 12.00
Average number of employees during the year 6,895 6,816 6,847 6,463 6,569
1) For 2006 excluding compensation of SEK 89 m from the settlement with the Vi Retailers
Association.
2) Proposed by the Board of Directors.
Graphically, the net sales and the sales margin can be represented by:

14
3.1.3 Approach to the Research method
In order to be able to analyze the purpose of the data collected in this project work accurately, a
reliable method must be chosen carefully. Quantitative and Qualitative methods are the two
approaches that can be used in a research project work (Bryman, 2004). Quantitative research
would involve collection and analysis of different kinds of empirical materials such as case
study, personal experience, introspective, interview, observation etc. while Qualitative approach
explains an interpretive quality in a naturalistic approach to the subject matter, Qualitative
analysis is usually carried out around its natural settings attempting a goal towards a definite
interpretation and in terms of its true meaning (Denzin and Lincoln (1994) in Creswell (1998)).
In light of the above arguments, quantitative research approach will be used in other to
accomplish the aim of this research
3.2 Methods to collect Secondary data
Secondary sources: articles, internet, Journal articles,
The secondary source varies from articles as well as the internet where we downloaded papers
and documents. Also, the Journal articles have been taken from Mälardalen University‟s
database, this source has greatly provided the researcher with general information on the
promotional effect of sales of beverages. Secondary data has been known to be an information or
data that already exists somewhere for a purpose but collected for another purpose (Kotler et al.,
2005). The secondary data collected in this research work was helpful in writing the theoretical
framework and the general concepts of this piece of research. However, Kotler et al., (2005)
presents the advantages and the disadvantages of the secondary data. The advantages are that it
can be obtained more quickly and at a lower cost while the disadvantages could arise from the
inability to find the needed information or data or severally while this research work was going,
the researcher sometimes found several sources that were not relevant. Kotler (2005) concretize
the point by explaining that careful evaluation of the secondary sources must be established for
the sake of its relevancy, accuracy, currency and impartiality.
Having secondary data cannot be enough when embarking on a research work, even though, it
provides the avenue to constructively state the problems and the objectives (Kotler et al., 2005),
primary data is very important especially when it comes to a quantitative research method.

15
3.3 Methods to collect Primary data
Person to person contact and the data collected from Axfood‟s database are the primary
data used in this thesis work. Kotler et al., (2005) defines primary data as consisting of
information that is collected for a specific purpose at hand. Person to person contact was with the
snabbgrosschef of Axfood snabbgross who has the right to access the Axfood‟s database. The
data collected were taken by administering questionnaire that was sent to Axfood Snabbgross,
Västerås. Questionnaire according to Bryman and Bell, (2011) can be seen to be self-completed
questionnaire. „„Self-completed questionnaire has its respondents answer the questions by
completing the questionnaire themselves‟‟ (Bryman & Bell, 2011, p.231). Self-completed
questionnaire comes in many ways including the postal questionnaire where a set of questions
are being sent by post, respondents fill it in and return to the researcher (Bryman & Bell, 2011).
The Questions that were sent to Axfood for use in this study was divided into two steps. First
step was done by having the basic questions concerning whether Axfood have used sales
promotion strategy in their business, the types of sales promotion, the product range. In the
second step, the questions covered all the necessary data on the promotional period times,
quantity sold and prices.
3.3.1 Data frame
The database frame covered the entire data the researcher will get from Axfood
Snabbgross and this will include the data for two products (CocaCola and Premium: CocaCola
being the most expensive of the beverages Axfood sells and Premium being the cheapest) and
two periods (Year 2010) as the period during the promotion and the other period will be after the
promotion had ended) on the following variables:
1. The quantity sold
2. The Price (During and After)
3. The Period (During and after the promotion)
3.3.2 Research Instrument
As mentioned earlier in this method section, raw data from Axfood database is the main
data that was used in the analysis of this research work. The structure of the needed data which
would be convenient for the researcher to use was designed and submitted to the sales chief

16
officer at Axfood. Kotler et al., (2005, p.356) states that in collecting primary data, researchers
have a choice of using questionnaire. Questionnaire consists of a carefully arranged set of
questions presented to a respondent for his or her answers.
3.4 Methods to analyze data
The methods to analyze the collected data involve using simple index number as the
statistical tool and hypothesis testing as the analyzing technique.
3.4.1 Statistical Tool
The statistical tool used in the analysis of this research work is Simple percentages otherwise
called Simple Index number. „„Index number is a number that expresses the relative change in
price, quantity or value compared to the base period‟‟ (Lind et al., 2008, p570). The reason for
the adoption of index instead of working with raw data is because of the ease of expression when
the data has been refined. Index is a convenient way to express a change in a diverse group of
items (Lind et al., 2008). Lind further explains that converting data to indexes makes it more
convenient to assess the trend in a series composed of exceptionally large numbers. Axfood
snabbgross is a retail store with a large customer and sales base, hence the need to employ this
method in order to be able to analyze the received data accurately.
The formula used for the data analysis is based on the variables (Price and Quantity sold) and in
relation to each period.
For the price index during the promotional period, P1=
For the Price index after the promotional period, P2=
Where Pt=Selected Period price,
And =Base period price.
A and B are the price promotional periods (Before and After).
The same formula will be used to calculate the quantity index which will be as follows:
Quantity Index during the promotional period, Q1=
Quantity index after the promotional period, Q2=
Where Qt=Selected Quantity

17
And =Base Quantity
A and B are the quantity promotional periods (Before and After).
3.4.2 Statistical Technique
Hypothesis testing has been an effective way of solving a theoretical problem when there
is empirical evidence. „„Hypothesis have advantage that they force researchers to think
systematically about what they would study and helps them to make plans accordingly‟‟
(Bryman and Cramer, 2001, p3). The usage of data is very important in checking the
reasonableness of a statement. Lind et al., (2008, p331) defines hypothesis as a statement about a
population parameter subject to verification. Lind et al., (2008) further claims that having a
hypothesis would require data collection and the data will be used to test the assertion. There are
five step procedures for testing a hypothesis;
The first step requires stating the Null and the Alternate hypothesis. Null hypothesis written as
H0 is a statement about the value of a population parameter developed for the purpose of testing
numerical evidence while Alternate hypothesis written as H1 is a statement that is accepted if the
sample data provide sufficient evidence that the null hypothesis is false (Lind et al., 2008, p.333).
In the structure of this research work,
The Null hypothesis will be H0: Sales promotion does not affect increase or decrease in the sales
of beverages during or after the promotional period and,
The Alternate hypothesis will be H1: Sales promotion affects the increase or decrease in the sales
of beverages during or after the promotional period.
The statistical technique to be used in testing the null hypothesis in this project work would be Z-
score. Lind et al., (2008, p.335) writes the formula for Z-score in a sample test to be, Z=
.
Z is based on the sampling distribution of mean X
Mean X is the sampling mean.
is the hypothesized Population mean
n= is the number of observation(s) in the samples
is the sample standard deviation
The sampling distribution will lie between a critical value of -1.96 and +1.96 with a chosen level
of significance at 0.95 will prove that the estimate is right, in other words, I am likely to be

18
wrong only 5% (0.05) of the time in this estimate. Level of significance is the probability of
rejecting the null hypothesis when it is true (Lind et al., 2008, p.334). A two-tailed test is
required because the hypothesized result will either be that the population mean at one period is
significantly lesser or greater than the population mean at the other promotional period.
Mathematically written,
H0: 1 2
H1: 1 2
Where 1 = Hypothesized Population mean at a certain promotional period
And 2 = Hypothesized Population mean at the other promotional period.
The decision rule: The decision rule will be based on the achieved result from the level of
significance. If the computed Z-value falls in the rejection region, then the hypothesis will be
rejected otherwise the hypothesis will be accepted.
3.5 Validity and Reliability
Bryman and Cramer (2001) contend that measurement device would be reliable and valid
when a concept has been operationally defined. A measure of a concept must have been
proposed to have a valid and a reliable result. The reliability of a measure refers to its
consistency (Bryman and Cramer, 2001, p.62) while the validity draws attention to how far a
measure really measures the concept that it purports to measure (Bryman and Cramer, 2001,
p.66). Different types of the idea of validity can be distinguished, these includes measurement
validity, internal validity, external validity and ecological validity.
Measurement Validity commonly referred to as construct validity essentially deals with the
question of whether or not a measure that is devised of a particular concept really does reflect the
concept that it is supposed to be denoting (Bryman and Bell, 2011, p42). In this thesis work, it is
to confirm if sales promotion strategy as a concept can truly be used to measure the amount of a
particular good being sold by a company.
Internal Validity is concerned majorly with the question of whether a conclusion that
incorporates a casual relationship between two or more variables can be trusted (Bryman and
Bell, 2011). In this project work, questions can be asked as to the possibilities of the relationship
between the different time periods at different prices and the quantity of goods sold. How true is
19
it that the variations in the prices at different times caused the variations in the quantity of goods
sold and not something else like the consumer behavior arbitrarily that causes the variation?
On the other hand, issues can be confirmed reliable considering three basic factors
including the stability of the measure, the internal reliability and the inter-observer consistency
(Bryman and Bell, 2011). The internal reliability issues comes from the point of view that
indicators used in analyzing a research work may not relate to each other, in other words, where
they lack coherence. The concept to be used in a project work must be confirmed to relate to
each other in the best possible way. The stability consideration questions whether or not a
measure is stable over time so as to put out the doubt of having the results relating to that
measure for a sample of respondents fluctuating.
20
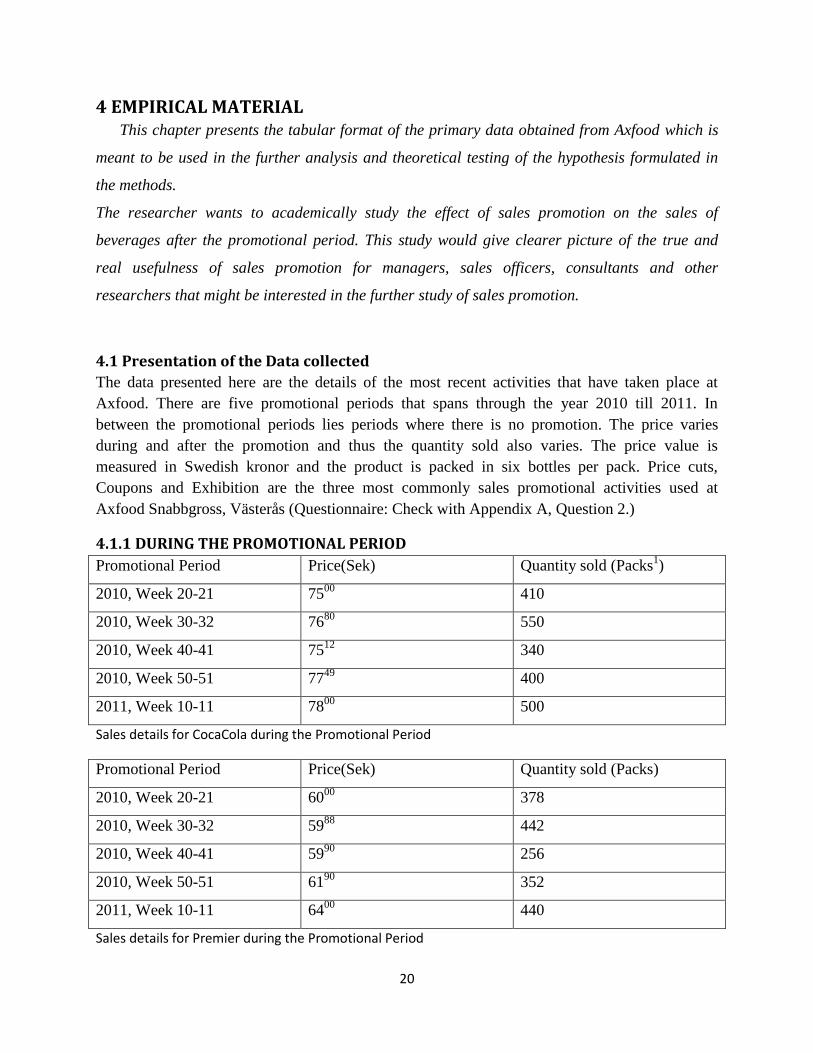
4 EMPIRICAL MATERIAL This chapter presents the tabular format of the primary data obtained from Axfood which is
meant to be used in the further analysis and theoretical testing of the hypothesis formulated in
the methods.
The researcher wants to academically study the effect of sales promotion on the sales of
beverages after the promotional period. This study would give clearer picture of the true and
real usefulness of sales promotion for managers, sales officers, consultants and other
researchers that might be interested in the further study of sales promotion.
4.1 Presentation of the Data collected
The data presented here are the details of the most recent activities that have taken place at
Axfood. There are five promotional periods that spans through the year 2010 till 2011. In
between the promotional periods lies periods where there is no promotion. The price varies
during and after the promotion and thus the quantity sold also varies. The price value is
measured in Swedish kronor and the product is packed in six bottles per pack. Price cuts,
Coupons and Exhibition are the three most commonly sales promotional activities used at
Axfood Snabbgross, Västerås (Questionnaire: Check with Appendix A, Question 2.)
4.1.1 DURING THE PROMOTIONAL PERIOD
Promotional Period Price(Sek) Quantity sold (Packs1)
2010, Week 20-21 7500
410
2010, Week 30-32 7680
550
2010, Week 40-41 7512
340
2010, Week 50-51 7749
400
2011, Week 10-11 7800
500
Sales details for CocaCola during the Promotional Period
Promotional Period Price(Sek) Quantity sold (Packs)
2010, Week 20-21 6000
378
2010, Week 30-32 5988
442
2010, Week 40-41 5990
256
2010, Week 50-51 6190
352
2011, Week 10-11 6400
440
Sales details for Premier during the Promotional Period

21
4.1.2 AFTER THE PROMOTIONAL PERIOD
Promotional Period Price(Sek) Quantity sold (Packs)
2010, Week 20-29 8100
2170
2010, Week 33-39 8100
2510
2010, Week 42-49 7800
1490
2010/2011, Week 52-09 8400
1800
2011, Week 12-18 8340
2170
Sales details for CocaCola after the Promotional period
Promotional Period Price(Sek) Quantity sold (Packs)
2010, Week 22-29 6810
1700
2010, Week 33-39 6774
1930
2010, Week 42-49 7206
1070
2010/2011, Week 52-09 7188
1540
2011, Week 12-18 7088
1860
Sales details for Premier after the Promotional period
(1) Packs were counted in six bottles of CocaCola and Premier Drinks per Pack. In other words,
there are six bottles in one pack.

22
5 ANALYSIS AND INTERPRETATION This chapter contains the interpretation and analysis of the data collected as it relates to
the theoretical method and in line with the purpose of this research work.
5.1 Interpretation of the Data Collected
The data collected shall be interpreted in this section into index values and the weeks
involved as the frequency period of purchase. All indexed data in this thesis work shall be
approximated to two decimal places
Table 5.1: PRICE AND QUANTITY INDEX VALUE FOR COCACOLA AFTER SALES
PROMOTION
FREQUENCY(WEEK) PRICE INDEX(SEK) QUANTITY INDEX(PACK)
8 19.88 19.74
7 19.88 25.28
8 19.15 15.01
10 20.62 18.13
8 20.47 21.85
Table 5.1 shows the promotional period as it relates to the prices given and the quantity sold. The
first period which spans between weeks 22 and 29 in the year 2010, counts for 8 weeks in
between. (i.e from week 22 to 29). The number of weeks in between differs from one period to
another especially as it is seen longer in the fourth period. Also from the indexed values of the
prices and quantities sold, variations can be seen in the effect of the prices and periods on the
quantities sold.
TABLE 5.2: PRICE AND QUANTITY INDEX VALUE FOR COCACOLA DURING SALES
PROMOTION
FREQUENCY(WEEK) PRICE INDEX(SEK) QUANTITY INDEX(PACK)
2 19.61 18.64
3 20.08 25.00
2 19.64 15.45
2 20.26 18.18
2 20.40 22.73

23
Table 5.2 shows less variation in the indexed quantity due to the condition of sales promotion
that is present, the frequency (Promotional week period) is also seen to be much less than it is
after the promotional period.
TABLE 5.3: PRICE AND QUANTITY INDEX VALUE FOR PREMIER AFTER SALES
PROMOTION
FREQUENCY(WEEK) PRICE INDEX(SEK) QUANTITY INDEX(PACK)
8 19.42 20.99
7 19.32 23.83
8 20.55 13.21
10 20.50 19.01
8 20.21 22.96
As it can be seen also from the previous tables above, sales quantity tends to drop at a record
high in the third period, probably due to the winter season around which could be a factor for
consumers to change their buying habit.
TABLE 5.4: PRICE AND QUANTITY INDEX VALUE FOR PREMIER DURING SALES
PROMOTION
FREQUENCY(WEEK) PRICE INDEX(SEK) QUANTITY INDEX(PACK)
2 19.63 20.24
3 19.59 23.66
2 19.60 13.70
2 20.25 18.84
2 20.94 23.55
From table 5.4, it can be seen that there are no much difference between the indexed quantities
sold for premier drink during and after the promotional period. This decision is still not yet
proven until it has been hypothetically tested.

24
5.2 Hypothesis Testing
The researcher has introduced some hypothesis which would be tested through the analyzed data
by the use of the mean, standard deviation and the z-score. In this hypothesis testing, Quantity
sold will be tested against the frequent period which is measured in weeks. This method is
necessary to be used because the researcher actually wants to test for the effect of the strategy of
sales promotion based on the promotional period and on the sales (Quantity sold). The Prices are
a deciding factor of the promotional period sales established by the retailer and thus it will be left
out in this testing since the researcher is not testing directly for the effect of price on the quantity
sold.
Hypothesis 1:
H0: Sales Promotion has no significant effect on the sales of cocacola after the promotional
period
H1: Sales Promotion has significant effect on the sales of cocacola after the promotional period.
To test this hypothesis, response to table 5.1 will be used
Table 5.5
Variables/Prices X F FX X- (X- )2 F(X- )
2
19.88 19.74 8.00 157.92 -0.06 0.00 0.00
19.88 25.28 7.00 176.96 5.48 30.03 210.21
19.15 15.01 8.00 120.80 -4.79 22.94 183.52
20.62 18.13 10.00 181.30 -1.67 2.79 27.90
20.47 21.85 8.00 174.80 2.05 4.20 33.60
TOTAL 41.00 811.78 455.23
(a) Mean ( )=
= 811.78/41
= 19.80
(b) Population Standard Deviation ( )=
=
= 3.33
(c) Standard Error mean (S ) =
=
= 0.52

25
(d) Population Mean ( ) = Mean 1.96 0.52 (Holding 1.96 as a constant figure and 0.52
being the Standard error mean). Thus the population mean = 19.80 1.96(0.52)
=19.80 1.02 = 18.78 or 20.82
Note the researcher can certainly assert that with a probability of 0.95 or 95%, that the interval of
18.78 to 20.82 contains the true population mean or average of the distribution. Thus the level of
significance shall be 5% = 0.05
To be able to compute the zcal, the formula given by Lind et al., (2008) shall be applied.
Zcal=
=
= 1.962.
Hence, the Zcal=1.962
Decision:
At 0.05 level of significance, the critical value of Z= 1.96, the obtained value of Zcal=1.962 falls
in the rejection region. Thus, we reject the null hypothesis that sales promotions have no
significant effect on the sales of cocacola after the promotional period. In other words, there is a
significant effect; hence we accept the alternate hypothesis (H1)
Interpretation of Result
Since the Zcal =1.962, it falls in the rejection region where the null hypothesis should be rejected.
This has happened because the probability of having a sample mean as much as 19.80 when the
population mean is 18.78 less at the 0.05 level of significance. Thus, the null hypothesis will be
rejected and the alternative hypothesis is accepted that sales promotion has a significant effect on
the sales of CocaCola after the promotional period. This in relation to the theories discussed in
this project work earlier on show that the stimulating effect of the long term processes involved
in the usage of sales promotion holds true making sales quantity to go quite higher than it would
normally be.
Hypothesis 2
H0: Sales Promotion has no significant effect on the sales of cocacola during the promotional
period
H1: Sales Promotion has significant effect on the sales of cocacola during the promotional
period.
To test this hypothesis, response to table 5.2 will be used

26
Table 5.6
Variables/Prices X F FX X- (X- )2 F(X- )
2
19.61 18.64 2.00 37.28 -1.81 3.28 6.56
20.08 25.00 3.00 75.00 4.55 20.70 62.10
19.64 15.45 2.00 30.90 -5.00 25.00 50.00
20.26 18.18 2.00 36.36 -2.27 5.15 10.30
20.40 22.73 2.00 45.46 2.28 5.20 10.40
TOTAL 11.00 225.00 139.36
(a) Mean ( )=
= 225/11
= 20.45
(b) Population Standard Deviation ( )=
=
= 3.56
(c) Standard Error mean (S ) =
=
= 1.07
(d) Population Mean ( ) = Mean 1.96 1.07 (Holding 1.96 as a constant figure and 0.52
being the Standard error mean). Thus the population mean = 20.45 1.96(3.82)
=20.45 2.10 = 18.35 or 22.55
Either both levels of the population mean can as well be used. The researcher can certainly assert
that with a probability of 0.95 or 95%, that the interval of 18.35 to 22.55 contains the true
population mean or average of the distribution. Thus the level of significance shall be 5% = 0.05
To be able to compute the zcal, the formula given by Lind et al., (2008) shall be applied.
Zcal=
=
= 1.963
Hence, the Zcal=1.963
Decision:
At 0.05 level of significance, the critical value of Z= 1.96, the obtained value of Zcal=1.963 falls
in the rejection region. Thus, we reject the null hypothesis that sales promotions have no
significant effect on the sales of cocacola during the promotional period. In other words, there is
a significant effect; hence we accept the alternate hypothesis (H1)

27
Interpretation of Result
Since the Zcal =1.963, it falls in the rejection region where the null hypothesis should be rejected.
This has happened because the probability of having a sample mean as much as 20.45 when the
population mean is 18.35 less at the 0.05 level of significance. Thus, the null hypothesis will be
rejected and the alternative hypothesis is accepted that sales promotion has a significant effect on
the sales of CocaCola during the promotional period. This interpretation in relation to the
theoretical framework explained in this study mean that sales promotion is a true stimulating
factor that can help decide a sales increase even in the short term while the promotional strategy
is on. The difference in the increase between the short term and the long term can be made
justified according to what Solomon (2010) discusses that a specific mood aided by sales
promotion strategy can lead to a behavior which will have some combination of pleasure and
arousal that can make consumers buy or wanting to buy more than needed.
Hypothesis 3
H0: Sales Promotion has no significant effect on the sales of premier after the promotional period
H1: Sales Promotion has significant effect on the sales of premier after the promotional period.
To test this hypothesis, response to table 5.3 will be used
Table 5.7
Variables/Prices X F FX X- (X- )2 F(X- )
2
19.42 20.99 8.00 167.92 1.13 1.28 10.24
19.32 23.83 7.00 166.81 3.97 15.76 110.32
20.55 13.21 8.00 105.68 -6.65 44.22 353.76
20.50 19.01 10.00 190.10 -0.85 0.72 7.20
20.21 22.96 8.00 183.68 3.10 9.61 76.88
TOTAL 41.00 814.19 558.40
(a) Mean ( )=
= 814.19/41
= 19.86
(b) Population Standard Deviation ( )=
=
= 3.69

28
(c) Standard Error mean (S ) =
=
= 0.58
(d) Population Mean ( ) = Mean 1.96 0.58 (Holding 1.96 as a constant figure and 0.58
being the Standard error mean). Thus the population mean = 19.86 1.96(0.58)
= 19.86 1.14 = 18.72 or 21.00
Note the researcher can certainly assert that with a probability of 0.95 or 95%, that the interval of
18.72 to 21.00 contains the true population mean or average of the distribution. Thus the level of
significance shall be 5% = 0.05
To be able to compute the zcal, the formula given by Lind et al., (2008) shall be applied.
Zcal=
=
= 1.966
Hence, the Zcal=1.966
Decision:
At 0.05 level of significance, the critical value of Z= 1.96, the obtained value of Zcal=1.966 falls
in the rejection region. Thus, we reject the null hypothesis that sales promotions have no
significant effect on the sales of premier after the promotional period. In other words, there is a
significant effect; hence we accept the alternate hypothesis (H1)
Interpretation of Result
Since the Zcal =1.966, it falls in the rejection region where the null hypothesis should be rejected.
This has happened because the probability of having a sample mean as much as 19.86 when the
population mean is 18.72 less at the 0.05 level of significance. Thus, the null hypothesis will be
rejected and the alternative hypothesis is accepted that sales promotion has a significant effect on
the sales of premier after the promotional period.
Surprisingly, Sales of Premier went up so high in the long term compared to the sales of
CocaCola. In these cases, the promotional activities that are used can be the factor that has
contributed to the better increase in the sales quantity of premier. Also, the seasonal factor which
may be an absolute reason for consumers in a particular season (Forinstance in the Summer) that
wants to have more drinks than usual and knowing that Premier is cheaper.

29
Hypothesis 4
H0: Sales Promotion has no significant effect on the sales of premier during the promotional
period
H1: Sales Promotion has significant effect on the sales of premier during the promotional period.
To test this hypothesis, response to table 5.4 will be used
Table 5.8
Variables/Prices X F FX X- (X- )2 F(X- )
2
19.63 20.24 2 40.48 -0.09 0.01 0.02
19.59 23.66 3 70.98 3.33 11.09 33.27
19.60 13.70 2 27.40 -6.63 43.96 87.91
20.25 18.84 2 37.68 -1.49 2.22 4.44
20.94 23.55 2 47.10 3.22 10.37 20.74
TOTAL 11 223.64 146.38
(a) Mean ( )=
= 223.64/11
= 20.33
(b) Population Standard Deviation ( )=
=
= 3.65
(c) Standard Error mean (S ) =
=
= 1.10
(d) Population Mean ( ) = Mean 1.96 1.10 (Holding 1.96 as a constant figure and 1.10
being the Standard error mean). Thus the population mean = 20.33 1.96(1.10)
=20.33 2.16 = 18.17 or 22.49
Note the researcher can certainly assert that with a probability of 0.95 or 95%, that the interval of
18.17 to 22.49 contains the true population mean or average of the distribution. Thus the level of
significance shall be 5% = 0.05
To be able to compute the zcal, the formula given by Lind et al., (2008) shall be applied.
Zcal=
=
= 1.964.
Hence, the Zcal=1.964

30
Decision:
At 0.05 level of significance, the critical value of Z= 1.96, the obtained value of Zcal=1.964 falls
in the rejection region. Thus, we reject the null hypothesis that sales promotions have no
significant effect on the sales of premier during the promotional period. In other words, there is a
significant effect; hence we accept the alternate hypothesis (H1)
Interpretation of Result
Since the Zcal =1.964, it falls in the rejection region where the null hypothesis should be rejected.
This has happened because the probability of having a sample mean as much as 20.33 when the
population mean is 18.17 less at the 0.05 level of significance. Thus, the null hypothesis will be
rejected and the alternative hypothesis is accepted that sales promotion has a significant effect on
the sales of premier during the promotional period.
There are limits to sales promotion, sometimes when it is overused or not properly used, it might
loose its value thereby making the consumers not to have much interest in the promotion on the
product. There are also few customers that are already loyal to the product and what more they
need is an additional value to the goods they are loyal to as the theoretical framework of this
study presented the idea. Those customers want more of new values like rebranding where
necessary to the product and not the sales promotion activities like lower pricing that might be
placed on the product.

31
6 SUMMARY, CONCLUSION AND RECOMMENDATION In this chapter, summary of the thesis work will be presented and concluded. Also,
recommendation as further use of this thesis work will be presented.
6.1 Summary and Conclusion
The use of sales promotion has been seen to become increasingly popular as a means by
which industries communicate with the target audiences because of the competitor‟s usage of
sales promotion, increase in the number of brands, declining strength of advertisement to
promotions. In periods when consumers want to buy more valued goods at the cheapest possible
price, managers rely on periodic sales promotion to stimulate this demand and the event is
expected to increase even the more over time possibly reaching every sector of customer and
trade oriented industries. There have been lots of established researches carried out on sales
promotion as to its effects on brand switching and consumption but many researchers have been
quite silent to establish a theoretical stand whether it encourages sales quantity hoping that it
automatically does. Some have theoretically proved that it does not encourage sale quantity in
the long term. sales promotion should be seen to become less effective if it cannot encourage
increase in sales quantity. Because of this, in other to justify the huge funds pumped into having
a successful sales promotion campaign, it has become imperative to study the effect of sales
promotion on the sales of convenience goods (Beverages in this research work). The findings of
the research have clearly shown that sales promotion is an effective tool that can be used in the
promotion of beverages. This assertion is in consonance with the data received from axfood. It
has also been established from the formulated hypothesis that sales promotion increases the level
of sales of beverages. Tested hypothesis one to four clarified the results of sales promotion
activities on Cocacola and Premier which was seen to go beyond the promotional period. The
effect of a change in pricing structure is obvious during sales promotion of premier where the
reviewed price backed up with sales promotion made the hypothesized sales after the sales
promotion to be higher than during the sales promotion. This conclusion can be recognized when
comparing tables 5.3 and 5.4 together as well as the hypothesized values of premier from
hypothesis 3 and 4.
With this conclusion, the research question that ask what effect sales promotion can have on the
sales of beverages and its aftermath has been answered knowing from the analysis that sales
promotion have a positive effect on the sales of beverages both in the short term and the long

32
term. Also, the purpose of this study has been fulfilled since it has been established that sales
promotion is truly a stimulating factor when it comes to sales quantity and consumer decision
making both in the short term and the long term. In addition benefit has been realized in the
sense that it allows for comparison of activities that should be used on different products of
beverages in other to achieve a desirable goal.
6.2 Recommendations
The researcher would recommend that manufacturer, retailers and even anyone that is involved
in selling should make it a point of duty to use sales promotion strategy, not just using the
strategy alone but combining it with other promotional tools as they work together as a system.
The planning of sales promotion must be supported by advertising and other promotional mix
constituents to make the campaign a success. Also, it shall be recommended for managers to see
sales promotion activities to be designed in such a way as to build and strengthen consumer‟s
relationship with the firm and its products.
33
REFERENCES (S)
Belch, G. and Belch, M. (1998), “Advertising and Promotion: An integrated marketing communications
perspective”, 4th edition, McGraw-Hill company, inc., USA.
Brassington, F. Stephen, P. (2002). Principles of Marketing, 2nd
edition, Pearson Education Limited,
Harlow Essex, England.
Bryman, A. Cramer, D. (2001), Quantitative Data Analysis with SPSS Release 10 for windows,
Routledge, East Sussex.
Bryman, A. Bell, E. (2007), Business research method, Oxford University press Inc, New York.
Bryman, A. Bell, E. (2011), Business research method, Oxford University press Inc, New York.
Cummins, J. (1998), “Sales Promotion, How to create and implement campaigns that really work”,
Second edition. Kogan Page Limited, London.
Creswell, J. (1998), Qualitative inquiry and research design, London sage Publications Ltd.
Davis, S. Inman, J. & McAlister, L. (1992), “Promotion Has a Negative Effect on Brand
Evaluation. Or Does It? Additional Disconfirming Evidence”, Journal of Marketing Research
29:1, pp.143-148.
East, Robert. (1997), “Consumer Behaviour: Advances and Applications in Marketing”, Prentice
Hall, London.
Kotler, P. & Armstrong, G. (1997), “Principles of Marketing”, Pearson Education Inc, Upper Saddle
River. New Jersey.
Kotler, P. & Armstrong, G. (2006), “Principles of Marketing”, Pearson Education Inc, Upper Saddle
River, New Jersey
Kotler, P. Wong, V. Saunders, J. Armstrong, G. (2005), “Principles of Marketing”, Fourth European
edition, Pearson Education Inc, Upper Saddle River, New Jersey
Harald, H. Lukanowicz, M. and Buchta, C. (1999), “Cross-category sales promotion effects”. Journal of
Retailing and Consumer Services, Vol. 6, Issue 2, pp.99-105.
Harald, J. (1999), “Models for Sales Promotion Effects based on Store-Level Scanner Data”, Published
by: Labyrint Publication, Netherlands, Holland.

34
Harald, J. Peter, S. Dick, R. (2004), “Decomposing the Sales Promotion Bump with Store Data”, Journal
of Marketing Science, Vol. 23, No.3, pp.317-334
Harrel, D. and Frazier, L. (1998), “Marketing, Connecting with Customers”, 1st edition, Prentice-Hall
Inc., U.S.A.
Harrison, T. & Waite, K. & White, P. (2006) “Analysis by Paralysis: The Pension
Purchase Decision Process”, The International Journal of Bank Marketing, 24:1, pp.5-23.
Journal of American medical association, 2004;292(8):927-934. doi: 10.1001/jama.292.8.927
Lind, D. Marchal, W. Wathen, S. (2008), Statistical Techniques in Business and Economics, Thirteenth
Edition, McGraw-Hill.
Michael R. Solomon (2010), “Consumer Behavior, an European perspective”, Pearson Education, U.K.
Neslin, Scott A. (2002), “Sales Promotion. Relevant Knowledge Series”, Marketing Science Institute,
Cambridge, MA, XI, 28, pp.62-63.
Palmer, A. (1994), “Principles of Service Marketing”, McGraw-Hill publishing company. England.
Peattie, K. & Peattie, S. (1993), “Sales Promotion. Playing to Win? ”, Journal of Marketing Management
9, pp.256-269.
Ping, R. A., Jr. (1993). The effect of satisfaction and structural constraints on retailer exiting,
voice, loyalty, opportunism, and neglect. Journal of Retailing, 69(3), 320–352.
Vithala R. and Joseph T. (1973), “Dynamic Models for Sales Promotion Policies”, Operational Research
Quarterly (1970-1977), Vol. 24, No. 3, pp. 403-417.
Zeithaml, V. Bitner, M. & Gremler, D. (2009), “Services Marketing - Integrating Customer Focus across
the Firm”, McGraw-Hill, Boston, latest edition
http://www.aftonbladet.se/nyheter/article11627980.ab

35
APPENDICES Questions sent to Axfood Snabbgross, Västerås.
A. Preliminary Questions
1. Do you have any sales promotion strategy in your company?
Yes NO
2. What sort of sales promotion activities do you have for selling more of beverages (Soft drinks)?
Free Samples: Yes NO To induce customers to buy a product more frequently
Premium or Bonus offer: Yes NO
Exchange schemes: Yes NO Useful for drawing attention towards product improvement.
Price-off offer: Yes NO When a new product is to be introduced.
Coupons: Yes NO
Fairs and Exhibitions Yes NO
Trading stamps Yes NO To boost up sales in off-season.
Scratch and win offer Yes NO
Money back offer: Yes NO
3. What are the beverage products (Soft drinks) that you sell in your company?
4. What are the main beverage products (Soft drinks) that you sell mostly in terms of quantity?
5. Which beverage (Soft drinks) is the most cheapest and expensive that you sell?
6. Do you sell your beverage products (Soft drinks) overseas?
7. How many branches does AX food AB have in total?
Thank you for your time & answering…

36
B. Data collection format
Dear Marianna,
Below are questions regarding the details of the Exhibition that has been done in the most recent
period on the following beverages?
Please, fill in below the corresponding sales figure and the respective prices.
Thanks.
Femi Obawole. (Mälardalen University Student)
Reason for Carrying out this Investigation
The researcher wants to academically study the effect of sales promotion on the sales of
beverages after the promotional period. This method of study would give clearer picture of the
true and real usefulness of sales promotion for managers, sales officers, consultants and other
researchers that might be interested in the further study of sales promotion.
DURING THE PROMOTIONAL PERIOD
Promotional Period Price(Sek) Quantity sold
Month/Year 1
Month/Year 2
Month/Year 3
Month/Year 4
Month/Year 5
Sales details for CocaCola during the Promotional Period.
Promotional Period Price(Sek) Quantity sold
Month/Year 1
Month/Year 2
Month/Year 3
Month/Year 4
Month/Year 5
Sales details for Premium during the Promotional Period
AFTER THE PROMOTIONAL PERIOD
Promotional Period Price(Sek) Quantity sold

37
Month/Year 1
Month/Year 2
Month/Year 3
Month/Year 4
Month/Year 5
Sales details for CocaCola after the Promotional period
Promotional Period Price(Sek) Quantity sold
Month/Year 1
Month/Year 2
Month/Year 3
Month/Year 4
Month/Year 5
Sales details for Premium after the Promotional period