May 2018 Edition · Pending Sell Recommendation TC PipeLines LP (TCP) ..... 4 The Retirement Top 10...
40
Sure Retirement Newsletter HIGH-YIELD, HIGH-QUALITY INVESTMENTS May 2018 Edition By Ben Reynolds, Nick McCullum, & Bob Ciura Edited by Brad Beams Published on May 13 th , 2018
Transcript of May 2018 Edition · Pending Sell Recommendation TC PipeLines LP (TCP) ..... 4 The Retirement Top 10...

Sure Retirement Newsletter
HIGH-YIELD, HIGH-QUALITY INVESTMENTS
May 2018 Edition
By Ben Reynolds, Nick McCullum, & Bob Ciura
Edited by Brad Beams
Published on May 13th, 2018
2
Table of Contents
Opening Thoughts - High Payout Ratios & Valuation - ........................................................... 3
Pending Sell Recommendation TC PipeLines LP (TCP) .......................................................... 4
The Retirement Top 10 – May 2018 ............................................................................................ 5
Analysis of Top 10 Securities ....................................................................................................... 6
Owens & Minor Inc. (OMI) ........................................................................................................ 6
Energy Transfer Equity LP (ETE) .............................................................................................. 8
Invesco Ltd (IVZ) ..................................................................................................................... 10
Senior Housing Properties Trust (SNH) ................................................................................... 12
AT&T Inc. (T) .......................................................................................................................... 14
Buckeye Partners LP (BPL) ...................................................................................................... 16
Energy Transfer Partners LP (ETP) .......................................................................................... 18
Omega Healthcare Investors Inc. (OHI) ................................................................................... 20
Altria Group Inc. (MO) ............................................................................................................. 22
Enterprise Products Partners LP (EPD) .................................................................................... 24
Closing Thoughts – Announcements & Improvements – ....................................................... 26
List of Investments by Sector ..................................................................................................... 27
List of Investments by Rank ...................................................................................................... 30
List of Past Recommendations & Ranking Criteria ............................................................... 32
Portfolio Building Guide ............................................................................................................ 34
Examples ................................................................................................................................... 34
Tax Guide .................................................................................................................................... 35
Corporations .............................................................................................................................. 36
Master Limited Partnerships (MLPs)........................................................................................ 37
Real Estate Investment Trusts (REITs)..................................................................................... 38
Business Development Companies (BDCs) ............................................................................. 39
Glossary of Common Terms & Acronyms ............................................................................... 40
3
Opening Thoughts - High Payout Ratios & Valuation -
There’s something special about the combination of a high payout ratio and a low valuation.
Together, they allow investors to get a ‘double benefit’ from low valuations. An example is below
to demonstrate this phenomenon.
Imagine two stocks, stock A and stock B. The relevant characteristics for each are below:
Stock A: 100% payout ratio, fair value P/E of 20, does not reinvest for growth and therefore has
0% expected EPS growth.
Stock B: 0% payout ratio, fair value P/E of 20, reinvests all profits into growth and grows at 5%
per year.
At fair value, both of these stocks generate expected total returns of 5%. Stock A would have a 5%
yield with a P/E of 20 and a 100% payout ratio. Stock B would generate 5% expected total returns
from its growth prospects.
Now if both stocks were to fall to a P/E ratio of 10 (and fair value was still a P/E of 20), they would
no longer have the same expected total returns.
Before valuation multiple changes, Stock A would now yield 10% because a P/E ratio of 10
combined with a 100% payout ratio equates to a 10% yield. The P/E ratio multiplied by the payout
ratio equals the dividend yield. Stock B would still have expected total returns before valuation
multiple gains of 5% as its growth investments aren’t affected by its stock price valuation.
Returns from business growth are not tied to valuation. Returns from returns of capital to
shareholders (dividends and share repurchases) are tied to valuation. Expected future total returns
excluding expected valuation multiple gains get better for companies with high payout ratios as
their valuations fall. The same does not hold for stocks that don’t return capital to shareholders.
In the real world, investing isn’t quite as simple as the example above. There are however, two
classes of stocks that are required to sustain very high payout ratios – REITs and MLPs. We are
seeing tremendous value in the MLP industry in particular today. In addition to the normal boost
an undervalued stock gets as we expect it to return to fair value, MLPs pay out the majority of their
cash flows to unitholders as distributions. This fact gives them especially high expected total
returns when they are deeply undervalued.
By the same token, MLPs and REITs also make particularly poor investments when they are
overvalued.
It should be noted that the link between valuation and payout ratios only applies to new purchases.
Your yield on cost doesn’t change with valuation multiples going forward.
In closing this month’s opening thoughts, we have a special pending sell report section on the
following page for TC PipeLines (TCP). Additionally, please see the Closing Thoughts section
for important improvements we’ve made to the Sure Retirement Newsletter this month.
4
Pending Sell Recommendation TC PipeLines LP (TCP)
TC PipeLines was last recommended in the April 2018 Sure Retirement Newsletter. More recently,
the partnership announced a distribution reduction. TC PipeLines is reducing its quarterly
distribution payment from $1.00/share to $0.65/share; a 35% decline.
The distribution cut was announced at the same time as the company’s first quarter earnings, on
May 2nd. The partnership’s distributable cash flow per share grew 16.8% versus the same quarter a
year ago. Robust growth is not typically a cause for a distribution reduction.
The reason TC PipeLines elected to reduce its distribution is because of a recent Federal Energy
Regulatory Commission (FERC) ruling. The new ruling does not allow for income tax recovery in
certain cases for pipelines. It’s important to note that not all pipelines will be affected as severely
as TC PipeLines. In fact, many pipelines do not expect the ruling to significantly impact their
operations.
With that said, the ruling will seriously impact TC PipeLines’ operations. The partnership is
expecting revenue to decline by approximately $100 million. This is significant given that the
company generated $425 million in revenue over the last 12 months. The TC PipeLines dividend
cut will save the partnership roughly the amount of money the FERC ruling will cost it.
Because TC PipeLines cut its distribution, we recommend selling TC PipeLines when the time is
right. Now is not that time. The partnership still has a robust 10.1% distribution yield after
accounting for the recent reduction. For comparison, the partnership’s historical average yield over
the last decade is around 7.0%. TC PipeLines is currently undervalued.
Also, the partnership has two potential catalysts that are likely to improve its valuation in the next
year or so. The first catalyst is converting from an MLP to a C-Corporation. TC PipeLines’
management expects this move would save the partnership $20 million to $30 million a year. This
would reduce the impact of the FERC ruling 20% to 30%. The bigger catalyst involves TC
PipeLines’ parent company.
TransCanada Corporation (TRP) is TC PipeLines’ parent company. TransCanada has a market cap
of $38 billion, versus $1.8 billion for TC PipeLines. In addition, TransCanada is TC PipeLines’
general partner, and also already owns 24% of TC PipeLines. The reason TC PipeLines exists is
because it was a more tax efficient way to access capital markets and distribute cash flows to
shareholders for TransCanada. This logic no longer holds true. As a result, we believe it is likely
that TransCanada acquires the remaining 76% interest in TC PipeLines. Indeed, TransCanada
could acquire TC PipeLines at a discount; the stock price is down more than 50% in the last year.
Due to the catalysts above, we recommend investors who purchased TC PipeLines hold for now
and only sell when: (1) TC PipeLines’ distribution yield declines to 8% (which we believe is
around fair value), or (2) TransCanada enters into an agreement to purchase TC PipeLines. We
will be monitoring TC PipeLines and will provide a final sell update when the time is right.

5
The Retirement Top 10 – May 2018
Name Type Price Fair Value Yield Payout Growth Beta
Owens & Minor (OMI) Stock $16 $29 6.7% 52% 11.0% 1.77
Energy Transfer Equity (ETE) MLP $16 $24 7.4% 68%1 8.5% 1.48
Invesco (IVZ) Stock $28 $41 4.2% 44% 10.5% 0.92
Senior Housing Prop. (SNH) REIT $16 $21 9.5% 85%2 2.0% 0.16
AT&T (T) Stock $32 $46 6.3% 58% 5.0% 0.41
Buckeye Partners (BPL) MLP $40 $72 12.2% 111%3 7.5% 2.04
Energy Transfer Partn. (ETP) MLP $19 $25 12.1% 87%4 6.5% 1.68
Omega Healthcare (OHI) REIT $29 $37 9.3% 85%5 9.0% -0.32
Altria Group (MO) Stock $56 $64 5.0% 74% 10.5% 0.83
Enterprise Products (EPD) MLP $27 $31 6.2% 67%6 10.0% 1.06
Notes: The ‘Price’ column shows a recent price of the security. The ‘Fair Value’ column shows
our estimate of the company’s per-share fair value. True fair value is unknowable. The ‘Payout’
column uses earnings, funds from operations, or distributable cash flow in the denominator. The
numerator is the security’s payment to its owner.
Three recommendations have changed from last month. TC PipeLines (TCP), Holly Energy
Partners (HEP), and Welltower (WELL) have been replaced by Invesco (IVZ), AT&T (T), and
Altria (MO). The stability of the Top 10 list shows the ranking method is consistent, not based on
rapid swings. Remember: Securities that fall out of the Top 10 are holds, not sells.
Note: Dividend or distribution yields are used for valuation in some of the individual company
analyses below instead of price-to-earnings (P/E) ratios, which are not meaningful for MLPs and
REITs.
An equal weighted portfolio of the Top 10 has the following characteristics:
Payout Ratio: 73%
Dividend or Distribution Yield: 7.9%
Growth Rate: 8.1%
1 Using distributable cash flow (DCF). 2 Using funds from operations (FFO). 3 Using distributable cash flow (DCF). Despite the company’s above 100% payout ratio, Buckeye’s management team has stated that
it has no intention of cutting its distribution. See our written analysis for more details. 4 Using distributable cash flow (DCF). 5 Using funds from operations (FFO). 6 Using distributable cash flow (DCF).
Note: Data for the rankings, Top 10 summary page, and yield images is through the market close as of 5/10/18 but very occasionally
5/11/18 when there are large changes at the week’s market close. Data elsewhere is from between market close 5/10/18 and market
close 5/11/18.

6
Analysis of Top 10 Securities
Owens & Minor Inc. (OMI) Key Statistics, Ratios & Metrics
Dividend Yield: 6.7% 10 Year Dividend Growth Rate: 11.5%
Most Recent Annual Dividend Increase: 0.8% Sector: Healthcare
Dividend History: 20 years of increases Business Type: Corporation
Ex-Dividend Date: 6/14/18 Payment Date: 7/2/18
Overview & Current Events
Owens & Minor is a healthcare distribution, transportation, and data analytics company. It provides
healthcare products for hospitals and other medical centers. In all, Owens & Minor distributes
approximately 220,000 medical and surgical supplies to roughly 4,400 hospitals. Its other clients include group purchasing organizations, the federal government, and at-home healthcare patients.
In early May, Owens & Minor released (5/10/18) financial results for the second quarter of fiscal 2018. Consolidated revenues increased by 1.9% while GAAP earnings-per-share fell to $0.13 from $0.31 in
the prior year’s period. Excluding one-time accounting charges, results were far better. Adjusted
earnings-per-share of $0.43 fell slightly from the $0.44 reported in the prior year’s period. While the
company’s performance fell slightly short of expectations, shares rose by nearly 4% after the report.
Growth Prospects & Safety
Despite experiencing struggles over the last year, we believe Owens & Minor still has positive long-
term growth potential. Its strategic growth initiatives include expansion into new products and
services, primarily through acquisitions. For example, the company acquired Byram Healthcare, a
distributor of direct-to-patient medical supplies. This acquisition boosted Owens & Minor’s position in
at-home healthcare. Byram added $118 million to Owens & Minor’s first-quarter revenue.
Owens & Minor also recently closed (4/30/18) on its acquisition of the surgical and infection
prevention (S&IP) business of Halyard Health. This deal expands Owens & Minor’s portfolio to include new medical supplies like sterilization wraps, surgical drapes and gowns, and medical exam
gloves. These acquisitions will help the company enter new, high-growth product markets.
Owens & Minor’s earnings-per-share will suffer in the short-term from investment spending, but the
long-term benefits are clear. The company believes it can achieve a long-term annual earnings growth
rate of 8% to 10% after the various acquisitions are completed. In addition, Owens & Minor’s current
dividend payment combined with 2018 earnings estimates imply a forward dividend payout ratio of
just 52%, giving plenty of room for dividend growth if earnings stall temporarily.
Valuation
Consensus estimates call for earnings-per-share of $2.00 for Owens & Minor in 2018. As a result, the
stock trades for a price-to-earnings ratio of just 8.0. We believe the stock deserves a price-to-earnings
ratio of 14-15, since Owens & Minor has strong customer relationships and a highly profitable business model. We estimate a fair value price of $29 for Owens & Minor. Therefore, the stock seems to be
significantly undervalued.
If the share price rose back to our fair value estimate, buyers at the current price would earn a return of approximately 81%, just from share price appreciation. In addition, Owens & Minor has a dividend
yield of 6.7%. Because of a rising valuation, earnings growth, and dividends, the stock has significant
total return potential that could exceed 20% per annum if market pessimism eventually dissipates.

7
0.00%
1.00%
2.00%
3.00%
4.00%
5.00%
6.00%
7.00%
8.00%
1986
1987
1988
1989
1990
1991
1992
1993
1994
1995
1996
1997
1998
1999
2000
2001
2002
2003
2004
2005
2006
2007
2008
2009
2010
2011
2012
2013
2014
2015
2016
2017
2018
Owens & Minor (OMI) Dividend Yield History
8
Energy Transfer Equity LP (ETE)
Key Statistics, Ratios & Metrics Distribution Yield: 7.4% 10 Year Dist. Growth Rate: 10.7%
Most Recent Annual Distribution Increase: 7.0% Sector: Energy
Distribution History: Steady or increasing since 2008 Business Type: MLP
Ex-Distribution Date: 5/4/18 Payment Date: 5/21/18
Overview & Current Events
Energy Transfer Equity is a master limited partnership (MLP) which owns the General Partner and
100% of the incentive distribution rights (IDRs) of Energy Transfer Partners LP and Sunoco LP. ETE
also owns Lake Charles LNG Company. Energy Transfer’s subsidiary companies own and operate a
diverse portfolio of natural gas, natural gas liquids, refined products, and crude oil pipelines; as well as
retail and wholesale motor fuel operations and natural gas liquids terminals.
In early May, Energy Transfer Equity reported (5/9/18) first-quarter financial results. Revenue of
$11.9 billion missed analyst estimates by $40 million but rose 23% from the same quarter a year ago.
Distributable cash flow, as adjusted, increased 84% year-over-year.
Separately, ETE stock fell on news that the Federal Energy Regulatory Commission (FERC) will no
longer allow MLPs to recover an income tax allowance in cost-of-service rates. All MLPs sold off on
the news, but Energy Transfer Equity stated in a press release (3/15/18) that most of its rates are set by negotiated rate agreements, and thus would not be subject to adjustment. As a result, we believe the
FERC news is immaterial for Energy Transfer Equity investors.
Growth Prospects & Safety
Going forward, Energy Transfer Equity’s primary growth catalyst is new pipeline projects for its
subsidiary companies. For example, growth for the first quarter was primarily due to an increase of
$183 million in General Partner and incentive distributions from Energy Transfer Partners. In addition,
Energy Transfer Partners recently announced (5/10/18) it will build a crude oil pipeline from the
Permian Basin in west Texas to the Houston Ship Channel and Nederland, Texas. The pipeline will have an initial capacity of up to 600,000 barrels per day, with future expansion capacity up to 1 million
barrels per day. The company expects the pipeline will be completed by 2020.
Energy Transfer Equity will also pursue growth through acquisitions. For example, in the first quarter
the company acquired the general partner of USA Compression Partners LP (USAC) and
approximately 12.5 million USAC common units.
In terms of safety, Energy Transfer Equity scores fairly well for an MLP. It reported a distribution
coverage ratio of 1.48x in the 2018 first quarter, which means the company generated 48% more
distributable cash flow than it needed to pay distributions. The coverage ratio improved considerably
from 0.86x in the 2017 first quarter. This indicates the distribution is sustainable.
Valuation
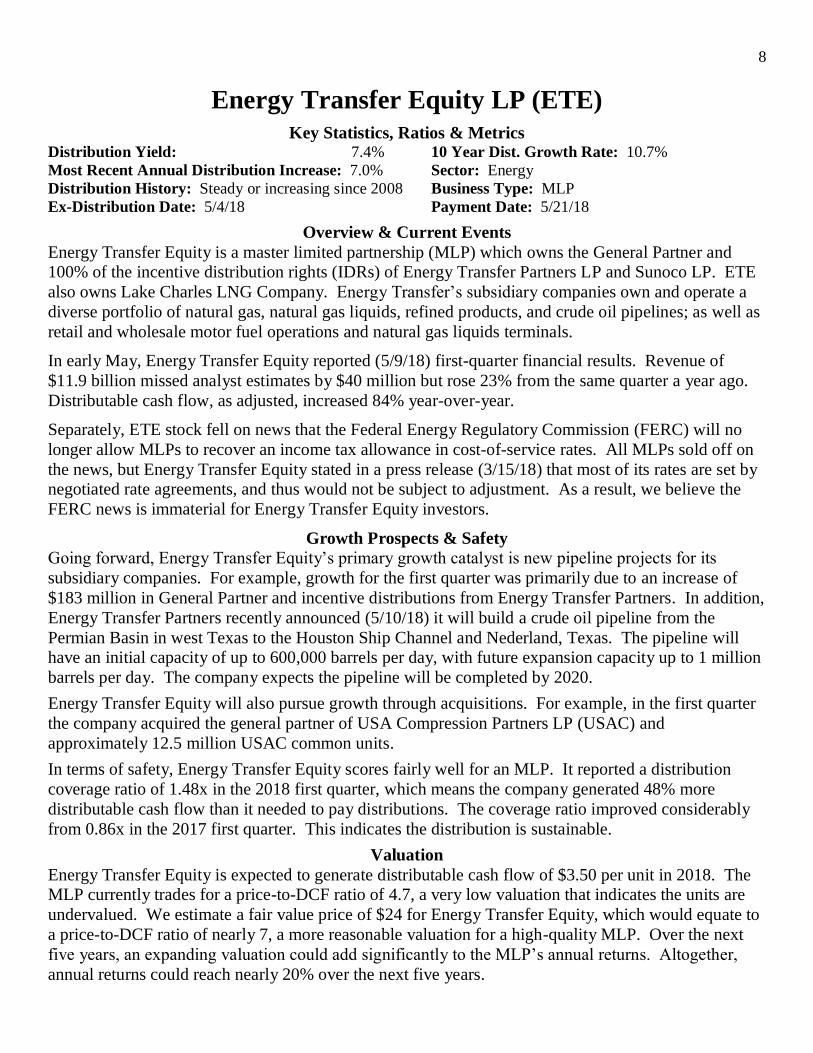
Energy Transfer Equity is expected to generate distributable cash flow of $3.50 per unit in 2018. The MLP currently trades for a price-to-DCF ratio of 4.7, a very low valuation that indicates the units are
undervalued. We estimate a fair value price of $24 for Energy Transfer Equity, which would equate to
a price-to-DCF ratio of nearly 7, a more reasonable valuation for a high-quality MLP. Over the next
five years, an expanding valuation could add significantly to the MLP’s annual returns. Altogether,
annual returns could reach nearly 20% over the next five years.

9
0.00%
5.00%
10.00%
15.00%
20.00%
25.00%
30.00%
2007
2008
2009
2010
2011
2012
2013
2014
2015
2016
2017
2018
Energy Transfer Equity (ETE) Dividend Yield History

10
Invesco Ltd (IVZ)
Key Statistics, Ratios & Metrics Dividend Yield: 4.3% 10 Year Dividend Growth Rate: 11.1%
Most Recent Annual Dividend Increase: 7.1% Sector: Financials
Dividend History: Steady or increasing since 2008 Business Type: Corporation
Ex-Dividend Date: 5/10/18 Payment Date: 6/1/18
Overview & Current Events
Invesco is an investment management firm that provides a wide variety of asset management,
investing, and financial planning products and services. The company serves retail, institutional, and
wealth management customers around the world. Invesco has more than 7,000 employees and serves
clients in more than 150 countries. The company has a market capitalization of $11.6 billion.
In late April, Invesco reported (4/26/18) first-quarter financial results. Revenue of $958 million missed
analyst expectations by $20 million, but revenue increased 10.5% year-over-year. This was a very
healthy revenue growth rate. Earnings-per-share of $0.67 rose 10% from the same quarter a year ago
and beat analyst expectations by $0.01 per share.
Separately, Invesco announced (5/10/18) April assets under management (AUM) of $934 billion.
Growth was due to the Guggenheim acquisition, and favorable market returns, which were partially
offset by net long-term outflows, and unfavorable foreign exchange fluctuations.
Growth Prospects & Safety
AUM growth is the major performance driver for investment management firms like Invesco. The
strong recent performance of the U.S. and international markets has contributed to stronger demand for
investment products. If the markets continue to do well, Invesco’s AUM should continue to rise. In addition, growth will come from rising interest rates. Higher interest rates help Invesco generate higher
returns on its investments, particularly fixed income. Invesco is also pursuing growth through
acquisitions. In early April, Invesco completed (4/6/18) the acquisition of Guggenheim Investments’
ETF business for $1.2 billion. This acquisition will enhance Invesco’s product offerings in exchange-
traded funds, an emerging asset management class that is seeing growing demand.
Invesco has significant competitive advantages in the asset management industry and operates with a
sound balance sheet. The company has credit ratings of A2 and A from Moody’s and Standard &
Poor’s, respectively, which are critical for a financial services firm. Strong credit ratings allow an
investment management firm to uphold a reputation of financial integrity, which helps retain and grow the client base. Invesco has generated nine consecutive years of positive long-term net inflows. In
addition, the company held a dividend payout ratio of 44% last year. Still, investors should note that
the performance of asset management firms will fluctuate along with the financial markets due to their
dependence on assets under management.
Valuation Analysts expect Invesco to generate earnings-per-share of $2.85 in 2018. Based on this, Invesco stock
trades for a price-to-earnings ratio of 9.9. We believe a fair valuation for Invesco is a price-to-earnings
ratio of 14-15. As a result, our fair value price estimate for Invesco shares is approximately $41. The
stock currently trades at $28. Over the next five years, a rising valuation could add approximately 7%
to 8% to total returns. In addition, we believe Invesco can reasonably generate annual earnings growth of 6%. When accounting for with the firm’s 4.3% dividend yield, Invesco’s total returns could reach
over 17% per year.

11
0.00%
1.00%
2.00%
3.00%
4.00%
5.00%
6.00%
7.00%
1998
1999
2000
2001
2002
2003
2004
2005
2006
2007
2008
2009
2010
2011
2012
2013
2014
2015
2016
2017
Invesco (IVZ) Dividend Yield History
12
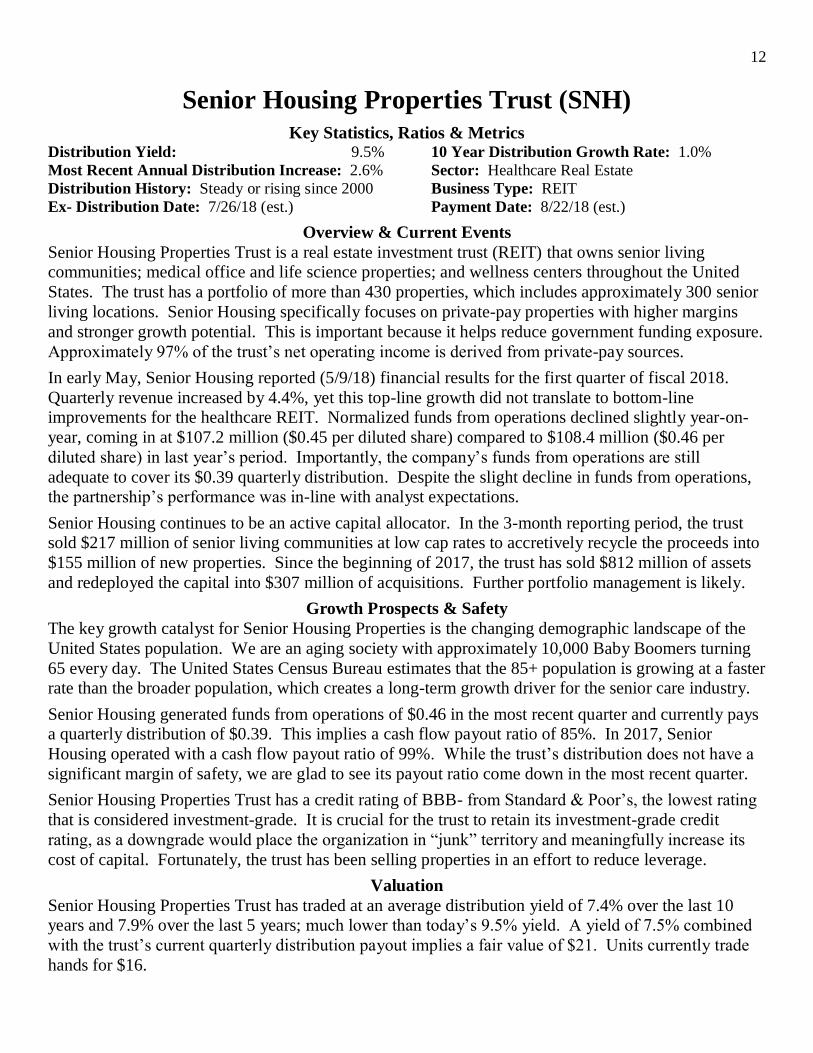
Senior Housing Properties Trust (SNH)
Key Statistics, Ratios & Metrics Distribution Yield: 9.5% 10 Year Distribution Growth Rate: 1.0%
Most Recent Annual Distribution Increase: 2.6% Sector: Healthcare Real Estate
Distribution History: Steady or rising since 2000 Business Type: REIT
Ex- Distribution Date: 7/26/18 (est.) Payment Date: 8/22/18 (est.)
Overview & Current Events
Senior Housing Properties Trust is a real estate investment trust (REIT) that owns senior living
communities; medical office and life science properties; and wellness centers throughout the United
States. The trust has a portfolio of more than 430 properties, which includes approximately 300 senior
living locations. Senior Housing specifically focuses on private-pay properties with higher margins
and stronger growth potential. This is important because it helps reduce government funding exposure.
Approximately 97% of the trust’s net operating income is derived from private-pay sources.
In early May, Senior Housing reported (5/9/18) financial results for the first quarter of fiscal 2018.
Quarterly revenue increased by 4.4%, yet this top-line growth did not translate to bottom-line improvements for the healthcare REIT. Normalized funds from operations declined slightly year-on-
year, coming in at $107.2 million ($0.45 per diluted share) compared to $108.4 million ($0.46 per
diluted share) in last year’s period. Importantly, the company’s funds from operations are still
adequate to cover its $0.39 quarterly distribution. Despite the slight decline in funds from operations, the partnership’s performance was in-line with analyst expectations.
Senior Housing continues to be an active capital allocator. In the 3-month reporting period, the trust sold $217 million of senior living communities at low cap rates to accretively recycle the proceeds into
$155 million of new properties. Since the beginning of 2017, the trust has sold $812 million of assets
and redeployed the capital into $307 million of acquisitions. Further portfolio management is likely.
Growth Prospects & Safety
The key growth catalyst for Senior Housing Properties is the changing demographic landscape of the
United States population. We are an aging society with approximately 10,000 Baby Boomers turning
65 every day. The United States Census Bureau estimates that the 85+ population is growing at a faster rate than the broader population, which creates a long-term growth driver for the senior care industry.
Senior Housing generated funds from operations of $0.46 in the most recent quarter and currently pays a quarterly distribution of $0.39. This implies a cash flow payout ratio of 85%. In 2017, Senior
Housing operated with a cash flow payout ratio of 99%. While the trust’s distribution does not have a
significant margin of safety, we are glad to see its payout ratio come down in the most recent quarter.
Senior Housing Properties Trust has a credit rating of BBB- from Standard & Poor’s, the lowest rating
that is considered investment-grade. It is crucial for the trust to retain its investment-grade credit
rating, as a downgrade would place the organization in “junk” territory and meaningfully increase its
cost of capital. Fortunately, the trust has been selling properties in an effort to reduce leverage.
Valuation
Senior Housing Properties Trust has traded at an average distribution yield of 7.4% over the last 10 years and 7.9% over the last 5 years; much lower than today’s 9.5% yield. A yield of 7.5% combined
with the trust’s current quarterly distribution payout implies a fair value of $21. Units currently trade
hands for $16.

13
0.00%
5.00%
10.00%
15.00%
20.00%
25.00%
2000
2001
2002
2003
2004
2005
2006
2007
2008
2009
2010
2011
2012
2013
2014
2015
2016
2017
Senior Housing Properties Trust (SNH) Dividend Yield History

14
AT&T Inc. (T)
Key Statistics, Ratios & Metrics Dividend Yield: 6.3% 10 Year Dividend Growth Rate: 2.3%
Most Recent Annual Dividend Increase: 2.0% Sector: Telecommunications
Dividend History: 34 years of increases Business Type: Corporation
Ex-Dividend Date: 7/6/18 (est.) Payment Date: 8/1/18 (est.)
Overview & Current Events
AT&T is a diversified telecommunications company with a market capitalization of $196 billion. It
offers a variety of telecom services, including wireless and cable TV, as well as satellite TV through its
subsidiary DirecTV. It operates through the following business segments: Business Solutions, Entertainment Group, Consumer Mobility, and International.
In late April, AT&T reported (4/25/18) first-quarter financial results. AT&T generated revenue of
$38.04 billion and earnings-per-share of $0.85. Both figures came up short of expectations. Revenue
and earnings-per-share missed analyst estimates by $1.27 billion and $0.02 per share, respectively. Revenue declined 2.3% from the same quarter a year ago. AT&T saw sales growth of wireless
equipment and strategic business services, but this was more than offset by declines in legacy wireline
services, domestic video, and wireless service revenues. For the quarter, AT&T had 3.2 million total
wireless net adds, and churn of just 0.84%, the lowest first-quarter churn rate in the company’s history.
Growth Prospects & Safety
The telecommunications industry is highly saturated and competitive. As a result, consolidation is the
best path for future growth. To that end, AT&T is currently attempting to acquire content giant Time
Warner for $85 billion. Time Warner has a number of strong media properties, including TBS, TNT, HBO, and the Warner Bros. movie studio. If the Time Warner acquisition receives approval, the
combined company would have over 140 million mobile subscribers, and another 45 million video
subscribers worldwide. However, in November 2017 the Department of Justice sued to block the
proposed transaction on antitrust grounds. The main portion of the trial recently concluded, with a
final decision expected on June 12th. Investors will soon know the fate of the acquisition.
AT&T’s dividend is very safe, and the company is a Dividend Aristocrat with 34 years of dividend
growth. Based on 2018 guidance, the company is on pace for a dividend payout ratio of 58%.
AT&T has a considerable amount of debt, and it will incur even more if and when the Time Warner deal gets approved. AT&T ended the 2018 first quarter with $133.7 billion of long-term debt. To help
mitigate the risk of rising interest rates, AT&T has a balanced maturity schedule. It also has a solidly
investment-grade credit rating of BBB+ from Standard & Poor’s, which will help keep its cost of
capital manageable.
Valuation
AT&T is expected to generate adjusted earnings-per-share of $3.45 in 2018. AT&T stock currently
trades for a price-to-earnings ratio of just 9.2, compared with an average of 13.4 over the past 10 years.
Therefore, we believe the stock is significantly undervalued, and the expanding price-to-earnings ratio
could add 8% to shareholder returns each year if mean reversion occurred over a 5-year period. We estimate a fair value price of $46 for AT&T shares.
Even assuming relatively low earnings growth of 2% per year, AT&T can still provide high returns. Including the impact of a rising valuation, earnings growth, and dividends, we forecast total returns of
16% per year for AT&T if the telecom can revert to its long-term average valuation multiple.

15
0.00%
1.00%
2.00%
3.00%
4.00%
5.00%
6.00%
7.00%
8.00%
1987
1988
1989
1990
1991
1992
1993
1994
1995
1996
1997
1998
1999
2000
2001
2002
2003
2004
2005
2006
2007
2008
2009
2010
2011
2012
2013
2014
2015
2016
2017
2018
AT&T (T) Dividend Yield History

16
Buckeye Partners LP (BPL) Key Statistics, Ratios, & Metrics
Distribution Yield: 12.2% 10 Year Distribution Growth Rate: 3.9% Most Recent Annual Distribution Increase: 4.1% Sector: Energy
Distribution History: 19 years of increases Business Type: MLP
Ex-Distribution Date: 5/11/18 Payment Date: 5/21/18
Overview & Current Events
Buckeye Partners is a midstream energy master limited partnership (MLP). The partnership operates
approximately 6,000 miles of pipelines and more than 135 liquid petroleum terminals with over 176
million barrels of total storage capacity. Approximately 95% of the partnership’s EBITDA comes from
fee-based sources. Buckeye’s pipelines and terminals are located in the East Coast, Midwest, and Gulf
Coast regions of the United States. The partnership also has a significant international presence that includes a 50% interest in VTTI, an international provider of energy storage solutions.
In early May, Buckeye reported (5/4/18) financial results for the first quarter of 2018. The partnership’s performance was worse than expected. Net income declined to $112.4 million from
$123.6 million in last year’s quarter, while adjusted EBITDA of $261.7 million declined from the
$277.5 million reported in the first quarter of 2017. Distributable cash flow of $169.2 million also
declined from the $190.7 million reported in last year’s quarter and did not adequately cover Buckeye’s distribution payments. The partnership reported a distribution coverage ratio of 0.91 in the quarter.
Challenging market conditions were to blame for Buckeye’s poor quarterly performance. The
partnership’s common units fell as much as 11% following the announcement.
Growth Prospects & Safety
Buckeye’s future growth will be fueled by new capital projects. For example, its South Texas Gateway
project calls for the construction of a 600-mile long-haul pipeline with total expected capacity of
approximately 400,000 barrels per day. Once completed, it will significantly expand Buckeye’s distribution capabilities in the high-quality Permian Basin. The project is set for completion in 2019.
Another project set to ramp up shortly is the Michigan/Ohio expansion project. Buckeye has secured 10-year commitments from oil customers, totaling 50,500 barrels per day. Phase two of the project is
expected to be completed by the end of 2018 and is projected to add 40,000 barrels per day of capacity.
On the partnership’s first quarter conference call, Buckeye’s Chief Executive Officer stated that 2018
should be a transitional year. Market conditions for segregated storage “remain challenged” and the
partnership does not expect to realize meaningful gains from current capital projects until 2019 or
2020. Accordingly, Buckeye is expecting to report a distribution coverage rate between 0.9 and 0.95
for the full year of fiscal 2018, with coverage returning to above 1.0 in the fourth quarter. Importantly, Buckeye’s CEO also stated, “our Board of Directors remain committed to our current distribution
policy,” and “we have no intention of cutting Buckeye’s distribution.”
Valuation
Buckeye Partners traded at an average distribution yield of 7.0% over the last 5 years and 7.1% over
the last 10 years. The partnership’s current distribution yield of 12.2% indicates that it is meaningfully
undervalued at current prices. A yield of 7% combined with the partnership’s current quarterly
distribution implies a fair value of $72. Units currently trade hands for under $40. We note that it may be several years before Buckeye’s valuation reverts to its historical levels, but the partnership’s high
yield rewards the patient investors who are willing to invest today.

17
0.00%
2.00%
4.00%
6.00%
8.00%
10.00%
12.00%
14.00%
16.00%
1988
1989
1990
1991
1992
1993
1994
1995
1996
1997
1998
1999
2000
2001
2002
2003
2004
2005
2006
2007
2008
2009
2010
2011
2012
2013
2014
2015
2016
2017
2018
Buckeye Partners LP (BPL) Dividend Yield History

18
Energy Transfer Partners LP (ETP) Key Statistics, Ratios, & Metrics
Distribution Yield: 12.1% 10 Year Distribution Growth Rate: 14.0% Most Recent Annual Distribution Increase: 10.8% Sector: Energy
Distribution History: 15 years of increases Business Type: MLP
Ex-Distribution Date: 8/8/18 (est.) Payment Date: 8/15/18 (est.)
Overview & Current Events
Energy Transfer Partners is the second-largest energy master limited partnership (MLP) based on
market capitalization, behind Enterprise Products Partners (EPD). The partnership operates more than
71,000 miles of natural gas, natural gas liquids (NGL), and crude and refined products pipelines.
Energy Transfer Partners is a primary operator and financier of the notable Rover and Dakota Access
Pipeline (DAPL) projects.
In early May, Energy Transfer Partners reported (5/9/18) financial results for the first quarter of 2018.
The partnership beat expectations for both revenue and earnings. Adjusted EBITDA of $1.88 billion increased by $436 million over the prior year’s period while net income of $879 million increased by a
remarkable $486 million year-on-year. A number of factors contributed to Energy Transfer Partners’
strong performance, including robust results from the crude oil transportation and services segment and
a $172 million pre-tax gain on Sunoco LP (SUN) units that were repurchased by Sunoco from ETP in February. Importantly, Energy Transfer Partners’ quarterly distribution continues to be well-covered
by its underlying cash flows. All said, it was a strong quarter from this master limited partnership and
shares rose modestly following the announcement.
Growth Prospects & Safety
Energy Transfer Partners’ future growth will be derived from new projects such as the Rover pipeline.
The partnership owns 33% of Rover, which is now capable of transporting more than 1.7 billion cubic
feet per day. Separately, Energy Transfer Partners’ Red Bluff Express pipeline will have a capacity of at least 1.4 billion cubic feet per day with guaranteed long-term commitments supporting the project’s
cash flow. It is expected to come online in the second quarter of 2018. In all, Energy Transfer Partners
has $10 billion worth of new projects coming online from mid-2017 through mid-2019 that should
significantly boost growth moving forward.
Despite the partnership’s exceptionally high yield, Energy Transfer Partners’ distribution is secure.
The partnership reported a distribution coverage ratio of 1.15x in the most recent quarter. Prior to that,
the partnership’s distribution coverage ratio for the fourth quarter of 2017 was 1.30x. Energy Transfer Partners expects not to need equity financing through at least the middle of 2018. The partnership’s
balance sheet is reasonable, but investors should closely monitor the partnership’s financial position.
Energy Transfer Partners barely has an investment-grade BBB- credit rating from Standard & Poor’s
and a similar Baa2 rating from Moody’s. In addition, the partnership operated with a leverage ratio of
3.89x at the end of the most recent quarter, down from 3.96x in the previous quarter.
Valuation
Energy Transfer Partners has traded at an average distribution yield of 9.1% over the last 5 years. The partnership’s current yield of ~12% indicates that it is profoundly undervalued at current prices. A
yield of 9% combined with the partnership’s current quarterly distribution implies a fair value of $25
for this energy MLP. Units currently trade hands for less than $19.

19
0.00%
5.00%
10.00%
15.00%
20.00%
25.00%
30.00%
35.00%
40.00%
45.00%
2002
2003
2004
2005
2006
2007
2008
2009
2010
2011
2012
2013
2014
2015
2016
2017
2018
Energy Transfer Partners (ETP) Dividend Yield History

20
Omega Healthcare Investors Inc. (OHI) Key Statistics, Ratios, & Metrics
Distribution Yield: 9.3% 10 Year Distribution Growth Rate: 8.2% Most Recent Annual Distribution Increase: 4.8% Sector: Healthcare Real Estate
Distribution History: 15 years of increases Business Type: REIT
Ex-Distribution Date: 7/30/18 (est.) Payment Date: 8/15/18 (est.)
Overview & Current Events
Omega Healthcare Investors is the largest publicly-traded REIT in the United States dedicated to
owning and operating skilled nursing facilities (SNFs). The trust’s portfolio is comprised of
approximately 85% SNFs and 15% Senior Housing Facilities (SHFs). Omega operates ~1,000
properties in 42 U.S. states and the United Kingdom. These properties are run by 77 independent
operators.
In early May, Omega Healthcare Investors reported (5/7/18) financial results for the first quarter of
2018. Operating revenues fell 5.0% to $220.2 million while adjusted funds from operations of $0.78 per share fell from the $0.86 reported in last year’s period. Omega Healthcare is struggling through
some tenant issues that are negatively impacting the trust’s financial performance. The trust recorded
$198.2 million in impairment charges in 2017 due to certain affiliates of tenant Orianna Health
Systems declaring Chapter 11 bankruptcy. Importantly, Omega’s first quarter earnings release stated “Orianna recommenced partial rent payments in April,” and “we expect to have further clarity in the
near future” regarding the situation. Despite these problems, Omega beat analyst expectations (which
were quite pessimistic), which resulted in a modest rise in unit price following the announcement.
The trust also continued to actively manage its finances and property portfolio in the quarter. Omega
Healthcare Investors sold 14 facilities and had 3 mortgage loans repaid in the three-month reporting
period, which generated $98.4 million in net cash proceeds. In addition, the trust invested $38 million
in capital expenditures and completed $30 million in new investments. Importantly, Omega’s CFO made the following statement in the earnings release: “Our better than expected first quarter results
largely reflect the timing of new investments and asset sales.” Accordingly, the trust reaffirmed its
2018 financial guidance for adjusted funds from operations of $2.96 to $3.06 per diluted share.
Growth Prospects & Safety
Despite the recent difficulties experienced by Omega Healthcare Investors, the trust should still deliver
satisfactory growth over the long run. Industry tailwinds will be a major driver of this growth. The
aging U.S. population is a meaningful trend. The population of 85-year-old and older people in the United States is expected to grow by approximately 50% over the next 15 years. As the 4th largest
publicly-traded healthcare REIT, Omega is well-positioned to benefit from this change.
In addition, investors should note that Omega’s distribution continues to be well-covered by its cash
flows despite its recent operational difficulties. The trust currently pays a quarterly distribution of
$0.66 and generated adjusted funds from operations of $0.78 last quarter. This implies a distribution
coverage ratio of 1.18, equivalent to a cash flow payout ratio of approximately 85%.
Valuation
Omega Healthcare Investors’ average distribution yield over the last 5 years has been 6.6% and over
the last 10 years has been 6.9%. The trust’s current distribution yield of 9.3% indicates that it is significantly undervalued at current prices. We estimate a fair value of $37/share for Omega
Healthcare and it is currently trading for under $29/share.

21
0.00%
2.00%
4.00%
6.00%
8.00%
10.00%
12.00%
2004
2005
2006
2007
2008
2009
2010
2011
2012
2013
2014
2015
2016
2017
2018
Omega Healthcare Investors (OHI) Dividend Yield History
22
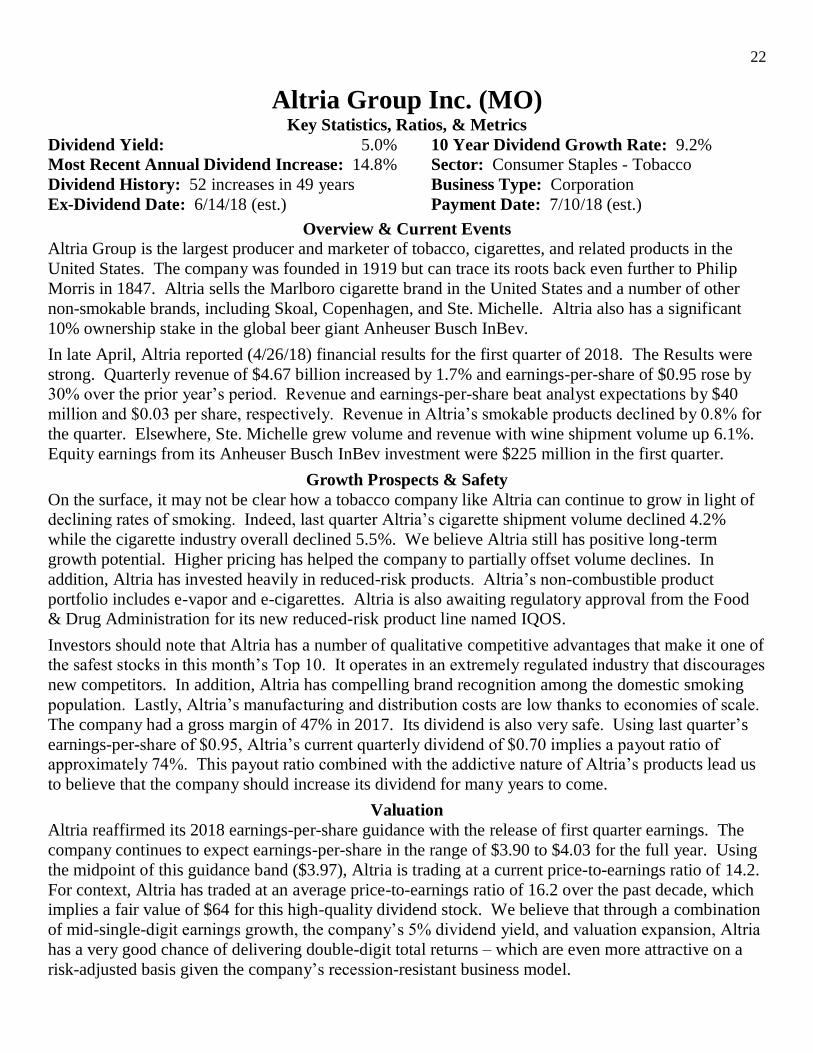
Altria Group Inc. (MO) Key Statistics, Ratios, & Metrics
Dividend Yield: 5.0% 10 Year Dividend Growth Rate: 9.2% Most Recent Annual Dividend Increase: 14.8% Sector: Consumer Staples - Tobacco
Dividend History: 52 increases in 49 years Business Type: Corporation
Ex-Dividend Date: 6/14/18 (est.) Payment Date: 7/10/18 (est.)
Overview & Current Events
Altria Group is the largest producer and marketer of tobacco, cigarettes, and related products in the
United States. The company was founded in 1919 but can trace its roots back even further to Philip
Morris in 1847. Altria sells the Marlboro cigarette brand in the United States and a number of other
non-smokable brands, including Skoal, Copenhagen, and Ste. Michelle. Altria also has a significant
10% ownership stake in the global beer giant Anheuser Busch InBev.
In late April, Altria reported (4/26/18) financial results for the first quarter of 2018. The Results were
strong. Quarterly revenue of $4.67 billion increased by 1.7% and earnings-per-share of $0.95 rose by 30% over the prior year’s period. Revenue and earnings-per-share beat analyst expectations by $40
million and $0.03 per share, respectively. Revenue in Altria’s smokable products declined by 0.8% for
the quarter. Elsewhere, Ste. Michelle grew volume and revenue with wine shipment volume up 6.1%.
Equity earnings from its Anheuser Busch InBev investment were $225 million in the first quarter.
Growth Prospects & Safety
On the surface, it may not be clear how a tobacco company like Altria can continue to grow in light of declining rates of smoking. Indeed, last quarter Altria’s cigarette shipment volume declined 4.2%
while the cigarette industry overall declined 5.5%. We believe Altria still has positive long-term
growth potential. Higher pricing has helped the company to partially offset volume declines. In
addition, Altria has invested heavily in reduced-risk products. Altria’s non-combustible product
portfolio includes e-vapor and e-cigarettes. Altria is also awaiting regulatory approval from the Food & Drug Administration for its new reduced-risk product line named IQOS.
Investors should note that Altria has a number of qualitative competitive advantages that make it one of the safest stocks in this month’s Top 10. It operates in an extremely regulated industry that discourages
new competitors. In addition, Altria has compelling brand recognition among the domestic smoking
population. Lastly, Altria’s manufacturing and distribution costs are low thanks to economies of scale.
The company had a gross margin of 47% in 2017. Its dividend is also very safe. Using last quarter’s
earnings-per-share of $0.95, Altria’s current quarterly dividend of $0.70 implies a payout ratio of approximately 74%. This payout ratio combined with the addictive nature of Altria’s products lead us
to believe that the company should increase its dividend for many years to come.
Valuation
Altria reaffirmed its 2018 earnings-per-share guidance with the release of first quarter earnings. The
company continues to expect earnings-per-share in the range of $3.90 to $4.03 for the full year. Using
the midpoint of this guidance band ($3.97), Altria is trading at a current price-to-earnings ratio of 14.2.
For context, Altria has traded at an average price-to-earnings ratio of 16.2 over the past decade, which implies a fair value of $64 for this high-quality dividend stock. We believe that through a combination
of mid-single-digit earnings growth, the company’s 5% dividend yield, and valuation expansion, Altria
has a very good chance of delivering double-digit total returns – which are even more attractive on a
risk-adjusted basis given the company’s recession-resistant business model.

23
2.00%
3.00%
4.00%
5.00%
6.00%
7.00%
8.00%
2009
2010
2011
2012
2013
2014
2015
2016
2017
2018
Altria Group (MO) Dividend Yield History

24
Enterprise Products Partners LP (EPD)
Key Statistics, Ratios & Metrics Distribution Yield: 6.2% 10 Year Distribution Growth Rate: 5.4%
Most Recent Annual Distribution Increase: 3.0% Sector: Energy
Distribution History: 19 years of increases Business Type: MLP
Ex- Distribution Date: 7/27/18 (est.) Payment Date: 8/8/18 (est.)
Overview & Current Events
Enterprise Products Partners is an oil and gas master limited partnership (MLP) and the largest MLP by
market capitalization. The partnership operates storage and transportation assets, including nearly
50,000 miles of natural gas, natural gas liquids, crude oil, and refined products pipelines. Enterprise
Products Partners also operates approximately 250 million barrels of oil storage capacity.
In late April, Enterprise Products Partners reported (4/30/18) financial results for the first quarter of
fiscal 2018. The partnership’s performance was very strong. Revenue grew by 27% and distributable
cash flow increased by 23% in the quarter to a record $1.4 billion. More importantly, Enterprise
Products Partners reported a distribution coverage ratio of 1.5x in the quarter – one of the highest
distribution coverage ratios we’ve ever seen from a master limited partnership. Because of its strong performance, Enterprise Products Partners noted that it does not expect to issue equity for the
remainder of 2018 (other than its distribution reinvestment plan and employee unit purchase plan).
Despite the partnership’s remarkable performance, Enterprise Products Partners’ unit price remained
essentially unchanged following the announcement.
Prior to that, Enterprise Products Partners increased (4/10/18) its quarterly distribution payment. The
new quarterly payout of $0.4275 per common unit represents a 3.0% increase over the prior year’s
period. Remarkably, Enterprise Products Partners has increased its distribution for 55 consecutive
quarters.
Growth Prospects & Safety
The most important growth catalysts for Enterprise Products Partners are new projects. The partnership retained $867 million of distributable cash flow in 2017 and $458 million of distributable
cash flow in the first quarter of 2018 alone. Enterprise Products Partners appears to have plenty of
opportunities to deploy this internally-generated cash. The partnership’s CEO, Jim Teague, stated in its
first quarter earnings release that “we are seeing a noticeable pick up in discussions and negotiations
and expect to announce new organic growth projects later this year.”
We believe Enterprise Products Partners is the safest MLP in both this newsletter and our broader
investment universe. The partnership has an investment-grade BBB+ rating from Standard & Poor’s
and a Baa1 rating from Moody’s. In addition, Enterprise Products Partners has a reputation for being exceptionally well-managed. This year’s ranking marked the second consecutive year in which the
partnership won the unanimous vote for the Institutional Investor All-America Executive Team for the
MLP sector.
Valuation
Enterprise Products Partners has traded at an average distribution yield of 5.2% over the last 5 years
and 5.8% over the last 10 years. Given the partnership’s current quarterly distribution, a 5.5% target
yield implies a fair value of $31 for Enterprise Products Partners. The partnership’s units currently
trade hands for $27.

25
0.00%
2.00%
4.00%
6.00%
8.00%
10.00%
12.00%
14.00%
1999
2000
2001
2002
2003
2004
2005
2006
2007
2008
2009
2010
2011
2012
2013
2014
2015
2016
2017
Enterprise Products Partners (EPD) Dividend Yield History

26
Disclaimer
Nothing presented herein is, or is intended to constitute, specific investment advice. Nothing in this newsletter should be construed as a recommendation to follow any
investment strategy or allocation. Any forward-looking statements or forecasts are based on assumptions and actual results are expected to vary from any such statements or forecasts. No reliance should be placed on any such statements or forecasts when making any investment decision. While Sure Retirement/Sure Dividend has used
reasonable efforts to obtain information from reliable sources, we make no representations or warranties as to the accuracy, reliability or completeness of third-party
information presented herein. No guarantee of investment performance is being provided and no inference to the contrary should be made. There is a risk of loss from an
investment in securities. Past performance is not a guarantee of future performance.
Closing Thoughts – Announcements & Improvements –
We’ve made an important change to the Sure Retirement Newsletter since the April 2018 edition.
Specifically, we are now incorporating expected total return data into our Top 10 rankings in the
Sure Retirement Newsletter. The Top 10 list is still ordered from best to least best as before.
The first five spots in the newsletter (stocks ranked 1 through 5) are the highest expected total
return stocks in our Sure Analysis Research database that have 4%+ yields.
The next five spots in the newsletter’s Top 10 (stocks ranked 6 through 10) are the top ranked
stocks with 4%+ yields using The 8 Rules of Dividend Investing, excluding any stock that already
made the top 5 in the Sure Retirement Newsletter from the Sure Analysis rankings.
We are making this change to better serve readers of the Sure Retirement Newsletter. We want our
best high-income ideas to be in this newsletter for our readers to benefit from. In the past, these
ideas all came from our 8 Rules ranking system.
The Sure Analysis Research Database differs from Sure Retirement in that Sure Retirement uses
historical information to quantitatively rank stocks while Sure Analysis uses historical information
combined with qualitative analysis to create expected total returns over the next 5 years for every
stock in the database. For those who aren’t familiar with the Sure Analysis Research Database, it is
explained below.
We also launched the Sure Analysis Research Database in April of 2018. It currently includes all
the ~120 dividend stocks with 25+ years of rising dividends, as well as many other past Sure
Dividend and Sure Retirement Newsletter recommendations. We will continue adding companies
based on a mix of reader recommendations and popular dividend stocks. We currently have well
over 150 research reports in the database, with more being added nearly every day.
The purpose of Sure Analysis is to provide concise 2-page research reports on dividend stocks so
self-directed investors can quickly identify the highest expected total return investments while
avoiding the worst. These reports are updated quarterly to ensure they stay timely and actionable.
In addition to the 2-page research reports, the Sure Analysis Database also has a sortable
spreadsheet to quickly sort all the database constituents by expected total return, dividend yield,
valuation, and expected growth. Sure Analysis members also get access to all 3 of our newsletters.
We believe this change will improve the quality of our future newsletter recommendations. If you
have any questions about this change, please feel free to contact us.
Thanks,
Ben Reynolds
The next newsletter publishes on Sunday, June 10th, 2018.

27
This information is not personalized advice. It is for informational purposes only. Please see disclaimer at end of newsletter for more.
List of Investments by Sector
Each of the securities with 4%+ yields in the Sure Dividend database are sorted by rank below in
order based on The 8 Rules of Dividend Investing (highest to lowest) based on its GICS sector.
Dividend or distribution yield is included next to each security’s ticker symbol.
Basic Materials 1. Westlake Chemical Partners LP (WLKP) - 7%
2. SunCoke Energy Partners LP (SXCP) - 10.3%
3. Enviva Partners LP (EVA) - 8.3%
4. Ciner Resources LP (CINR) - 9.3%
5. Compass Minerals Intl. Inc. (CMP) - 4.2%
Communication Services 1. Vodafone Grp. plc (VOD) - 5.9%
2. BCE Inc. (BCE) - 5.7%
3. AT&T Inc. (T) - 6.4%
4. Verizon Communications Inc. (VZ) - 5.1%
5. Crown Castle Intl. Corp. (CCI) - 4.1%
6. Consolidated Communications Hldgs. Inc. (CNSL) - 13.5%
7. CenturyLink Inc. (CTL) - 12%
8. IDT Corp. (IDT) - 7%
Consumer Cyclicals 1. GameStop Corp. (GME) - 11.8%
2. L Brands Inc. (LB) - 7%
3. Meredith Corp. (MDP) - 4.3%
4. Macy's Inc. (M) - 5%
5. Cedar Fair LP (FUN) - 5.4%
6. Ford Motor Co. (F) - 5.4%
7. National CineMedia Inc. (NCMI) - 9.8%
8. New Media Inv. Grp. Inc. (NEWM) - 8.8%
9. Bowl America Inc. (BWL.A) - 4.5%
10. Cato Corp./The (CATO) - 8.1%
11. General Motors Co. (GM) - 4.2%
12. Barnes & Noble Inc. (BKS) - 11.7%
13. Gannett Co. Inc. (GCI) - 5.6%
14. Buckle Inc./The (BKE) - 4.3%
Consumer Defensive 1. Altria Grp. Inc. (MO) - 5%
2. Vector Grp. Ltd (VGR) - 8.3%
3. Kraft-Heinz Co./The (KHC) - 4.3%
4. Universal Corp. (UVV) - 4.6%
5. Philip Morris Intl. Inc. (PM) - 5.2%
6. General Mills Inc. (GIS) - 4.6%
Energy 1. Buckeye Partners LP (BPL) - 12.4%
2. Energy Transfer Partners LP (ETP) - 12.4%
3. Enterprise Product Partners LP (EPD) - 6.4%
4. NuStar Energy LP (NS) - 17.9%
5. TC PipeLines LP (TCP) - 10.1%
6. Holly Energy Partners LP (HEP) - 9%
7. Enbridge Inc. (ENB) - 6.5%
8. Sunoco LP (SUN) - 12.3%
9. Royal Dutch Shell plc (RDS.A) - 5.2%
10. ONEOK Inc. (OKE) - 4.7%
11. Royal Dutch Shell plc (RDS.B) - 5%
12. Exxon Mobil Corp. (XOM) - 4.1%
13. Energy Transfer Equity LP (ETE) - 7.3%
14. CrossAmerica Partners LP (CAPL) - 11.7%
15. Spectra Energy Partners LP (SEP) - 8.8%
16. Western Gas Partners LP (WES) - 7.3%
17. Phillips 66 Partners LP (PSXP) - 5.8%
18. Magellan Midstream Partners LP (MMP) - 5.4%
19. Transmontaigne Partners LP (TLP) - 8.2%
20. Helmerich & Payne Inc. (HP) - 4.1%
21. NuStar GP Holdings LLC (NSH) - 10.7% 22. Andeavor Logistics LP (ANDX) - 9%
23. EnLink Midstream Partners LP (ENLK) - 9.7%
24. Western Gas Equity Partners LP (WGP) - 6.4%
25. TOTAL S.A. (TOT) - 4.7%
26. DCP Midstream LP (DCP) - 8.2%
27. Targa Resources Corp. (TRGP) - 7.7%
28. Delek Logistics Partners LP (DKL) - 10.6%
29. PBF Logistics LP (PBFX) - 9.6%
30. EnLink Midstream LLC (ENLC) - 6.4%
31. BP plc (BP) - 5.1%
32. Sprague Resources LP (SRLP) - 10.8%
33. Tallgrass Energy Partners LP (TEP) - 9.2%
34. Summit Midstream Partners LP (SMLP) - 15.9%
35. MPLX LP (MPLX) - 7.1%
36. GasLog Partners LP (GLOP) - 8.8%
37. Green Plains Partners LP (GPP) - 11.8%
38. USA Compression Partners LP (USAC) - 11.5%
39. SemGroup Corp. (SEMG) - 7.5%
40. Vermilion Energy Inc. (VET) - 6.3%
41. Enable Midstream Partners LP (ENBL) - 8.7%
42. Cheniere Energy Partners LP (CQP) - 7.1%
43. Black Stone Minerals LP (BSM) - 6.7%
44. Kinder Morgan Inc. (KMI) - 4.9%
45. Williams Companies Inc./The (WMB) - 5.1%
28
This information is not personalized advice. It is for informational purposes only. Please see disclaimer at end of newsletter for more.
Financial Services 1. Bank of Nova Scotia/The (BNS) - 4.1%
2. Invesco Ltd (IVZ) - 4.3%
3. Canadian Imperial Bank of Commerce (CM) - 4.7%
4. Mercury General Corp. (MCY) - 5.5%
5. PennantPark Floating Rate Capital Ltd (PFLT) - 8.6%
6. Main Street Capital Corp. (MAIN) - 5.9%
7. Hercules Capital Inc. (HTGC) - 9.8%
8. Westpac Banking Corp. (WBK) - 6.4%
9. Waddell & Reed Financial Inc. (WDR) - 5.3%
10. HSBC Holdings plc (HSBC) - 5.2%
11. Ares Capital Corp. (ARCC) - 9.3%
12. AmTrust Financial Srvcs. Inc. (AFSI) - 5.1%
13. BGC Partners Inc. (BGCP) - 5.8%
14. Banco Latinoamericano de Comercio (BLX) - 5.4%
15. Gladstone Inv. Corp. (GAIN) - 7.2%
16. Westwood Holdings Grp. Inc. (WHG) - 4.7%
17. Golub Capital BDC Inc. (GBDC) - 7%
18. Goldman Sachs BDC Inc. (GSBD) - 8.9%
19. Artisan Partners Asset Mgmt. Inc. (APAM) - 7.2%
20. FS Inv. Corp. (FSIC) - 9.7%
21. New York Community Bancorp Inc. (NYCB) - 5.8%
22. Navient Corp. (NAVI) - 4.8%
Healthcare 1. Owens & Minor Inc. (OMI) - 6.9%
2. Patterson Companies Inc. (PDCO) - 4.7%
Industrials 1. R.R. Donnelley & Sons Co. (RRD) - 8.3%
2. Macquarie Infra. Corp. (MIC) - 10.3%
3. Golar LNG Partners LP (GMLP) - 11.3%
4. Iron Mountain Inc. (IRM) - 7%
5. Compass Diversified Holdings LLC (CODI) - 9.2%
6. Nielsen Holdings plc (NLSN) - 4.6%
7. Höegh LNG Partners LP (HMLP) - 10.1%
8. Icahn Enterprises LP (IEP) - 9.7%
9. KNOT Offshore Partners LP (KNOP) - 10.1%
10. USD Partners LP (USDP) - 12.7%
11. Fortress Transport. & Infra. Investors LLC (FTAI) - 7.8%
12. Dynagas LNG Partners LP (DLNG) - 12.4%
13. Costamare Inc. (CMRE) - 5.3%
Real Estate 1. Omega Healthcare Investors Inc. (OHI) - 9.3%
2. Welltower Inc. (WELL) - 6.3%
3. Arbor Realty Trust Inc. (ABR) - 10.6%
4. Senior Housing Properties Trust (SNH) - 9.6%
5. HCP Inc. (HCP) - 6.2%
6. Realty Income Corp. (O) - 5%
7. W.P. Carey Inc. (WPC) - 6.2%
8. National Health Investors Inc. (NHI) - 5.7%
9. Tanger Factory Outlet Centers Inc. (SKT) - 6.6%
10. Lexington Realty Trust (LXP) - 8.6%
11. Starwood Property Trust Inc. (STWD) - 9%
12. LTC Properties Inc. (LTC) - 6%
13. Hospitality Properties Trust (HPT) - 7.8%
14. Taubman Centers Inc. (TCO) - 4.7%
15. Kimco Realty Corp. (KIM) - 7.7%
16. National Retail Properties Inc. (NNN) - 4.7%
17. Simon Property Grp. Inc. (SPG) - 4.9%
18. EPR Properties (EPR) - 7.2%
19. Sabra Health Care REIT Inc. (SBRA) - 9.1%
20. DDR Corp. (DDR) - 10.1%
21. Urstadt Biddle Properties Inc. (UBA) - 5.2%
22. Select Income REIT (SIR) - 9.9%
23. Ventas, Inc. (VTR) - 6%
24. Preferred Apartment Communities Inc. (APTS) - 7%
25. Apollo Comml. Real Estate Finance Inc. (ARI) - 10.1%
26. New Residential Inv. Corp. (NRZ) - 11.2%
27. STAG Industrial Inc. (STAG) - 5.4%
28. American Campus Communities Inc. (ACC) - 4.6%
29. Universal Health Realty Income Trust (UHT) - 4.3%
30. Macerich Co. (MAC) - 5.2%
31. One Liberty Properties Inc. (OLP) - 7.4%
32. Kite Realty Grp. Trust (KRG) - 8.4%
33. VEREIT Inc. (VER) - 7.9%
34. The GEO Grp. Inc. (GEO) - 7.9%
35. LaSalle Hotel Properties (LHO) - 5.9%
36. Chesapeake Lodging Trust (CHSP) - 5.2%
37. CorEnergy Infra. Trust Inc. (CORR) - 8.1%
38. Life Storage Inc. (LSI) - 4.4%
39. Urstadt Biddle Properties Inc. (UBP) - 5.6%
40. Ares Comml. Real Estate Corp. (ACRE) - 8.4%
41. Hannon Armstrong Sust. Infra. Capital Inc. (HASI) - 6.9%
42. Brixmor Property Grp. Inc. (BRX) - 7.5%
43. Medical Properties Trust Inc. (MPW) - 7.6%
44. Brookfield Property Partners LP (BPY) - 6.4%
45. Spirit Realty Capital Inc. (SRC) - 8.5%
46. Armada Hoffler Properties Inc. (AHH) - 5.7%
47. Chatham Lodging Trust (CLDT) - 6.7%
48. Gladstone Comml. Corp. (GOOD) - 8.2%
49. Ryman Hospitality Properties Inc. (RHP) - 4.1%
50. RLJ Lodging Trust (RLJ) - 6.1%
51. Landmark Infra. Partners LP (LMRK) - 10.2%
52. Pennsylvania Real Estate Inv. Trust (PEI) - 8.3%
53. Community Healthcare Trust Inc. (CHCT) - 5.9%
54. GGP Inc. (GGP) - 4.3%
55. Government Properties Income Trust (GOV) - 12.4%
56. Granite Real Estate Inv. Trust (GRP.U) - 5.3%
57. Pebblebrook Hotel Trust (PEB) - 4.1%
58. Hersha Hospitality Trust (HT) - 5.7%
59. Brandywine Realty Trust (BDN) - 4.3%
60. Redwood Trust Inc. (RWT) - 6.9%
61. City Office REIT Inc. (CIO) - 8%
62. Ashford Hospitality Trust Inc. (AHT) - 6.7%
63. InfraREIT Inc. (HIFR) - 4.7%
64. MGM Growth Properties LLC (MGP) - 6%
65. Global Net Lease Inc. (GNL) - 10.8%
66. Xenia Hotels & Resorts Inc. (XHR) - 4.8%
67. Apple Hospitality REIT Inc. (APLE) - 6.5%
68. Northstar Realty Europe Corp. (NRE) - 4.1%
69. Independence Realty Trust Inc. (IRT) - 7.6%
29
This information is not personalized advice. It is for informational purposes only. Please see disclaimer at end of newsletter for more.
70. New Senior Inv. Grp. Inc. (SNR) - 12%
71. Uniti Grp. Inc. (UNIT) - 12.5%
72. Outfront Media Inc. (OUT) - 7.3%
73. Franklin Street Properties Corp. (FSP) - 8.5%
Technology 1. International Business Machines Corp. (IBM) - 4.4%
2. QUALCOMM Inc. (QCOM) - 4.7%
3. Seagate Technology plc (STX) - 4.4%%
Utilities 1. AmeriGas Partners LP (APU) - 9.2%
2. Southern Co. (SO) - 5.5%
3. Dominion Energy Inc./VA (D) - 5.3%
4. PPL Corp. (PPL) - 5.9%
5. SCANA Corp. (SCG) - 7%
6. CenterPoint Energy Inc. (CNP) - 4.2%
7. Brookfield Renewable Partners LP (BEP) - 6.4%
8. Duke Energy Corp. (DUK) - 4.6%
9. NorthWestern Corp. (NWE) - 4.1%
10. NRG Yield Inc. (NYLD.A) - 7.2% 11. Pattern Energy Grp. Inc. (PEGI) - 9.4%
12. Edison Intl. (EIX) - 4%
13. Entergy Corp. (ETR) - 4.6%
14. AES Corp./The (AES) - 4.3%
15. 8point3 Energy Partners LP (CAFD) - 9.2%
16. NRG Yield Inc. (NYLD) - 7.1%
17. FirstEnergy Corp. (FE) - 4.3%
30
This information is not personalized advice. It is for informational purposes only. Please see disclaimer at end of newsletter for more.
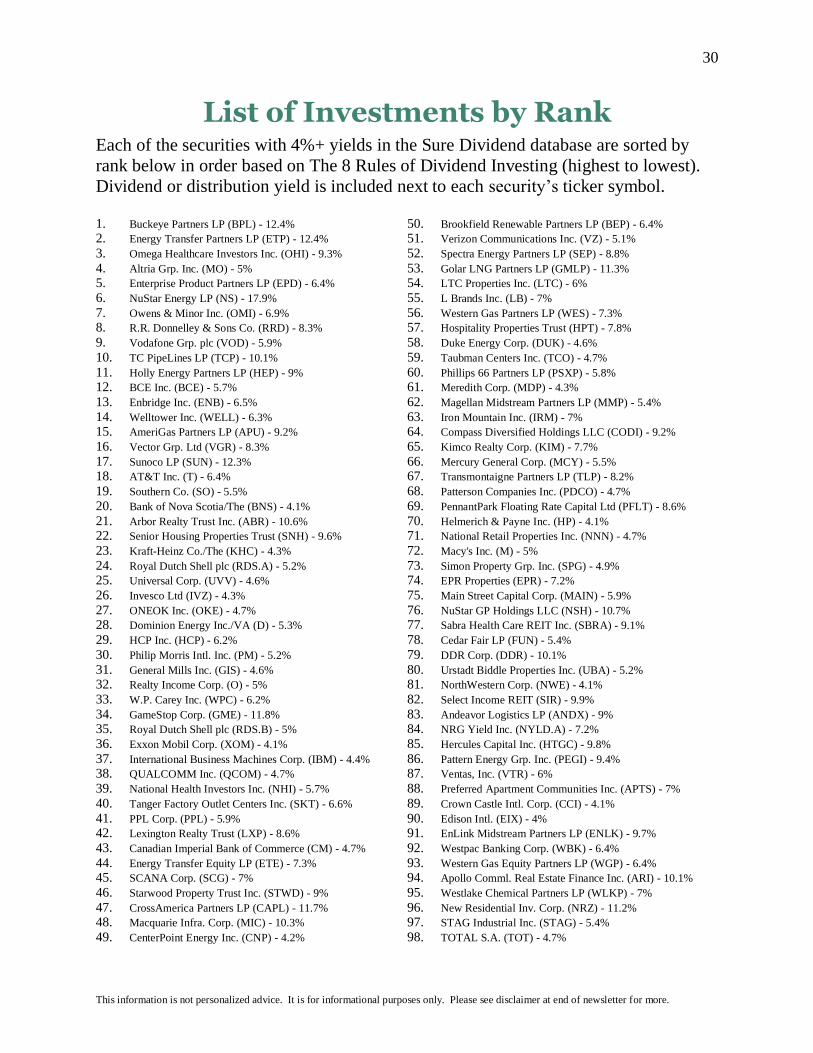
List of Investments by Rank
Each of the securities with 4%+ yields in the Sure Dividend database are sorted by
rank below in order based on The 8 Rules of Dividend Investing (highest to lowest).
Dividend or distribution yield is included next to each security’s ticker symbol. 1. Buckeye Partners LP (BPL) - 12.4%
2. Energy Transfer Partners LP (ETP) - 12.4%
3. Omega Healthcare Investors Inc. (OHI) - 9.3%
4. Altria Grp. Inc. (MO) - 5%
5. Enterprise Product Partners LP (EPD) - 6.4%
6. NuStar Energy LP (NS) - 17.9%
7. Owens & Minor Inc. (OMI) - 6.9%
8. R.R. Donnelley & Sons Co. (RRD) - 8.3%
9. Vodafone Grp. plc (VOD) - 5.9%
10. TC PipeLines LP (TCP) - 10.1%
11. Holly Energy Partners LP (HEP) - 9%
12. BCE Inc. (BCE) - 5.7%
13. Enbridge Inc. (ENB) - 6.5%
14. Welltower Inc. (WELL) - 6.3%
15. AmeriGas Partners LP (APU) - 9.2%
16. Vector Grp. Ltd (VGR) - 8.3%
17. Sunoco LP (SUN) - 12.3%
18. AT&T Inc. (T) - 6.4%
19. Southern Co. (SO) - 5.5%
20. Bank of Nova Scotia/The (BNS) - 4.1%
21. Arbor Realty Trust Inc. (ABR) - 10.6%
22. Senior Housing Properties Trust (SNH) - 9.6%
23. Kraft-Heinz Co./The (KHC) - 4.3%
24. Royal Dutch Shell plc (RDS.A) - 5.2%
25. Universal Corp. (UVV) - 4.6%
26. Invesco Ltd (IVZ) - 4.3%
27. ONEOK Inc. (OKE) - 4.7%
28. Dominion Energy Inc./VA (D) - 5.3%
29. HCP Inc. (HCP) - 6.2%
30. Philip Morris Intl. Inc. (PM) - 5.2%
31. General Mills Inc. (GIS) - 4.6%
32. Realty Income Corp. (O) - 5%
33. W.P. Carey Inc. (WPC) - 6.2%
34. GameStop Corp. (GME) - 11.8%
35. Royal Dutch Shell plc (RDS.B) - 5%
36. Exxon Mobil Corp. (XOM) - 4.1%
37. International Business Machines Corp. (IBM) - 4.4%
38. QUALCOMM Inc. (QCOM) - 4.7%
39. National Health Investors Inc. (NHI) - 5.7%
40. Tanger Factory Outlet Centers Inc. (SKT) - 6.6%
41. PPL Corp. (PPL) - 5.9%
42. Lexington Realty Trust (LXP) - 8.6%
43. Canadian Imperial Bank of Commerce (CM) - 4.7%
44. Energy Transfer Equity LP (ETE) - 7.3%
45. SCANA Corp. (SCG) - 7%
46. Starwood Property Trust Inc. (STWD) - 9%
47. CrossAmerica Partners LP (CAPL) - 11.7%
48. Macquarie Infra. Corp. (MIC) - 10.3%
49. CenterPoint Energy Inc. (CNP) - 4.2%
50. Brookfield Renewable Partners LP (BEP) - 6.4%
51. Verizon Communications Inc. (VZ) - 5.1%
52. Spectra Energy Partners LP (SEP) - 8.8%
53. Golar LNG Partners LP (GMLP) - 11.3%
54. LTC Properties Inc. (LTC) - 6%
55. L Brands Inc. (LB) - 7%
56. Western Gas Partners LP (WES) - 7.3%
57. Hospitality Properties Trust (HPT) - 7.8%
58. Duke Energy Corp. (DUK) - 4.6%
59. Taubman Centers Inc. (TCO) - 4.7%
60. Phillips 66 Partners LP (PSXP) - 5.8%
61. Meredith Corp. (MDP) - 4.3%
62. Magellan Midstream Partners LP (MMP) - 5.4%
63. Iron Mountain Inc. (IRM) - 7%
64. Compass Diversified Holdings LLC (CODI) - 9.2%
65. Kimco Realty Corp. (KIM) - 7.7%
66. Mercury General Corp. (MCY) - 5.5%
67. Transmontaigne Partners LP (TLP) - 8.2%
68. Patterson Companies Inc. (PDCO) - 4.7%
69. PennantPark Floating Rate Capital Ltd (PFLT) - 8.6%
70. Helmerich & Payne Inc. (HP) - 4.1%
71. National Retail Properties Inc. (NNN) - 4.7%
72. Macy's Inc. (M) - 5%
73. Simon Property Grp. Inc. (SPG) - 4.9%
74. EPR Properties (EPR) - 7.2%
75. Main Street Capital Corp. (MAIN) - 5.9%
76. NuStar GP Holdings LLC (NSH) - 10.7%
77. Sabra Health Care REIT Inc. (SBRA) - 9.1%
78. Cedar Fair LP (FUN) - 5.4%
79. DDR Corp. (DDR) - 10.1%
80. Urstadt Biddle Properties Inc. (UBA) - 5.2%
81. NorthWestern Corp. (NWE) - 4.1%
82. Select Income REIT (SIR) - 9.9%
83. Andeavor Logistics LP (ANDX) - 9%
84. NRG Yield Inc. (NYLD.A) - 7.2%
85. Hercules Capital Inc. (HTGC) - 9.8%
86. Pattern Energy Grp. Inc. (PEGI) - 9.4%
87. Ventas, Inc. (VTR) - 6%
88. Preferred Apartment Communities Inc. (APTS) - 7%
89. Crown Castle Intl. Corp. (CCI) - 4.1%
90. Edison Intl. (EIX) - 4%
91. EnLink Midstream Partners LP (ENLK) - 9.7%
92. Westpac Banking Corp. (WBK) - 6.4%
93. Western Gas Equity Partners LP (WGP) - 6.4%
94. Apollo Comml. Real Estate Finance Inc. (ARI) - 10.1%
95. Westlake Chemical Partners LP (WLKP) - 7%
96. New Residential Inv. Corp. (NRZ) - 11.2%
97. STAG Industrial Inc. (STAG) - 5.4%
98. TOTAL S.A. (TOT) - 4.7%

31
This information is not personalized advice. It is for informational purposes only. Please see disclaimer at end of newsletter for more.
99. DCP Midstream LP (DCP) - 8.2%
100. American Campus Communities Inc. (ACC) - 4.6%
101. Targa Resources Corp. (TRGP) - 7.7%
102. Universal Health Realty Income Trust (UHT) - 4.3%
103. Macerich Co. (MAC) - 5.2%
104. One Liberty Properties Inc. (OLP) - 7.4%
105. Delek Logistics Partners LP (DKL) - 10.6%
106. Ford Motor Co. (F) - 5.4%
107. Entergy Corp. (ETR) - 4.6%
108. Kite Realty Grp. Trust (KRG) - 8.4%
109. PBF Logistics LP (PBFX) - 9.6%
110. Waddell & Reed Financial Inc. (WDR) - 5.3%
111. VEREIT Inc. (VER) - 7.9%
112. The GEO Grp. Inc. (GEO) - 7.9%
113. LaSalle Hotel Properties (LHO) - 5.9%
114. AES Corp./The (AES) - 4.3%
115. HSBC Holdings plc (HSBC) - 5.2%
116. Ares Capital Corp. (ARCC) - 9.3%
117. Nielsen Holdings plc (NLSN) - 4.6%
118. EnLink Midstream LLC (ENLC) - 6.4%
119. Chesapeake Lodging Trust (CHSP) - 5.2%
120. CorEnergy Infra. Trust Inc. (CORR) - 8.1%
121. Life Storage Inc. (LSI) - 4.4%
122. Urstadt Biddle Properties Inc. (UBP) - 5.6%
123. Ares Comml. Real Estate Corp. (ACRE) - 8.4%
124. Höegh LNG Partners LP (HMLP) - 10.1%
125. AmTrust Financial Srvcs. Inc. (AFSI) - 5.1%
126. Hannon Armstrong Sust. Infra. Capital Inc. (HASI) - 6.9%
127. 8point3 Energy Partners LP (CAFD) - 9.2%
128. BP plc (BP) - 5.1%
129. Brixmor Property Grp. Inc. (BRX) - 7.5%
130. BGC Partners Inc. (BGCP) - 5.8%
131. Medical Properties Trust Inc. (MPW) - 7.6%
132. Banco Latinoamericano de Comercio (BLX) - 5.4%
133. Sprague Resources LP (SRLP) - 10.8%
134. Tallgrass Energy Partners LP (TEP) - 9.2%
135. Brookfield Property Partners LP (BPY) - 6.4%
136. Gladstone Inv. Corp. (GAIN) - 7.2%
137. Icahn Enterprises LP (IEP) - 9.7%
138. Westwood Holdings Grp. Inc. (WHG) - 4.7%
139. Spirit Realty Capital Inc. (SRC) - 8.5%
140. Armada Hoffler Properties Inc. (AHH) - 5.7%
141. Chatham Lodging Trust (CLDT) - 6.7%
142. Gladstone Comml. Corp. (GOOD) - 8.2%
143. Ryman Hospitality Properties Inc. (RHP) - 4.1%
144. Summit Midstream Partners LP (SMLP) - 15.9%
145. National CineMedia Inc. (NCMI) - 9.8%
146. MPLX LP (MPLX) - 7.1%
147. SunCoke Energy Partners LP (SXCP) - 10.3%
148. GasLog Partners LP (GLOP) - 8.8%
149. KNOT Offshore Partners LP (KNOP) - 10.1%
150. RLJ Lodging Trust (RLJ) - 6.1%
151. USD Partners LP (USDP) - 12.7%
152. NRG Yield Inc. (NYLD) - 7.1%
153. Landmark Infra. Partners LP (LMRK) - 10.2%
154. Seagate Technology plc (STX) - 4.4%
155. Green Plains Partners LP (GPP) - 11.8%
156. Pennsylvania Real Estate Inv. Trust (PEI) - 8.3%
157. USA Compression Partners LP (USAC) - 11.5%
158. Community Healthcare Trust Inc. (CHCT) - 5.9%
159. GGP Inc. (GGP) - 4.3%
160. Enviva Partners LP (EVA) - 8.3%
161. Ciner Resources LP (CINR) - 9.3%
162. Government Properties Income Trust (GOV) - 12.4%
163. Granite Real Estate Inv. Trust (GRP.U) - 5.3%
164. SemGroup Corp. (SEMG) - 7.5%
165. Pebblebrook Hotel Trust (PEB) - 4.1%
166. Hersha Hospitality Trust (HT) - 5.7%
167. New Media Inv. Grp. Inc. (NEWM) - 8.8%
168. Bowl America Inc. (BWL.A) - 4.5%
169. Brandywine Realty Trust (BDN) - 4.3%
170. Cato Corp./The (CATO) - 8.1%
171. Vermilion Energy Inc. (VET) - 6.3%
172. Redwood Trust Inc. (RWT) - 6.9%
173. City Office REIT Inc. (CIO) - 8%
174. Ashford Hospitality Trust Inc. (AHT) - 6.7%
175. Golub Capital BDC Inc. (GBDC) - 7%
176. InfraREIT Inc. (HIFR) - 4.7%
177. General Motors Co. (GM) - 4.2%
178. MGM Growth Properties LLC (MGP) - 6%
179. Enable Midstream Partners LP (ENBL) - 8.7%
180. Goldman Sachs BDC Inc. (GSBD) - 8.9%
181. Global Net Lease Inc. (GNL) - 10.8%
182. Xenia Hotels & Resorts Inc. (XHR) - 4.8%
183. Apple Hospitality REIT Inc. (APLE) - 6.5%
184. Northstar Realty Europe Corp. (NRE) - 4.1%
185. Independence Realty Trust Inc. (IRT) - 7.6%
186. Fortress Transport. & Infra. Investors LLC (FTAI) - 7.8%
187. Artisan Partners Asset Mgmt. Inc. (APAM) - 7.2%
188. Cheniere Energy Partners LP (CQP) - 7.1%
189. New Senior Inv. Grp. Inc. (SNR) - 12%
190. FirstEnergy Corp. (FE) - 4.3%
191. Compass Minerals Intl. Inc. (CMP) - 4.2%
192. Black Stone Minerals LP (BSM) - 6.7%
193. FS Inv. Corp. (FSIC) - 9.7%
194. Dynagas LNG Partners LP (DLNG) - 12.4%
195. Uniti Grp. Inc. (UNIT) - 12.5%
196. Barnes & Noble Inc. (BKS) - 11.7%
197. Kinder Morgan Inc. (KMI) - 4.9%
198. Consolidated Communications Hldgs. Inc. (CNSL) - 13.5%
199. CenturyLink Inc. (CTL) - 12%
200. Williams Companies Inc./The (WMB) - 5.1%
201. Outfront Media Inc. (OUT) - 7.3%
202. New York Community Bancorp Inc. (NYCB) - 5.8%
203. Navient Corp. (NAVI) - 4.8%
204. Costamare Inc. (CMRE) - 5.3%
205. Franklin Street Properties Corp. (FSP) - 8.5%
206. Gannett Co. Inc. (GCI) - 5.6%
207. IDT Corp. (IDT) - 7%
208. Buckle Inc./The (BKE) - 4.3%
32
This information is not personalized advice. It is for informational purposes only. Please see disclaimer at end of newsletter for more.
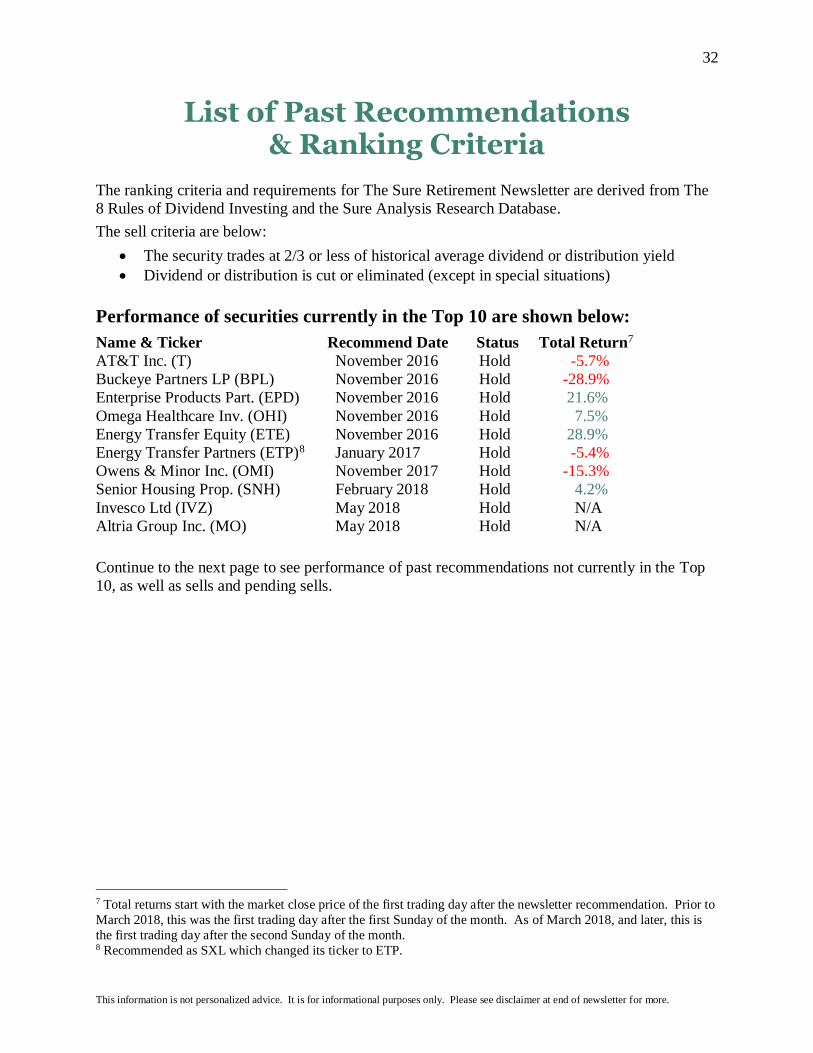
List of Past Recommendations & Ranking Criteria
The ranking criteria and requirements for The Sure Retirement Newsletter are derived from The
8 Rules of Dividend Investing and the Sure Analysis Research Database.
The sell criteria are below:
• The security trades at 2/3 or less of historical average dividend or distribution yield
• Dividend or distribution is cut or eliminated (except in special situations)
Performance of securities currently in the Top 10 are shown below:
Name & Ticker Recommend Date Status Total Return7
AT&T Inc. (T) November 2016 Hold -5.7%
Buckeye Partners LP (BPL) November 2016 Hold -28.9%
Enterprise Products Part. (EPD) November 2016 Hold 21.6%
Omega Healthcare Inv. (OHI) November 2016 Hold 7.5%
Energy Transfer Equity (ETE) November 2016 Hold 28.9%
Energy Transfer Partners (ETP)8 January 2017 Hold -5.4%
Owens & Minor Inc. (OMI) November 2017 Hold -15.3%
Senior Housing Prop. (SNH) February 2018 Hold 4.2%
Invesco Ltd (IVZ) May 2018 Hold N/A
Altria Group Inc. (MO) May 2018 Hold N/A
Continue to the next page to see performance of past recommendations not currently in the Top
10, as well as sells and pending sells.
7 Total returns start with the market close price of the first trading day after the newsletter recommendation. Prior to
March 2018, this was the first trading day after the first Sunday of the month. As of March 2018, and later, this is
the first trading day after the second Sunday of the month. 8 Recommended as SXL which changed its ticker to ETP.
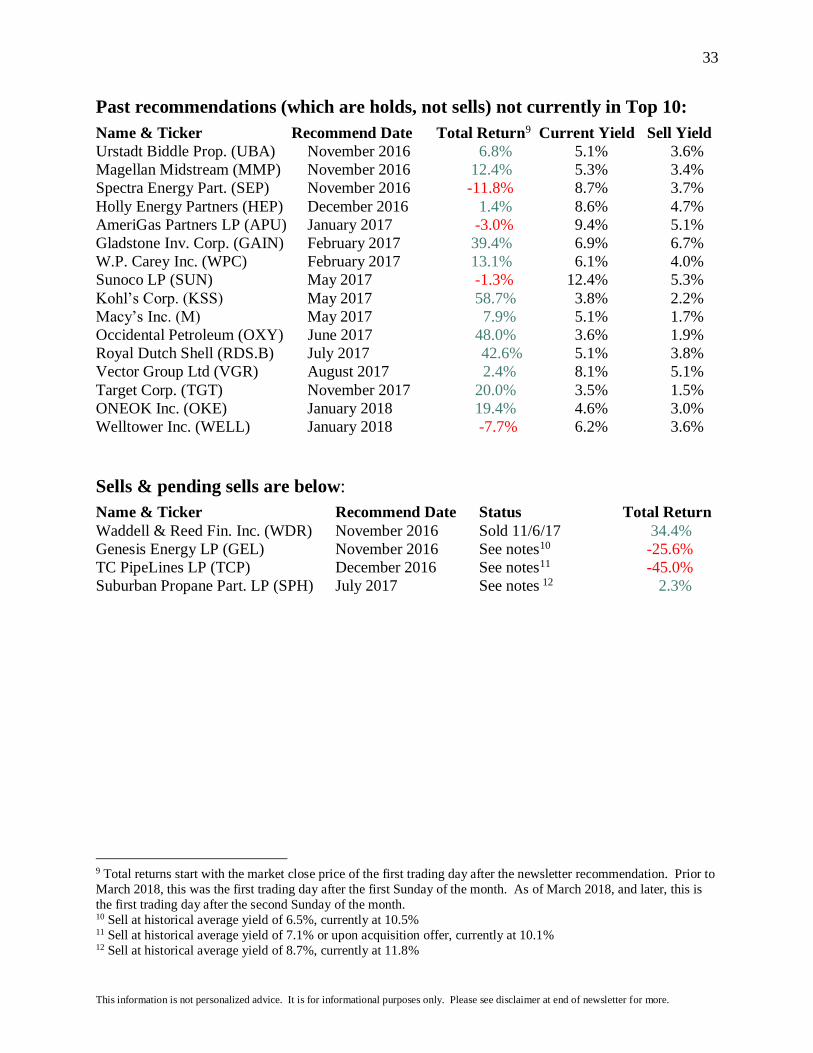
33
This information is not personalized advice. It is for informational purposes only. Please see disclaimer at end of newsletter for more.
Past recommendations (which are holds, not sells) not currently in Top 10:
Name & Ticker Recommend Date Total Return9 Current Yield Sell Yield
Urstadt Biddle Prop. (UBA) November 2016 6.8% 5.1% 3.6%
Magellan Midstream (MMP) November 2016 12.4% 5.3% 3.4%
Spectra Energy Part. (SEP) November 2016 -11.8% 8.7% 3.7%
Holly Energy Partners (HEP) December 2016 1.4% 8.6% 4.7%
AmeriGas Partners LP (APU) January 2017 -3.0% 9.4% 5.1%
Gladstone Inv. Corp. (GAIN) February 2017 39.4% 6.9% 6.7%
W.P. Carey Inc. (WPC) February 2017 13.1% 6.1% 4.0%
Sunoco LP (SUN) May 2017 -1.3% 12.4% 5.3%
Kohl’s Corp. (KSS) May 2017 58.7% 3.8% 2.2%
Macy’s Inc. (M) May 2017 7.9% 5.1% 1.7%
Occidental Petroleum (OXY) June 2017 48.0% 3.6% 1.9%
Royal Dutch Shell (RDS.B) July 2017 42.6% 5.1% 3.8%
Vector Group Ltd (VGR) August 2017 2.4% 8.1% 5.1%
Target Corp. (TGT) November 2017 20.0% 3.5% 1.5%
ONEOK Inc. (OKE) January 2018 19.4% 4.6% 3.0%
Welltower Inc. (WELL) January 2018 -7.7% 6.2% 3.6%
Sells & pending sells are below:
Name & Ticker Recommend Date Status Total Return
Waddell & Reed Fin. Inc. (WDR) November 2016 Sold 11/6/17 34.4%
Genesis Energy LP (GEL) November 2016 See notes10 -25.6%
TC PipeLines LP (TCP) December 2016 See notes11 -45.0%
Suburban Propane Part. LP (SPH) July 2017 See notes 12 2.3%
9 Total returns start with the market close price of the first trading day after the newsletter recommendation. Prior to
March 2018, this was the first trading day after the first Sunday of the month. As of March 2018, and later, this is
the first trading day after the second Sunday of the month. 10 Sell at historical average yield of 6.5%, currently at 10.5% 11 Sell at historical average yield of 7.1% or upon acquisition offer, currently at 10.1% 12 Sell at historical average yield of 8.7%, currently at 11.8%

34
This information is not personalized advice. It is for informational purposes only. Please see disclaimer at end of newsletter for more.
Portfolio Building Guide
The process of building a high-yield dividend portfolio is straightforward: Each month invest
in the top-ranked security in which you own the smallest dollar amount out of the Top 10.
Over time, you will build a well-diversified portfolio of quality businesses purchased when they
yield 4% or more. If your portfolio has 25% or more allocated to one sector, buy the highest
ranked stock not in that sector. Alternatively, the Top 10 list is also useful as an idea generation
tool for those with a different portfolio allocation plan.
Examples Portfolio 1 Portfolio 2
Ticker Name Amount Ticker Name Amount
OMI Owens & Minor $ 1,002 OMI Owens & Minor $ 4,374
ETE Energy Transfer Equity $ - ETE Energy Transfer Equity $ 4,878
IVZ Invesco $ - IVZ Invesco $ 5,374
SNH Senior Housing Proper. $ - SNH Senior Housing Proper. $ 4,353
T AT&T $ - T AT&T $ 7,312
BPL Buckeye Partners $ - BPL Buckeye Partners $ 2,799
ETP Energy Transfer Partners $ - ETP Energy Transfer Partners $ 2,952
OHI Omega Healthcare $ - OHI Omega Healthcare $ 6,660
MO Altria Group $ - MO Altria Group $ 2,367 EPD Enterprise Products $ - EPD Enterprise Products $ 2,818
- If you had portfolio 1, you would buy ETE, the top ranked security you own least.
- If you had portfolio 2, you would buy MO, the top ranked security you own least.
If you have an existing portfolio or a large lump sum to invest, switch over to the Sure
Retirement strategy over 20 months. Each month take 1/20 of your initial portfolio value and
buy the top-ranked security you own the least out of the Top 10 (if that sector makes up less than
25% of your portfolio). When you sell a security, use the proceeds to purchase the top-ranked
security you own the least.
This simple investing process will build a diversified portfolio of high-quality dividend or
distribution securities over a period of less than 2 years. There’s nothing magical about 20
months. A period of 15 months or 30 months will yield similar results.
If your portfolio grows too large to manage comfortably (for example, you are not comfortable
holding 40+ securities – which would happen after around 4 years of the Sure Dividend system),
you will need to sell holdings. I recommend eliminating positions that have the lowest yields.
You can combine recommendations from The Sure Retirement, The Sure Dividend, and The
Sure Dividend International Newsletters by targeting a specific yield for your overall portfolio.
When you need your portfolio yield to increase, invest from The Sure Retirement Newsletter. If
less yield is required (and growth is preferred), invest from The Sure Dividend Newsletter. The
Sure Dividend International Newsletter can be used for international diversification.

35
This information is not personalized advice. It is for informational purposes only. Please see disclaimer at end of newsletter for more.
Tax Guide There are 4 broad types of investment vehicles covered in The Sure Retirement Newsletter:
1. Corporations
2. Master Limited Partnerships (MLPs)
3. Real Estate Investment Trusts (REITs)
4. Business Development Companies (BDCs)
The organization form is important for tax purposes because it determines how efficiently a
company can return money to unit or shareholders. An example is below.
Imagine a company makes $10, pre-tax, and distributes 100% to investors. The image below
shows how much of the $10 would go to investors using standard assumptions for the three
investment vehicles:
Note: Tax treatment for BDCs and REITs is similar. BDCs have been omitted from the
images below because of this.
• $5.92 in after-tax income from Corporation
• $6.81 in after-tax income from REIT
• $7.41 in after-tax income from MLP
The image below gives an overview of the different organizational forms:

36
This information is not personalized advice. It is for informational purposes only. Please see disclaimer at end of newsletter for more.
Corporations Corporations are taxed on income at the corporate level. They then pay out this after-tax
income to shareholders. Shareholders are then taxed again at the individual level.
Note: The United States corporate tax rate (including the state and federal levels) is 26%
after the Tax Cuts and Jobs Act. The global average is 23%, for comparison.
Corporations issue a 1099 to track dividend payments to shareholders. They are the simplest
and most common type of investment. They are also the least tax-advantaged.
Given the choice, corporations should be held in a retirement account to minimize taxes. Of
course, owning them in a taxable account is fine, one will just be paying taxes on dividends
received. Capital gains taxes are only triggered when a common stock is sold, making it tax
advantageous to buy and hold.
Capital gains taxes are divided into two types: short-term and long-term. Short-term capital
gains tax applies to investments held for less than a year. The short-term capital gains rate is
your ordinary income tax rate. It ranges between 10% and 37% depending on your income
bracket.
Long-term capital gains apply to most types of investments (including Corporations, REITs,
and MLPs) held longer than 1 year. The maximum long-term capital gains tax rate is 20%.
The minimum is 0%. Most investors will fall into the 15% long-term capital gains tax
bracket.
Dividend taxes are also divided into two types: ordinary and qualified. Most dividends paid
from blue-chip dividend stocks are ‘qualified.’ The requirements for a dividend to be
classified as ‘qualified’ are below:
• The company must be a U.S. corporation, or a foreign corporation that readily trades
on major U.S. exchanges, or be incorporated in a U.S. territory.
• The investor must have held the stock for 60+ days before the ex-dividend date.
Qualified dividends are taxed at the same rate as long-term capital gains; between 0% and
20% (though most investors will be in the 15% bracket). Ordinary dividends are dividends

37
This information is not personalized advice. It is for informational purposes only. Please see disclaimer at end of newsletter for more.
that do not meet the criteria to be ‘qualified.’ Ordinary dividends are taxed at the ordinary
income tax rate.
Master Limited Partnerships (MLPs) MLPs are the most tax efficient vehicle for returning money to investors. They avoid the
double taxation issues of Corporations. MLPs are not taxed at the organization level.
Unfortunately, MLPs are also the most complicated.
Typically, somewhere around 80% to 90% of MLP distributions are considered a ‘return
of capital’ because of depreciation. You don’t pay taxes immediately on ‘return of
capital’ distributions.
Returns of capital reduce your cost basis in the MLP. You are not taxed until you sell the
units.
For example, imagine you buy 10 units of an MLP at $100 a unit for a total investment of
$1,000. Now imagine you hold for 5 years.
The MLP unit price has increased to $120. Your investment is now worth $1,200. It also paid out $37.50 per unit in distributions over this time, with 80% of that being a
return of capital ($37.50 x 80% = $30 return of capital).
The 20% of distributions that were not returns of capital would be taxed at your ordinary income tax rate, which is up to 37%. These taxes would be due the year they are accrued.
Your cost basis would be $700 (initial investment amount of $1,000 less return of capital
of $30 per unit or $300 total). The amount of long-term capital gains tax you owe
(assuming you are in the 20% tax bracket) is $100.
Math Behind Example: Sale price of $1,200 less cost basis of $700 = $500 in capital
gains. $500 in capital gains x 20% tax bracket = $100.
As a caveat, if the cost basis ever falls below 0 (which will only happen after holding for
around a decade or more), you will owe long-term capital gains tax on the amount the
cost basis is below 0 every year.
Return of capital and other issues discussed above do not matter when MLPs are held in a
retirement account.
There is a different issue with holding MLPs in a retirement account, however. This
includes 401(k), IRA, and Roth IRA accounts, among others.
When retirement plans conduct or invest in a business activity, they must file separate tax
forms to report Unrelated Business Income (UBI) and may owe Unrelated Business
Taxable Income (UBTI). UBTI tax brackets go up to 37% (the top personal rate).
MLPs issue K-1 forms for tax reporting. K-1s report business income, expense, and loss
to owners. Therefore, MLPs held in retirement accounts may still qualify for taxes.
38
This information is not personalized advice. It is for informational purposes only. Please see disclaimer at end of newsletter for more.
If UBI for all holdings in your retirement account is over $1,000, you must have your
retirement account provider (typically, your brokerage) file Form 990-T. You will want to file form 990-T as well if you have a UBI loss to get a loss carryforward for
subsequent tax years. Failure to file form 990-T and pay UBIT can lead to severe
penalties. Fortunately, UBIs are often negative. It is a fairly rare occurrence to owe
taxes on UBI.
The subject of MLP taxation can be complicated and confusing. Hiring a tax
professional to aid in preparing taxes is a viable option for dealing with the complexity.
The bottom line is this: MLPs are tax-advantaged vehicles that are suited for investors
looking for current income. It is fine to hold them in either taxable or non-taxable
(retirement) accounts. Since retirement accounts are already tax-deferred, holding MLPs
in taxable accounts allows you to ‘get credit’ for the full effects of their unique structure.
Real Estate Investment Trusts (REITs) Like MLPs, REITs avoid double taxation. REITs are not taxed at the organization level.
REITs are in between MLPs and Corporations in terms of both complexity and tax-
advantages. REITs are required to pay out 90%+ of their income.
REITs are organized as trusts. As a result, ‘shareholders’ are actually unit holders.
REITs issue 1099 forms (just like corporations) instead of K-1 forms (like MLPs do). Unit holders receive distributions, not dividends (just like MLPs). REIT distributions fall
into three categories:
• Ordinary income
• Return of capital
• Capital gains
Ordinary income is taxed at your ordinary income tax rate; up to 37%. Return of capital
reduces your cost basis (just as it does with MLPs). Capital gains are taxed at either
short-term or long-term capital gains rates.
The percentage of distributions from these three sources varies by REIT. In general,
ordinary income tends to be the majority of the distribution. Expect around 70% of
distributions as ordinary income, 15% as a return of capital, and 15% as capital gains.
REITs are best suited for retirement accounts because the majority of their payments are
taxed as ordinary income. Retirement accounts remove this negative and make REITs
very tax advantageous.
This doesn’t mean you should never own a REIT in a taxable account. A good
investment is a good investment, regardless of tax issues. If you have the choice, REITs
should definitely be placed in a retirement account such as an IRA or 401k.

39
This information is not personalized advice. It is for informational purposes only. Please see disclaimer at end of newsletter for more.
Business Development Companies (BDCs) Much like REITs, business development companies must pay out 90%+ of their income
as distributions. Additionally, business development companies must derive 90% of their gross income from interest, dividends, or capital gains on securities.
BDCs pay their distributions as a mix of:
• Ordinary income & non-qualified dividends
• Qualified dividends
• Return of capital
• Capital gains
Just as with MLPs, returns of capital reduce your tax basis. Qualified dividends and
long-term capital gains are taxed at lower rates, while ordinary income and non-qualified dividends are taxed at your personal income tax bracket rate.
Unfortunately, 70% to 80% of BDC income is typically derived from ordinary income.
Because of this, they make excellent vehicles for tax-advantaged retirement accounts.
Please email us at [email protected] with any questions you have on taxes
regarding retirement accounts, MLPs, and REITs. Frequently asked questions will be
added to this tax guide.
As a newsletter provider, I can’t provide specific personal investment advice, only
general information.
40
This information is not personalized advice. It is for informational purposes only. Please see disclaimer at end of newsletter for more.
Glossary of Common Terms & Acronyms
Adjusted Funds From Operations (AFFO): A term used to describe Funds From
Operations (FFO), plus non-recurring items that do not impact the long-term
fundamentals of the business. See FFO in this glossary for more.
Cash Available for Distribution (CAD): This term is also referred to as funds available
for distribution (FAD). It is the cash available to be distributed to unitholders. It is most
commonly seen with REITs. CAD is calculated by subtracting recurring capital
expenditures from funds from operations.
Distributable Cash Flow (DCF): A non-GAAP (Generally Accepted Accounting
Principles) financial metric frequently utilized by Master Limited Partnerships as an
alternative to earnings-per-share. Expresses cash available for unitholder distributions,
after payments to the General Partner. Calculated by adding non-cash items, such as depreciation and one-time expenses, to net income. Viewed as a better gauge of financial
health than earnings-per-share, as MLPs operate asset-heavy business models with
significant depreciation expenses.
Dividend Yield: The annual dividend returns from an investment, expressed as a
percentage. The dividend yield is calculated from the annual dividend per share, divided
by the stock price per share. MLPs and REITs pay distributions, not dividends.
Distribution yield is used for them instead of dividend yield, though some companies
(notably REITs) call it a dividend for ease of understanding by the public.
Dividend Payout Ratio: The percentage of earnings paid to shareholders as a dividend.
The payout ratio is calculated from the annual dividend per share, divided by annual
earnings-per-share. For MLPs and REITs, this is typically expressed as the distribution coverage ratio.
EBITDA: Earnings before interest, taxes, depreciation, and amortization. Used by
companies with high levels of depreciation and interest costs, such as MLPs, to indicate the financial health of a business. A similar metric to operating cash flow. Frequently
used as part of leverage ratios such as debt-to-EBITDA.
Funds From Operations (FFO): A non-GAAP financial metric frequently utilized by Real Estate Investment Trusts, as an alternative to earnings-per-share. FFO is calculated
by adding depreciation and amortization expenses to net income, minus any gains on
asset sales. REITs view FFO as a more accurate gauge of financial health, since
earnings-per-share are heavily impacted by depreciation and amortization expenses.
GAAP: Generally accepted accounting principles. These are legally required,
standardized accounting rules and procedures used when preparing financial statements.
If you read a term in The Sure Retirement Newsletter not on this list with which you are unfamiliar, please email [email protected]. We will explain the term and add it
to the glossary in next month’s edition.