Maximizing Polarization of Helium-3 Gas Cells Using...
27
Maximizing Polarization of Helium-3 Gas Cells Using Diode Lasers Daniel J. Matyas Office of Science, Science Undergraduate Laboratory Internship Program Denison University, Granville OH 43023 Thomas Jefferson National Accelerator Facility Newport News, VA 23606 August 3, 2012 Prepared in partial fulfillment of the requirement of the Office of Science, Department of Energy’s Science Undergraduate Laboratory Internship under the direction of Dr. Patricia Solvignon in the Experimental Nuclear Physics Division at Thomas Jefferson National Accelerator Facility. Participant: __________________________________ Signature Research Advisor: __________________________________ Signature
Transcript of Maximizing Polarization of Helium-3 Gas Cells Using...
Maximizing Polarization of Helium-3 Gas Cells Using Diode Lasers
Daniel J. Matyas
Office of Science, Science Undergraduate Laboratory Internship Program
Denison University, Granville OH 43023
Thomas Jefferson National Accelerator Facility Newport News, VA 23606
August 3, 2012
Prepared in partial fulfillment of the requirement of the Office of Science, Department of Energy’s Science Undergraduate Laboratory Internship under the direction of Dr. Patricia Solvignon in the Experimental Nuclear Physics Division at Thomas Jefferson National Accelerator Facility. Participant: __________________________________ Signature Research Advisor: __________________________________
Signature

Daniel Matyas SULI 2
Abstract Observing the collisions between charged particle beams and helium-3 gas targets allows
scientists to probe nuclear reactions and nuclear properties. These He-3 gas cells act as a pseudo-
neutron target since neutrons naturally decay in about 15 minutes when not contained in a
nucleus. Also present in the cell, is a small amount of rubidium that can absorb the laser light
and its polarization is eventually transferred to the He-3 nuclei through spin-exchange
mechanisms. Those polarized nuclei will align with an applied magnetic field, enabling the use
of nuclear magnetic resonance spectroscopy, NMR, to measure the amount of polarization in the
gas as a function of time. However, maximizing the initial polarization in the cell is quite
difficult, as the right balance between laser power and rubidium amount evaporated has to be
found without causing damage to the glass cell. This study describes attempts to increase
polarization by minimizing power loss due to the optical system, maximizing total power output,
and adjusting the diodes’ emission spectrums via temperature control. Light from three laser
diodes was sent through an optics system consisting of a splitting cube, quarter-waveplates, fiber
optic cables, and mirrors in order to create circularly polarized light. The current power supplies
and temperature controllers of the diodes were changed in order to maximize power output and
temperatures were adjusted to match the output spectrum to the Rb absorption line at 794.8 nm.
This study was able to increase the polarization in many ways, however these increases were not
sufficient. The diodes have been used intensively during previous experiments, but they will
need to be replaced for the research and development necessary in preparation for the planned 12
GeV experiments at Thomas Jefferson National Accelerator Facility.

Daniel Matyas SULI 3
Introduction
Nuclear physics experiments are designed to investigate some of the smallest constituents
of matter that exist in this world such as nuclei, protons, neutrons, quarks, and electrons, to name
a few. In order to perform these experiments, an immense amount of energy must be used and
particle accelerators have been designed for this very purpose. Some accelerators collide two
beams head on in order to maximize the total energy accessible in the center of mass frame of the
particles. However, at Thomas Jefferson National Accelerator Facility, commonly referred to as
“JLab” and located in Newport News, Virginia, an electron beam is collided into stationary
targets that can be changed depending on the desired experiment. The polarized helium-3 group
at JLab specializes in using helium-3 gas cells as targets for the electron beam.
Helium-3 gas cells are used in nuclear physics experiments because they act as pseudo-
neutron sources. A neutron has a half life of about 15 minutes when it is in free space and so a
pure neutron target is not sufficient for nuclear physics experiments since some experiments run
24 hours a day for weeks at a time in order to obtain adequate statistics. Fortunately, the helium
nuclei, containing two protons and a single neutron, can serve as adequate substitutes. About
90% of the time, the nuclear spins associated with helium-3’s protons are aligned in opposite
directions effectively cancelling out, leaving the nucleus with the characteristics of a neutron [1].
Thus, physicists are able to perform experiments between electrons and neutrons by passing the
beam through the gas cell.
Helium-3 gas cells do have their own limitations and difficulties however. In order to
validate the results of an experiment, the statistics must be built up through repeated interaction.
The number of interactions can be increased either by increasing the current of the electron beam

Daniel Matyas SULI 4
or increasing the density of neutrons in the target. The problem with increasing the beam current
is that the cells are made of glass and going above 15 uA severely shortens the amount of time
the cell can last without breaking. Our group is currently looking into cells that have metal target
chambers and glass pumping champers in order to prepare for the accelerator’s upgrade to 12
GeV electrons from 6 GeV at the present time.
This study focuses on increasing the statistics by improving the density of polarized
helium-3. Since the total amount of gas in the cell is determined at the time of manufacturing, we
focused on increase the percent of nuclei polarized in a particular direction by increasing the
laser power put into the cell, matching the emitted wavelength of light to the absorption line of
the gas cell, and minimizing the loss of power throughout the optical system.

Daniel Matyas SULI 5
Materials and Methods
The system used in this study consists of four main components: the helium-3 gas cell,
the laser diodes, the laser optics, and the holding field from the Helmholtz coils. As discussed in
the introduction, the gas cell acts as a pseudo-neutron target. An image of a cell can be seen
below in Figure 1.
Figure 1: An image of a helium-3 gas cell [1].
The gas cells have three main physical components: the spherical pumping chamber,
cylindrical target chamber, and the transfer tube that connects the first two. The pumping
chamber is the region that the circularly polarized laser light is shone on in order to provide the
polarization to the cell. It contains not just helium-3 gas, but also potassium and rubidium whose
purpose will be explained later on in the paper. The target chamber is the long cylindrical portion
of the cell and the electron beam travels into the cylinder. As it moves through the target
chamber, the beam collides with helium nuclei, destroying those nuclei’s polarization. The target

Daniel Matyas SULI 6
chamber contains mostly helium-3 and a small amount of nitrogen gas used to absorb some of
the light emitted from excited atoms in the cell returning to ground states. The transfer tube is the
smallest section of the gas cell but provides the most important task of allowing the gas to
circulate between the pumping chamber and target chamber so that the helium-3 in the target
chamber remains polarized since the lasers are only shone on the pumping chamber. In order to
cause the polarized helium to diffuse to the target chamber faster, the pumping chamber is placed
in an oven creating a temperature gradient between the two parts of the cell. Thermocouples
placed on the cell record the temperature of the cell. In order for the Rb to evaporate, the cell
must be atleast 170 C but temperatures can reach up to 230 C
Since the nuclei have net spins, their magnetic moments align with magnetic fields. The
cell is placed inside of a Helmholtz coil that produces the holding field that maintains the cell’s
polarization. This enables nuclear magnetic resonance spectroscopy, NMR, to be used on the cell
in order to measure the amount of polarization in the cell. Another set of coils provides a NMR
radiofrequency pulse to perturb the nuclei’s spin. A final set of coils is placed on the cell, where
the polarization needs to be measured, and picks up the induced field from the precession of the
spins in the field. This setup can be seen below in Figure 2.

Daniel Matyas SULI 7
Figure 2: A diagram showing how the gas cells are placed in the system during an experiment [1].
The gas cells are extremely fragile not only because they are made of glass and
experience constant collisions with electrons and high power laser light but are under
tremendous amounts of pressure. The pressure of the cells used in these tests range anywhere
from 8 to 12 atmospheres and could easily rupture at any time. The cells are not filled with pure
helium-3, but they actually contain rubidium, Rb, and potassium, K, which are evaporated due to
being placed in the oven. These gases are all found in the pumping chamber but the target
chamber is mostly helium-3 with some nitrogen gas due to the temperature gradient and cell
design. Intensive research and development have been put into helium-3 gas cells and it was
found that by pumping the Rb with circularly polarized light and have that spin exchanged to the
potassium and then helium; the highest polarization percentages were maintained because this
process was faster due to the fast exchange between the two alkali metals and the potassium and
helium-3.

Daniel Matyas SULI 8
As previously stated, this process begins by creating circularly polarized light, either
handedness works just the proper direction of holding field must be applied, at a wavelength of
794.8 nm. This wavelength is absorbed by the Rb and excites it from the 5S1/2 m=-1/2 to 5P1/2
m=1/2 state. Once in this state, they then decay and are trapped in the 5S1/2 m=1/2 state. Some
of the 5P1/2 m=1/2 Rb can move into the 5P1/2 m=-1/2 via collisions with other Rb. However,
these Rb decay back to the 5S1/2 m=-1/2 ground state at which point another photon kicks them
to the 5P1/2 m=1/2. This process is called optical pumping because eventually all the Rb will end
up in the desired state as seen below in Figure 3.
Figure 3: An energy level diagram for the optical pumping of rubidium in the gas cell [2].
Remember that this all occurs in the pumping chamber and so now that the Rb has
obtained the initial polarization from the diode lasers, it will engage in kinetic collisions with the
K and He nuclei bouncing around in the chamber. Through these collisions the polarization is
exchanged from Rb to K and K to He, creating polarized helium-3. There is a small amount of
spin exchange from Rb to He but it is much less significant compared to the Rb-K-He exchange.
This process is called nuclear spin-exchange can be seen below in Figure 4.
m = +1/2J
+
m = !1/2J
m = !1/2J
m = +1/2J
5P1/2
Collisional Mixing
5S1/2
Figure 4-2: Optical pumping of Rb by a circularly polarized laser towards the + spinstate. The figure is taken from Ref. [141].
4.1.2 Spin-Exchange Optical Pumping (SEOP)
The term spin-exchange optical pumping (SEOP) refers to a two-step process. First
alkali metal atoms (heated to the vapor form) are optically pumped with a polarized
laser, and quickly polarized. Second, that polarized alkali metal atom exchanges its
spin with a noble gas nucleus, such as 3He.
As a technical breakthrough, a new spectrally narrowed laser [154] was first used
at Je�erson Lab with this experiment, which improved the laser absorption and max-
imum achievable 3He polarization. The details will be further discussed in Sec. 4.2.3.
4.1.2.1 Optical Pumping
As the first step to polarize 3He nucleus, a polarized electron source is generated,
which can transfer its spin to 3He. The polarized electron is provided by the outermost
shell in the Rb and K atoms which are vaporized and mixed with the 3He gas. In
the optical pumping process, circularly polarized photons are used to polarize the
outermost-shell electrons in Rb, which subsequently transfer its polarization to the
K atoms and the 3He nucleus.
To help illustrate the concept of optical pumping, the spin of Rb nucleus is first
ignored. There is a single outermost shell electron in the Rb atom, whose ground
state is the 5S1/2 state. Using 795 nm infrared lasers, the ground state Rb can be
91

Daniel Matyas SULI 9
Figure 4: A diagram displaying how nuclear spin-exchange occurs in the cell [2].
As stated before, the laser light used in this spin exchanged optical pumping is required to
be around 794.8 nm, in the infrared regime. The main lasers used in this experiment were four
Comet diode lasers, which ultimately were compared to our benchmark Coherent diode lasers.
We will refer to them as “Comet” and “Coherent” lasers respectively in the remainder of this
paper. The four Comet lasers used were named JLab 1, JLab 2, Rutgers, and William & Mary.
Each laser consisted of five main components: a diode, a power supply, a temperature control
box, a fiber optic cable, and various cables to connect all the components together. Each diode
itself has its own characteristic power output and wavelength spectrum but both can be fine
tuned using the other components of the laser. The power supply changes the amount of current
being supplied to the diode and as a result the laser would correspondingly output more or less
power. The temperature control regulates the internal temperature of the diode by providing
current to a thermoelectric cooling plate. The cooling plate regulates the temperature of the diode
alone with the assistance of two fans that greatly reduce the diode’s heat load. Changing the
He3
Rb
K
Pol. Laser
Rb-K-3HeSpinExchange
Figure 4-3: Spin exchange in a Rb-K hybrid cell. The figure is taken from Ref. [141].
et. al. [160]. The transfer of angular momentum is dominated by the binary collision
between atoms. During the collision, the spin-exchange is due to hyperfine interaction
between the alkali electron and the 3He nucleus [161],
HSE = –I · S, (4.1)
where I is 3He nuclear spin, S is the spin of alkali electron and – is the coupling
function. This interaction also shifts the alkali Zeeman frequency proportionally to
the 3He polarization, which is used as one of the target polarimetries as discussed in
Sec. 4.4.
Although it is di�cult to calculate the exact value of –, the spin-exchange rates
for 3He, “SE, were measured experimentally as function of alkali density,
“SE = kASE[A], (4.2)
where [A] is the alkali density and kASE is the spin-exchange rate constant for the cor-
responding alkali metal. For Rb, several measurements were reported, as summarized
in Table I of Ref. [162]. The average result of the repolarization [162, 163] and rate
balance methods [162] is kRbSE = 6.8 ◊ 10≠20 cm3/s. For K, kK
SE = 5.5 ◊ 10≠20 cm3/s
was reported in Ref. [164, 165].
Another important parameter of SEOP is the spin-exchange e�ciency, ÷, where
93

Daniel Matyas SULI 10
temperature changes the profile of the intensity versus wavelength spectrum of the laser. Being
able to control the temperature is extremely important here because the light must be at 794.8 nm
or the laser light will not be absorbed by the Rb.
The light leaves the diodes by exiting through a fiber optic cable. The cable is a thin glass
fiber that uses internal reflection to transport the light from one end of the fiber to the other.
These fibers screw into a mount on the diode itself and the exiting end is then screwed into a
mount that is the start of the optics setup seen below in Figure 5. Once the light leaves the fiber,
it passes through a focusing lens that is used to make sure that the light rays are entering the cube
parallel rather than converging or diverging. This is important because if the light were to
converge on a piece of the optics it would be intense enough to burn the optics. Similarly, if the
beam was divergent, it would be much more difficult to steer the complete power output through
the optics and into the cell for absorption. Next, the light is incident on a polarizing beam splitter
cube. The light is composed of two directions, s and p, where s is along the diagonal plane inside
the cube and p is perpendicular to both the s direction and the direction of travel. The p-wave
component of light passes through the cube uninfluenced but the s-wave is reflected at an angle
out of the cube as seen in Figure 5. After passing through the cube, the p-wave is reflected
through a mirror, directing it through a quarter-waveplate in the direction of a set of mirrors
mounted on the apparatus holding the gas cell. The s-wave that was reflected inside of the cube
passes through a quarter wave plate, a mirror, and then once more through the quarter-waveplate.
A quarter wave plate is a piece of optics that has two axes, a fast and slow one. The plate causes
the light to experience a quarter of a wave phase shift. Since the s and p waves have polarizations
that are 90 degrees different, when the s-wave returns to the cube after passing through the plate
twice, its polarization has been shifted 90 degrees and becomes a p-wave. Now being a p-wave,
Daniel Matyas SULI 11
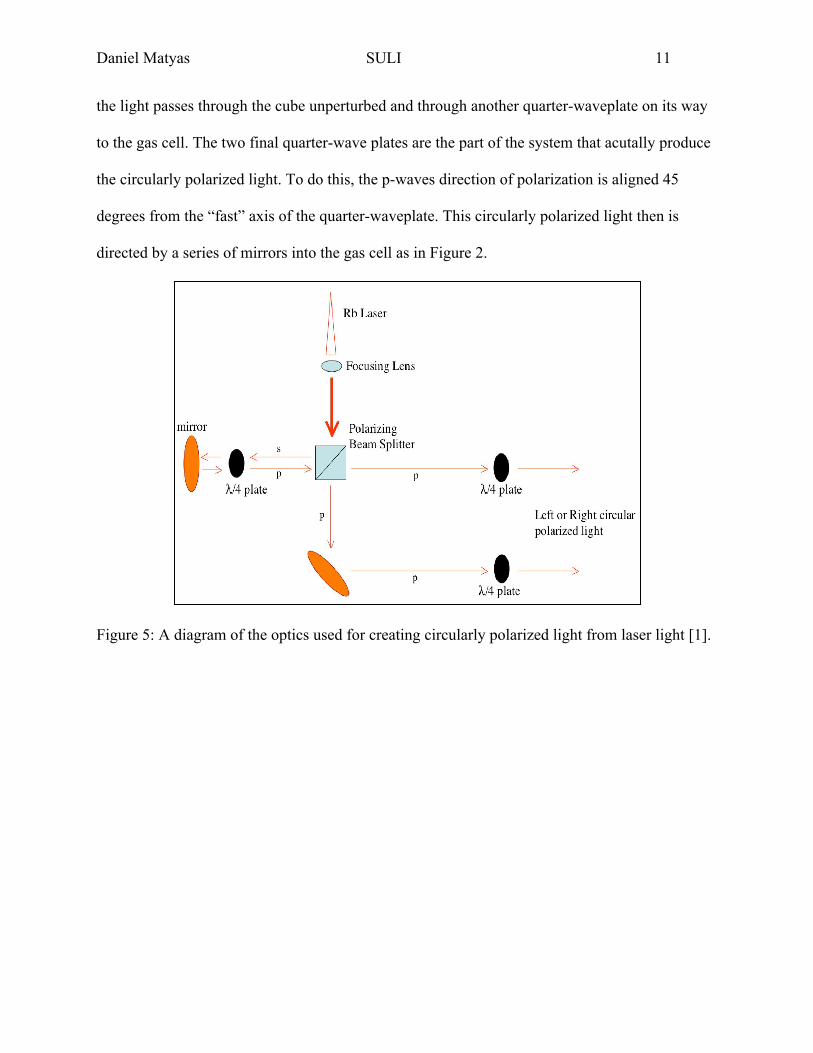
the light passes through the cube unperturbed and through another quarter-waveplate on its way
to the gas cell. The two final quarter-wave plates are the part of the system that acutally produce
the circularly polarized light. To do this, the p-waves direction of polarization is aligned 45
degrees from the “fast” axis of the quarter-waveplate. This circularly polarized light then is
directed by a series of mirrors into the gas cell as in Figure 2.
Figure 5: A diagram of the optics used for creating circularly polarized light from laser light [1].

Daniel Matyas SULI 12
The Comet laser diodes used in this study are engineered to have a narrower wavelength
spectrum by an order of magnitude than that of the Coherent laser diodes that were previously
used by the JLab polarized helium-3 target group. This presents significant difficulty because
with the narrower spectrum, its centrum must be aligned to the 794.8 nm absorption line of the
cell’s Rb more carefully. Whereas with the Coherent laser, the intensity spectrum is much more
spread out and so it is easier to have power at 794.8 nm but it will be a lower percentage of the
total power output than the narrower spectrum can. In order to study the spectrum output, an
Ocean Optics spectrometer had to be calibrated to visualize the spectrum. This was done in the
Ocean Optics software called, “Spectra Suite.” An Ocean Optics mercury-argon calibration
source was used in the calibration. The box outputs a series of peaks at discrete wavelengths.
Spectrometer uses a series of pixels to create the image that is seen on screen and so each peak
was assigned a corresponding pixel. Then, each peak was identified as one of the wavelength
peaks below in Table 1.
Peak (nm) 727.72 750.39 763.51 811.53 826.45 842.47 866.79
Table 1: A display of the light peaks emitted from the calibration box.
Spectra Suite has a built-in polynomial fitting program that creates a plot of wavelength
versus pixel and fits the data points with a third order polynomial. The resulting polynomial is:
𝒚 = 𝟔𝟒𝟕.𝟔𝟔+ 𝟗.𝟔𝟑𝟓𝟎𝑬− 𝟐 ∗ 𝒙− 𝟑.𝟕𝟔𝟐𝟐𝑬− 𝟔 ∗ 𝒙𝟐 − 𝟐.𝟔𝟖𝟔𝟗𝑬− 𝟏𝟎 ∗ 𝒙𝟑 𝐸𝑞𝑛 1 ,

Daniel Matyas SULI 13
where y is wavelength and x is a corresponding pixel number ranging from 0 to 4000. Table 2
below shows the points that were fit in order to create the third order polynomial while Figure 6
shows the curve.
Table 2: A display of the points used to create the calibration polynomial in Spectra Suite where
X is pixel number and Y is wavelength of the peak based on the calibration box’s specs.
Figure 6: A plot of wavelength versus pixel number with data points fit by the third degree
polynomial described by Equation 1.

Daniel Matyas SULI 14
Now that the Spectra Suite has been calibrated and is reading out reliable values for the
wavelengths of light observed, the spectrometer was used to observe the Comet laser’s spectrum.
In order to obtain a reliable spectrum, the diode to be used was left in its lasing state for at least
30 minutes to allow it to stabilize at the set temperature. The following figures display the results
of these measurements, note that the absolute intensities between the figures are not to scale
since it is dependent on the placement of the spectrometer. The spectrometer was not placed in
the same position for all four measurements because some were saturated for a given position
while others were too low to be observed at that same location. The green line identifies the Rb
absorption line in each figure.
Figure 7: A display of JLab 1’s spectrum after 30 minutes set at a current of 35 A set on the
power supply and 18 C set on the temperature controller.

Daniel Matyas SULI 15
Figure 8: A display of JLab 2’s spectrum after 30 minutes set at a current of 35 A on the power
supply and 12 C on the temperature controller.
Figure 9: A display of Rutgers’ spectrum after 30 minutes set at a current of 35 A set on the
power supply and 17 C set on the temperature controller.

Daniel Matyas SULI 16
Figure 10: A display of William and Mary’s spectrum after 30 minutes set at a current of 35 A
on the power supply and 20 C on the temperature controller.
A quick comparison of these peaks shows that each diode has its own unique profile and
they need to be shifted to lower wavelengths in order to maximize the percentage of power being
emitted at 794.8 nm. In order to do this, the operating temperature of the diode must be
decreased using the temperature control box. Each control box has a set temperature controlled
by the user and a feedback temperature notifying the user of the diode’s real-time temperature.
For the William and Mary diode and the JLab 2 diode, the feedback temperature was able to
stabilize near a minimum feedback temperature of 12 C and the set temperature was set
anywhere from 10 to 22 C after 30 minutes of stabilizing. With the JLab 1 and Rutgers diodes
however, they were unable to stabilize whenever set below 18 C and 17 C respectively. Both
would make it down near 12 C when set there but would slowly start to runaway until the diodes
overheated and their temperature limit interlocks would shut the diode off. This behavior limited
how far the peaks could be shifted to lower wavelengths as seen in figures 7 and 9. Figure 11
below shows the influence of lowering the temperature of the William and Mary Diode from 20
C to 12 C.

Daniel Matyas SULI 17
Figure 11: A comparison of the William and Mary profile set at 20 C (top) and 12 C (bottom).
Now having adjusted the wavelengths to be centered around the Rb absorption, the next
step is to increase the power output at that wavelength in order to increase polarization inside of
the cell. To accomplish this, different combinations of cables, power supplies, temperature
controls, fibers and diodes were used in order to evaluate if our equipment was still sufficient for
these polarization experiments. For the following trials to determine the maximum output with
different laser components the following notation is used: 1=JLab 1, 2=JLab 2, 3=Rutgers, and
4=William and Mary, D=Diode, P=Power Supply, T=Temperature Control, and C=Cable Set.
The first test was done to rule out that the cables connecting power supply to diode and
temperature to diode have any impact on power output using D1, P1, T1. Table 3 shows the
power output by using different cable sets. Table 4 shows the power output by using different
power supplies with D1, T3, C1. Table 5 shows the power output by using different temperature
controls with D1, P1, C1. Finally, Table 6 shows the power output by using different diodes with
P1, T1, C1. Combining the three strongest combinations gives a total of 63.5 W.
Cables Test C1 C2 C3
D1, P1, T1 15.8 W 15.9 W 16.0 W
Table 3: A show of power output for a given combination of laser components changing cables.

Daniel Matyas SULI 18
Power Supply Test P1 P2 P3
D1, T3, C1 16.1 W 16.2 W 16.3 W
Table 4: The power output for a given combination of laser components changing power supplies.
Table 5: The power output for a given combination of laser components changing temperature
controllers.
Diode Test D1 D2 D3 D4
T1, P1, C1 15.8 W 16.2 W 19.1 W 21.8 W
Table 6: The power output for a given combination of laser components changing diodes.
Upon completion of these tests to determine the maximum power that the lasers
can provide to the cell, the focus was turned to transporting that power from the laser to the cell
through a series of optics. Three of these optics setups, see Figure 5, are used during the
experiment, allowing three lasers to simultaneously pump the gas cell at once. In order to test the
transmission through the system the laser combinations of a Coherent laser and two Comet lasers
(D4, P2, T2 and D1, P1, T4) were used. The power output from both lasers were measured prior
to entering the optics and prior to entering the cell once it has been polarized. Tables 7, 8, and 9
show the transmission through the top, middle, and bottom optics setups.
D4, P2, T2 Before (W) s→p (W) p→p (W) Total (W)
Top Setup 21.0 7.99 11.1 19.09
Temp. Control Test T1 T2 T3 T4
D1, P1, C1 15.8 W 15.3 W 16.1 W 22.6 W

Daniel Matyas SULI 19
Middle Setup 21.0 11.7 6.85 18.55
Bottom Setup 21.0 13.8 4.67 18.47
Table 7: A table showing the transmission through different optics branches with D4, P2, T2.
D1, P1, T4 Before (W) s→p (W) p→p (W) Total (W)
Top Setup 22.6 10.2 10.5 20.7
Middle Setup 22.6 2.92 18.0 20.92
Bottom Setup 22.6 6.8 14.0 20.8
Table 8: A table showing the transmission through different optics branches with D1, P1, 42.
Coherent #5 Before (W) s→p (W) p→p (W) Total (W)
Top Setup 22.1 9.5 10.7 20.2
Middle Setup 22.1 9.5 10.4 19.92
Bottom Setup 22.1 9.6 10.5 20.1
Table 9: A table showing the transmission through different optics branches with Coherent 5.
Tables 7-9 shows that the optics split the power differently between the s→p and p→p
optics line, and it is dependent on the laser used. The Coherent appears to be split evenly
between the two lines and all three branches, as one would expect, while neither of the Comet
lasers split evenly. More importantly, different setups split the Comets’ power differently. This is
rather troubling and so further testing was done on just the cubes pulled out from the rest of the
optics. Using a power meter to measure the power of the s→p and p→p lines, it was found that
by rotating the mount or fiber emitting the light the distribution of power between these two lines
Daniel Matyas SULI 20
changed. Over 360 degrees, a maximum of 18 W and a minimum of 4.6 W were observed from
the D1, P1, T4 combination. Further interpretation of this will be discussed later on.
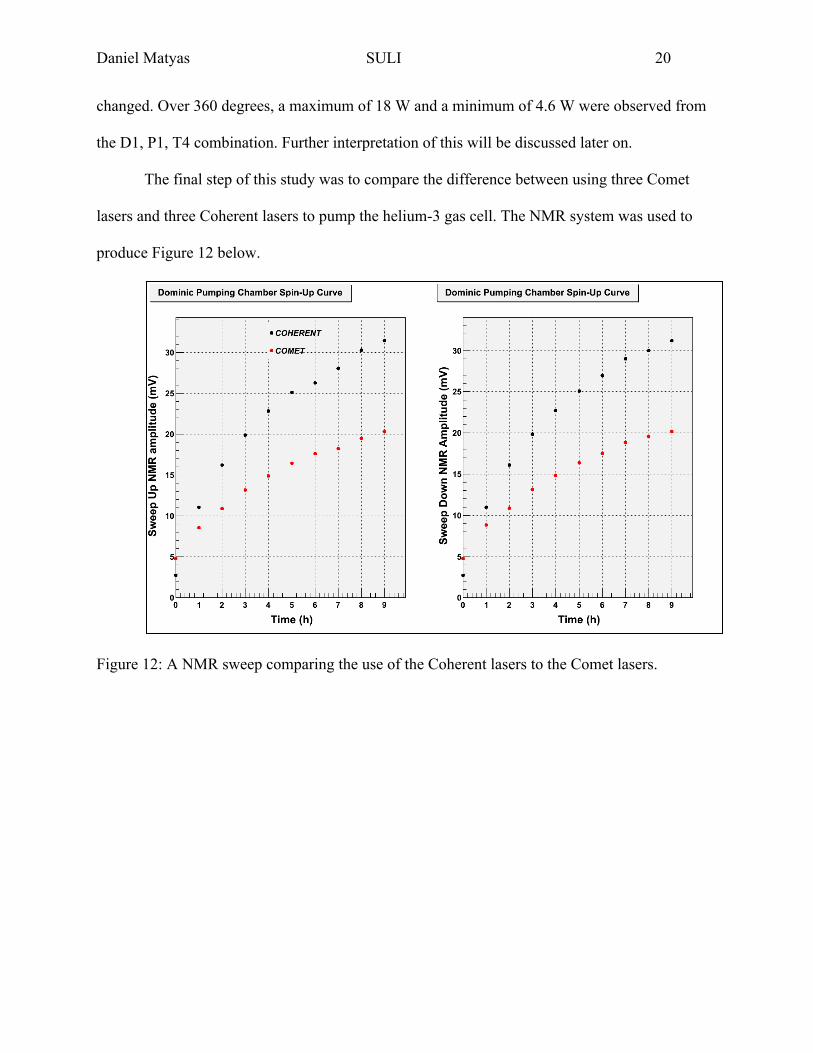
The final step of this study was to compare the difference between using three Comet
lasers and three Coherent lasers to pump the helium-3 gas cell. The NMR system was used to
produce Figure 12 below.
Figure 12: A NMR sweep comparing the use of the Coherent lasers to the Comet lasers.

Daniel Matyas SULI 21
Discussion and Conclusion
One of the most significant difficulties with using the Comet lasers was shifting their
narrow wavelength spectrum to align with Rb’s absorption line. Figure 11 showed that by
lowering the William & Mary diode’s operating temperature from 20 C to 12 C shifted the peak
by almost a nanometer lower, putting it in great alignment with 794.8 nm and therefore
increasing polarization being absorbed in the cell. However, Figures 7- 9 shows that JLab 2 was
able to be centered on the Rb absorption but the inability to lower the JLab 1 and Rutgers diodes
below 18 C and 17 C prevented their spectra to be aligned as well as JLab 2 and William and
Mary.
An attempt to increase the output of the lasers relative to the start of this study was
successful. It was found that the power outputs of the diodes were independent of the cables used
to connect the components, the power supply used, and the temperature controllers as seen in
Tables 3, 4, and 5. However, there is an interesting result in Table 4, when using the William and
Mary temperature control. The William and Mary components were being loaned to our group
and so initially they were not being tested. The prior tests on shifting the spectrum with the
temperature controllers showed that this supply was able to hold the feedback temperature more
stable and so it was tested for comparison. During this trial it was found that the D1, P1, C1
combination was able to increase its output from around 16 W up to 22.6 W. This output was
shown to hold consistently at 22.6 W for three days while it was used to test the optics
transmission and pumping the cell. When used with other diode combinations this supply, T4,
did not show similar improvements. After returning to this intriguing combination once more, it
was found that the output had fallen back to around the prior output of 15 W. This would then

Daniel Matyas SULI 22
suggest that there must be some sort of loose connection inside of the diode that could be
weakening the output.
Having this D1 combination outputting 22.6 W, the William and Mary diode outputting
21.8 W, and the Rutgers diode outputting 19.1 W, the focus moved to getting to the laser light
into the cell and checking how well the Comets could polarize it. The testing of the optics also
provided insight to understanding the capabilities of the diode lasers. Tables 7, 8, and 9 are the
source of this insight. Looking purely at the diode lasers, it is clear that the distribution of power
between the s→p and p→p lines was not even. For D4, P2, T2, the top setup had a stronger p→p
power output but the middle and bottom setups behaved conversely where the p→p output was
weaker, but the D1, P1, T4, combination did not even follow that trend. It displayed the top setup
was almost equal 10.2 W s→p and 10.5 W p→p but the middle and bottom setups had stronger
p→p power outputs. This was very strange and so the Coherent #5 laser was used to serve as a
control case. The Coherent showed that all three setups had a p→p power output that was about
1.1 times larger than the s→p power output.
These results led us to believe that the splitting cubes must be behaving different for the
Comet’s light and the Coherent’s light. During these tests however, the results also did not match
was previously measured for the D1, P1, T4 combination. As it turns out, the orientation of the
fiber used to transmit the light from the laser diode to the test optics was not the same as it had
been. In order to test this idea that the optical fiber’s orientation was influencing how the power
was being distributed between the s and p lines from the cube the fiber was manually rotated by
hand. Using a reference mark on the mount it was found that over 360 degrees the initial value
was repeatable. This explained the differences in s and p distribution between the two Comet
laser, but it was still curious that we had not seen this with the Coherent lasers before. However,

Daniel Matyas SULI 23
the Coherent lasers provide initially light that is not polarized while the Comet lasers provide
polarized light. Therefore, when passing through the cube, the Coherent’s light displays an equal
s and p outputs while the Comets do not.
The final portion of this study was to evaluate the Comet laser’s ability in providing
polarization to the test cell. In order to do this, a NMR spin up measurement was done. Figure 12
shows the results when using the JLab 1, Rutgers, and William and Mary Comet lasers with a
combined output of 63.5 W. After 9 hours, both the curve made with the Coherent lasers and the
curves made with the Comet lasers are reaching their maximum NMR amplitude, corresponding
to polarization. The Coherent lasers were able to produce a signal with amplitude that was 1.5
times larger than the Comet lasers produced.
This result can be credited either to the fact there was not enough power being put
through the cell or not enough was being absorbed by the cell. In order to create a factor of 1.5
differnce, assuming every photon produced is absorbed and thus emitted at 794.8 nm, the
Coherent lasers would have to be producing 96 W. Having such a disperse wavelength spectrum
though, the total power would have to be much greater than 96 W, making this highly
improbable. In the actual comparison trial, the Coherent lasers were producing only 70 W. The
more likely situation is that as seen in the laser wavelength profiles, the majority of the Comet
power was not being produced at 794.8 nm and therefore was not supplying the cell with more
polarization. This is certainly the case with the Rutgers and JLab 1 to a smaller degree as seen in
their profiles. Figure 13 below shows a comparison of the JLab 1 spectrum prior to absorption
and after absorption. Note that the absolute heights of the two profiles are not reliable since they
are dependent on the spectrometer’s placement; therefore one must look at the relative height of
the peak to the shoulder. In previous studies done by our group with the Coherent lasers, almost

Daniel Matyas SULI 24
all of the power passed through the cell is absorbed. This is certainly not the case with the Comet
lasers.
Figure 13: A comparison of JLab 1’s spectrum prior to entering the cell and after exiting it.
Unfortunately, polarization optimization was unable to be performed in this study
because not enough power at the correct wavelength could be output from the lasers in the
polarized helium-3 laboratory at JLab. A simple solution to this problem would be to add another
laser. However, as you add more and more optics lines stacked on top of one another, it becomes
increasingly difficult to align the system on the cell. This is because the highest and lowest line
will have to be aimed at a very steep angle in order to reach the cell. For our setup, this becomes
a problem with a fifth laser.
In conclusion, this study provides new insight to the workings of our Comet diode lasers.
The spectrum of these lasers are highly dependent on their operating temperatures and only two
of them can be operated at 12 C. The maximum output able to be achieved by one of our Comet
lasers was 22.6 W by JLab 1, while the best combination of three lasers was 63.5 W by the JLab
1, Rutgers, and William and Mary diodes. These lasers are providing initially polarized light and
as a result of this, the orientation of the fiber in the mount influences the power distribution
between s-wave and p-wave light after the splitting cubes used in our optics setups. Finally, the
diodes have a much narrower spectrum width and since the position of this spectrum is so

Daniel Matyas SULI 25
dependent on operating temperatures, not enough of the light is being absorbed in the cell. This
produces lower amplitudes in NMR signals performed with the Comet lasers than when done
with Coherent lasers.

Daniel Matyas SULI 26
Acknowledgements
I would first like to thank my mentor, Patricia Solvignon, for taking the time out of her
busy schedule to work with me this summer (even more thanks for putting up with long paper).
This internship has provided me with a great experience at JLab and a tremendous introduction
to the world of nuclear physics. I hope that we will get to work together once more on a project
in the years to come. Likewise, thank you J.P. Chen for allowing me to work closely with the
polarized helium-3 group in Hall A. Yawei Zhang and Jie Liu, thank you for your guidance and
hands on experience in the lab. Jie, I will see you at UHeights this coming fall, neighbor! Zhiwen
Zhao, thank you for always being around to guide me when I quite frequently lost the big picture
of what I was doing in the lab with your level-headed demeaner. Most importantly to me, thank
you for taking time to talk to me about grad school, UVA, and the different projects I can get
involved in both at UVA and JLab, your advice alone was worth doing this internship. Thank
you the Department of Energy, the SULI program, and Lisa Surles-Laws for taking care of us at
the lab and making this internship possible. Finally, thank you to Dan Banks. Without you I
would have been merely Dan, rather than the legendary entity known as the The Dans.
Everything is easier when you have someone along for the ride with you; just remember to not
be afraid of speaking up and asking questions. Also, just bite the bullet and be a physics major.

Daniel Matyas SULI 27
References
[1] Chen, J. P. (2010, June) Polarized Targest and Physics Program. Presentation given at JLab
high luminosity polarized targets workshop, Newport News, VA.
[2] Huang, J. (2012) Double Spin Asymmetry ALT in Charged Pion Production from Deep
Inelastic Scattering on a Transversely Polarized 3He Target. (Doctoral dissertation,
Massachusetts Institute of Technology, 2012).
[3] Qiang, Y & Zhan, X. (2010, July) Optics Alignment. Draft Copy.