Maximizing After-Tax Returns for High Net Worth Investors invested on January 1, 2003 $100,000...
33
Maximizing After-Tax Returns for High Net Worth Investors
-
Upload
duongtuyen -
Category
Documents
-
view
212 -
download
0
Transcript of Maximizing After-Tax Returns for High Net Worth Investors invested on January 1, 2003 $100,000...
Maximizing After-Tax Returns for High Net Worth Investors

1
World-class money managementand superior tax advantages
of CI Corporate Class in an exclusive offering to affluent investors.
2
Professional money management,
asset class specialist model� Access to world-class money management talent
� Managers monitored by the CI Investment Consulting team
Tax efficiency with CI Corporate Class� Switch and rebalance without tax consequences
� Defer income tax on fund earnings
� Receive tax-efficient distributions of ROC (return of capital) with T-Class
Choice� Over 60 investment mandates
� Asset allocation pools, U.S. dollar mandates and SunWise® Elite
Daily liquidity and account values
Institutional fees, fully transparent
Benefits for High Net Worth Investors
3
Professional Money Management
Large Selection of Industry-Leading
Investment Professionals
TridentInvestment Management
4
Oversight and GovernanceProtecting Your Investments
Board of Governors� Independent review committee provides impartial judgment on
conflicts of interest with a view to the best interests of CI investors
CI Investment Consulting� Performs detailed quantitative and qualitative review of
CI investment mandates
CI Compliance Department� Monitors trading activities by the funds’ portfolio managers
and compliance with the employee code of conduct
CI Compliance Committee� Reviews reports from the compliance department and any
legislative/regulatory changes
5
CI Legal Department� Responsible for interpretation of the national instruments
governing investment funds
Two independent auditors� Third-party fund auditor is Pricewaterhouse Coopers LLP;
corporate auditor is Ernst & Young LLP
Fund valuation/custodian� Third-party custodian, RBC Dexia Investor Services Trust,
provides fund valuations and trade reviews daily
“…at all times, the interests of CI’s investors be placed above personal interests through the application of the highest standards of integrity and ethical business conduct by employees, officers, and directors of CI.”
CI Code of Ethics and Conduct
6
Corporation created in 1987� Section 51(1) of the Income Tax Act. The investor may switch between the
various classes of capital stock of a corporation without tax consequences.
� Underlying share classes of CI Corporate Class Limited are consideredconvertible securities under the Act.
The largest corporate class structure
in Canada
Over 60 investment options available,
including the new T-Class
CI Corporate ClassTax-Efficient Investment Solution
7
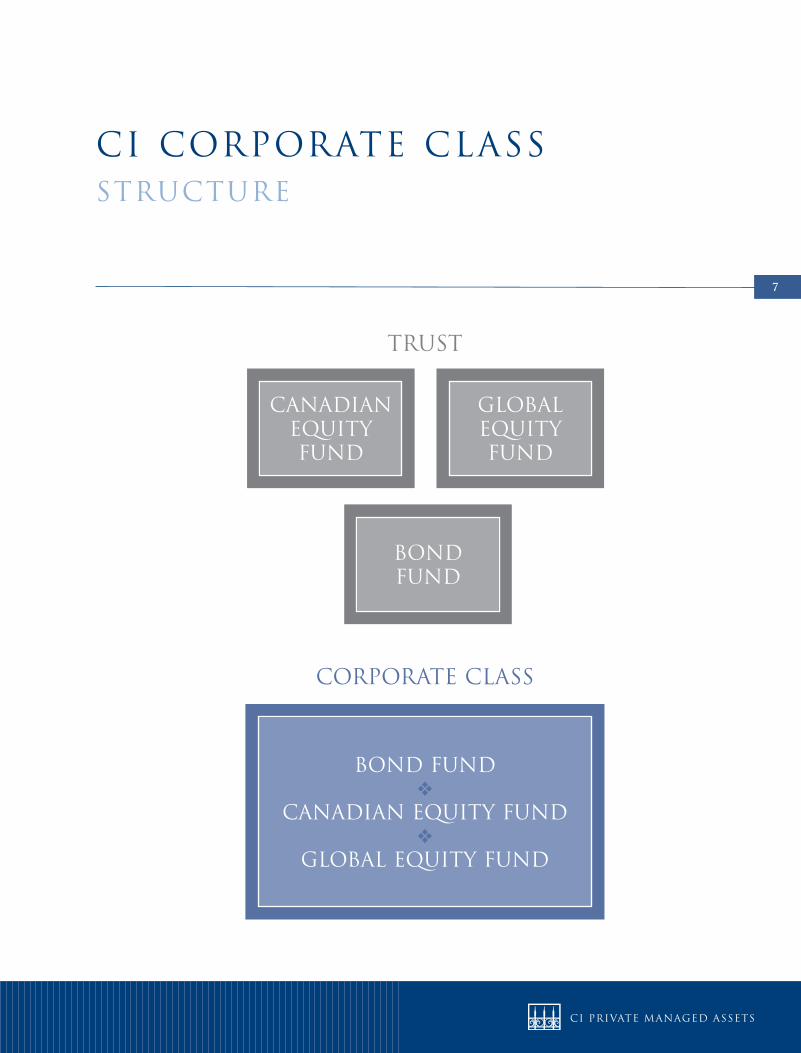
CI Corporate Classstructure
Bond fund�
canadian equity fund�
global equity fund
corporate class
trust
bondfund
canadianequityfund
globalequity fund
8
CI has designed and manages a tax-effective
corporate class structure with:� Diversification of asset classes to help offset capital gains and losses
� The ability to pool income and expenses within the corporation for all share classes
� A larger weighting of equities to fixed income so that interest income is offset by expenses
� The goal of maintaining our fiduciary responsibility to shareholders of the various shares of the corporation.
CI Corporate ClassManagement
9
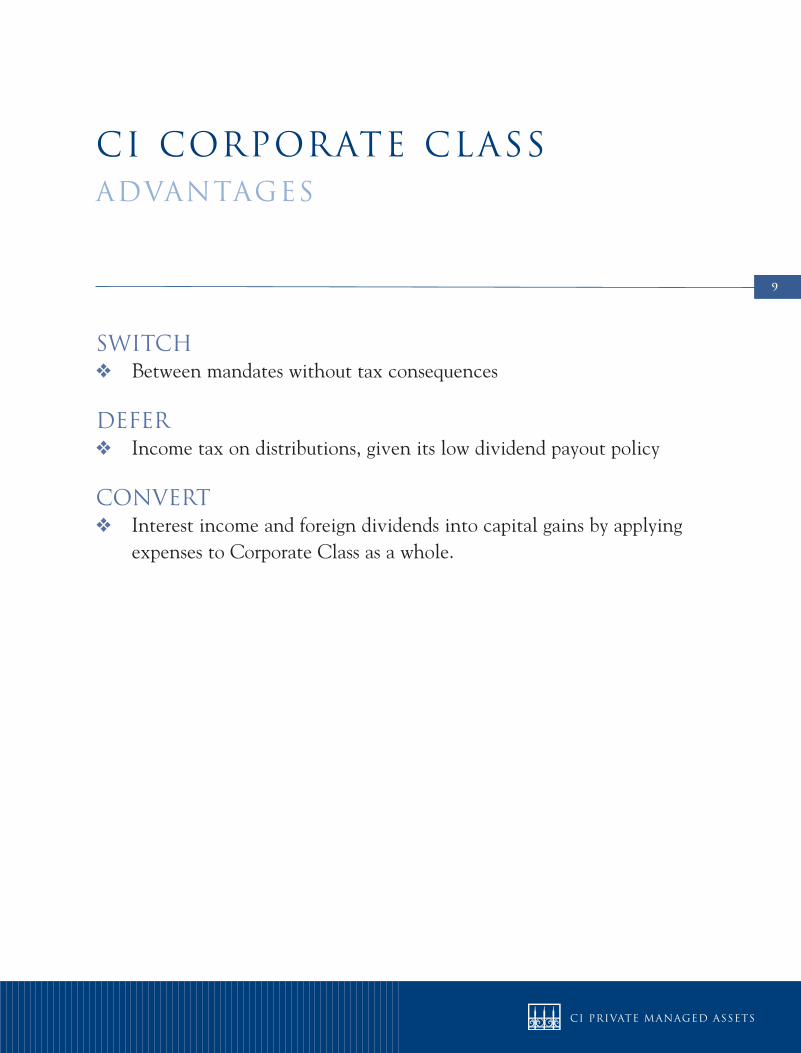
SWITCH � Between mandates without tax consequences
DEFER � Income tax on distributions, given its low dividend payout policy
CONVERT � Interest income and foreign dividends into capital gains by applying
expenses to Corporate Class as a whole.
CI Corporate ClassAdvantages
10
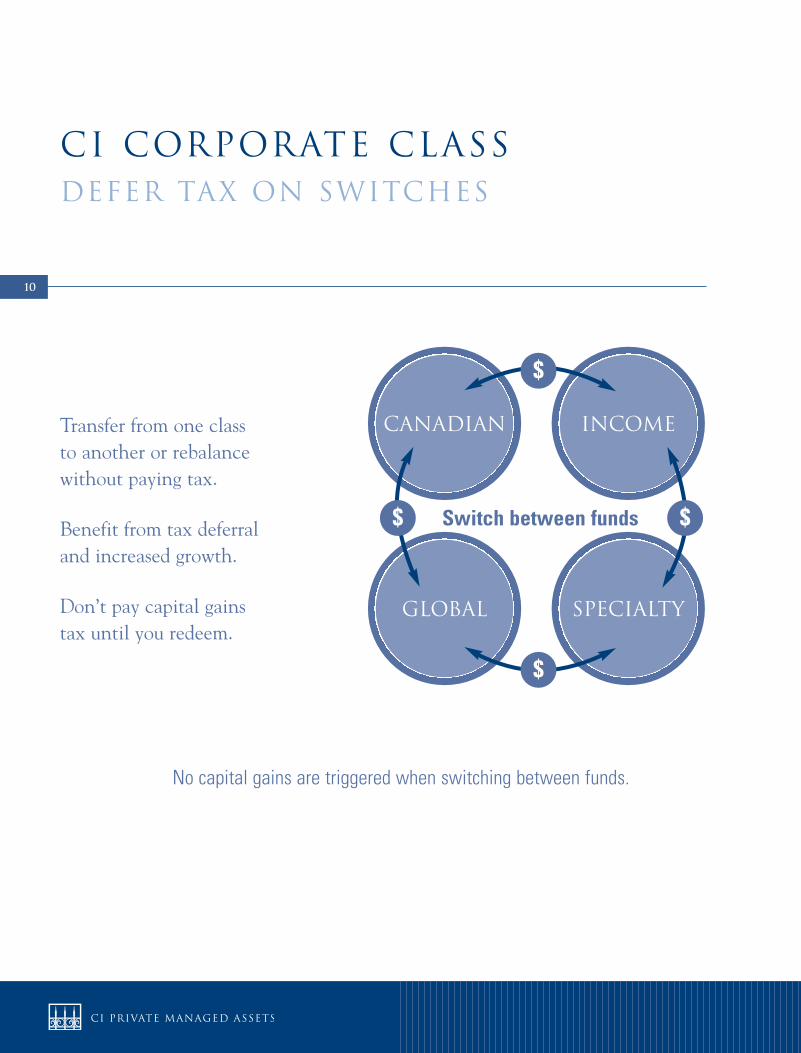
CI Corporate ClassDefer Tax on Switches
Transfer from one class to another or rebalance without paying tax.
Benefit from tax deferraland increased growth.
Don’t pay capital gains tax until you redeem.
canadian Income
global specialty
Switch between funds
No capital gains are triggered when switching between funds.
$
$
$$
11
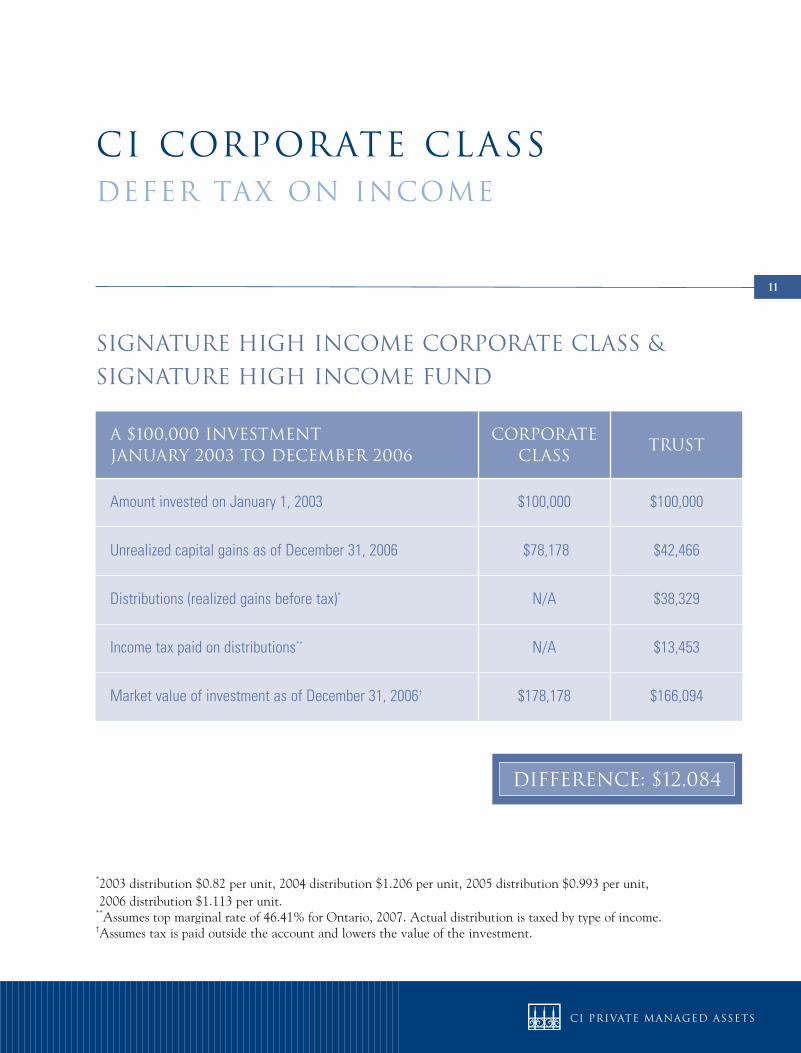
signature high income corporate class &
signature high income fund
CI Corporate ClassDefer Tax on income
A $100,000 investment JanUARY 2003 to DecEMBER 2006
CorporateClass
Trust
Amount invested on January 1, 2003 $100,000 $100,000
Unrealized capital gains as of December 31, 2006 $78,178 $42,466
Distributions (realized gains before tax)* N/A $38,329
Income tax paid on distributions** N/A $13,453
Market value of investment as of December 31, 2006† $178,178 $166,094
*2003 distribution $0.82 per unit, 2004 distribution $1.206 per unit, 2005 distribution $0.993 per unit, 2006 distribution $1.113 per unit. **Assumes top marginal rate of 46.41% for Ontario, 2007. Actual distribution is taxed by type of income. †Assumes tax is paid outside the account and lowers the value of the investment.
difference: $12,084
12
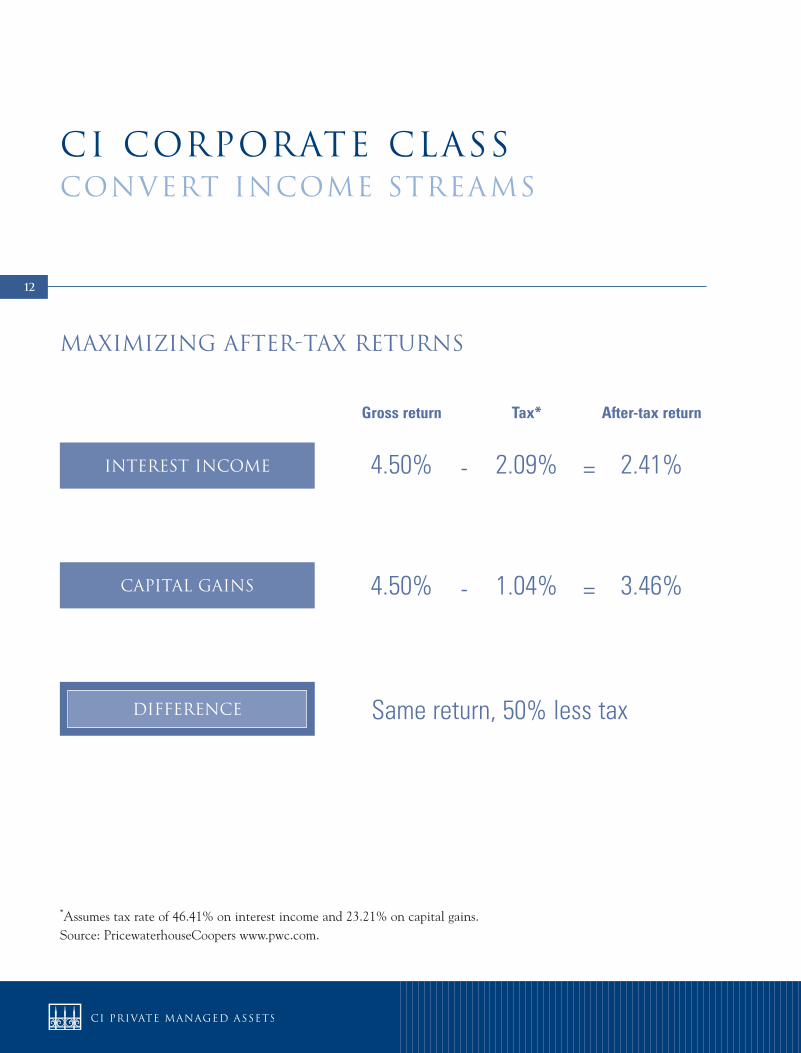
CI Corporate Classconvert income streams
*Assumes tax rate of 46.41% on interest income and 23.21% on capital gains. Source: PricewaterhouseCoopers www.pwc.com.
difference
capital gains
interest income 4.50% 2.09% 2.41%
Same return, 50% less tax
Maximizing After-Tax Returns
- =
4.50% 1.04% 3.46%- =
Gross return Tax* After-tax return
13
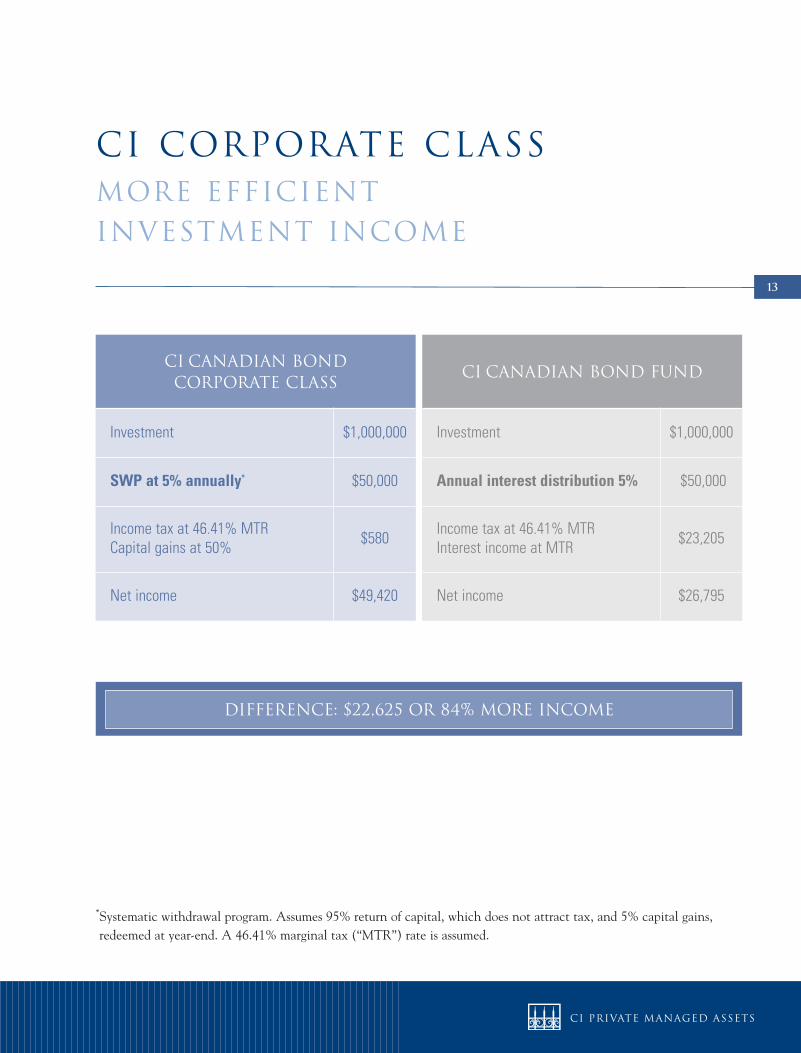
CI Corporate ClassMore Efficient Investment Income
CI Canadian bond corporate class
Investment $1,000,000
SWP at 5% annually* $50,000
Income tax at 46.41% MTRCapital gains at 50% $580
Net income $49,420
CI Canadian bond fund
Investment $1,000,000
Annual interest distribution 5% $50,000
Income tax at 46.41% MTRInterest income at MTR $23,205
Net income $26,795
*Systematic withdrawal program. Assumes 95% return of capital, which does not attract tax, and 5% capital gains,redeemed at year-end. A 46.41% marginal tax (“MTR”) rate is assumed.
difference: $22,625 or 84% more income
14
� Creates a predictable, tax-effective stream of monthly cash flow withoutsacrificing the potential for growth
� Choice of two annual target distributions of 5% or 8% (paid monthly)
� Monthly distributions are return of capital (ROC)*
� 17 T-Class mandates available within the PMA platform
� Tax-free switching between all CI Corporate Class mandates
CI Corporate Class, t-classDefer Tax on Investment Income
*Once ACB is depleted, monthly distributions will be capital gains.
15
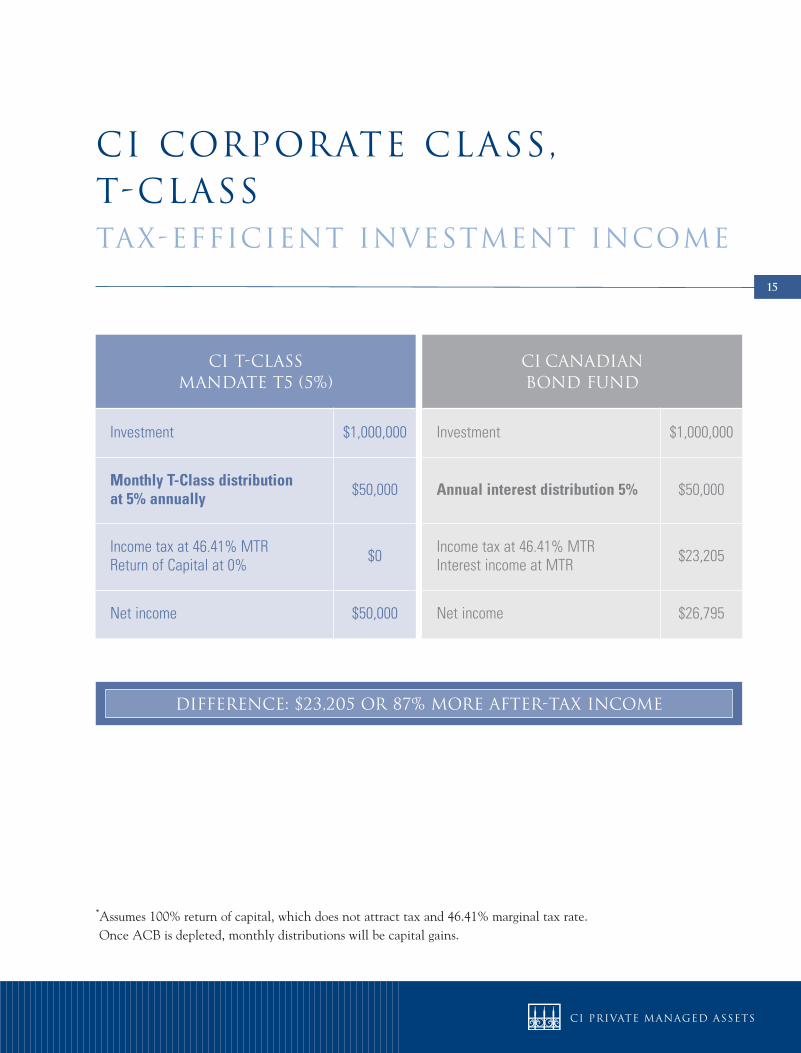
CI Corporate Class, t-classtax-efficient investment income
CI T-class mandate t5 (5%)
Investment $1,000,000
Monthly T-Class distribution at 5% annually $50,000
Income tax at 46.41% MTRReturn of Capital at 0% $0
Net income $50,000
CI Canadian bond fund
Investment $1,000,000
Annual interest distribution 5% $50,000
Income tax at 46.41% MTRInterest income at MTR $23,205
Net income $26,795
*Assumes 100% return of capital, which does not attract tax and 46.41% marginal tax rate. Once ACB is depleted, monthly distributions will be capital gains.
difference: $23,205 or 87% more after-tax income
16
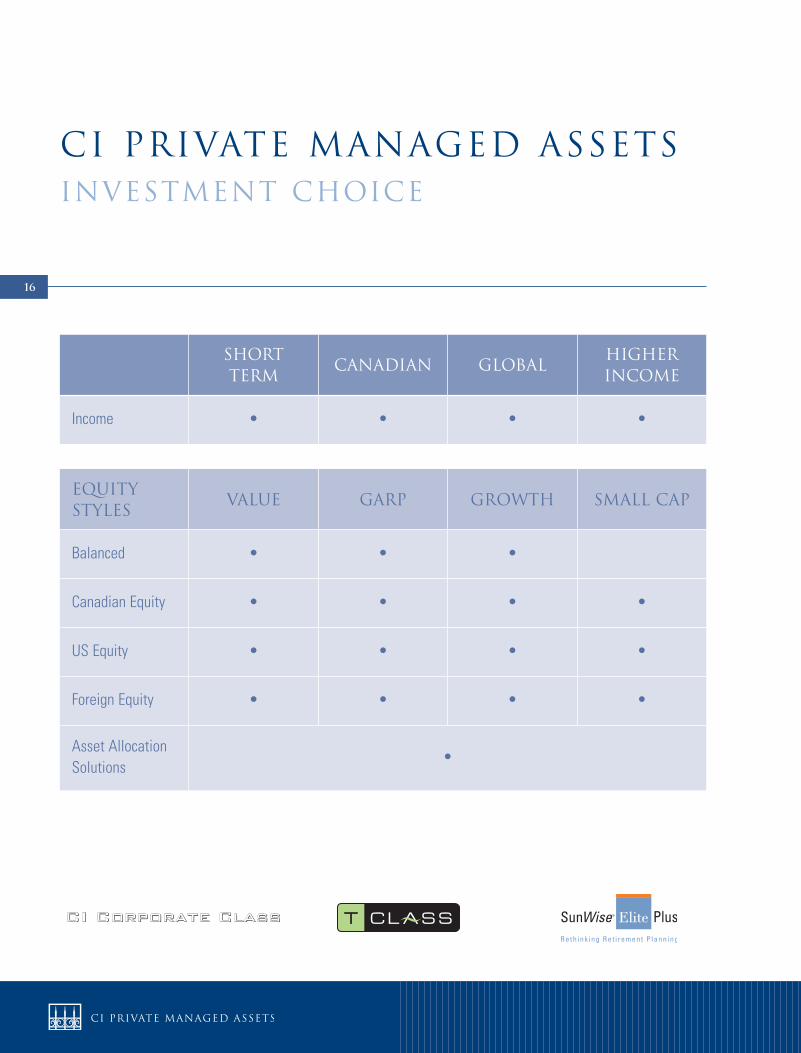
CI Private Managed AssetsInvestment Choice
Short Term
Canadian GlobalHigherIncome
Income • • • •
EquityStyles
Value GARP Growth Small Cap
Balanced • • •
Canadian Equity • • • •
US Equity • • • •
Foreign Equity • • • •
Asset AllocationSolutions
•
17
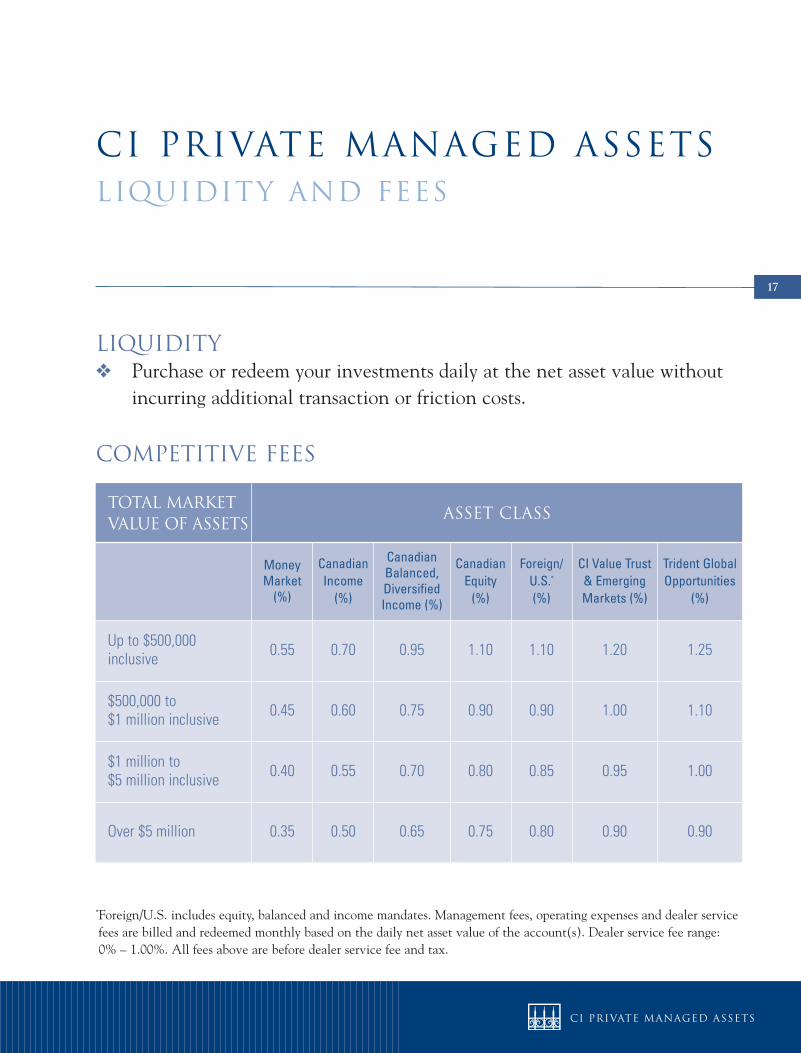
Liquidity� Purchase or redeem your investments daily at the net asset value without
incurring additional transaction or friction costs.
Competitive Fees
Total MarketValue of Assets
Asset class
Money Market(%)
Canadian Income(%)
Canadian Balanced, DiversifiedIncome (%)
CanadianEquity(%)
Foreign/U.S.*
(%)
CI Value Trust & EmergingMarkets (%)
Trident GlobalOpportunities
(%)
Up to $500,000 inclusive 0.55 0.70 0.95 1.10 1.10 1.20 1.25
$500,000 to $1 million inclusive 0.45 0.60 0.75 0.90 0.90 1.00 1.10
$1 million to $5 million inclusive 0.40 0.55 0.70 0.80 0.85 0.95 1.00
Over $5 million 0.35 0.50 0.65 0.75 0.80 0.90 0.90
*Foreign/U.S. includes equity, balanced and income mandates. Management fees, operating expenses and dealer servicefees are billed and redeemed monthly based on the daily net asset value of the account(s). Dealer service fee range:0% – 1.00%. All fees above are before dealer service fee and tax.
CI Private Managed Assetsliquidity and fees
18
other value-added ci services
� Detailed quarterly account statements
� Tax-deferred automatic rebalancing and/or systematic transfer program
� Automated systematic withdrawal program
� On-line account access
� Support and research through CI’s Private Managed Assets AccountManagement team
19
CI Private Managed Assetssummary
� World-class multi-manager solution available on one platform
� Tax deferral on rebalancing and re-allocations between managers through CI Corporate Class
� Potential for tax-deferred income investing
� Potential to re-characterize income distributions as ROC or capital gains by using T-Class
� Liquidity – account valued daily
� Competitive fee structure

20
21
Appendix
program parameters
and examples

22
23
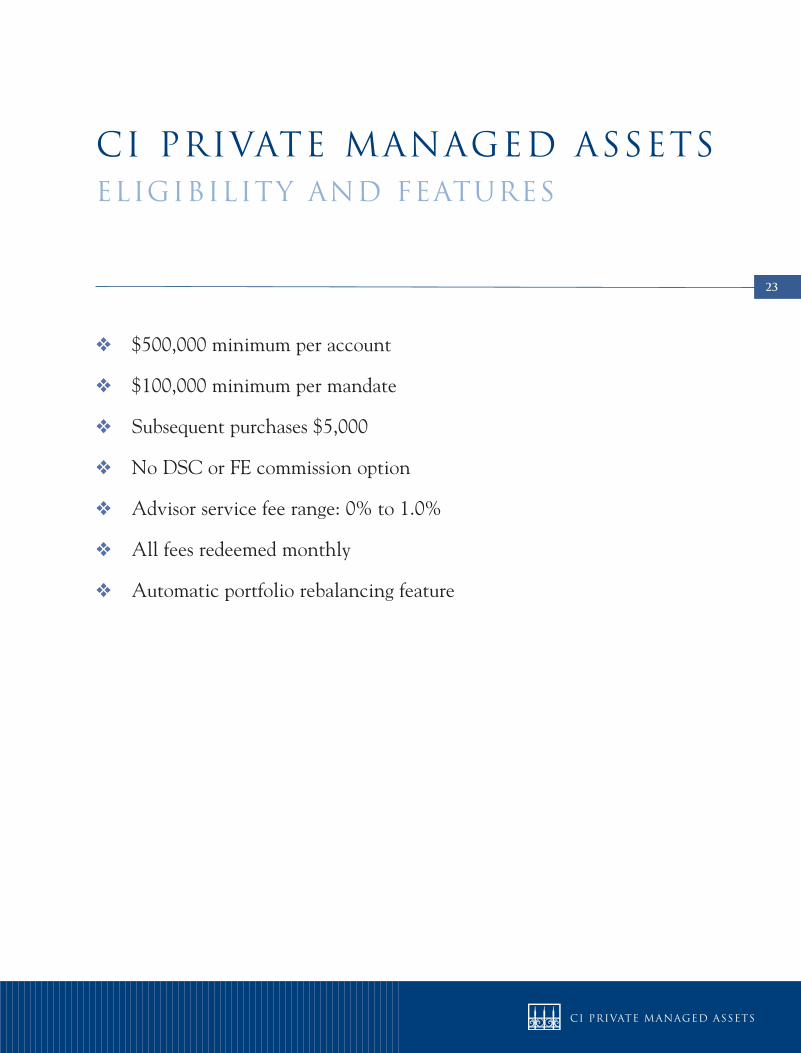
� $500,000 minimum per account
� $100,000 minimum per mandate
� Subsequent purchases $5,000
� No DSC or FE commission option
� Advisor service fee range: 0% to 1.0%
� All fees redeemed monthly
� Automatic portfolio rebalancing feature
CI Private Managed Assetseligibility and features
24
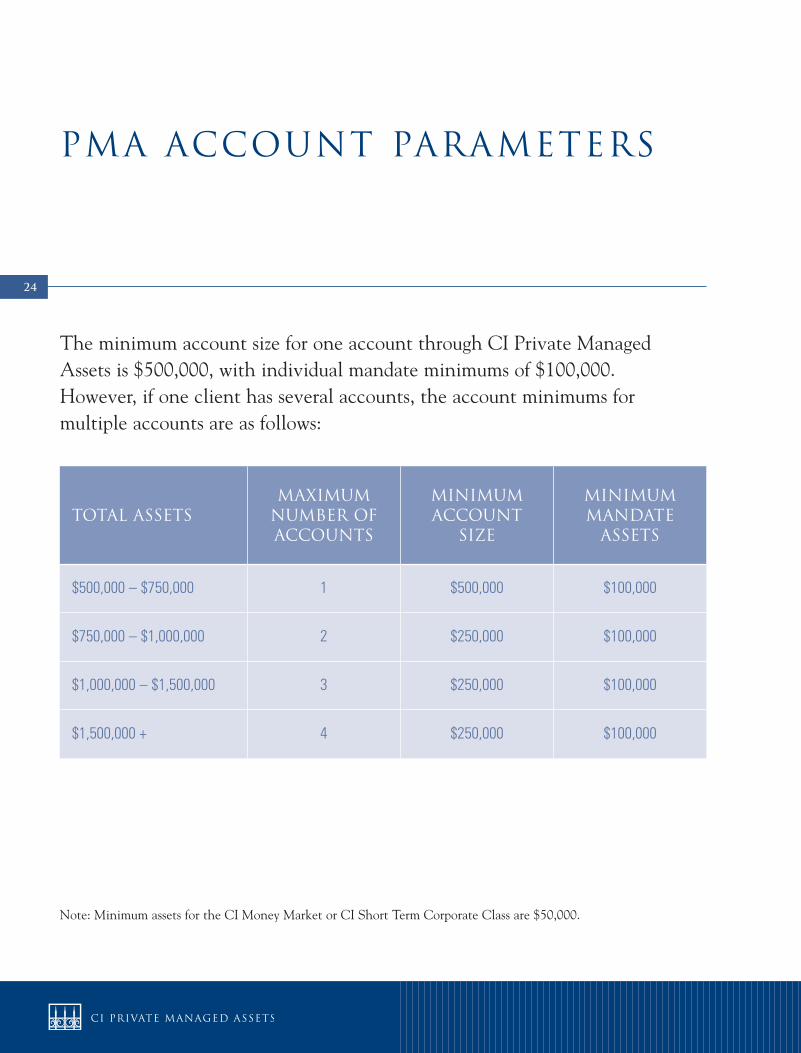
Total AssetsMaximum number ofaccounts
Minimum account
size
Minimum Mandate Assets
$500,000 – $750,000 1 $500,000 $100,000
$750,000 – $1,000,000 2 $250,000 $100,000
$1,000,000 – $1,500,000 3 $250,000 $100,000
$1,500,000 + 4 $250,000 $100,000
Note: Minimum assets for the CI Money Market or CI Short Term Corporate Class are $50,000.
The minimum account size for one account through CI Private Managed Assets is $500,000, with individual mandate minimums of $100,000. However, if one client has several accounts, the account minimums for multiple accounts are as follows:
pma account parameters
25
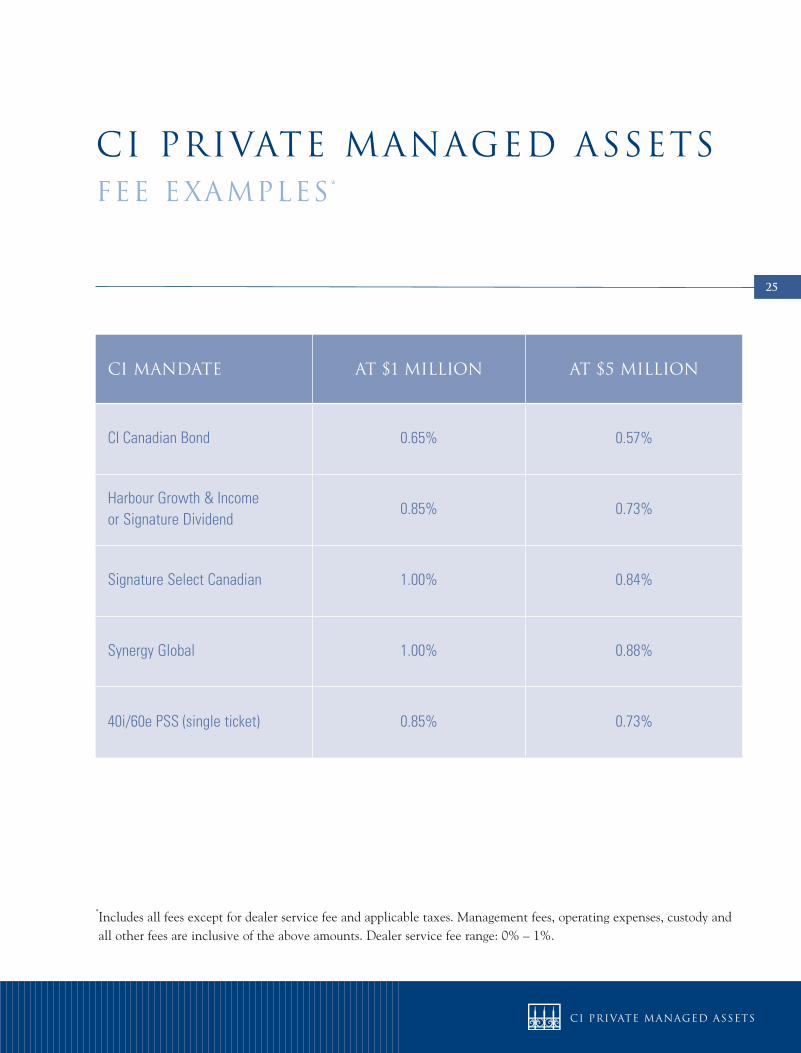
CI Mandate At $1 Million At $5 Million
CI Canadian Bond 0.65% 0.57%
Harbour Growth & Income or Signature Dividend
0.85% 0.73%
Signature Select Canadian 1.00% 0.84%
Synergy Global 1.00% 0.88%
40i/60e PSS (single ticket) 0.85% 0.73%
*Includes all fees except for dealer service fee and applicable taxes. Management fees, operating expenses, custody and all other fees are inclusive of the above amounts. Dealer service fee range: 0% – 1%.
CI Private Managed Assetsfee examples*
26
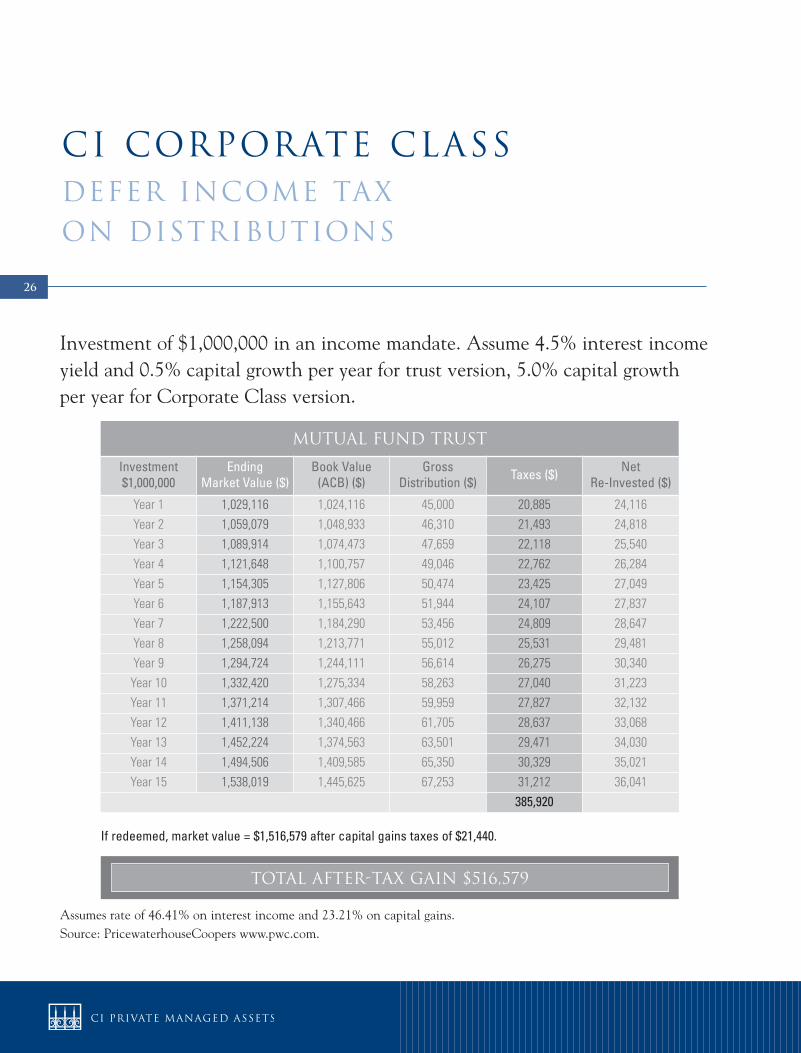
Assumes rate of 46.41% on interest income and 23.21% on capital gains.Source: PricewaterhouseCoopers www.pwc.com.
If redeemed, market value = $1,516,579 after capital gains taxes of $21,440.
Investment of $1,000,000 in an income mandate. Assume 4.5% interest incomeyield and 0.5% capital growth per year for trust version, 5.0% capital growth per year for Corporate Class version.
MUTUAL FUND TRUST
Investment$1,000,000
EndingMarket Value ($)
Book Value(ACB) ($)
Gross Distribution ($) Taxes ($) Net
Re-Invested ($)
Year 1 1,029,116 1,024,116 45,000 20,885 24,116Year 2 1,059,079 1,048,933 46,310 21,493 24,818Year 3 1,089,914 1,074,473 47,659 22,118 25,540Year 4 1,121,648 1,100,757 49,046 22,762 26,284Year 5 1,154,305 1,127,806 50,474 23,425 27,049Year 6 1,187,913 1,155,643 51,944 24,107 27,837Year 7 1,222,500 1,184,290 53,456 24,809 28,647Year 8 1,258,094 1,213,771 55,012 25,531 29,481Year 9 1,294,724 1,244,111 56,614 26,275 30,340Year 10 1,332,420 1,275,334 58,263 27,040 31,223Year 11 1,371,214 1,307,466 59,959 27,827 32,132Year 12 1,411,138 1,340,466 61,705 28,637 33,068Year 13 1,452,224 1,374,563 63,501 29,471 34,030Year 14 1,494,506 1,409,585 65,350 30,329 35,021Year 15 1,538,019 1,445,625 67,253 31,212 36,041
385,920
CI corporate classdefer income tax on distributions
Total after-tax gain $516,579
27
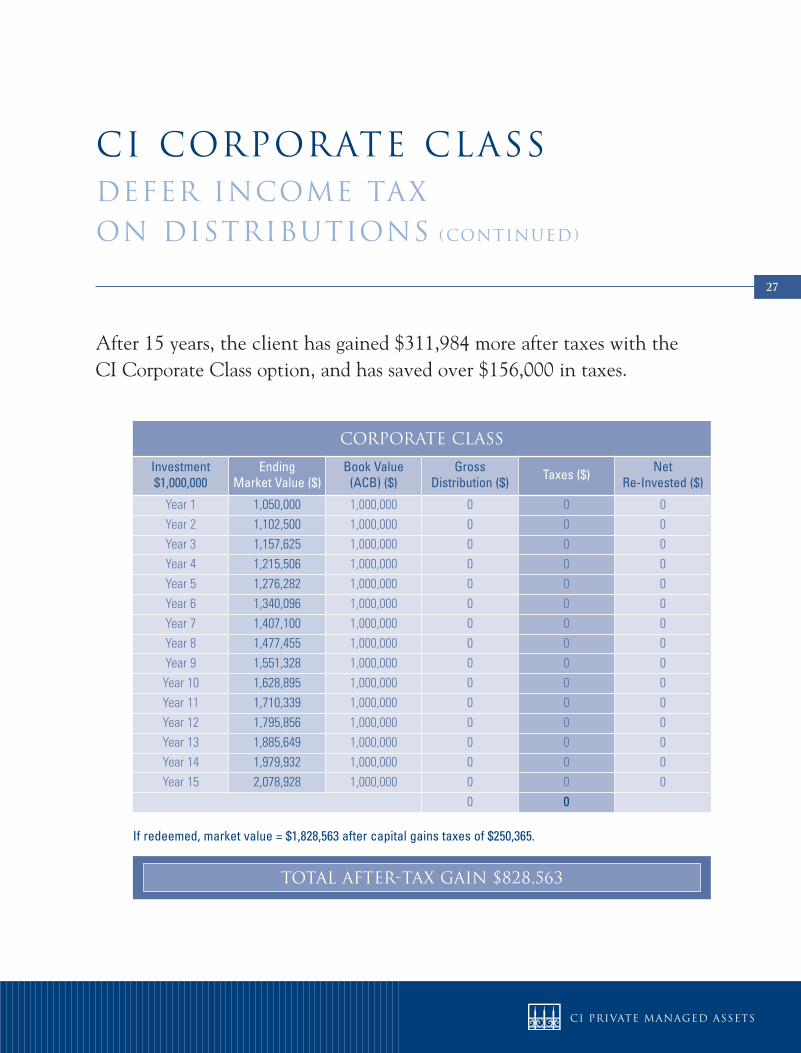
CI corporate classdefer income tax on distributions (CONTINUEd)
After 15 years, the client has gained $311,984 more after taxes with the CI Corporate Class option, and has saved over $156,000 in taxes.
corporate class
Investment$1,000,000
EndingMarket Value ($)
Book Value(ACB) ($)
Gross Distribution ($) Taxes ($) Net
Re-Invested ($)
Year 1 1,050,000 1,000,000 0 0 0Year 2 1,102,500 1,000,000 0 0 0Year 3 1,157,625 1,000,000 0 0 0Year 4 1,215,506 1,000,000 0 0 0Year 5 1,276,282 1,000,000 0 0 0Year 6 1,340,096 1,000,000 0 0 0Year 7 1,407,100 1,000,000 0 0 0Year 8 1,477,455 1,000,000 0 0 0Year 9 1,551,328 1,000,000 0 0 0Year 10 1,628,895 1,000,000 0 0 0Year 11 1,710,339 1,000,000 0 0 0Year 12 1,795,856 1,000,000 0 0 0Year 13 1,885,649 1,000,000 0 0 0Year 14 1,979,932 1,000,000 0 0 0Year 15 2,078,928 1,000,000 0 0 0
0 0
Total after-tax gain $828,563
If redeemed, market value = $1,828,563 after capital gains taxes of $250,365.
28
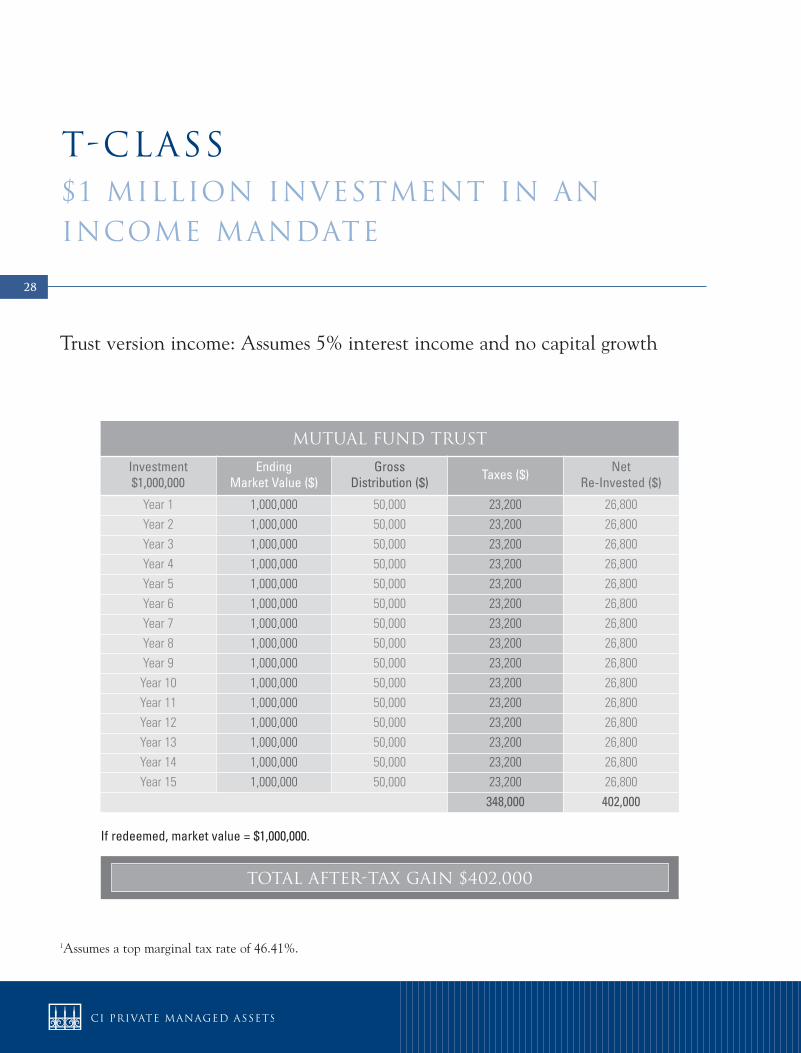
1Assumes a top marginal tax rate of 46.41%.
Trust version income: Assumes 5% interest income and no capital growth
T-class$1 million investment in anincome mandate
MUTUAL FUND TRUST
Investment$1,000,000
EndingMarket Value ($)
GrossDistribution ($) Taxes ($) Net
Re-Invested ($)
Year 1 1,000,000 50,000 23,200 26,800Year 2 1,000,000 50,000 23,200 26,800Year 3 1,000,000 50,000 23,200 26,800Year 4 1,000,000 50,000 23,200 26,800Year 5 1,000,000 50,000 23,200 26,800Year 6 1,000,000 50,000 23,200 26,800Year 7 1,000,000 50,000 23,200 26,800Year 8 1,000,000 50,000 23,200 26,800Year 9 1,000,000 50,000 23,200 26,800Year 10 1,000,000 50,000 23,200 26,800Year 11 1,000,000 50,000 23,200 26,800Year 12 1,000,000 50,000 23,200 26,800Year 13 1,000,000 50,000 23,200 26,800Year 14 1,000,000 50,000 23,200 26,800Year 15 1,000,000 50,000 23,200 26,800
348,000 402,000
If redeemed, market value = $1,000,000.
Total after-tax gain $402,000

29
t-class advantage $173,963.00 43.3%1Assumes a top marginal tax rate of 46.41%.
5% T-Class distrbution: assumes no capital growth
T-class$1 million investment in anincome mandate (CONTINUEd)
corporate class
Investment$1,000,000
Ending Market Value ($)
Book Value(ACB) ($)
Gross Distribution ($) Taxes ($) Net
Income ($)
Year 1 1,000,000 950,000 50,000 0 50,000Year 2 1,000,000 900,000 50,000 0 50,000Year 3 1,000,000 850,000 50,000 0 50,000Year 4 1,000,000 800,000 50,000 0 50,000Year 5 1,000,000 750,000 50,000 0 50,000Year 6 1,000,000 700,000 50,000 0 50,000Year 7 1,000,000 650,000 50,000 0 50,000Year 8 1,000,000 600,000 50,000 0 50,000Year 9 1,000,000 550,000 50,000 0 50,000Year 10 1,000,000 500,000 50,000 0 50,000Year 11 1,000,000 450,000 50,000 0 50,000Year 12 1,000,000 400,000 50,000 0 50,000Year 13 1,000,000 350,000 50,000 0 50,000Year 14 1,000,000 300,000 50,000 0 50,000Year 15 1,000,000 250,000 50,000 0 50,000
0 750,000
If redeemed, market value = $825,963 after capital gains taxes of $174,038
Total after-tax gain $575,963

30
31
All charts and illustrations in this guide are for illustrative purposes only. They are not intended to predict or projectinvestment results.
®CI Investments, the CI Investments design and Harbour Advisors are registered trademarks of CI Investments Inc.®SunWise is a registered trademark of Sun Life Assurance Company of Canada.
Commissions, trailing commissions, management fees and expenses all may be associated with mutual fund investments.Please read the prospectus before investing. Unless otherwise indicated and except for returns for periods less than oneyear, the indicated rates of return are the historical annual compounded total returns including changes in security value.All performance data assume reinvestment of all distributions or dividends and do not take into account sales,redemption, distribution or optional charges or income taxes payable by any securityholder that would have reducedreturns. Mutual funds are not guaranteed, their values change frequently and past performance may not be repeated.
Sun Life Assurance Company of Canada, a member of the Sun Life Financial group of companies, is the sole issuer of theindividual variable annuity contract providing for investment in Clarica and SunWise segregated funds. A description ofthe key features of the applicable individual variable annuity contract is contained in the information folder. SUBJECTTO ANY APPLICABLE DEATH AND MATURITY GUARANTEES, ANY PART OF THE PREMIUM OROTHER AMOUNT THAT IS ALLOCATED TO A SEGREGATED FUND IS INVESTED AT THE RISK OFTHE CONTRACTHOLDER AND MAY INCREASE OR DECREASE IN VALUE ACCORDING TOFLUCTUATIONS IN THE MARKET VALUE OF THE ASSETS OF THE RELEVANT SEGREGATEDFUND.
disclaimers
03659 (03/10)