Maximal left ventricular wall thickness: a comparison between CMR and echocardiography in...
2
POSTER PRESENTATION Open Access Maximal left ventricular wall thickness: a comparison between CMR and echocardiography in hypertrophic cardiomyopathy Celia P Corona-Villalobos 1* , Lars Sorensen 2 , Linda Chu 1 , Theodore Abraham 2 , Ihab R Kamel 1 , Stefan L Zimmerman 1 From 16th Annual SCMR Scientific Sessions San Francisco, CA, USA. 31 January - 3 February 2013 Background Echocardiography (ECHO) is used for diagnosis and management of hypertrophic cardiomyopathy (HCM). Morphologic diagnosis is based on the presence of myo- cardial thickness of >15mm in adults or a septum to posterior wall ratio of >1.5. Septal wall thickness (WT) >30 mm is one of several high risk features that are used to guide the decision for prophylactic implantable cardioverter-defibrillator (ICD) placement. Cardiac mag- netic resonance imaging (CMR) offers improved con- trast resolution over ECHO and precisely defines myocardial WT in HCM.CMR is used in suspected HCM when ECHO is inconclusive for diagnosis or when additional information is needed. We tested the hypothesis that there are differences in maximal left ventricular myocardial WT as measured by CMR and ECHO in subjects with HCM due to asym- metric septal hypertrophy (ASH). Methods 64 subjects with HCM and ASH pattern (mean age 51 years, range 18-88 years), underwent ECHO and CMR within the same day. Maximal WT by ECHO was mea- sured on parasternal long axis view in the anteroseptal and the basilar posterior wall. WT by CMR was mea- sured on the short axis view manually to obtain maxi- mal dimensions in the same segments as those obtained by ECHO. Results Overall, mean maximal septal WT for all patients was less by CMR compared with ECHO, but not statistically significant (19.1+4.7 and 20.5+4.4, respectively, p>.05). We stratified our population into two groups by maxi- mal septal WT: A) >15-19.9mm and B) >20mm. CMR showed less mean maximal septal WT than ECHO, which was significant only in group B [group A (16.8 +3.6 and 17.1+1.5, respectively, p>.05) and group B (21.8+4.4 and 24.7+3.1, respectively, p<.05)].The poster- ior wall showed greater WT for CMR compared with ECHO, which was significant only in group B [group A (12.3+2.7 and 11.1+2.7, p>.05) and B (13.7+3.8 and 11.8 +2.6, respectively, p<.05)]. On a per patient basis, the difference between ECHO and CMR for maximal septal WT was greatest in group B but significant (p<0.05) for both groups (group A -0.3+3.6mm and group B -2.9 +3.9mm). On per patient basis, the difference between ECHO and CMR for the posterior wall was greater but significant only in group B (group A 1.2+3.1, p>.05 and 1.8+4.2mm, p<.05). The septal to posterior wall ratio calculated by CMR and ECHO was also significantly dif- ferent (Group A 1.4+0.4 and 1.6+0.4 and Group B 1.7 +2.2 and 2.2+0.5 respectively, p<.05). ECHO and CMR showed good correlation for the septal WT (r=.62, p<.001); however there was a poor correlation for the posterior wall (r=.36, p<.001). Conclusions In subjects with WT >20 mm echocardiography shows systematically higher septal WT and lower posterior WT resulting in higher septal to posterior wall ratio compared to CMR. These findings have potential clini- cal implications for diagnosis and management of sub- jects with HCM. Funding No funding was given for this project. 1 Radiology and Radiological Science, Johns Hopkins Hospital, Baltimore, MD, USA Full list of author information is available at the end of the article Corona-Villalobos et al. Journal of Cardiovascular Magnetic Resonance 2013, 15(Suppl 1):P169 http://www.jcmr-online.com/content/15/S1/P169 © 2013 Corona-Villalobos et al; licensee BioMed Central Ltd. This is an Open Access article distributed under the terms of the Creative Commons Attribution License (http://creativecommons.org/licenses/by/2.0), which permits unrestricted use, distribution, and reproduction in any medium, provided the original work is properly cited.
-
Upload
lars-sorensen -
Category
Documents
-
view
213 -
download
0
Transcript of Maximal left ventricular wall thickness: a comparison between CMR and echocardiography in...
POSTER PRESENTATION Open Access
Maximal left ventricular wall thickness: acomparison between CMR and echocardiographyin hypertrophic cardiomyopathyCelia P Corona-Villalobos1*, Lars Sorensen2, Linda Chu1, Theodore Abraham2, Ihab R Kamel1, Stefan L Zimmerman1
From 16th Annual SCMR Scientific SessionsSan Francisco, CA, USA. 31 January - 3 February 2013
BackgroundEchocardiography (ECHO) is used for diagnosis andmanagement of hypertrophic cardiomyopathy (HCM).Morphologic diagnosis is based on the presence of myo-cardial thickness of >15mm in adults or a septum toposterior wall ratio of >1.5. Septal wall thickness (WT)>30 mm is one of several high risk features that areused to guide the decision for prophylactic implantablecardioverter-defibrillator (ICD) placement. Cardiac mag-netic resonance imaging (CMR) offers improved con-trast resolution over ECHO and precisely definesmyocardial WT in HCM.CMR is used in suspectedHCM when ECHO is inconclusive for diagnosis orwhen additional information is needed.We tested the hypothesis that there are differences in
maximal left ventricular myocardial WT as measured byCMR and ECHO in subjects with HCM due to asym-metric septal hypertrophy (ASH).
Methods64 subjects with HCM and ASH pattern (mean age 51years, range 18-88 years), underwent ECHO and CMRwithin the same day. Maximal WT by ECHO was mea-sured on parasternal long axis view in the anteroseptaland the basilar posterior wall. WT by CMR was mea-sured on the short axis view manually to obtain maxi-mal dimensions in the same segments as those obtainedby ECHO.
ResultsOverall, mean maximal septal WT for all patients wasless by CMR compared with ECHO, but not statistically
significant (19.1+4.7 and 20.5+4.4, respectively, p>.05).We stratified our population into two groups by maxi-mal septal WT: A) >15-19.9mm and B) >20mm. CMRshowed less mean maximal septal WT than ECHO,which was significant only in group B [group A (16.8+3.6 and 17.1+1.5, respectively, p>.05) and group B(21.8+4.4 and 24.7+3.1, respectively, p<.05)].The poster-ior wall showed greater WT for CMR compared withECHO, which was significant only in group B [group A(12.3+2.7 and 11.1+2.7, p>.05) and B (13.7+3.8 and 11.8+2.6, respectively, p<.05)]. On a per patient basis, thedifference between ECHO and CMR for maximal septalWT was greatest in group B but significant (p<0.05) forboth groups (group A -0.3+3.6mm and group B -2.9+3.9mm). On per patient basis, the difference betweenECHO and CMR for the posterior wall was greater butsignificant only in group B (group A 1.2+3.1, p>.05 and1.8+4.2mm, p<.05). The septal to posterior wall ratiocalculated by CMR and ECHO was also significantly dif-ferent (Group A 1.4+0.4 and 1.6+0.4 and Group B 1.7+2.2 and 2.2+0.5 respectively, p<.05). ECHO and CMRshowed good correlation for the septal WT (r=.62,p<.001); however there was a poor correlation for theposterior wall (r=.36, p<.001).
ConclusionsIn subjects with WT >20 mm echocardiography showssystematically higher septal WT and lower posteriorWT resulting in higher septal to posterior wall ratiocompared to CMR. These findings have potential clini-cal implications for diagnosis and management of sub-jects with HCM.
FundingNo funding was given for this project.
1Radiology and Radiological Science, Johns Hopkins Hospital, Baltimore, MD,USAFull list of author information is available at the end of the article
Corona-Villalobos et al. Journal of Cardiovascular MagneticResonance 2013, 15(Suppl 1):P169http://www.jcmr-online.com/content/15/S1/P169
© 2013 Corona-Villalobos et al; licensee BioMed Central Ltd. This is an Open Access article distributed under the terms of the CreativeCommons Attribution License (http://creativecommons.org/licenses/by/2.0), which permits unrestricted use, distribution, andreproduction in any medium, provided the original work is properly cited.
Author details1Radiology and Radiological Science, Johns Hopkins Hospital, Baltimore, MD,USA. 2Department of Cardiology, Johns Hopkins Hospital, Baltimore, MD,USA.
Published: 30 January 2013
doi:10.1186/1532-429X-15-S1-P169Cite this article as: Corona-Villalobos et al.: Maximal left ventricular wallthickness: a comparison between CMR and echocardiography inhypertrophic cardiomyopathy. Journal of Cardiovascular MagneticResonance 2013 15(Suppl 1):P169.
Submit your next manuscript to BioMed Centraland take full advantage of:
• Convenient online submission
• Thorough peer review
• No space constraints or color figure charges
• Immediate publication on acceptance
• Inclusion in PubMed, CAS, Scopus and Google Scholar
• Research which is freely available for redistribution
Submit your manuscript at www.biomedcentral.com/submit
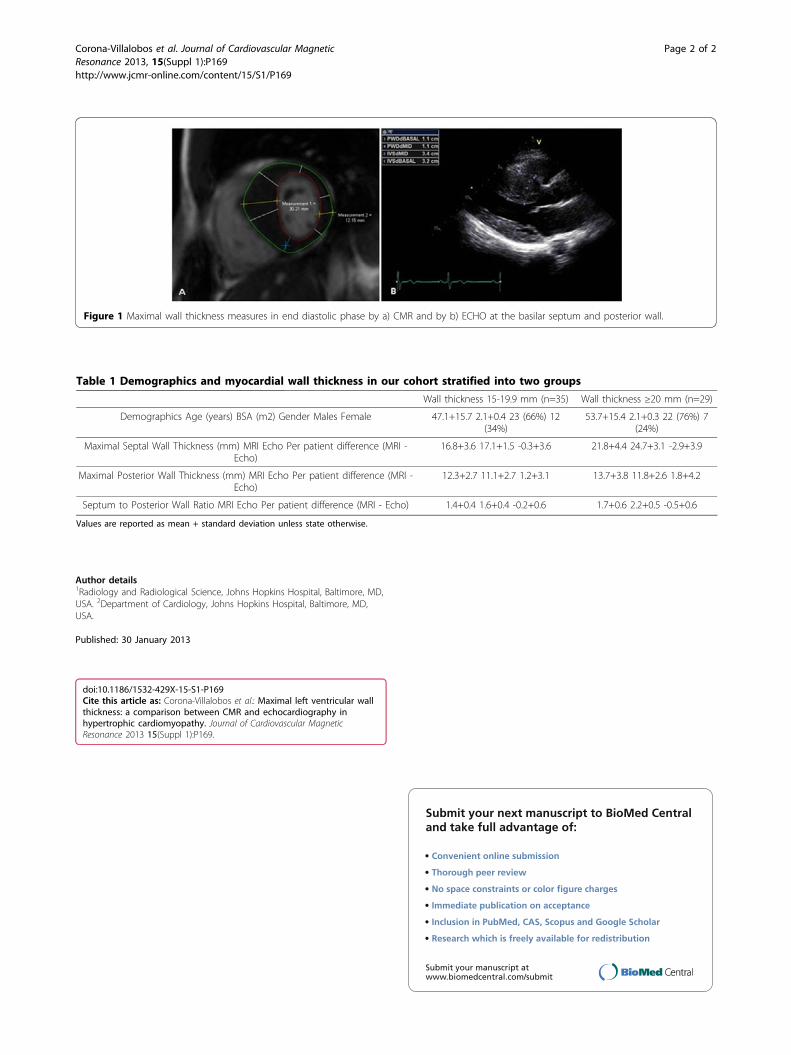
Figure 1 Maximal wall thickness measures in end diastolic phase by a) CMR and by b) ECHO at the basilar septum and posterior wall.
Table 1 Demographics and myocardial wall thickness in our cohort stratified into two groups
Wall thickness 15-19.9 mm (n=35) Wall thickness ≥20 mm (n=29)
Demographics Age (years) BSA (m2) Gender Males Female 47.1+15.7 2.1+0.4 23 (66%) 12(34%)
53.7+15.4 2.1+0.3 22 (76%) 7(24%)
Maximal Septal Wall Thickness (mm) MRI Echo Per patient difference (MRI -Echo)
16.8+3.6 17.1+1.5 -0.3+3.6 21.8+4.4 24.7+3.1 -2.9+3.9
Maximal Posterior Wall Thickness (mm) MRI Echo Per patient difference (MRI -Echo)
12.3+2.7 11.1+2.7 1.2+3.1 13.7+3.8 11.8+2.6 1.8+4.2
Septum to Posterior Wall Ratio MRI Echo Per patient difference (MRI - Echo) 1.4+0.4 1.6+0.4 -0.2+0.6 1.7+0.6 2.2+0.5 -0.5+0.6
Values are reported as mean + standard deviation unless state otherwise.
Corona-Villalobos et al. Journal of Cardiovascular MagneticResonance 2013, 15(Suppl 1):P169http://www.jcmr-online.com/content/15/S1/P169
Page 2 of 2