Maturing Shared Services Through Use Of Metrics And Benchmarks · Maturing Shared Services Through...
21
Maturing Shared Services Through Use Of Metrics And Benchmarks Maturing Shared Services Through Use Of Metrics And Benchmarks Lisa Miller VP, Controller PepsiCo Financial Shared Services Guido Sterk Director Shared Services Advisory, PwC Lisa Miller VP, Controller PepsiCo Financial Shared Services
-
Upload
nguyendang -
Category
Documents
-
view
234 -
download
1
Transcript of Maturing Shared Services Through Use Of Metrics And Benchmarks · Maturing Shared Services Through...
Maturing Shared Services Through Use Of Metrics And Benchmarks
Maturing Shared Services Through Use Of Metrics And Benchmarks
Lisa Miller VP, Controller PepsiCo Financial Shared Services
Guido SterkDirector
Shared Services Advisory, PwC
Lisa Miller VP, Controller PepsiCo Financial Shared Services
AgendaAgenda
Shared Services Trends Who is PepsiCo?PepsiCo’s Shared Services LandscapePepsiCo Financial Shared Services Journey
Formation and EvolutionBenchmarking Key MetricsFast Facts and Focus
Global Data BaseliningWhat’s Ahead
Shared Services Trends Who is PepsiCo?PepsiCo’s Shared Services LandscapePepsiCo Financial Shared Services Journey
Formation and EvolutionBenchmarking Key MetricsFast Facts and Focus
Global Data BaseliningWhat’s Ahead
Shared Services Trends (1)Shared Services Trends (1)
Move to higher value activities
Use of captive (in-house) SSC
Move to an operating ‘global’
template
Selective use of third-party outsourcers
Improve Internal
Operations
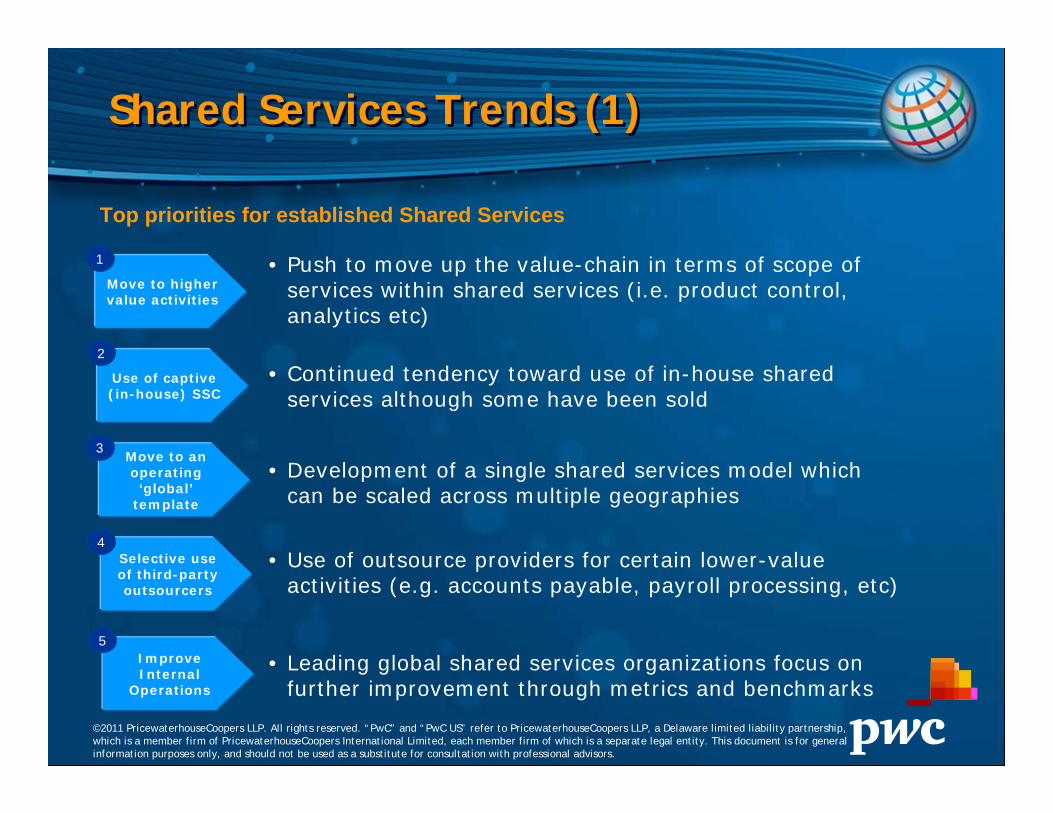
• Push to move up the value-chain in terms of scope of services within shared services (i.e. product control, analytics etc)
• Continued tendency toward use of in-house shared services although some have been sold
• Development of a single shared services model which can be scaled across multiple geographies
• Use of outsource providers for certain lower-value activities (e.g. accounts payable, payroll processing, etc)
• Leading global shared services organizations focus on further improvement through metrics and benchmarks
1
2
3
4
5
Top priorities for established Shared Services
©2011 PricewaterhouseCoopers LLP. All rights reserved. “PwC” and “PwC US” refer to PricewaterhouseCoopers LLP, a Delaware limited liability partnership, which is a member firm of PricewaterhouseCoopers International Limited, each member firm of which is a separate legal entity. This document is for general information purposes only, and should not be used as a substitute for consultation with professional advisors.
Shared Services Trends (2)Shared Services Trends (2)
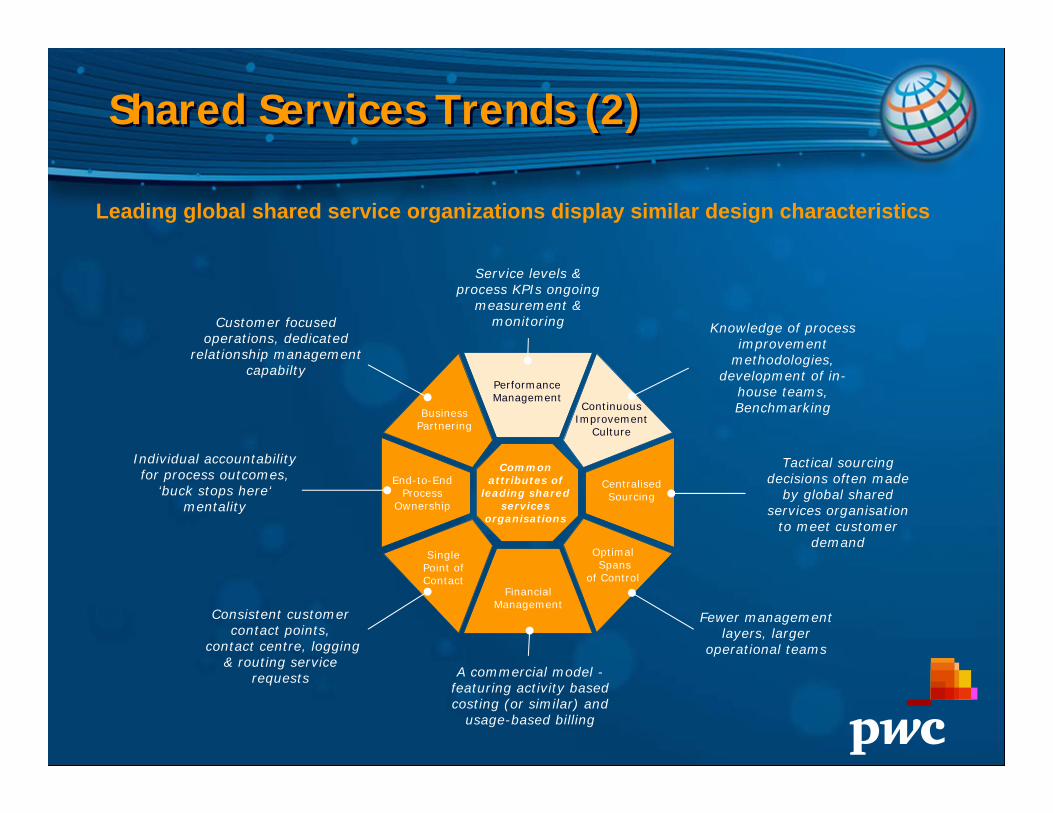
Leading global shared service organizations display similar design characteristics
Customer focused operations, dedicated
relationship management capabilty
Individual accountability for process outcomes,
‘buck stops here‘mentality
Consistent customer contact points,
contact centre, logging & routing service
requests
Knowledge of process improvement
methodologies, development of in-
house teams,Benchmarking
A commercial model -featuring activity based costing (or similar) and
usage-based billing
Service levels & process KPIs ongoing
measurement & monitoring
Tactical sourcing decisions often made
by global shared services organisation
to meet customer demand
Fewer management layers, larger
operational teams
Common attributes of
leading shared services
organisations
OptimalSpans
of ControlFinancial
Management
Centralised Sourcing
End-to-End Process
Ownership
Single Point of Contact
Performance Management
Business Partnering
Continuous Improvement
Culture
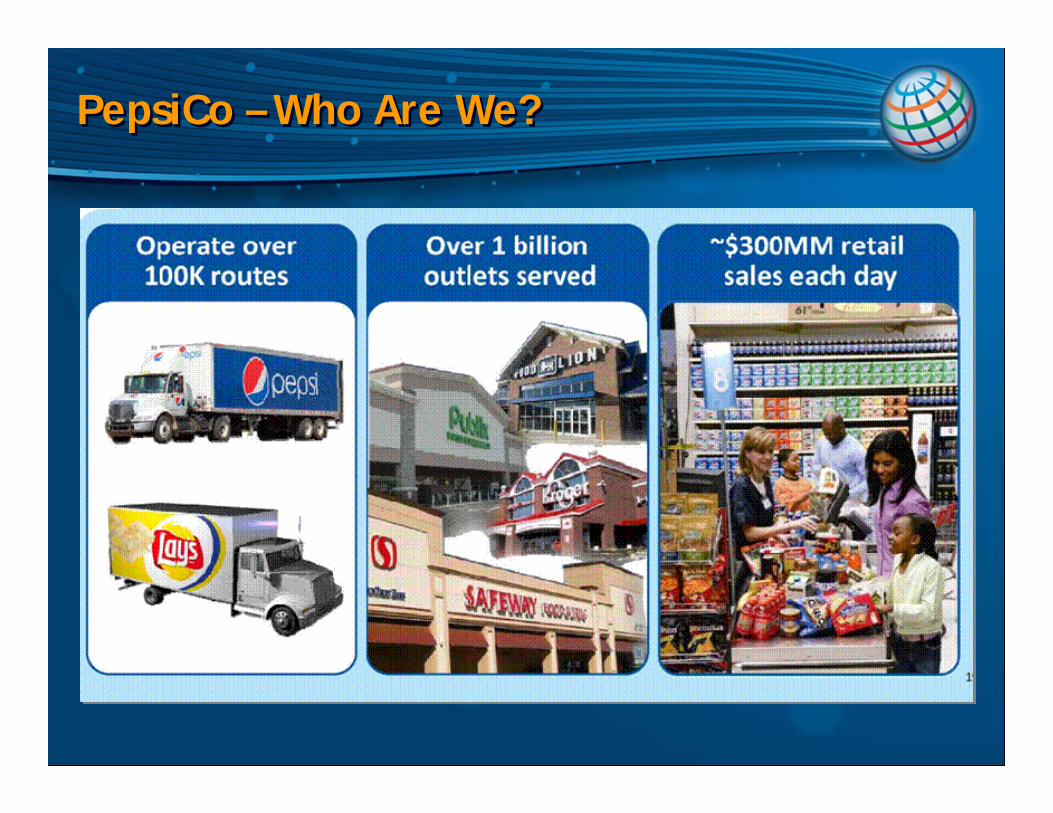
PepsiCo – Who Are We?PepsiCo – Who Are We?
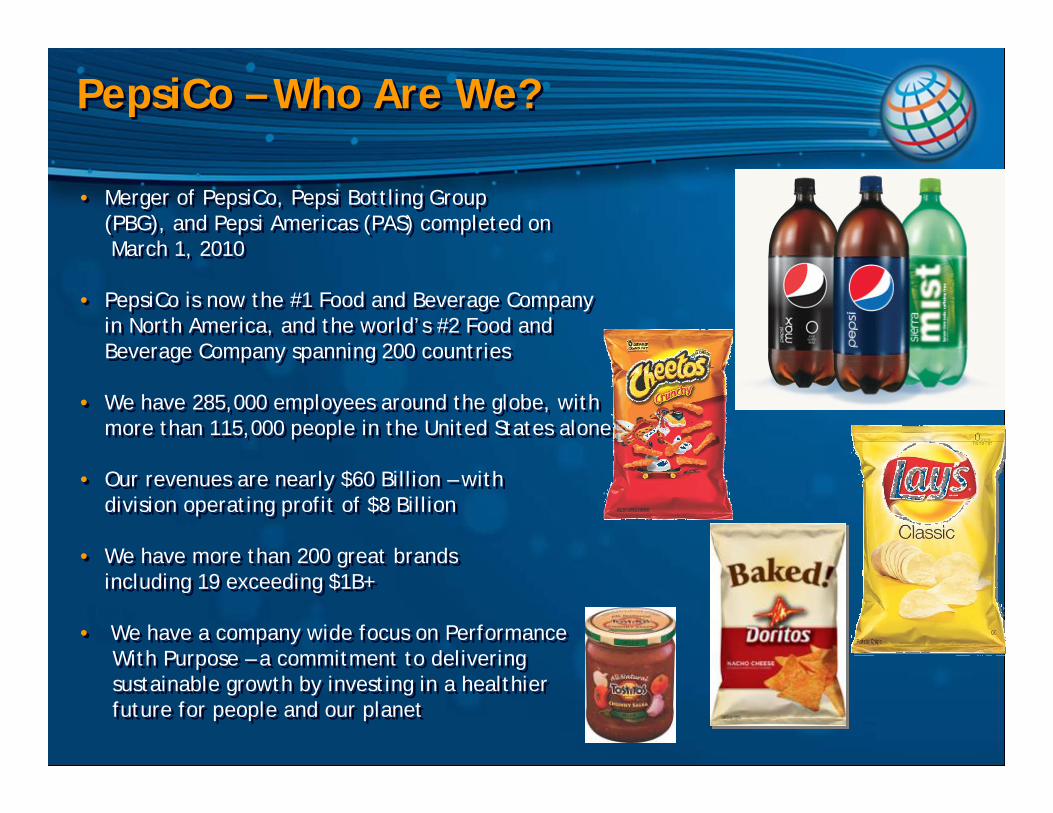
• Merger of PepsiCo, Pepsi Bottling Group (PBG), and Pepsi Americas (PAS) completed onMarch 1, 2010
• PepsiCo is now the #1 Food and Beverage Company in North America, and the world’s #2 Food and Beverage Company spanning 200 countries
• We have 285,000 employees around the globe, with more than 115,000 people in the United States alone
• Our revenues are nearly $60 Billion – with division operating profit of $8 Billion
• We have more than 200 great brands including 19 exceeding $1B+
• We have a company wide focus on Performance With Purpose – a commitment to deliveringsustainable growth by investing in a healthier future for people and our planet
PepsiCo – Who Are We?PepsiCo – Who Are We?
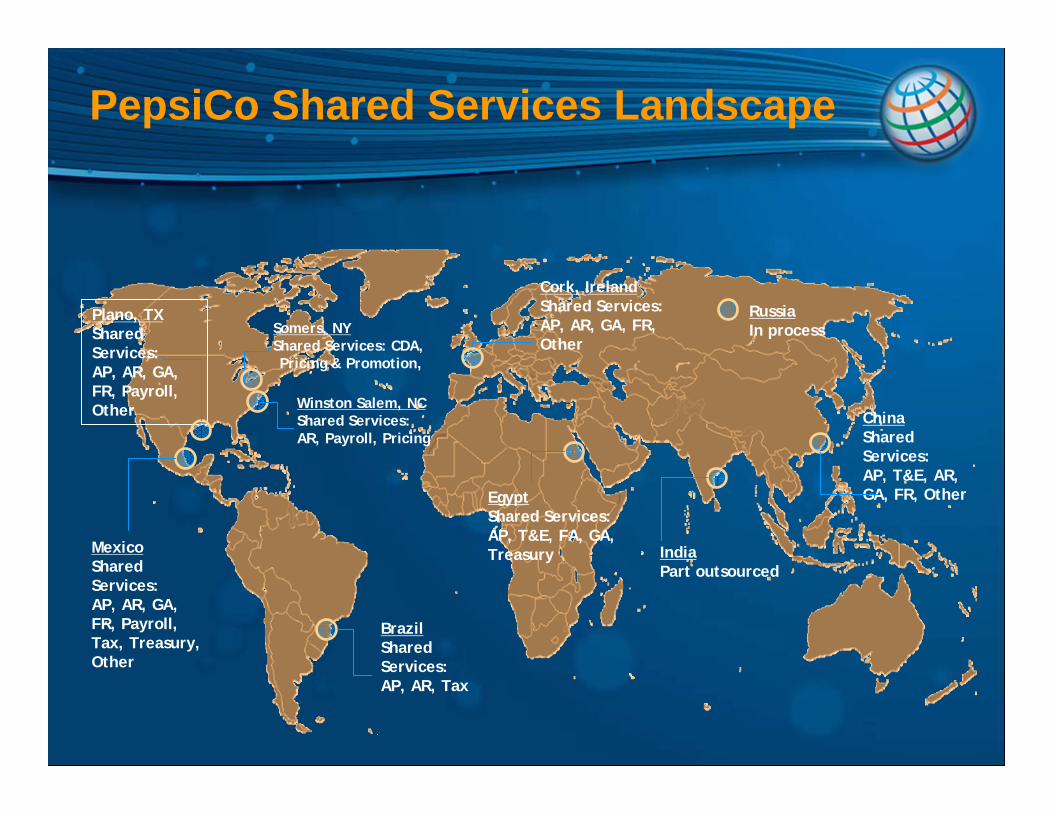
PepsiCo Shared Services Landscape
Plano, TXShared Services: AP, AR, GA, FR, Payroll, Other
Cork, IrelandShared Services: AP, AR, GA, FR, Other
IndiaPart outsourced
ChinaShared Services:AP, T&E, AR, GA, FR, Other
Winston Salem, NCShared Services:AR, Payroll, Pricing
EgyptShared Services: AP, T&E, FA, GA, TreasuryMexico
Shared Services: AP, AR, GA, FR, Payroll, Tax, Treasury, Other
BrazilShared Services:AP, AR, Tax
RussiaIn processSomers, NY
Shared Services: CDA, Pricing & Promotion,
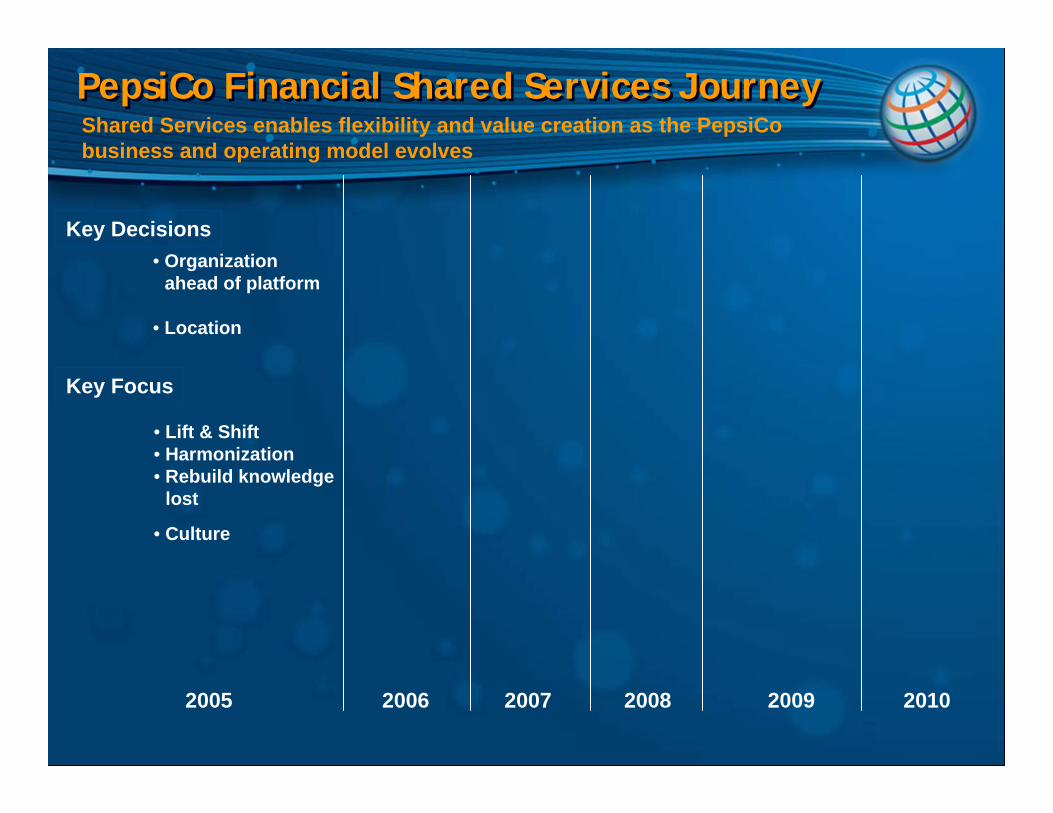
PepsiCo Financial Shared Services JourneyPepsiCo Financial Shared Services Journey
Key Decisions• Organization
ahead of platform
• Location
2005 2006 2007 2008 2009 2010
Key Focus
• Lift & Shift• Harmonization• Rebuild knowledge
lost
• Culture
Shared Services enables flexibility and value creation as the PepsiCobusiness and operating model evolves
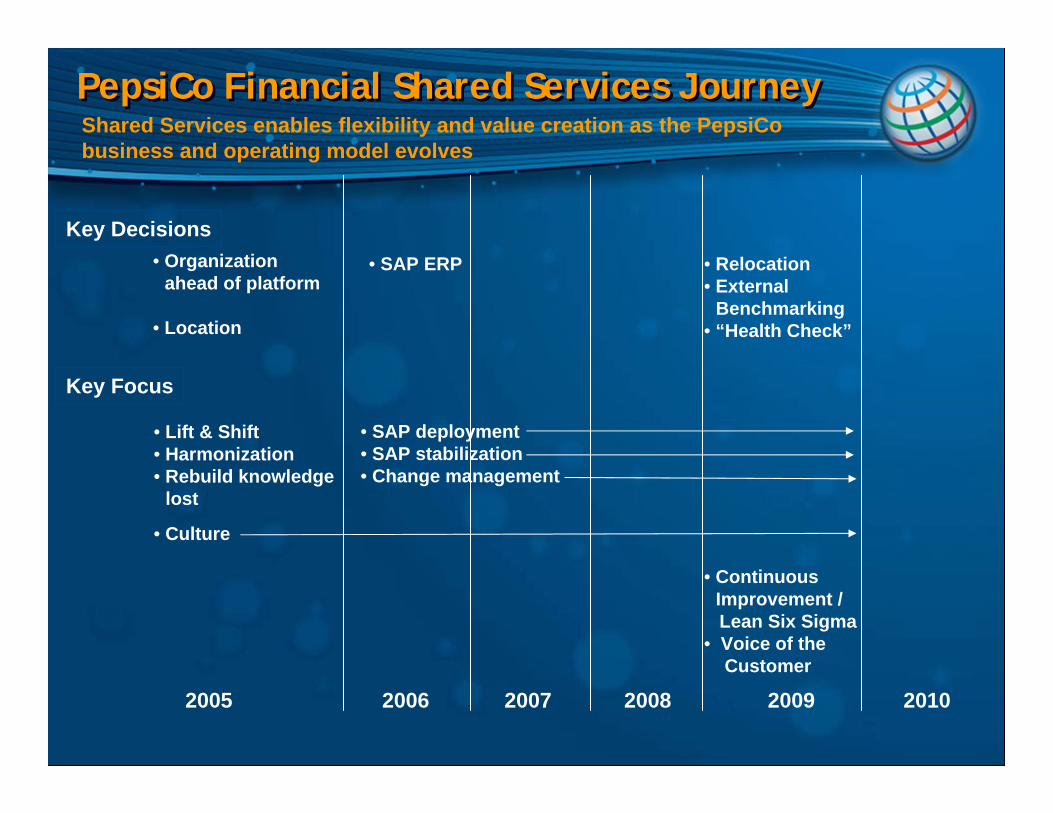
PepsiCo Financial Shared Services JourneyPepsiCo Financial Shared Services Journey
Key Decisions• Organization
ahead of platform
• Location
2005 2006 2007 2008 2009 2010
• SAP ERP • Relocation• External
Benchmarking• “Health Check”
Key Focus
• Lift & Shift• Harmonization• Rebuild knowledge
lost
• Culture
• SAP deployment• SAP stabilization• Change management
• ContinuousImprovement / Lean Six Sigma
• Voice of theCustomer
Shared Services enables flexibility and value creation as the PepsiCobusiness and operating model evolves

PepsiCo Financial Shared Services JourneyPepsiCo Financial Shared Services Journey
Key Decisions• Organization
ahead of platform
• Location
2005 2006 2007 2008 2009 2010
• SAP ERP • Relocation• External
Benchmarking• “Health Check”
• Oracle forFrito-Lay
Key Focus
• Lift & Shift• Harmonization• Rebuild knowledge
lost• Culture /
Grow our People
• SAP deployment• SAP stabilization• Change management
• SAP Optimization
• ContinuousImprovement / Lean Six Sigma
• Voice of theCustomer
• Metrics / workdrivers
• Baselineexcellence
• Vision / strategy
Shared Services enables flexibility and value creation as the PepsiCobusiness and operating model evolves

Vision And Operating Principles
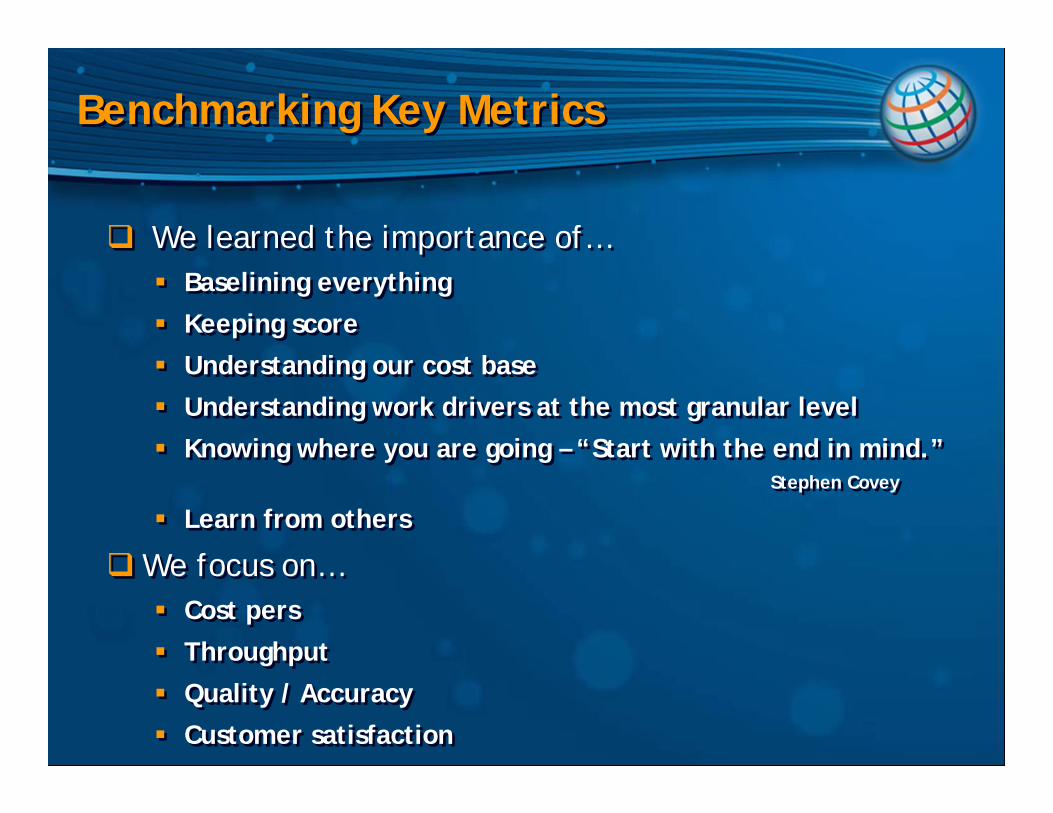
Benchmarking Key MetricsBenchmarking Key Metrics
We learned the importance of…Baselining everything
Keeping score
Understanding our cost baseUnderstanding work drivers at the most granular level
Knowing where you are going – “Start with the end in mind.”Stephen Covey
Learn from others
We focus on…Cost pers
Throughput
Quality / Accuracy
Customer satisfaction
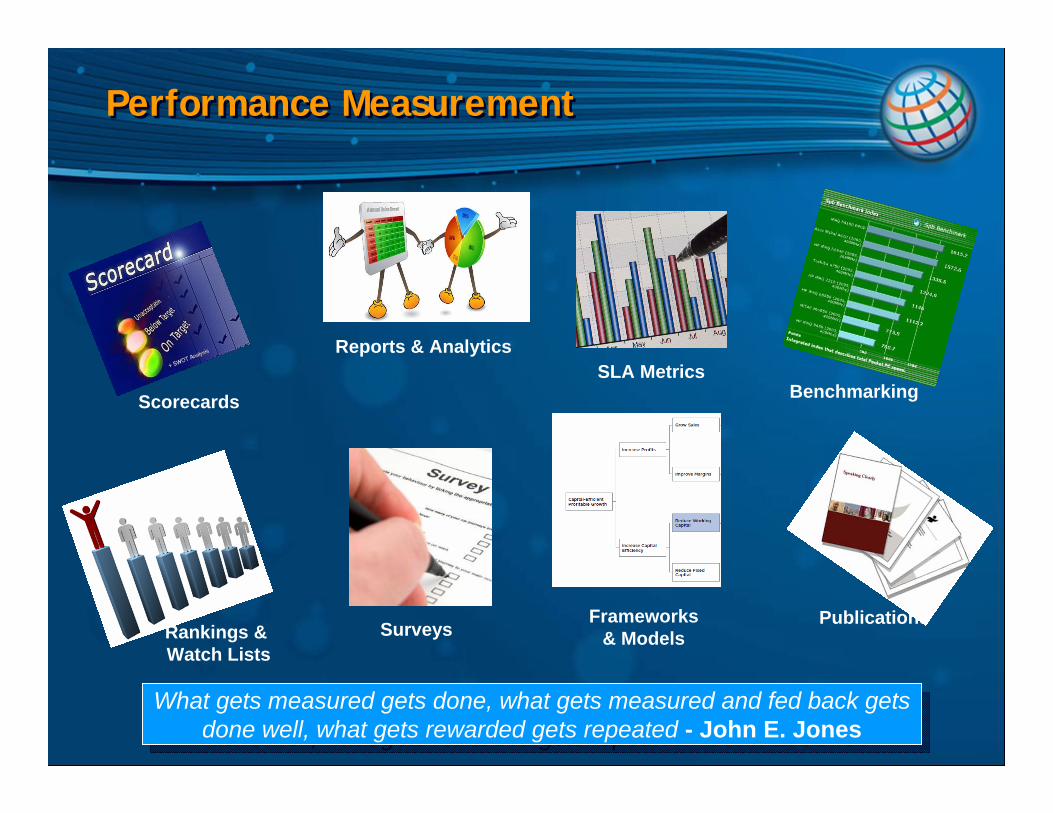
Performance MeasurementPerformance Measurement
What gets measured gets done, what gets measured and fed back gets done well, what gets rewarded gets repeated - John E. Jones
What gets measured gets done, what gets measured and fed back gets done well, what gets rewarded gets repeated - John E. Jones
ScorecardsSLA Metrics
Surveys
Reports & Analytics
Rankings &Watch Lists
Frameworks& Models
Publications
Benchmarking
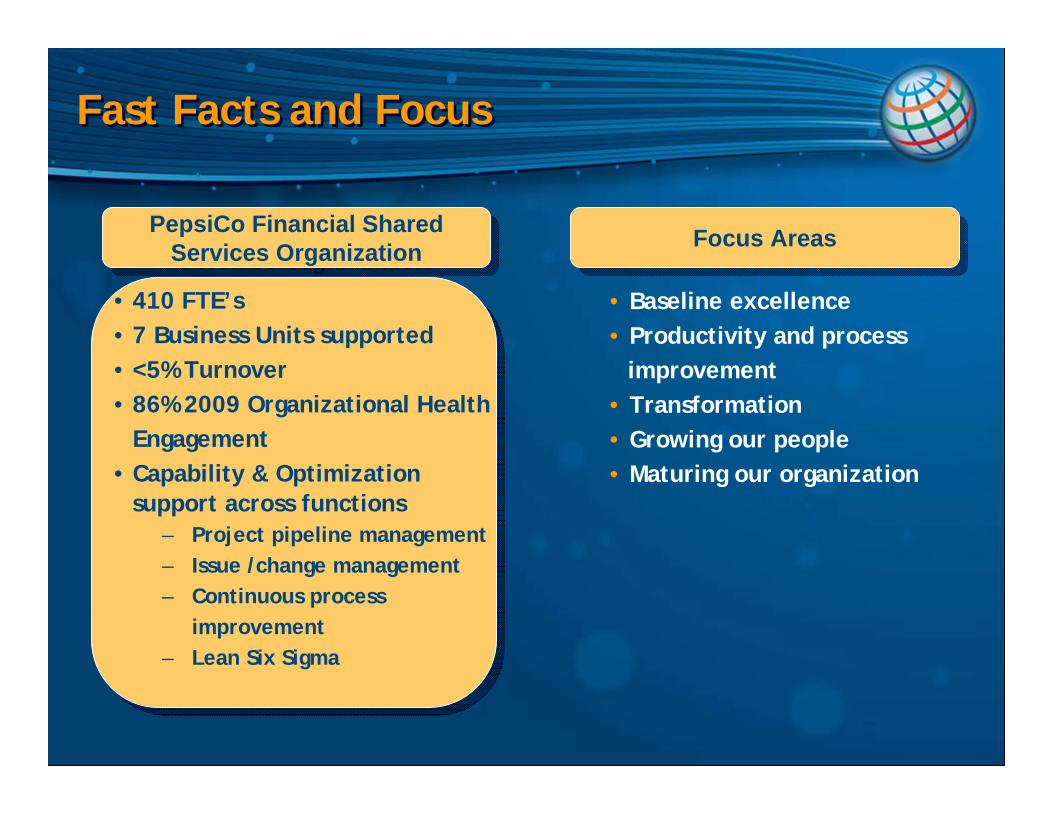
Fast Facts and FocusFast Facts and Focus
• 410 FTE’s• 7 Business Units supported• <5% Turnover• 86% 2009 Organizational Health
Engagement• Capability & Optimization
support across functions– Project pipeline management– Issue /change management– Continuous process
improvement– Lean Six Sigma
PepsiCo Financial SharedServices Organization
PepsiCo Financial SharedServices Organization
• Baseline excellence• Productivity and process
improvement• Transformation• Growing our people• Maturing our organization
Focus AreasFocus Areas
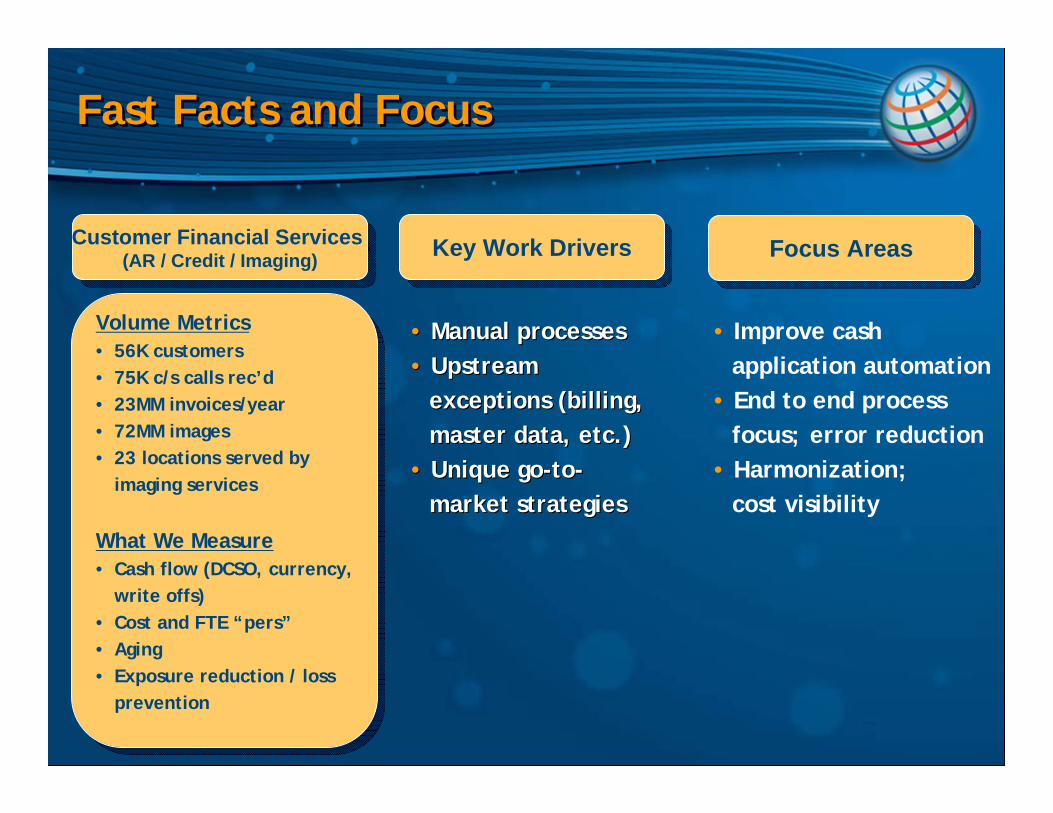
Volume Metrics• 56K customers• 75K c/s calls rec’d• 23MM invoices/year• 72MM images• 23 locations served by
imaging services
What We Measure• Cash flow (DCSO, currency,
write offs)• Cost and FTE “pers”• Aging• Exposure reduction / loss
prevention
Volume Metrics• 56K customers• 75K c/s calls rec’d• 23MM invoices/year• 72MM images• 23 locations served by
imaging services
What We Measure• Cash flow (DCSO, currency,
write offs)• Cost and FTE “pers”• Aging• Exposure reduction / loss
prevention
Fast Facts and FocusFast Facts and Focus
Customer Financial Services (AR / Credit / Imaging)
Customer Financial Services (AR / Credit / Imaging)
• Improve cash application automation
• End to end process focus; error reduction
• Harmonization; cost visibility
•• Manual processesManual processes•• Upstream Upstream
exceptions (billing, exceptions (billing, master data, etc.)master data, etc.)
•• Unique goUnique go--toto--market strategiesmarket strategies
Key Work DriversKey Work Drivers Focus AreasFocus Areas
Fast Facts and FocusFast Facts and Focus
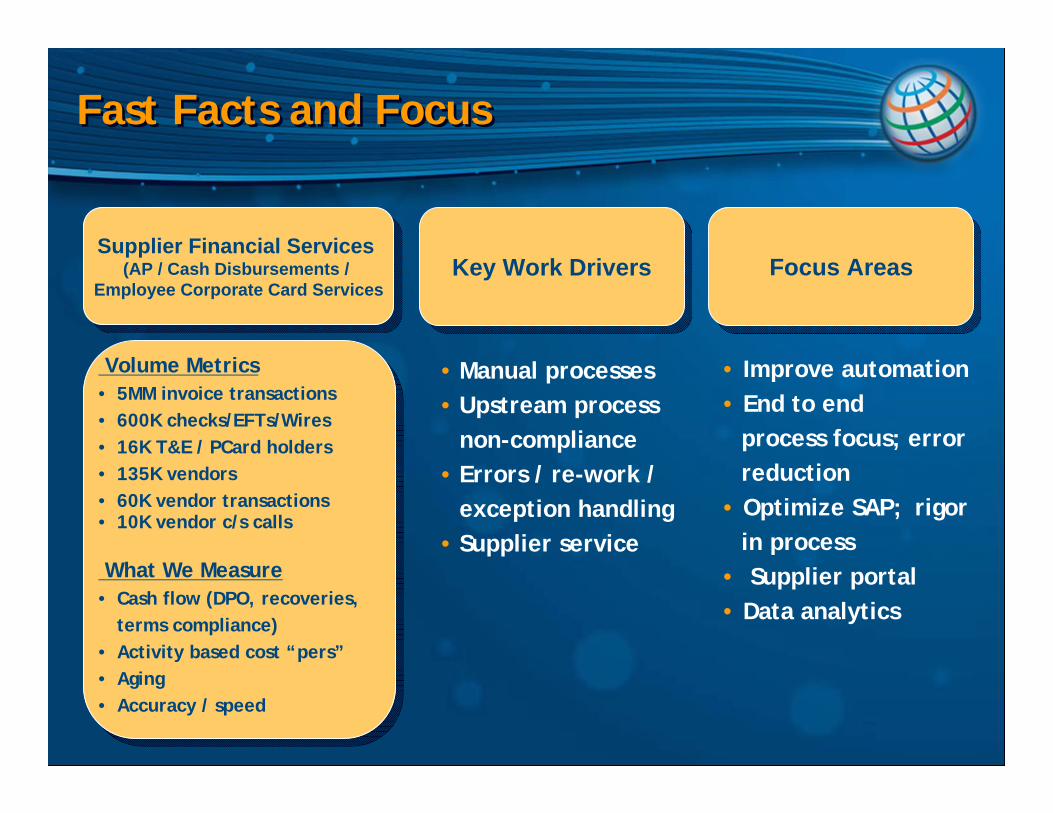
Supplier Financial Services (AP / Cash Disbursements /
Employee Corporate Card Services
Supplier Financial Services (AP / Cash Disbursements /
Employee Corporate Card Services
Volume Metrics• 5MM invoice transactions• 600K checks/EFTs/Wires• 16K T&E / PCard holders• 135K vendors• 60K vendor transactions• 10K vendor c/s calls
What We Measure• Cash flow (DPO, recoveries,
terms compliance)• Activity based cost “pers”• Aging• Accuracy / speed
• Improve automation• End to end
process focus; error reduction
• Optimize SAP; rigor in process
• Supplier portal• Data analytics
• Manual processes• Upstream process
non-compliance• Errors / re-work /
exception handling• Supplier service
Key Work DriversKey Work Drivers Focus AreasFocus Areas
Fast Facts and FocusFast Facts and Focus
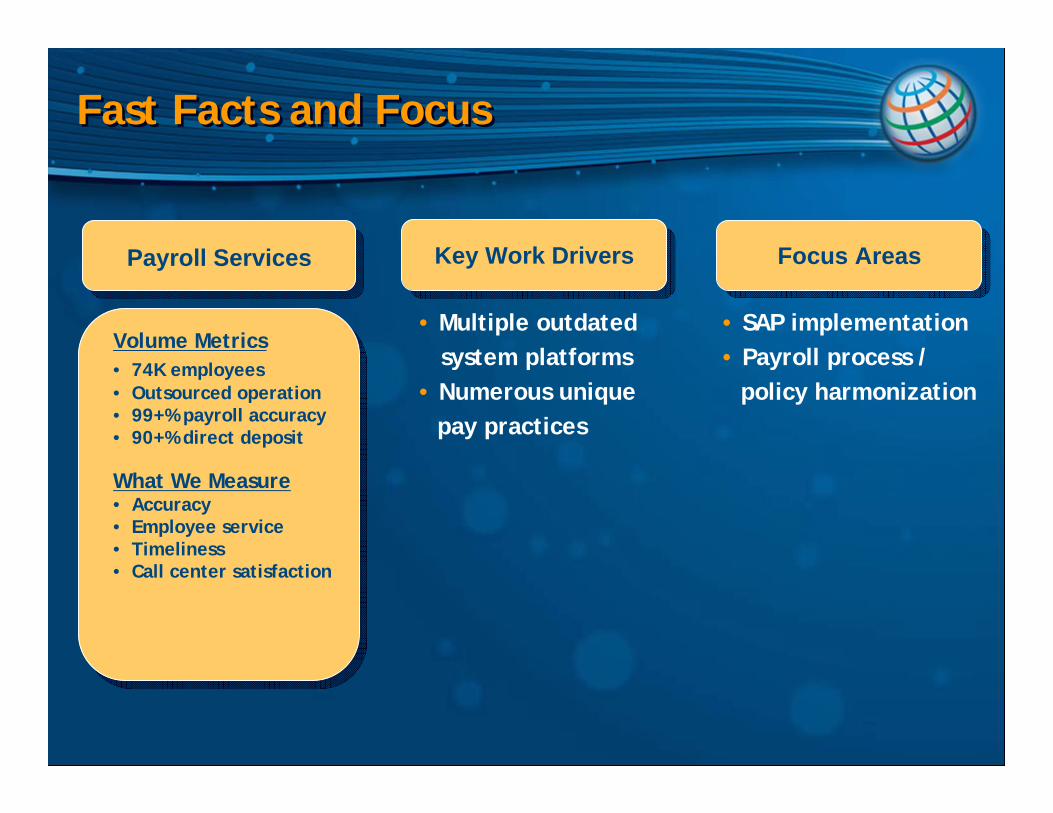
Payroll ServicesPayroll Services
Volume Metrics• 74K employees• Outsourced operation• 99+% payroll accuracy• 90+% direct deposit
What We Measure• Accuracy• Employee service• Timeliness• Call center satisfaction
• Multiple outdatedsystem platforms
• Numerous unique pay practices
• SAP implementation• Payroll process /
policy harmonization
Key Work DriversKey Work Drivers Focus AreasFocus Areas
Fast Facts and FocusFast Facts and Focus
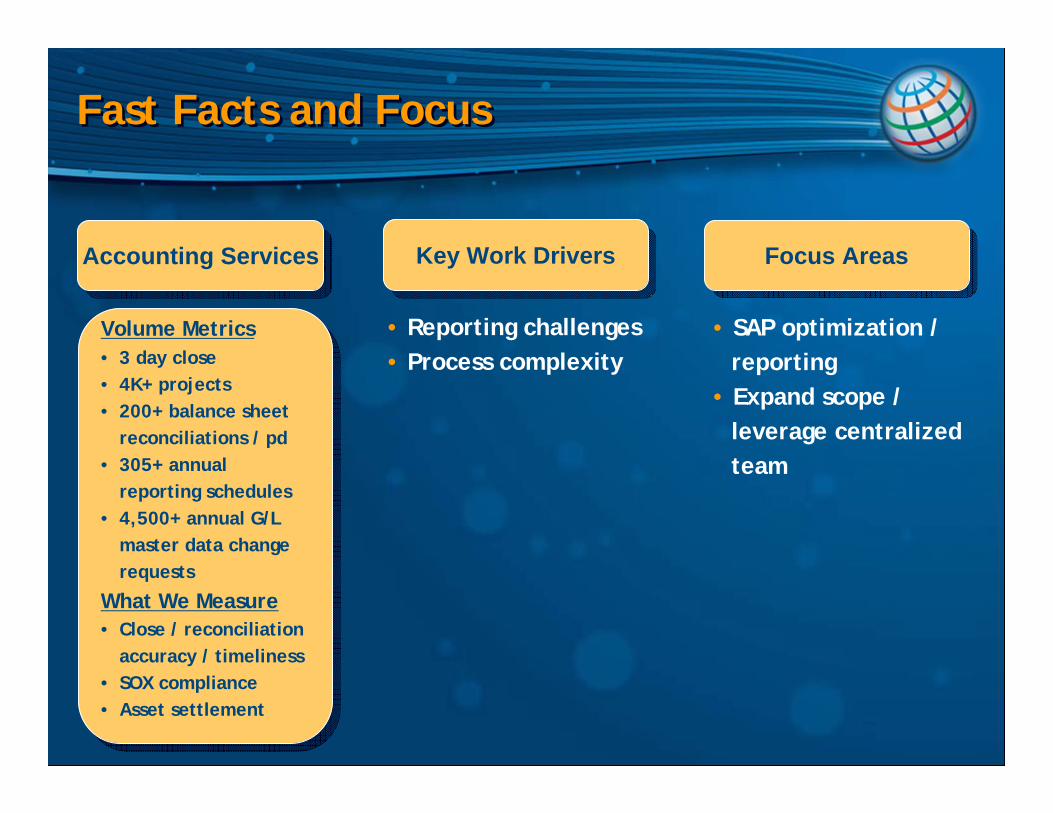
Accounting ServicesAccounting Services
Volume Metrics• 3 day close• 4K+ projects• 200+ balance sheet
reconciliations / pd• 305+ annual
reporting schedules • 4,500+ annual G/L
master data change requests
What We Measure• Close / reconciliation
accuracy / timeliness• SOX compliance• Asset settlement
• Reporting challenges• Process complexity
• SAP optimization / reporting
• Expand scope / leverage centralized team
Key Work DriversKey Work Drivers Focus AreasFocus Areas

Global Data BaseliningGlobal Data Baselining
A key step in our journey in 2010 was engaging PwC to perform a global data baselining assessment
Objectives: Gather financial and headcount information Understand the cost structure for financial processesUltimately further improving productivity, providing ongoing flexibility, and better leveraging PepsiCo’s investments in SAP
Process:Information gathering via 163 unique global data submissions Across 17 unique finance process areas
Outcomes:“As is” baseline of Control function FTE effort and costs acrossAmericas, Europe and AMEA Identification of areas for further investigation and means tofurther leverage shared services at PepsiCo
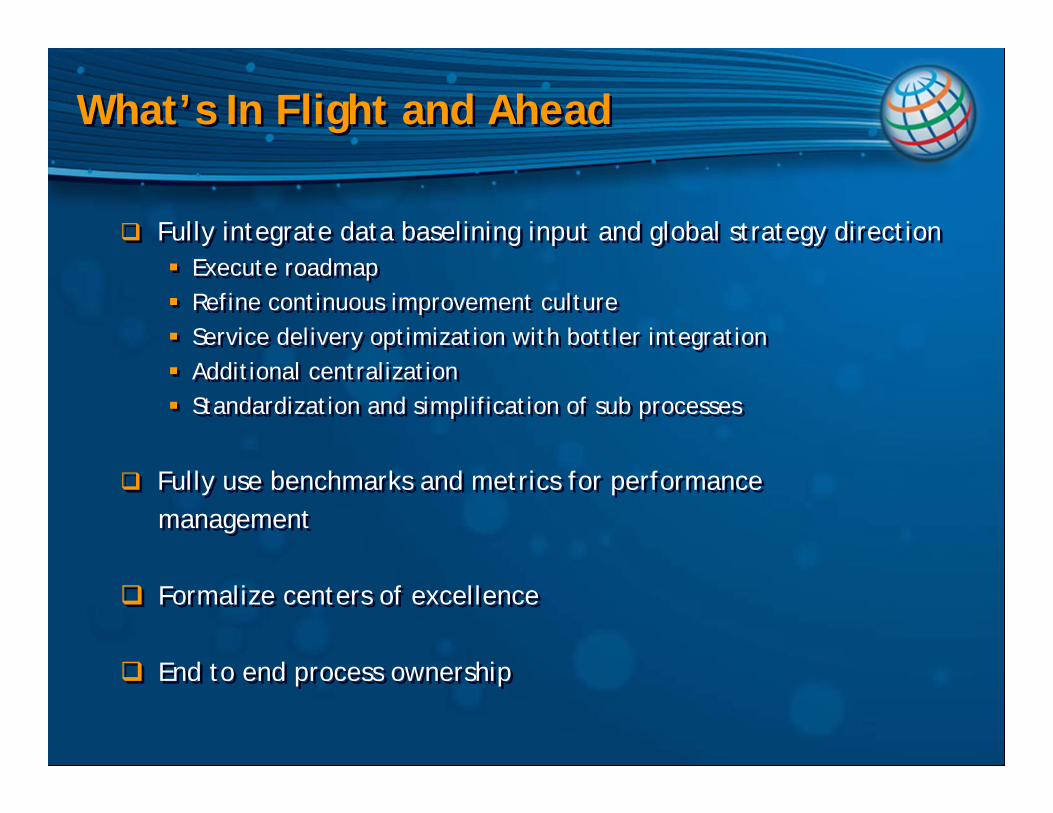
What’s In Flight and AheadWhat’s In Flight and Ahead
Fully integrate data baselining input and global strategy direction Execute roadmapRefine continuous improvement cultureService delivery optimization with bottler integrationAdditional centralizationStandardization and simplification of sub processes
Fully use benchmarks and metrics for performancemanagement
Formalize centers of excellence
End to end process ownership
Today
Questions?