[email protected]@climate.be [email protected] jcm.chooseclimate.org UNFCCC Article 2,...
31
[email protected] [email protected] jcm.chooseclimate.org UNFCCC Article 2, Stabilisation and Uncertainty probabalistic & interactive exploration of scenarios using “Java Climate Model” ASTR seminar 17 th Feb 2004 Ben Matthews [email protected] (with Jean-Pascal van Ypersele [email protected]) Institut d’astronomie et de géophysique G. Lemaître, Université catholique de Louvain, Louvain-la-Neuve, Belgium www.climate.be (UCL-ASTR) jcm.chooseclimate.org (interactive model)
-
Upload
bryan-blankenship -
Category
Documents
-
view
213 -
download
0
Transcript of [email protected]@climate.be [email protected] jcm.chooseclimate.org UNFCCC Article 2,...

[email protected] [email protected] jcm.chooseclimate.org
UNFCCC Article 2, Stabilisation and Uncertainty
probabalistic & interactive exploration of scenarios using “Java Climate
Model”
ASTR seminar 17th Feb 2004
Ben Matthews [email protected]
(with Jean-Pascal van Ypersele [email protected])Institut d’astronomie et de géophysique G. Lemaître,
Université catholique de Louvain, Louvain-la-Neuve, Belgium
www.climate.be (UCL-ASTR)jcm.chooseclimate.org (interactive model)


UN Framework Convention on Climate Change
Ultimate objective (Article 2):
'...stabilization of greenhouse gas concentrations in the atmosphere at a level that would prevent dangerous anthropogenic interference with the climate system.
Such a level should be achieved within a time frame sufficient - to allow ecosystems to adapt naturally to climate change, - to ensure that food production is not threatened and - to enable economic development to proceed in a sustainable manner.'
(technologies, lifestyles, policy instruments)
Emissions pathways(biogeochemical cycles)
Critical Levels (global temperature
/ radiative forcing)
Critical Limits (regional climate changes)
Key Vulnerabilities
(socioeconomic factors)
invers
e c
alc
ula
tion

European Union 2 °C limit:
EU Council Of Ministers 1996:"...the Council believes that global average temperatures should
not exceed 2 degrees Celsius above pre-industrial level and that therefore concentration levels lower than 550 ppm CO2 should guide global limitation and reduction efforts."
"This means that the concentrations of all GHGs should also be stabilised. This is likely to require a reduction of emissions of GHGs other than CO2, in particular CH4 and N2O"
However, widely varying interpretations of implications for emissions!
Why? Java Climate Model may help to investigate...

Stabilisation scenarios in Java Climate Model(Article 2: critical limits => critical levels => emissions pathways)
Inverse calculation to stabilise● CO2 concentration (as IPCC "S"/ WRE
scenarios)
● Radiative Forcing (all-gases, "CO2 equivalent")
● Global Temperature (e.g. to stay below 2C limit)
● (Sea-level -difficult due to inertia in ocean / ice)
JCM core science very similar to IPCC-TAR models, but (unlike TAR SYR) JCM stabilisation scenarios include mitigation of all (21) greenhouse gases and aerosols, scaled w.r.t. SRES baseline.

Stabilisation scenarios in Java Climate Model
CO2 concentration scenario is a Padé polynomial(similar to formula of Enting et al 1994 for IPCC S/WRE)defined by:•2000 concentration c•2000 gradient dc/dt, •2000 second derivative d2c/dt2 (ensures smooth emissions trajectory),•stabn year concentration •stabn year gradient (zero if stabilising concentration)
Also define quadratic curve to continue from stabn year until 2300.
•If stabilising radiative forcing or temperature (or...) iterate to find best concentration and gradient in stabilisation year. •Iterates 1-10 times, depending on magnitude of change (reuse of correction factors so efficient for dragging control).
•Explore interactively by dragging target curve with mouse
•Or systematically calculate probabilistic analysis ...

Systematically exploring uncertainty:81 Carbon cycle variants
3* Land-use-change emissions (Houghton, scaled),
3* CO2 fertilisation of photosynthesis ("beta"),
3* Temperature-soil respiration feedback ("q10"),
3* Ocean mixing rate (eddy diffusivity of Bern-Hilda model)
6 Ratios of emissions of different gasesEmissions of all gases (including CH4, N2O, HFCs, sulphate/carbon aerosol and ozone precursors) reduced by same proportion as CO2 with respect to one of six SRES baselines
note: atmospheric chemistry feedbacks included, but not varied
84 Forcing/Climate Model variants3 * Solar variability radiative forcing
4* Sulphate aerosol radiative forcing
7* GCM parameterisations climate sensitivity, ocean mixing/upwelling, surface fluxes (W-R UDEB model tuned as IPCC TAR appx 9.1)
note: for sea-level rise, should add more uncertainty in ice-melt

Demonstration of JCM

Carbon Cycle Other gases/Aerosols
Climate Model

Relative probability of each set of parameters derived from inverse of "error" (model - data)
Measured global temperatures (CRU + proxies)
Measured CO2 concentration (Mauna Loa + others)
Reject low-probability variants (kept 468 / 6804)
Ensures coherent combinations of parameters, e.g. : More sensitive climate models with higher sulphate forcing High historical landuse emissions with higher fertilisation
factor
Still 2808 curves per plot (including 6 SRES per set)So show 10% cumulative frequency bands (using probabilities)
Probability from fit to historical data

Carbon Cycle Other gases/Aerosols
Climate Model

Shifting the Burden of UncertaintyOn average, all sets of scenarios stabilise at the same
temperature level of 2°C above preindustrial level. But their uncertainty ranges are very different!
A Temperature limit rather than a Concentration limit reduces the uncertainty for Impacts/
Adaptation... (assuming we commit to adjust emissions to stay below the
limit, as the science evolves)
...however this increases the uncertainty regarding emissions Mitigation pathways.
Which is better?

What CO2 level stabilises T<= 2°C ?
note: 90% of cum freq means that 90% of variants weighted by probability fell below this level
note: concentrations derived from IPCC-TAR science are lower than those from SAR, principally due to less sulphate cooling, and slightly higher sensitivity
note: 550ppm "CO2 equivalent" (all gases) would bring us close to 2C. However, to keep the temperature level, total radiative forcing (and hence CO2 equivalent) must decline gradually. This is possible while CO2 remains level, due to declining CH4 and O3 (which have short lifetimes).
(around 2150) By 2050 By 2100Maximum 62090% of cum freq 550 -54%Mean 470 -73%50% of c.f. (median) 450 -77% -57%10% of cum freq 400 -88%Minimum 380
UK policy 550? -60%France policy 450 -75%WBGU Germany 400-450 -89, -81, -63% -83, -75, -45%RIVM Netherlands 450 (550 CO2eq) Many variants -see FAIRBelgium?

Is it 'realistic'? check trends
% change in CO2 emissions per capita per yearx-axis from 1950 to 2050, y-axis from +10% to -10%
Left: Stabilisation at 450ppm Right: SRES A1B

Why should CO2 concentrations/temperature constant?What about forcing (all gases), or sea-level, or ...?Inertia in the climate systemStabilising CO2 alone doesn't stabilise temperature (as below from TARSYR Q6) However stable CO2 may correspond to stable Temperature if other gases with shorter lifetimes are also mitigated to a similar extent.

As natural scientist, am not advocating 2C level, only that derivations from it should be consistent with latest science...
Interpretation of Article 2 needs a global dialogue (Article 6)
Risk/Value Judgements (including equity implications):
Impacts: Key Vulnerabilities? Acceptable level of Change?
Risk: Target Indicator? Acceptable Level of Certainty?(choice of target indicator shifts the burden of uncertainty) Such risk/value decisions cannot be made by scientific experts alone.
There is not yet any global consensus about the safe level:how can modellers help citizens/policymakers to explore this?

Stabilisation is consistent with “sustainable development”, but this is not the only paradigm for future climate policy...
Economists prefer “optimisation” (maximising “welfare”)Suggest that the optimum level is much higher than EU policy -e.g. Climneg papers 600-1000ppm (and continuing to rise).But hidden risk/value judgements very controversial.And not considering uncertainty...
Others consider “pessimisation” (avoiding critical thresholds of change) -e.g. “Tolerable Windows” guardrail approach (ICLIPS)WGBU concludes that we need to aim well below 450ppm.Yet guardrails too rigid - also not considering uncertainty!
Can these all be reconciled?=>Risk analysis framework?

Integrated assessment(for Climneg project)Assess balance of mitigation and impacts/adaptation, etc.Apply to Game Theory(coalition formation etc.)
Economic costs module added to JCM, applying Climneg formulae. (abatement costs, damage costs, time-integral with discount rate, etc.)Abatement costs (RICE / MACGEM) based on comparison to SRES baselines. Need to incorporate MACs for each gas.
Combine with probabalistic approach to convert optimisation to Risk Analysis.But I do not believe simple climate-impact cost functions from economists- much more work needed (need your help!)Also should also consider a set of world-views for impact valuation / equitable aggregation / discounting / risk-aversion etc.JCM could help to make the assumptions transparent.

Temperature and « reasons for concern »
Source: IPCC WG2 (2001)
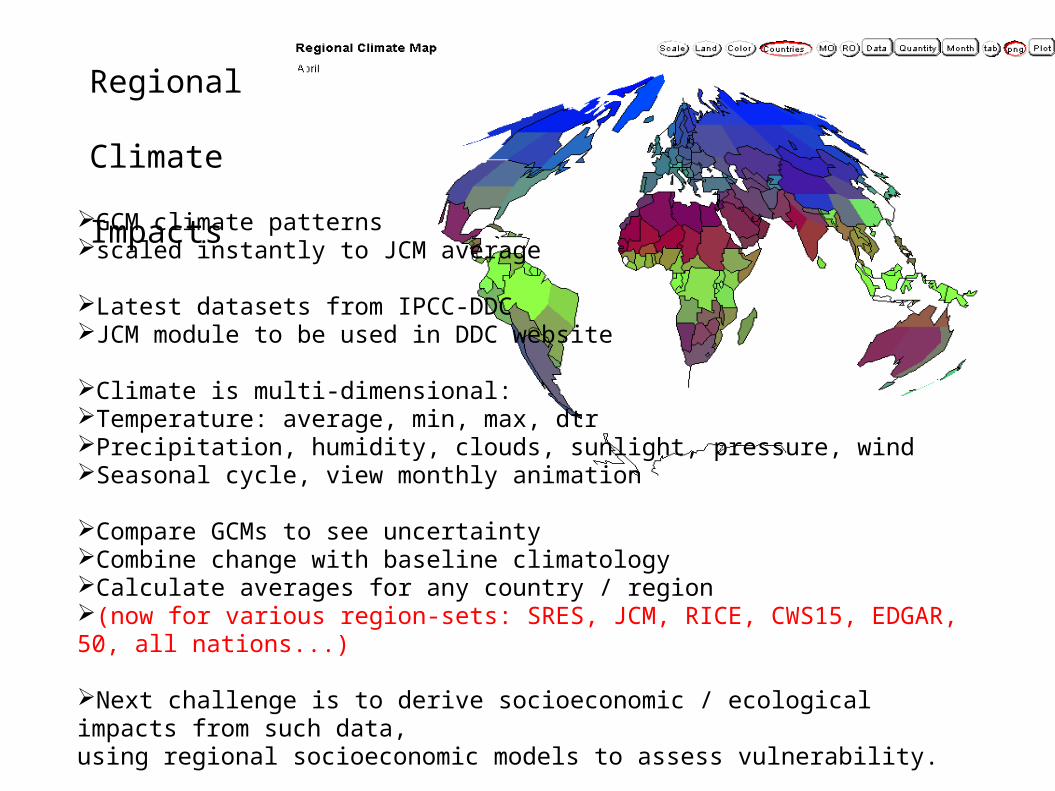
Regional Climate Impacts
➢GCM climate patterns➢scaled instantly to JCM average
➢Latest datasets from IPCC-DDC➢JCM module to be used in DDC website
➢Climate is multi-dimensional:➢Temperature: average, min, max, dtr ➢Precipitation, humidity, clouds, sunlight, pressure, wind➢Seasonal cycle, view monthly animation
➢Compare GCMs to see uncertainty➢Combine change with baseline climatology➢Calculate averages for any country / region➢(now for various region-sets: SRES, JCM, RICE, CWS15, EDGAR, 50, all nations...)
➢Next challenge is to derive socioeconomic / ecological impacts from such data, using regional socioeconomic models to assess vulnerability.

[email protected] [email protected] jcm.chooseclimate.org
Flexible region sets at both ends of the chain, to connect a variety of data-sources and applications.
JCM12, JCM50, RICE, CWS15, SRES4, TGCIA, IMAGE, EDGAR, CDIAC/Houghton, All Nations, subdivisions...
Idea: analyse sub-regions of large diverse countries (eg US states, Russian oblasts, Chinese provinces), to consider potential new coalitions if central govts can't agree policy?

[email protected] [email protected] jcm.chooseclimate.org
Regional Distributions:JCM can also be used to explore...
●Attribution of responsibility●Regional climate change patterns●Abatement and Impact Costs
In combination with stabilisation scenarios,and scientific uncertainties

ClimNeg game-theory of coalition-building / transfersis based essentially on the “victim pays principle”.(the more a region anticipate to suffer from climate change impacts, the more it should pay others not to pollute)So what about the “polluter pays principle”?

Attribution of responsibility for climate change (Brazilian Proposal) Many potential applications,
comparing impacts due to emissions from: ➢countries (pay for adaptation?) ➢projects(CDM) ➢timeslices (inter-generational equity) ➢gases (replace GWP ?)
Calculations considered several ➢gases: CO2 fossil, CO2 landuse, CH4, N2O ➢regions: (4 SRES, 12 JCM, 15CWS, EDGAR...) ➢indicators: concn, forcing, temp, sealevel➢time-slices and future scenarios(now including stabilisation scenarios)➢methods for attributing non-linear processes and Feedbacks
Sensitivity to uncertainties is much less for relative attribution, compared to absolute(maybe similar effect applies to other problems in Climneg? - should test)
JCM contributed to UNFCCC intercomparison (+ workshops Hadley centre 2002, Berlin 2003). Next stage of intercomparison during 2004, report to SBSTA 2005. Process helps to engage developing countries, who often mention historical responsibility.

[email protected] [email protected] jcm.chooseclimate.org
Interpretation of Article 2 needs a global dialogue (Article 6)
Risk/Value Judgements (including equity implications):
Impacts: Key Vulnerabilities? Acceptable level of Change?
Risk: Target Indicator? Acceptable Level of Certainty?
(choice of target indicator shifts the burden of uncertainty)
Such risk/value decisions cannot be made by scientific experts alone.

[email protected] [email protected] jcm.chooseclimate.org
The ultimate “integrated assessment model” remains the global network of human heads.
To reach effective global agreements, we need an iterative global dialogue including citizens / stakeholders.
The corrective feedback process is more important than the initial guess. So let's start this global debate!
But we still need models to provide a quantitative framework for the discussion. JCM was developed to make models more accessible and transparent.

[email protected] [email protected] jcm.chooseclimate.org
(game -theory, game practice...)
Role-play on Article 2 with students Louvain la Neuve, Belgium, Dec 2002, as if COP11,
2005,Presented at COP9 Milano, Dec 2003
60 university students grouped in 17 delegations (Belgium, Denmark, Russia, USA, Australia, Saudi-Arabia, Venezuela, Brazil, Burkina-Faso,
Marroco, Tuvalu, India, Greenpeace, GCC, FAO, WB/IMF, Empêcheurs)
had the task to agree by consensus in a UNFCCC-style process:* a quantitative interpretation of Article 2,
* an equitable formula for funding adaptation.
Delegates used Java Climate Model to explore options / uncertainties.
Can "justify" diverse positions by selecting parameters / indicators !

[email protected] [email protected] jcm.chooseclimate.org
Conclusions of role-playEquity implications were key aspect of discussion
Final compromise between Russia and Tuvalu (after US quit)
•Quantitative interpretation of Article 2: +Temperature rise (<1.9°C 2100-1990) + Sea-level rise (46cm 2100-1990)
Principles for Adaptation funds :+Tax on emissions trading + Percapita emissions & GDP formula + Principles sufficiency/capacity
Such "games" also help us to identify scientific issues, e.g.: Reconciling multi-criteria climate targets (inconsistency maybe realistic in policy compromises), Meaning of CO2 "equivalents" in stabilisation context

[email protected] [email protected] jcm.chooseclimate.org
Future development for global dialogue
Could we combine such tools and experiences to link groups from all corners of the world?
JCM also used for teaching in several countries:Univ Cath de Louvain (BE) Open University (UK),
Univ Bern (CH), Univ Waterloo (CA),...
Such web models might provide a quantative framework for a global dialogue. Model can be shared by saving snapshots of model parameters to pass to others in
asynchronous discussion forum.

[email protected] [email protected] jcm.chooseclimate.org
Experiment with Java Climate Model
Try JCM at jcm.chooseclimate.org
Trying to combine research and outreach
Works in web browser, very efficient/compact
Instantly responding graphics show cause-effect from emissions to impacts,
Based on IPCC-TAR methods / data,
New flexible stabilisation scenarios,
Regional emissions, abatement, costs, responsibility
Regional patterns of climate change
Transparent, open-source code, modular, scriptable,
Interface in 10 languages, 50,000 words documentation
JCM also developed with: DEA-CCAT Copenhagen, UNEP-GRID Arendal, KUP Bern

Demonstration of JCM