Matt J. Keeling, Ottar N. Bjørnstad, Bryan T. Grenfellento.psu.edu/publications/chapter17.pdf ·...
36
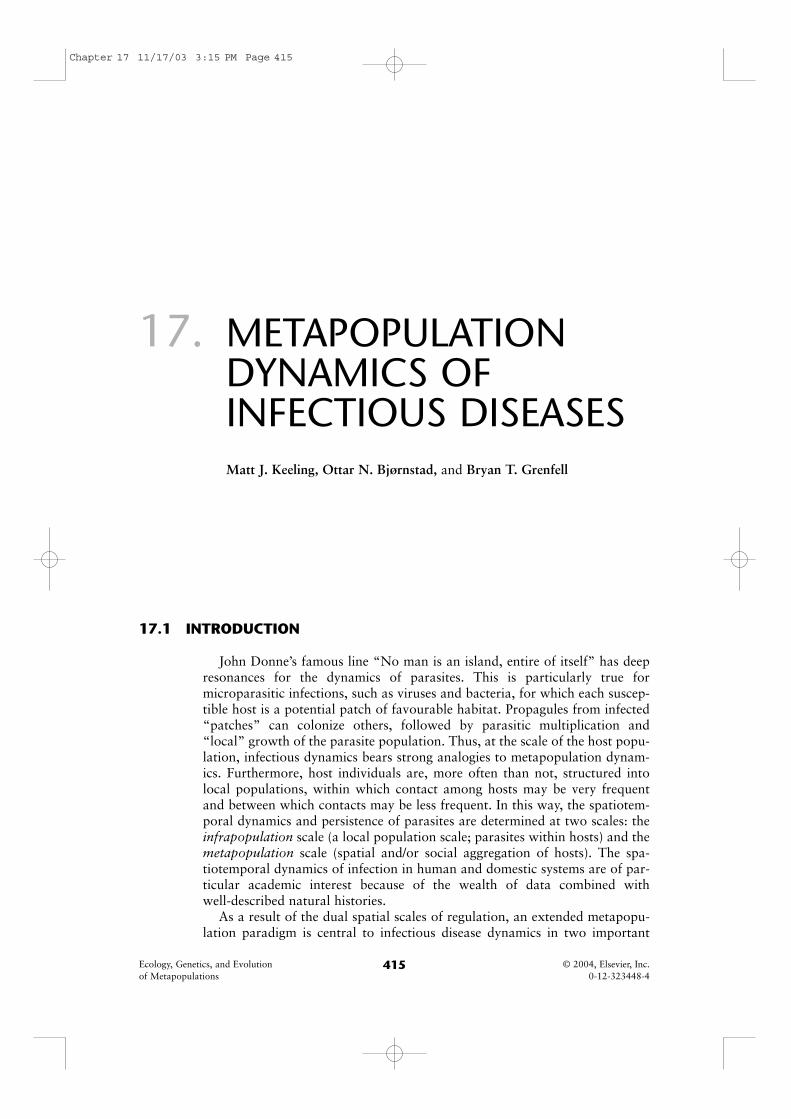
17. METAPOPULATION DYNAMICS OF INFECTIOUS DISEASES Matt J. Keeling, Ottar N. Bjørnstad, and Bryan T. Grenfell 17.1 INTRODUCTION John Donne’s famous line “No man is an island, entire of itself” has deep resonances for the dynamics of parasites. This is particularly true for microparasitic infections, such as viruses and bacteria, for which each suscep- tible host is a potential patch of favourable habitat. Propagules from infected “patches” can colonize others, followed by parasitic multiplication and “local” growth of the parasite population. Thus, at the scale of the host popu- lation, infectious dynamics bears strong analogies to metapopulation dynam- ics. Furthermore, host individuals are, more often than not, structured into local populations, within which contact among hosts may be very frequent and between which contacts may be less frequent. In this way, the spatiotem- poral dynamics and persistence of parasites are determined at two scales: the infrapopulation scale (a local population scale; parasites within hosts) and the metapopulation scale (spatial and/or social aggregation of hosts). The spa- tiotemporal dynamics of infection in human and domestic systems are of par- ticular academic interest because of the wealth of data combined with well-described natural histories. As a result of the dual spatial scales of regulation, an extended metapopu- lation paradigm is central to infectious disease dynamics in two important 415 Ecology, Genetics, and Evolution © 2004, Elsevier, Inc. of Metapopulations 0-12-323448-4 Chapter 17 11/17/03 3:15 PM Page 415
Transcript of Matt J. Keeling, Ottar N. Bjørnstad, Bryan T. Grenfellento.psu.edu/publications/chapter17.pdf ·...
17. METAPOPULATIONDYNAMICS OFINFECTIOUS DISEASESMatt J. Keeling, Ottar N. Bjørnstad, and Bryan T. Grenfell
17.1 INTRODUCTION
John Donne’s famous line “No man is an island, entire of itself” has deepresonances for the dynamics of parasites. This is particularly true formicroparasitic infections, such as viruses and bacteria, for which each suscep-tible host is a potential patch of favourable habitat. Propagules from infected“patches” can colonize others, followed by parasitic multiplication and“local” growth of the parasite population. Thus, at the scale of the host popu-lation, infectious dynamics bears strong analogies to metapopulation dynam-ics. Furthermore, host individuals are, more often than not, structured intolocal populations, within which contact among hosts may be very frequentand between which contacts may be less frequent. In this way, the spatiotem-poral dynamics and persistence of parasites are determined at two scales: theinfrapopulation scale (a local population scale; parasites within hosts) and themetapopulation scale (spatial and/or social aggregation of hosts). The spa-tiotemporal dynamics of infection in human and domestic systems are of par-ticular academic interest because of the wealth of data combined withwell-described natural histories.
As a result of the dual spatial scales of regulation, an extended metapopu-lation paradigm is central to infectious disease dynamics in two important
415Ecology, Genetics, and Evolution © 2004, Elsevier, Inc.of Metapopulations 0-12-323448-4
Chapter 17 11/17/03 3:15 PM Page 415

416 MATT J. KEELING ET AL.
ways. First, the metapopulation approach can help us understand diseasedynamics at the different spatial scales. This topic is the main concern here, weuse extensive data sets and realistic dynamic models to discuss the metapopu-lation dynamics of infectious disease. Second, there are important conceptualinsights about the eradication by vaccination of infections to be gained fromstudies of the persistence of metapopulations (Nee, 1994; Grenfell andHarwood, 1997; Ovaskainen and Grenfell, 2003). This chapter thereforeexplores two main topics: (i) the analogies between the disciplines of ecologyand epidemiology at the metapopulation-level and (ii) how metapopulationtheory at a variety of scales can aid our understanding of epidemiologicaldynamics. We discuss these issues in the face of a set of detailed models andhigh-resolution space–time data of disease incidence.
Metapopulation-like disease dynamics occur whenever the environment, inthis case the population of susceptibles, is sufficiently patchy that isolatedclumps of suitable habitat exist. This is always the case at the microscale; eachhost is an island to be colonized and a resource patch to be depleted. At themacroscale, hosts are usually aggregated in local communities within whichtransmission is relatively frequent and between which infection spreads at alower rate. Our dominant focus is on the metapopulation (macro)scale. To illus-trate the key issues, we first introduce a simple epidemic model and then use thisto illuminate the basic processes in the spatiotemporal dynamics of epidemics.Two distinct modeling scenarios are considered: a fully stochastic metapopula-tion where the individual level processes within each habitat (or community) aremodeled explicitly and a spatially implicit (Levins-type) metapopulation wherehabitats are classified into a limited set of discrete classes. Both formulationshave associated benefits and allow different insights into the dynamic processesin disease spread. We then revisit how metapopulation processes operate at vari-ous spatial scales (individual level, local, and regional epidemics). These result-ant spatiotemporal dynamics are then illustrated through a series of case studies,which explore diseases metapopulation dynamics at the interface of models anddata. We conclude with a section on fruitful areas for future work.
17.2 THE SIR MODEL FOR EPIDEMIC DYNAMICS
We focus here on microparasite infections (mainly viruses and bacteria),where direct reproduction of the pathogen in the host allows us to model dis-ease dynamics by dividing the host population between compartments, classifiedby their infection status (Anderson and May, 1991). In contrast, macroparasitichelminth infections, where parasite burden matters, are much harder to modelspatially (and not considered here), although strong analogies have been foundbetween macroparasite and metapopulation dynamics (Cornell et al., 2000).The most studied microparasite system is the SIR model, where individualsare susceptible (S), infected (I), or recovered (R). This classification holds analo-gies to the “compartmental” Levins metapopulation models in which patchesare classified as either occupied or empty (Chapter 4). As discussed in the nextsection, the “reversibility” of true metapopulations (such that local patchpopulations can become extinct, then reestablished by colonization) is a closermatch to the SIS dynamics (susceptible–infectious–susceptible, such that
Chapter 17 11/17/03 3:15 PM Page 416

17. METAPOPULATION DYNAMICS OF INFECTIOUS DISEASES 417
recovered individuals do not possess immunity) associated with many sexuallytransmitted diseases (Anderson and May, 1991). In the SIR paradigm, suscep-tible individuals can catch the disease from contact with infected individuals,and infected individuals recover at a given rate, after which time they areassumed to be immune to the disease. This leads to the following set of differ-ential equations:
(17.1)
where B is the birth rate, d is the natural death rate, � is the transmission ratebetween infected and susceptible individuals, and g is the recovery rate. Manyimprovements and variations on this underlying framework have been devel-oped successfully to describe the behavior of particular diseases and hosts(Anderson and May, 1991; Grenfell and Dobson, 1995; Hudson et al., 2002).In essence, Eq. (17.1) predicts a stable equilibrium level of susceptibles andinfected, which is reached through a series of damped epidemics.
17.3 THE SPATIAL DIMENSION
Spatial structure and the aggregation of hosts into discrete patches can havedramatic effects on the dynamics of infectious diseases (May and Anderson,1979; Grenfell and Bolker, 1998). We subdivide these effects into four maingroups, which we consider with respect to the dynamics of one large, homo-geneously mixed host population versus the dynamics of several smaller, moreisolated ones.
Isolation and Coupling: A Simple Two-Patch Model
The most obvious aspect of spatial separation is the isolation of one ormore local populations. The degree of isolation is controlled by the couplingbetween patches. In the absence of coupling, the dynamics in each patch areindependent, and as the coupling increases, so does the correlation betweenthem. We generally envisage coupling as the result of the movement of hosts;in such cases it is important to realize that the movement of both susceptiblesand infecteds plays an equal role. We also note that two patches can becoupled directly due to the mixing of individuals in a third patch (e.g., peoplefrom two outlying towns might meet, and transmit infection, at a nearby largetown). As we are concerned primarily with the spread of infection betweenhuman communities, we envisage coupling as the result of short durationcommuter movements. For other host species, coupling could be generated by
N � S � I � R
dRdt
� gI � dR
dIdt
� �SIN
� gI � dI
dSdt
� BN � �SIN
� dS
Chapter 17 11/17/03 3:15 PM Page 417

418 MATT J. KEELING ET AL.
the permanent movement of hosts or simply the movement of pathogensbetween local populations (Keeling et al., 2001).
A key question for understanding the ensuing spatial dynamics is how toaccurately allow for the movement of infection. Consider, first, a metapopula-tion of just two patches (Keeling and Rohani, 2002). In this model, individualscommute from their home population to the other patch, but return rapidly(Sattenspiel and Dietz, 1995). We label individuals by two subscripts such thatSij are the number of susceptibles currently in patch j, whose home is patch i.We also assume that individuals from patch i commute at rate �i and return atrate �i, independent of their infectious state. If we assume frequency-dependenttransmission (de Jong et al., 1995; McCallum et al., 2001), then equations forthe number of susceptibles and infecteds in each patch are given by
(17.2)
where i ≠ j. Here, equations for the recovered class (Rii and Rij) have not beengiven explicitly, as they can be calculated from the fact that S � I � R � N. Ifwe allow the distribution of individuals to equilibrate, then Nii/Nij � �i/�i.Now, summing over all individuals whose home is patch i and assuming thattime spent away from the home patch is relatively short compared to the dis-ease dynamics, we get
(17.3)
where � are the conventional rates of coupling between populations. These aregiven by
(17.4)
where is the ratio of commuting to return rates and as such can be cal-culated from the expected amount of time an individual from patch i spendsaway from home . In the much simplified case where the populationsizes and movement patterns are equal in both patches,
1� �i
1 � �i 2�i �
�iti
�ij � �ji �(1 � �i)�j
(1 � �i)Ni � �jNj�
�i(1 � �j)
�iNi � (1 � �j)Nj
�ii �(1 � �i)2
(1 � �i)Ni � �jNj�
�i2
�iNi � (1 � �j)Nj
dIi
dt� �Si C�iiIi � �ijIj D � gIi � dIi
dSi
dt� bNi � �Si C�iiIi � �ijIj D � dSi
dIij
dt� �Sij
Iij � Ijj
Nij � Njj � gIij � dIij � �iIij � �iIii
dSij
dt� bNij � �Sij
Iij � Ijj
Nij � Njj � dSij � �iSij � �iSii
dIii
dt� �Sii
Iii � Iji
Nii � Nji � gIii � dIii � �iIij � �iIii
dSii
dt� bNii � �Sii
Iii � Iji
Nii � Nji � dSii � �iSij � �iSii
Chapter 17 11/17/03 3:15 PM Page 418

17. METAPOPULATION DYNAMICS OF INFECTIOUS DISEASES 419
(17.5)
The factor of two in �ij originates because coupling can come from either themovement of susceptibles or the movement of infecteds. Quadratic termsoccur due to two individuals with the same home patch meeting in the awaypatch.
If we assume global coupling, such that commuter movement occursequally to all other local populations irrespective of distance between them,then the n patch generalization is
(17.6)
where is again the ratio of the rate of commuting to a given patch to the rateof return. The proportion of time spent away from the home patch is now
These models [Eqs. (17.3) and (17.6)] illustrate that even the complex mech-anistic movement of commuters can generally be expressed as a distributed forceof infection from each infected individual across multiple local populations.Thus the complex patterns of human movements can be subsumed into a set ofparameters �, which specify the relative strengths of within-patch to between-patch transmission. These equations (17.3 and 17.6) are identical to thosederived when the movement between local populations is permanent immigra-tion rather than short-duration commuter travel (Kot et al., 1996; Smith et al.,2002) and to those formulated when the transmission of infection between dif-ferent local populations is via wind-borne spread (Bolker, 1999; Park et al.,2001). Therefore, the simple and intuitive method of coupling local populationsis applicable to a wide variety of diseases and interaction scenarios.
The aforementioned framework for studying the dynamics of a disease in aspatially structured population is founded on the premise of deterministicinteractions and very rapid movement of commuters back to their home patch.Now we consider how this translates into a more realistic stochastic frame-work, where the population is individual based and events are assumed tooccur at random; this is often termed demographic stochasticity. In such aframework, the coupled model [Eq. (17.3)], which has far fewer equationsthan the full mechanistic model [Eq. (17.2)], is a reliable approximation if themovement rate of individuals between the populations is rapid. However, asthe movement rate slows (e.g., if commuters generally spend the entire day orlonger away from home), the individual nature of the population plays an evergreater role. If just one individual is infected, then the level of coupling will beinfluenced greatly by whether that individual commutes. Figure 17.1 showsthe distribution of cases caused by a single infectious case in their nonhomepatch. Clearly the number of cases produced is highly dependent on whether
n�1 � n�
.
� � 2�(1 � �).
dIi
dt� �Si C(1 � n�)Ii � ��n
j�1Ij D >N � gIi � dIi
dSi
dt� bNi � �Si C(1 � n�)Ii � ��n
j�1Ij D >N � dSi
�ii ��2 � (1 � �)2
N �ij � 2�(1 � �)
Chapter 17 11/17/03 3:15 PM Page 419

420 MATT J. KEELING ET AL.
the infectious person commutes, although even when they remain in theirhome patch the disease can still spread due to the movement of susceptibles.
In stochastic metapopulation models, therefore, when the level of infection islow and the commuter time is of the same order as the infectious period, we mustbe very cautious in our use of approximations to the true mechanistic dynamics.The occasional rare event, when the infected individual commutes, can have largerepercussions and leads to a far wider range of outcomes than would be expectedfrom a stochastic version of the simple coupling model [Eq. (17.3)].
Stochastic and Seasonal Forcing
The main manifestation of random fluctuations explored in epidemic the-ory is the impact of demographic stochasticity. As for conventional metapopu-lations, a major impact of demographic stochasticity is on the extinction rate,here of epidemics in small populations (see next section). However, due to theinherent oscillatory nature of epidemics, stochastic forcing of epidemics cangive rise to regular or irregular cycles. This issue has strong parallels with therecurrent debate in ecology on the relative impact of noise and deterministicforces on dynamics (e.g., Bjørnstad and Grenfell, 2001). In epidemiology, theinteraction between deterministic nonlinearity and forcing has been most stud-ied in terms of the perturbing forces, which may maintain strong recurring epi-demics of measles in the prevaccination era; these epidemics are predicted todampen to an equilibrium by simple deterministic nonseasonal models (Mayand Anderson, 1991). The seminal work here is by Bartlett (1956, 1957), whoshowed that both stochastic forcing or the marked seasonality in transmissiondue to the aggregation of children in schools could excite the measles oscilla-tor into sustained epidemics. In the case of childhood diseases, seasonalityappears to play a major role in the maintenance of measles cycles (Schenzle,1984; Bjørnstad et al., 2002; Grenfell et al., 2002).
0 5 10 15 200
0.05
0.1
0.15
0.2
0.25
Number of cases in nonhome patch
Pro
babl
ity
Does not commuteCommutes onceCommutes twice
Fig. 17.1 Probability of a single infectious individual causing different numbers of second-ary cases in their nonhome patch. If the infectious individual commutes, there is a dramatic shiftin the expected number of cases. In this scenario, the infectious period is exactly 3 days, com-muters always spend a full day away from home, and the basic reproduction ratio R0 � 30. Thesusceptible population is considered to be very large.
Chapter 17 11/17/03 3:15 PM Page 420

17. METAPOPULATION DYNAMICS OF INFECTIOUS DISEASES 421
In general, most observations and stochastic model results agree that theaverage number of cases in a population scales linearly with population size
. The variance in the number of cases, however, can be best describedby a power law, with an exponent between 1 and 2, (Keeling and Grenfell, 1999; Keeling, 2000a). This underlines how large popu-lations have relatively lower standard deviations in the number of cases com-pared to the mean and thus behave more like deterministicsystems. These subtleties lead to nontrivial consequences of spatial subdivisionof hosts on epidemic dynamics.
Work on whooping cough illustrates the dramatic influence of demographicstochasticity on epidemic dynamics due to the intricate interaction betweenstochasticity and nonlinearity (Rohani et al., 2000; Keeling et al., 2001;Rohani et al., 2002; see also Rand and Wilson, 1994). As predicted by stand-ard theory, demographic stochasticity becomes increasingly important in smallpopulations because one individual in smaller populations is a comparativelylarger fraction of the entire population and therefore each stochastic event rep-resents a relative larger change to the susceptible and infected proportions —one infectious individual in a small village is likely to infect a greaterproportion of the population than one infectious individual in a large city.Thus we can illustrate the complex roles of noise on epidemics by consideringthe stochastic dynamics of whooping cough across a range of host communitysizes (Rohani et al., 2000). Small model populations are seen to display 4-yrcycles driven by stochastic resonance at, or close to, their natural frequency,whereas large populations possess more annual dynamics constrained by thedeterministic attractor (Fig. 17.2).
We can extend the concept of power-law variances to a metapopulation withn local populations. If the level of coupling between the populations is weak,such that the dynamics are almost independent, then the average number ofcases across all local populations is the same as for one large population. Forindependent populations, the variance of the sum is the sum of the variances;hence, an increase in the number of local populations causes a linear increasein the total variance. However, a similar increase in the population size of onelarge patch causes a faster than linear rise due to the scaling of the power law.Naively, then, one could be tempted to conjecture that by breaking the habitatinto multiple (independent) patches, one would effect a decrease in the relativevariability observed in the aggregate dynamics. This is analogous to the statis-tical averaging discussed as the “portfolio effect” in community ecology(Tilman, 1999). However, in practice, the significant levels of coupling and thecomplex interactions between nonlinear transmission dynamics and demo-graphic stochasticity mean that no such general assertions are possible. Wilsonand Hassell (1997) have shown that such complexities also take place in otherhost–enemy systems.
Extinctions
One effect of increased stochasticity in small populations is an increasedtendency for chance extinctions. This behavior is highlighted in Bartlett’s clas-sical work on measles, where the number of fadeouts (or localized extinctions)decreases exponentially with population size (Bartlett, 1957). Bartlett (1957,
[StD(I)>I � N��1]
[var(I) � N2�, 12 � 1](I � N)
Chapter 17 11/17/03 3:15 PM Page 421

Fig. 17.2 The dynamics of a stochastic SEIR model (which contains a noninfectious incuba-tion or exposed class) for whooping cough for three population sizes (graph A is with a popu-lation size of 100,000, graph B is 1 million, and graph C is 10 million). At a population size of10 million, the dynamics are very close to the deterministic attractor, whereas for populationsof 100,000, stochastic forces dominate and 3- to 4-yr epidemic cycles are observed.
0 5 10 15 200
0.5
1
1.5× 10⁻³
Time (years)
Pro
port
ion
infe
ctio
us
A
0 5 10 15 200
0.5
1
1.5 × 10⁻³
Time (years)
Pro
port
ion
infe
ctio
us
B
0 5 10 15 200
1
2
3
4
5
6
7× 10⁻³
Time (years)
Pro
port
ion
infe
ctio
us
C
Chapter 17 11/17/03 3:15 PM Page 422

17. METAPOPULATION DYNAMICS OF INFECTIOUS DISEASES 423
1960) identified a critical community size (CCS) for disease persistence, suchthat above this population size the disease is endemic and is rarely subject tostochastic extinctions. Interestingly, this emergent critical community size isremarkably robust, and similar values of around 300,000 for measles occurfor communities in England, the United States, and isolated islands (Bartlett,1957, 1960; Black, 1966). The CCS is arguably the best empirically docu-mented local extinction threshold in metapopulation biology (Grenfell andHarwood, 1997; Keeling and Grenfell, 1997).
When considering the regional persistence of an infectious disease acrossseveral small populations versus one large population, there are conflicting ele-ments. Small isolated populations exhibit more frequent local extinctions thanlarge populations. However, in a metapopulation consisting of many small popu-lations, extinction (or eradication) at national or regional scales requires theconcerted collapse of all local epidemics; in contrast, regional eradication,where there is just one large population, only requires a single extinction event.In classic metapopulation models, coupling enhances persistence through localrecolonization, but erodes persistence through synchronizing the local dynam-ics (Chapter 4). For epidemic metapopulations, the relationship betweenregional persistence and coupling is complex and depends critically on the dis-ease parameters and the demography and movement of the host population.Thus, it is far from obvious whether one large patch or several smaller patcheshave the greater extinction rate.
The effects of coupling between local populations on global disease eradi-cation have received much attention due to the interesting trade-offs that arise(Keeling, 2000b). If the coupling is very small, then the local populations actindependently and there is little or no chance of the disease being reintroducedfrom another local population; there is no rescue effect. Thus using the lan-guage associated with Levins metapopulations, the local populations have alarge extinction rate and a very low probability of colonization. If the couplingis very large, then the local populations act like one large homogeneouslymixed population and thus stochastic effects may lead the entire metapopula-tion to extinction. In disease models, heterogeneity plays an important role aslow levels of infection allow the susceptible population to recover, which inturns promotes future cases. Between these two extremes persistence of thedisease is maximized: there are sufficient amounts of coupling to allow recol-onization and sufficient amounts of variability between patches for themetapopulation to absorb stochastic fluctuations.
The global eradication (extinction) of disease metapopulations is obviouslya key aim in public health terms. This is generally investigated using com-puter simulations, as analytical techniques have difficulty dealing with thecomplexities of spatial heterogeneities and the stochastic dynamics that per-meate the problem. Figure 17.3 illustrates the aforementioned principlesusing extinction probabilities for a spatial SIR epidemic model . When thecoupling is very low such that recolonization is rare, local extinctions (at thelocal population level, Fig. 17.3A) are common, as are global extinctions (atthe metapopulation level, Fig. 17.3B). When the coupling is high, local popu-lations rarely go extinct. However, because of the synchrony induced by cou-pling, rescue effects are less effective as all epidemic declines are aligned andtherefore prone to simultaneous local extinctions. Hence the global extinction
Chapter 17 11/17/03 3:15 PM Page 423

424 MATT J. KEELING ET AL.
probability is again enhanced. There is a clear intermediate minimum forwhich the disease persistence is the greatest. This compares with the dimin-ished persistence of classic metapopulations when embedded in a correlatedlandscape (Harrison and Quinn, 1989). It is still an open problem to relatedisease characteristics, host demography, and coupling to the extinction riskat the metapopulation scale for a wide range of microparasites (Keeling,2000b). Changes in coupling between populations due to social changes andease of long-distance travel have important implications for disease extinctionand eradication — this is a major question for the theoretical epidemiology ofthe future.
A0
00.1
0.01
0.02
0.03
0.04
0.05
0.06
0.07
0.08
0.09
0.2 0.3 0.4 0.5 0.6 0.7 0.8 0.9 1
Coupling σ
Pro
babi
lity
of L
ocal
Ext
inct
ion
0 0.1 0.2 0.3 0.4 0.5 0.6 0.7 0.8 0.9 10
0.5
1
1.5
2
2.5
3
3.5
4
4.5
5 × 10⁻⁶
Coupling σ
Pro
babi
lity
of G
loba
l Ext
inct
ion
B
Fig. 17.3 For a stochastic SIR model with 20 coupled local populations, graph A gives theprobability of local population level extinctions, whereas graph B is the probability of a globalmetapopulation level extinction across all 20 local populations. (Infectious period is 13 days,local population size is 30,000, basic reproductive ratio R0 � 14, birth rate is 5.5 � 10�5 perperson per day).
Chapter 17 11/17/03 3:15 PM Page 424

17. METAPOPULATION DYNAMICS OF INFECTIOUS DISEASES 425
Dynamic Heterogeneity
In this context, “heterogeneity” is taken to mean the total degree of variation(or asynchrony) between epidemic dynamics at different locations. This includesvariation due to asynchronous timing of epidemics at different locations, as wellas heterogeneities in local dynamics due to differences in local host demography.Heterogeneities are thus a fundamental difference between spatial and nonspa-tial processes. As outlined earlier, heterogeneity is promoted by stochasticity butis reduced by coupling. The level of heterogeneity further depends on the rela-tive and absolute differences in host community size, movement, and demogra-phy, as well as subtle characteristics of the transmission dynamics. To betterunderstand the causes and consequences of such heterogeneity, we contrast arange of metapopulation models. The simplest metapopulation model assumesidentical demography within each local population, deterministic dynamics andglobal coupling, so that the interaction is the same between all patches. Underthese simplifying assumptions, and even for very low levels of coupling, we gen-erally observe phase locking where the interaction between patches leads tocomplete synchronization of each local epidemic and zero heterogeneity.
When the internal dynamics are stochastic, the spatial dynamics are morecomplex. Coupling still acts to synchronize the dynamics by homogenizing thelevel of infection in each local population. In contrast, stochasticity acts to sep-arate the dynamics as different populations experience different random events.Figure 17.4 shows the correlation in disease incidence between two stochasticlocal populations for various levels of coupling. When the coupling is low, thetwo populations are unsynchronized and the correlation is zero; however, as thecoupling increases, the stochastic oscillations are increasingly correlated. Asseen in Fig. 17.4, the coupling has a greater effect for larger populations (resultson populations of more than 10,000 did not differ significantly), which is pri-marily due to the diminished effect of stochasticity (Grenfell et al., 2002).
10–5 10–4 10–3 10–2 10–1 100
0
0.2
0.4
0.6
0.8
1
Coupling between subpopulations, σ
Cor
rela
tion
betw
een
subp
opul
atio
ns
Population size1 thousand10 thousand
Fig. 17.4 Correlation between disease levels in two stochastic SEIR local populations. Twodifferent population sizes are simulations; 1000 individuals and 10,000 individuals. Fitted curvesare of the form �/(� � �), which is based on theoretical predictions (Keeling and Rohani, 2002).Disease parameters match those of whooping cough, although seasonal forcing is ignored.
Chapter 17 11/17/03 3:15 PM Page 425
426 MATT J. KEELING ET AL.
In the presence of seasonal forcing, space–time dynamics are more involved.In general, unforced stochastic epidemics can peak at any time of the year,whereas seasonal forcing usually constrains the epidemic cycle. Therefore, ifseasonality tends to force the epidemics into a rigid annual cycle, populationsappear partially or fully synchronized without the need for strong coupling —this echoes the operation of the Moran effect in ecology (Moran, 1953;Grenfell et al., 1998). If the epidemic period is multiannual, however, epi-demics can become locked out of phase (Henson et al., 1998), as was the casefor the 2-yr epidemics of measles in Norwich and London during the 1950s(Grenfell et al., 2001), for which high levels of coupling may be required toregain synchrony. In this latter case, greater levels of stochasticity and weakerattractiveness of the cyclic attractor can also help synchronization as there isa greater chance that a population will switch phases (as indeed happened forthe Norwich measles epidemics during the 1960s).
Two other factors influence the synchrony and hence the level of hetero-geneity. The first is the presence of inherent differences between the localpopulations, such as different host reproductive rates. In general, such het-erogeneities will act to decorrelate the dynamics, as different populationswill obey different underlying models. This was the case for the measles epi-demics in Liverpool and Manchester during the prevaccination era duringwhich the higher birth rates in Liverpool led to annual epidemics(Finkenstädt et al., 1998; Grenfell et al., 2002). Heterogeneities in the size oflocal host populations may have contrasting effects. The presence of onelarge population may act to synchronize the behavior of many surroundingsmall populations; in such a scenario of mainland–island epidemic metapopu-lation, coupling to the large population is a main synchronizing force acrossthe whole metapopulation (Grenfell et al., 2001; see also Fig. 17.10). Local,rather than global, coupling may furthermore lead to epidemic travelingwaves, although strong seasonal forcing can again counteract this. Such epi-demic waves are a common feature of many spatially explicit models of nat-ural–enemy interactions (rabies, bubonic plague, parasitoid–host systems)and have been confirmed in both ecological and epidemiological systems(Nobel, 1974; Grenfell et al., 2001; Ranta et al., 1997; Smith et al., 2002;Bjørnstad et al., 2002).
The presence and absence of spatial synchrony can play important roles inthe dynamics and persistence of disease. As discussed earlier, heterogeneity canvastly increase the long-term persistence of a disease through local recolonisa-tion and repeated rescue events. This effect is heightened if there are demo-graphic or size differences between the populations. Heterogeneities at asmaller scale can also alter the observed aggregate dynamics. Case reports areoften aggregated at the community or regional level; however, such data maybe composed of multiple smaller epidemic within wards or population cliques.As these subepidemics are likely to be somewhat out of phase, the aggregatepicture is of a slower, longer duration epidemic. Figure 17.5 shows a simpleexample of this, while each localized epidemic (gray) is of short duration, theaggregate (black) is far longer with a much diminished epidemic peak.
Throughout the examples that follow, we refer continually to the afore-mentioned four basic elements of spatially structured disease dynamics:isolation, stochasticity, extinction, and heterogeneity. We discuss how
Chapter 17 11/17/03 3:15 PM Page 426

17. METAPOPULATION DYNAMICS OF INFECTIOUS DISEASES 427
metapopulation models (both full stochastic metapopulations and the simplerLevins metapopulations) can be used to represent additional spatial structureand the insights that can be gained from such idealized models. We begin bystudying the implications of spatial structure at the range of scales, startingwith the individual and working up to the community or even country level.The general ideas are illustrated in subsequent case studies.
17.4 DISEASE METAPOPULATIONS AT DIFFERENT SCALES
Individual Level
The standard SIR equations can be explored by considering each individualhost as a patch using a modified form of the metapopulation formulation. Themechanistic approach would model the interaction of the disease and thehost’s immune system, leading to models comparable to those used in thestudy of macroparasites, which classify hosts in terms of their burden of para-sites (Anderson and May, 1991). However, the more classical models wherehosts are described as unoccupied but suitable habitat (susceptible), occupied(infected), or unoccupied but exhausted habitat (recovered) have a muchcloser analogy to standard metapopulation models for successional habitats.From this perspective, birth and deaths correspond to the creation anddestruction of habitat. Strictly speaking, SIR-type dynamics cannot corres-pond to “true” Levins metapopulation dynamics at the individual levelbecause recovered patches cannot regain infection. However, most sexuallytransmitted diseases exhibit SIS dynamics; that is, once an infected individualrecovers, it is once again susceptible to infection. In such cases there is a directcorrespondence between the standard Levins model and the SIS equations(Ovaskainen and Grenfell, 2003).
0 20 40 60 80 1000
0.5
1
1.5
2
2.5
3
3.5
4
× 10–3
Time (days)
Pro
port
ion
infe
ctio
us
Fig. 17.5 The dynamics of 20 coupled SIR populations (gray) and the aggregate epidemic(black). (Population size is 10,000, R0 � 10, infectious period is 1 day, coupling � � 0.0025).
Chapter 17 11/17/03 3:15 PM Page 427

428 MATT J. KEELING ET AL.
The Levins metapopulation has an extensively developed theoreticalarmoury than can be applied to the description and understanding of diseasedynamics (Chapter 4). Sexually transmitted diseases, which are characterizedby a low transmission rate and long infectious period, can be thought of aspoor colonizers, but a persistent species with low local extinction rates. In con-trast, childhood diseases, which are short lived and transmitted rapidly, can beconceptualized as good colonizers that exploit the local resource rapidly, driv-ing themselves extinct. This concept may be extended fruitfully to consider thecompetition between cross-resistant strains of disease (Gupta et al., 1998), inwhich case low transmission rates (poor colonizing ability) can be offset bygood competitive ability within a patch.
The compartmental classification of “habitat” needs not necessarily oper-ate at the level of the individual. Work on the 2001 foot-and-mouth epidemicin Great Britain considers each farm an epidemic unit (“patch”) to be classi-fied as susceptible, exposed, infectious, or removed (Keeling et al., 2001;Ferguson et al., 2001). Patch “removal” was in this case through massiveculling of all potential host animals on a farm. In modeling the outbreak, thewithin-farm epidemic was ignored in favor of this Levins-type classification.Despite this great simplification, these models predicted the course of the epi-demic with great accuracy at the regional level, justifying the approximation.
Within-Community Metapopulations
Many communities, especially large ones, can be subdivided into variousweakly interacting components. This subdivision may take place along social,age, or simply spatial boundaries, but inevitably there are many factors thatprevent the random mixing of the population and therefore break the assump-tions underlying standard models. This necessitates the use of metapopulation-type equations to model the dynamics of these partially separated components.
Regional Metapopulations
The epidemic dynamics at regional or country level begs the use ofmetapopulation concepts. Here each local population represents a community,and hence there is a one-to-one correspondence between the scale at which themodel operates and the available data. Using regional dynamics holds twomain challenges: understanding the detailed consequences of demographic het-erogeneities between the communities and analyzing the epidemic couplingbetween communities on real landscapes. The scientific development of thelatter issue mimics the succession from the naive to more realistic models ofmetapopulation theory (see Chapters 4, 5, 20, and 22). The traditional modelsof identical local populations, with low levels of global coupling, have givenway to models with distance-based coupling rates. Such models are slowlybeing replaced with models embracing heterogeneous patch sizes (with obvi-ous parallels to the current generation of incidence function models and sto-chastic patch occupancy models as described throughout this book). However,for a complete understanding of epidemic metapopulations, it is becomingincreasingly clear that a deeper knowledge of the complex geometries of the“transportation networks” for the infections is required (Cliff and Haggett,
Chapter 17 11/17/03 3:15 PM Page 428

17. METAPOPULATION DYNAMICS OF INFECTIOUS DISEASES 429
1988). This is likely to provide an exciting area for future research with greattheoretical, empirical, and statistical challenges.
17.5 CASE STUDIES
Prevaccination Measles in England and Wales
Of all infectious diseases, the dynamics of childhood microparasites, suchas measles and whooping cough, are arguably among the best understood withrespect to both local and regional dynamics. In particular, the rich data baseand the comparatively simple natural history of measles have made this theprototypical system in the study of spatiotemporal dynamics of infectious dis-ease (Anderson and May, 1991; Bartlett, 1957; Cliff et al., 1993; Grenfell andHarwood, 1997; Keeling and Grenfell, 1997; Grenfell et al., 2001, 2002;Keeling et al., 2001; Bjørnstad et al., 2002). Measles, along with other child-hood infections, was made a notifiable disease in the United Kingdom in 1944.This resulted in the collection of weekly reports in 1400 communities inEngland and Wales through to the present. As such, this is likely to representthe longest and most detailed record of any epidemic metapopulation. Notsurprisingly, these data have been studied extensively from epidemiological,mathematical modeling, and time-series analysis perspectives. Due to its veryhigh basic reproductive ratio, R0 � 17, most children were infected withmeasles (before the onset of mass vaccination campaigns in the late 1960s)with an average age of infection around 4–5 yr. Before mass vaccination wasintroduced in the United Kingdom, measles displayed predominantly biennialdynamics, with a major epidemic in odd years (Fig. 17.6A) (for further detailssee Bjørnstad et al., 2002; Grenfell et al., 2002).
Demographic stochasticity plays an important role in the dynamics ofmeasles in small communities. This arises from the individual nature of popu-lations (the fact that there must be whole numbers of cases) and the proba-bilistic nature of events, such that transmission of infection in particular occursby chance. Stochasticity has two basic effects on the patterns of disease behav-ior: it can push trajectories away from the deterministic attractor such thattransient dynamics play a more major role and it can lead to chance extinctionsdue to the random failure of chains of transmission (Figs. 17.6B and 17.6C).The role of patch size (host population size) on epidemic extinction rates isillustrated wonderfully in the public records. Extinction rates appear to decayexponentially with host population size so that above the critical communitysize of around 300,000 hosts, extinctions are rare (Bartlett, 1957). This patternof size-based extinctions and recolonizations warrants interpretation from themetapopulation point of view.
Childhood diseases, such as measles or whooping cough, are spread pre-dominantly by school children mixing within the primary school environ-ment. In this respect, the host populations are generally subdivided intoschool catchment areas. Considering an average primary school has an intakeof around 150 children in each year, then each school serves a population ofaround 10,000; this determines our basic unit of subdivision. A Levins-typemetapopulation model (global dispersal, no local dynamics, etc.), which splits
Chapter 17 11/17/03 3:15 PM Page 429

Fig. 17.6 Dynamics of measles in England and Wales. (A) Reported cases from 1944 to 1999showing levels of vaccination. (B and C) Average rate of extinction and the proportion of timewith recorded cases for measles in 60 towns and cities in England and Wales. Data taken from1944 to 1968 before mass vaccination was begun. There are clear relationships with populationsize, such that large populations rarely suffer a stochastic extinction.
1950 1960 1970 1980 19900
2
4
6
8
10
12
14
Rep
orte
d C
ases
in E
ngla
nd a
nd W
ales
(th
ousa
nds)
Vaccination 60%
90%
A
104 105 1060
0.2
0.4
Population Size
Ext
inct
ion
rate
per
wee
k
B
104 105 106
0.5
1
Population Size
Pro
port
ion
of ti
me
infe
cted
CC
Chapter 17 11/17/03 3:15 PM Page 430

17. METAPOPULATION DYNAMICS OF INFECTIOUS DISEASES 431
each community into school catchment areas of 10,000 people, motivatesthe following model for the proportion of “diseased” local populations (D)in the city:
(17.7)
where e is the extinction rate, c is the colonization rate from other catchmentareas (local populations) within the city, and i is the rate at which externalimports of infection arrive in a local population. This corresponds to an eco-logical model with migration both from a permanent mainland populationand among local populations. If a metapopulation is composed of N such localpopulations, then the probability Pn that n catchment areas are infected isgiven by
(17.8)
with the equilibrium solution,
(17.9)
This provides easy calculation of the long-term distribution of disease withinthe metapopulation, the associated extinction rates (� eP1), and the propor-tion of time the disease should be present (� 1 � P0). We may compare thesetheoretical predictions with data on measles incidence. Figure 17.7 shows theresultant comparison as the total population size and hence the number oflocal populations increase. It thus appears that Levins-type local patch dynam-ics can reproduce the pattern in data.
The Levins approach, which completely ignores the local epidemic dynam-ics, works surprisingly well for predicting the presence or absence of the dis-ease across a range of population sizes. However, it breaks down if we wishto predict the level of infection within the population. This is for three rea-sons. First the local dynamics of different cities are highly correlated, suchthat the level of infection is an increasing function of the colonization rate,which in turn is proportional to number of occupied patches (Fig. 17.8).Second, in the absence of infection, the level of susceptibles increases; anyensuing epidemic is therefore critically dependent on the local number of sus-ceptibles, which in turn is dependent on the time since the last epidemic. Thisinduces a level of memory to the local dynamics that breaks with the under-lying Markovian assumption of the Levins model. Finally, the distribution ofinfection (Fig. 17.8) does not conform to the Levins-type metapopulationideal, which assumes that local prevalence should be bimodal and dominatedby a zero and a nonzero equilibrium level. For a detailed understanding of thepopulation dynamics, we need to consider a metapopulation with detailedstochastic dynamics within each patch (Swinton et al., 1998).
Pn�1 �(i � cn)(N � n)
enPn such that a
N
n�0Pn � 1
�Cen � cn(N � n) � i(N � n) DPn
dPn
dt� enPn�1 � c(n � 1)(N � 1 � n)Pn�1 � i(N � 1 � n)Pn�1
dDdt
� �eD � cD(1 � D) � i(1 � D)
Chapter 17 11/17/03 3:15 PM Page 431

432 MATT J. KEELING ET AL.
We explore the breakdown of the Levins-type metapopulation modelthrough a comparison with the full stochastic analogues across a variety of sce-narios. A range of single species models, with a variety of forms of densitydependence, have been explored elsewhere (Keeling, 2000b). These conform toLevins-type metapopulation behavior when (a) the distribution of populationsizes falls into two distinct classes, extinct and close to carrying capacity, and
104 105 1060
0.2
0.4
Population Size
Ext
inct
ion
rate
per
wee
k
A
0.5
1
Population Size
Pro
port
ion
of ti
me
infe
cted
104 105 106B
Fig. 17.7 Rate of extinction (A) and the proportion of time with infection (B) from ametapopulation model with local populations of 10,000 individuals. The extinction rate of eachlocal population is e � 0.35, the colonization rate is c � 0.01, and the rate of external importsis taken as i � 0.15/ . This local population level of imports means that the metapopula-tion level of imports scales with the square root of population size, as was conjectured originallyby Bartlett (1957) and supported by measles report data from England and Wales. All timescalesare measured in weeks to correspond to the aggregation of case reports. Theoretical results(line) compare well to measles data from England and Wales (dots).
2(N)
Chapter 17 11/17/03 3:15 PM Page 432

17. METAPOPULATION DYNAMICS OF INFECTIOUS DISEASES 433
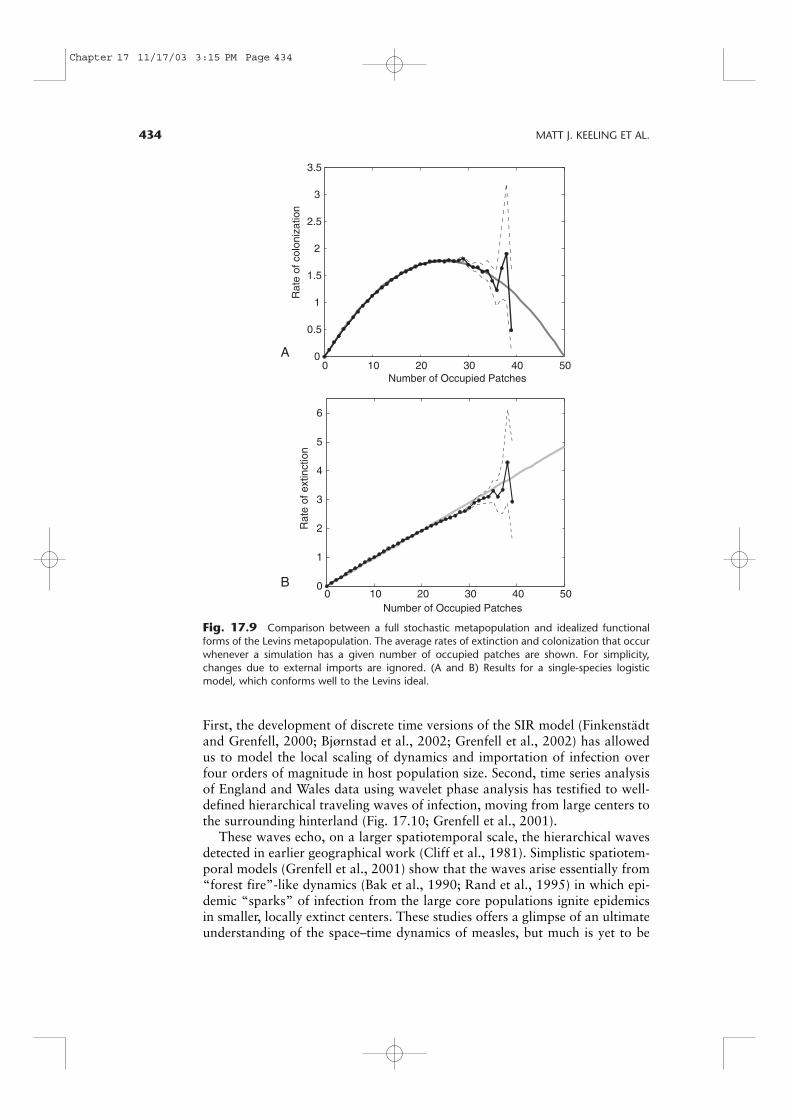
(b) the carrying capacity and extinction rate are not significantly affected by thenumber of extinct patches. For such single-species systems the Levins frame-work is the ideal tool for describing the metapopulation dynamics (Figs. 17.9Aand 17.9B). However, for disease models (and most likely many otherenemy–host interactions), a different pattern of regional behavior arises due tothe synchronization that occurs as an integral part of the space–time dynamics(Chapter 4). In particular, this synchrony of epidemics across the metapopula-tion will bias the extinction and colonization rates relative to the Levinsassumption. Extinctions are, hence, far less common and colonizations morecommon than expected when the majority of patches are infected (Figs. 17.9Cand 17.9D). In general, this leads to two distinct forms of global behavior: per-sistent endemic infections or irregular short-duration epidemics. Both of thesestates will be stable in the medium to long term. Which type of behavior isobserved is critically dependent on the initial conditions.
Spatial coupling in epidemic metapopulations consisting of a geographicmosaic of cities and villages (May and Anderson, 1991, Grenfell and Bolker,1998) has represented a thorny scientific question for more than half a cen-tury. No simple answer has as yet been found. As ever, Bartlett (1957), in hisstudy of the scaling of epidemiological coupling, has been seminal in prompt-ing detailed work in both spatial geography and epidemiology. Fifty years,hence, the challenge of understanding epidemic coupling still stands. Progressis likely to lie in combining models for the nonlinear, seasonally forced localdynamics of measles with detailed transportation data. We see two strands ofrecent work that offer a way forward in the face of this daunting challenge.
0 1 5 10 50 1000
0.1
0.2
0.3
0.4
0.5
0.6
Number of infectious individuals
Pro
port
ion
of ti
me
Low level of importsHigh level of imports
Fig. 17.8 Distribution of the number of infectious individuals in a stochastic SIR model of10,000 with measles-like parameters (R0 � 17, infectious period is 13 days) for two differentlevels of imports. The two levels of imports correspond to the effects of being part of ametapopulation where either all or few of the other patches are infected and close to the car-rying capacity. Clearly the local population level dynamics are influenced strongly by the globalmetapopulation behavior.
Chapter 17 11/17/03 3:15 PM Page 433
434 MATT J. KEELING ET AL.
Fig. 17.9 Comparison between a full stochastic metapopulation and idealized functionalforms of the Levins metapopulation. The average rates of extinction and colonization that occurwhenever a simulation has a given number of occupied patches are shown. For simplicity,changes due to external imports are ignored. (A and B) Results for a single-species logisticmodel, which conforms well to the Levins ideal.
0 10 20 30 40 500
0.5
1
1.5
2
2.5
3
3.5
Number of Occupied Patches
Rat
e of
col
oniz
atio
n
A
0 10 20 30 40 500
1
2
3
4
5
6
Number of Occupied Patches
Rat
e of
ext
inct
ion
B
First, the development of discrete time versions of the SIR model (Finkenstädtand Grenfell, 2000; Bjørnstad et al., 2002; Grenfell et al., 2002) has allowedus to model the local scaling of dynamics and importation of infection overfour orders of magnitude in host population size. Second, time series analysisof England and Wales data using wavelet phase analysis has testified to well-defined hierarchical traveling waves of infection, moving from large centers tothe surrounding hinterland (Fig. 17.10; Grenfell et al., 2001).
These waves echo, on a larger spatiotemporal scale, the hierarchical wavesdetected in earlier geographical work (Cliff et al., 1981). Simplistic spatiotem-poral models (Grenfell et al., 2001) show that the waves arise essentially from“forest fire”-like dynamics (Bak et al., 1990; Rand et al., 1995) in which epi-demic “sparks” of infection from the large core populations ignite epidemicsin smaller, locally extinct centers. These studies offers a glimpse of an ultimateunderstanding of the space–time dynamics of measles, but much is yet to be
Chapter 17 11/17/03 3:15 PM Page 434

17. METAPOPULATION DYNAMICS OF INFECTIOUS DISEASES 435
uncovered. In particular, developing models and theories that scale into thevaccination era appear to hold significant challenge.
Bubonic Plague in the Middle Ages
Bubonic plague invaded Europe in 1364, spreading rapidly north from theports of southern Italy (Nobel, 1974). For the next 300 years or so the dis-ease ravaged the towns and cities of Europe causing vast mortality(Shrewsbury, 1970). Bubonic plague is a disease of rodents that is generallytransmitted by fleas, occasionally it spreads to humans, which is when casesare generally first noticed. Records show that although the disease wasendemic in Europe as a whole through three centuries, each communitydisplayed isolated epidemics in the human host population cases followed by“disease-free” periods. It has therefore long been thought that bubonic plagueexhibited classic metapopulation behavior at the regional scale, with theinfection continually going extinct and then recolonizing communities(Appleby, 1980). This conventional wisdom contradicts two pieces of
Fig. 17.9 Continued. (C and D) A SIR disease model with measles-like parameters and abetween-patch coupling of � 0.001. Clearly the latter contrasts with the Levins paradigm.
0 5 10 15 20 250
0.05
0.1
0.15
0.2
0.25
Number of Infected Patches
Rat
e of
col
oniz
atio
n
C
0 5 10 15 20 250
0.05
0.1
0.15
0.2
0.25
0.3
Number of Infected Patches
Rat
e of
ext
inct
ion
D
Chapter 17 11/17/03 3:15 PM Page 435

436 MATT J. KEELING ET AL.
historical evidence. First, there is a fairly regular cyclic nature to human epi-demics, which is unlikely to be caused by random imports of infection.Second, even in communities with tight quarantine controls, there is littlechange to the pattern of epidemics (Appleby, 1980).
Keeling and Gilligan (2000a,b) focused on the interaction among rats, fleas,and humans within a metapopulation setting. The life cycle of the plague canbe partitioned into distinct stages and follows a general pattern for vector-borne diseases. Fleas that feed on an infected rat ingest the bubonic plaguebacteria (Yersinia pestis) and become infectious. When an infected rat dies, itsfleas, which are by now infectious, leave to search for a new host. Usually thefleas find other rats, infect them, and so spread the disease through the rodentcommunity. Only when the density of rats is low are the fleas forced to feedon alternative hosts, such as humans, and spark off a human epidemic.Humans are considered a dead-end host, as transmission from humans to fleasis rare. Direct transmission between humans is possible if the pneumonic formof the disease develops, but due to the rapidity and virulence of such infection,
0 50 100 150 200 250 300 350 400 450 500–100
–50
0
50
100
Km from London
Pha
se d
iffer
ence
from
Lon
don
5 10 15 20 25 30–70
–60
–50
–40
–30
–20
–10
0
Km from London
Pha
se d
iffer
ence
from
Lon
don
0 0.5 1 1.5 2 2.5× 10⁵
–80
–60
–40
–20
0
Pop. size
Pha
se d
iffer
ence
from
Lon
don
Fig. 17.10 Average phase differences for prevaccination urban and rural measles epidemicin the United Kingdom. (Top) Mean urban phase difference from London for major (biennial)epidemics during 1950–1966. Note that most places lag behind London. (Lower left) Meanurban phase difference from London for 1950–1966 in the London region (within 30 km) asa function of distance from the capital showing a significant correlation of phase differenceand distance (r � � 0.59, 99% bootstrap limits: �0.75 to �0.39); error bars are 99% boot-strapped confidence limits. (Lower right) Relationship between epidemic phase differenceand local urban population size. The positive relationship between phase lag and populationsize is consistent with a “hierarchical forest fire” explanation for the waves (see Grenfell et al.,2001).
Chapter 17 11/17/03 3:15 PM Page 436

17. METAPOPULATION DYNAMICS OF INFECTIOUS DISEASES 437
pneumonic epidemics are small and short lived. These epidemiological obser-vations can be translated into a mathematical model:
(17.10)
where SR, IR, and RR refer to the number of susceptible, infectious, and resist-ant rats, respectively SH, IH, and RH are similar quantities for the human popu-lation, N is the average number of fleas on a rat, and F is the number offree-living infected fleas that are searching for a host. Table 17.1 lists themeaning and value of all other parameters used in the model, which have beenestimated from historical data or experiments (Keeling and Gilligan, 2000b).
The behavior of the theoretical model for this system is critically dependenton stochasticity and scaling. For large host populations, a deterministic solu-tion gives rise to a constant level of infection in the rodents (as expected frommost SIR-type models) and a negligible number of human cases. However,when stochastic effects play a major role, unusually large epidemics may drivethe rat population to such low levels that the fleas are forced to feed on alter-native hosts and a human epidemic occurs. This results in localized extinctionof the disease. The subsequent local dynamics depends on the build-up of thesusceptible rat population. Fairly rapid recolonizations of infection lead to anendemic persistence in the rat population and few, if any, human cases. In con-trast, if recolonization is rare and hence the susceptible rat population has timeto increase to high levels, major epidemic cycles with resultant spillover inhuman hosts occur. Thus, the epidemic dynamics is determined by the mixtureof local transmission dynamics, stochasticity, and spatial coupling.
Good evidence suggests that in any large town or city, rats are unlikely toact as a homogeneously mixing host population, and therefore a spatially seg-regated metapopulation approach may be more appropriate. Studies per-formed by the Plague Commission in India (1906) showed that the spatial
dRH
dt� mHgHIH � dHRH.
dIH
dt� �HSHF exp(�aTR) � (dH � mH)IH,
dSH
dt� rH(SH � RH) � dHSH � �HSHF exp(�aTR),
dFdt
� CdR � mR(1 � gR) DIRN � dFF.
dNdt
� rFNa1 �NKFb �
dF
TRF C1 � exp(�aTR) D,
where TR � SR � IR � RR (the total rat population size).
dRR
dt� rRRRap �
TR
KRb � mRgRIR � dRRR,
dIR
dt� �R
SR
TRF C1 � exp( � aTR) D � (dR � mR)IR,
dSR
dt� rRSRa1 �
TR
KRb � RR(1 � p) � dRSR � �R
SR
TRF C1 � exp( � aTR) D,
Chapter 17 11/17/03 3:15 PM Page 437

438 MATT J. KEELING ET AL.
spread of the epidemic through the rodent population was extremely slow dueto their largely territorial nature; this corresponds well with historical evidenceof slow-moving waves of infection in the large medieval cities. Figure 17.11shows the number of bubonic plague cases in rodents in a metapopulationmodel consisting of 25 local populations. Persistence of the metapopulation isdue to the local populations that remain close to the endemic state (e.g., cen-tral site for the latter part of the simulation), whereas human cases (and thushistorical reports) are due to the stochastically driven large epidemics. Due tothe time necessary for the susceptible rat population to recover, these large epi-demics have a period of around 10–12 yr, which corresponds remarkably wellwith the historical observations.
As observed earlier, the classic Levins metapopulation does not readily cap-ture the dynamics of spatially structured epidemics due to the strong correla-tions that often exist between local and global levels of infection. However, forplague, such correlations are weak, and the local populations can be classifiedinto three basic states: endemic (low level of infection and low risk of extinc-tion), epidemic (high level of infection and high risk of extinction), and extinct(but susceptible). The extinct class is further subdivided so as to mimic thegradually increasing susceptible rat population. Figure 17.12 shows a carica-ture schematic of the Levins-type model for bubonic plague.
For this type of spatiotemporal dynamics, where the behavior is classifiedeasily into a discrete set of states, the Levins approach provides great improve-ments in computational efficiency and clarity. The Levins approach allows usto consider the dynamics at a far larger scale and hence observe the wave-likespread of the epidemics away from the endemic centers (Keeling and Gilligan,2000b). From these models it is clear that the epidemic wave is often shortlived and self-extinguishing, confirming the importance of endemic popula-tions in allowing for long-term disease persistence.
TABLES 17.1 Parameters Used in the Bubonic Plague Model
Parameter Value Meaning
rR 5 Reproductive rate of ratp 0.975 Probability of inherited resistanceKR 2500 Carrying capacity of ratdR 0.2 Death rate of rats�R 4.7 Transmission ratemR 20 (Infectious period)�1
gR 0.02 Probability of recovery R 0.03 Movement rate of ratsa 4 � 10�3 Flea searching efficiencyrF 20 Reproductive rate of fleadF 10 Death rate of fleasKF 3.29 : 11.17 mean 6.57 Carrying capacity of flea per rat F 0.008 Movement rate of fleasrH 0.045 Reproductive rate of humansdH 0.04 Death rate of humans�H 0.01 Transmission rate to humansmH 26 (Infectious period)�1
gH 0.1 Probability of recovery
Chapter 17 11/17/03 3:15 PM Page 438

17. METAPOPULATION DYNAMICS OF INFECTIOUS DISEASES 439
Conservation or Contamination
An interesting extension to the classic metapopulation models for the popu-lation dynamics of endangered species is the inclusion of disease (Hess, 1996;Gog et al., 2002). In the absence of infection, increasing the spatial couplingbetween isolated habitats will increase the level of patch occupancy anddecrease the risk of global extinction for one threatened species. Within theLevins metapopulation framework, x is the occupancy level and � is theamount coupling. This is given as
(17.11)
where e is the extinction rate and c is the probability that invasion of an emptypatch is successful. From this simple model it is clear that movement betweenlargely isolated habitats improves the persistence of the endangered species.
x ¡ 1 �e
�c
dxdt
� �cx(1 � x) � ex
Rat
Cas
es in
Sub
popu
latio
ns
Time
Fig. 17.11 Stochastic model dynamics of bubonic plague in a metapopulation. Each localpopulation has a stochastic model for the behavior of rats, fleas, and humans, and the 25 localpopulations are coupled spatially with a low movement rate of rats and fleas between adjacentpatches. For each local population, the number of cases in rodents over a 100-yr period isshown; during this time, the disease persists without the need for imports from outside themetapopulation.
Chapter 17 11/17/03 3:15 PM Page 439

440 MATT J. KEELING ET AL.
This is for two distinct reasons. Primarily, increased coupling � leads to ahigher colonization rate, which increases the likelihood of rescue events andthe number of occupied local populations at equilibrium. Second, largeamounts of movement between patches synchronize the dynamics, the localpopulations act effectively as one large habitat, and large populations suffer arelatively less extinction risk from stochasticity. The single-species model thusreveals no benefit of demographic heterogeneities between local populationsas one large population (or several tightly coupled populations) shows thegreatest persistence. This result is echoed by full stochastic metapopulationequations with explicit within-patch dynamics (Keeling, 2000b).
This conclusion can be altered radically in the presence of a virulent infec-tious disease, as coupling also facilitates the spread of infection (Hess, 1996).The resultant cost–benefit trade-off depends on the relative levels of hostextinction with and without the disease, as well as the relative colonizationrates. Gog and Colleagues (2002) used the following model to explore thedynamics of infected (I) and uninfected (S) habitat:
(17.12)dIdt
� �I(1 � I � S) � eII � �IS � gS
dSdt
� �S(1 � I � S) � eSS � �IS � gS
Persistent Endemic
S1
S2
S3
S4
S5
S6
P
E
Epidemic
Fig. 17.12 Representation of transition states in a structured metapopulation model(Gyllenberg et al., 1997) of bubonic plague. Solid arrows represent probabilistic transitions,which occur independently of the surrounding environment. Dashed arrows show transitionsthat only occur due to the import of infection from a neighboring patch. Rates of transition canbe measured from the full stochastic metapopulation model.
Chapter 17 11/17/03 3:15 PM Page 440

17. METAPOPULATION DYNAMICS OF INFECTIOUS DISEASES 441
where � is the rate of movement to and colonization of empty habitat, eS andeI are the patch level extinction rates, � is the chance that movement leads tothe spread of infection, and g is the import rate of infection from outside theconsidered population. As this is a model of wildlife disease, the couplingbetween populations occurs as the random dispersal of organisms rather thanthe short-duration commuter movements associated with human disease trans-mission. The focus of this model is conservation of an endangered host, andtherefore is the reverse of the scenarios discussed earlier where the eradicationof infection was the main aim. In agreement with the earlier work of Hess(1996), this Levins-like model shows that under certain circumstances greatermovement between patches (larger �) can lead to a reduction in the number ofoccupied patches and an increased risk of global extinction to highlight animportant conservation risk (Fig. 17.13).
It is informative to consider an extreme variation of this model. Supposethat the disease within an infected patch is severe and widespread so that ani-mals from infected patches are unable to colonize a new habitat successfully.The model then can be rewritten as
(17.13)dIdt
� (�)IS � (eI � eS)I � eSI � gS
dSdt
� �S(1 � I � S) � (�)IS � eSS � gS
0 0.2 0.4 0.6 0.8 10
0.1
0.2
0.3
0.4
0.5
0.6
0.7
0.8
0.9
Movement rate, σ
Pro
port
ion
of o
ccup
ied
patc
hes,
x o
r S
+I
Levins modelGog et al. model (17.12)SIR –like model (17.13)
Fig. 17.13 Effects on patch occupancy of between-patch coupling � for the three modelsare shown. Both the model of Gog et al. (2002) and the simplified SIR-like version show thatincreased levels of coupling can decrease patch occupancy in the presence of an infectious dis-ease (c � 1, e � eS � 0.1, eI � 0.2, � � 0.5, g � 0.001).
[AU1]
Chapter 17 11/17/03 3:15 PM Page 441

442 MATT J. KEELING ET AL.
This model then shares many elements with standard SIR disease models; ��plays the role of the transmission parameter �, eS corresponds to the naturaldeath rate, and eI � eS equates to the recovery rate. The emergent parallel withclassical disease models allows us to intuit about the resultant dynamics. Forexample, changes in the movement rate � correspond to a trade-off betweenan increase in the birth rate and an increase in disease transmission.
Vaccination, Pulses, and Synchrony
A key issue of metapopulation modeling for infectious diseases is to com-pare different vaccination strategies to optimize the likelihood of disease eradi-cation. As discussed earlier, the global persistence of a disease is determined bytwo main factors: the local extinction rate and the rate of recolonization,which in turn is related to the heterogeneity of the metapopulation.Figure 17.14 shows how these two facets change as the level of vaccinationincreases; we first consider the solid black line, which corresponds to contin-uous random vaccination. Below the critical vaccination level of 90% the localextinction rate shows only a moderate increase with the level of vaccination sothat the expected length of an epidemic decreases slowly. In contrast, the cor-relation between two coupled local populations starts to decrease from theonset of vaccination. Therefore, in the Levins formulation, moderate levels ofvaccination only cause a small increase in the extinction rate, which may becounteracted by the increase in heterogeneity and therefore the increase in res-cue effects when they are most needed.
The balance between vaccination increasing the stochastic extinction ratebut reducing the synchrony between populations depends on the demographicand epidemiological parameters. Thus while moderate levels of vaccinationwill always act to reduce the total number of cases, they may surprisinglyincrease the global persistence of the disease if the loss of synchrony is dra-matic enough. However, as the level of vaccination approaches the criticaleradication threshold, the rapid rise in the rate of local extinctions will over-whelm any rescue effects and global extinction will inevitably follow.
Obviously, vaccination would be a much more effective tool if as well asreducing the number of cases it could also decrease the global persistence ofthe disease. In principle, this can be achieved by superimposing periodic“pulses” of vaccination on the overall background rate. Pulsed vaccination hasbeen proposed to increase the efficiency of vaccination (Agur et al., 1993), butit could also have a spatial benefit by “lining up” epidemic troughs and there-fore reducing rescue effects (Earn et al., 1998). The impact of a simple modelfor pulse vaccination (in the absence of background vaccination) is shown ingray in Fig. 17.14. The first observation is that pulse vaccination is associatedwith a slightly lower local extinction rate, and also more cases of the disease;this is because in the gaps between the vaccination pulses children that wouldhave been immunized under continuous vaccination have a chance of catchingthe infection. However, this could be compensated for by only vaccinating sus-ceptible children and therefore not wasting vaccine. In contrast, for the correl-ation between populations, the difference between pulsed and continuousvaccination is more dramatic. The significant perturbation caused by a peri-odic vaccination campaign acts to synchronize the dynamics of the two
Chapter 17 11/17/03 3:15 PM Page 442

17. METAPOPULATION DYNAMICS OF INFECTIOUS DISEASES 443
0 20 40 60 80 1000.01
0.02
0.03
0.04
0.05
0.06
0.07
0.08
0.09
0.1
0.11
Vaccination level (%)
Ext
inct
ion
rate
Continuous
Pulsed
A
0 20 40 60 80 100–0.05
0
0.05
0.1
0.15
0.2
0.25
Vaccination level (%)
Cor
rela
tion
Continuous
Pulsed
B
Fig. 17.14 Effects of vaccination on the characteristics of unforced SIR epidemics. Black sym-bols refer to constant random vaccination at birth, whereas gray symbols correspond to pulsevaccinating randomly at regular 4-yr intervals; similar results are achieved for more frequentyearly pulses. (A) Change in the local extinction rate (per day) of an isolated population.(B) Change in the correlation between two local populations coupled at a level � � 0.01.(Population size is 10,000, R0 � 10, g � 10 days, import rate is 5 per year.)
Chapter 17 11/17/03 3:15 PM Page 443

444 MATT J. KEELING ET AL.
populations, thus for pulsed vaccination the correlation remains approxi-mately constant for vaccination levels below 60%.
Pulsed vaccination therefore provides a potentially important tool forincreasing local extinctions, without increasing the effective rescue events, andtherefore increasing the likelihood of global extinctions (compare to Levins,1969). Results shown in Fig. 17.14 have ignored seasonal forcing, which nat-urally leads to greater synchronization of the dynamics. When seasonal forcingis important (such as for most childhood diseases), the interaction of vaccin-ation pulses and seasonal effects may be very complex, such that the precisetiming of vaccination could increase the chance of eradication dramatically.However, this is very much an open problem for future research.
17.6 FUTURE DIRECTIONS
Metapopulation theory has a rich history in the ecological literature andhas proved itself continually as both an applied tool and an insightful descrip-tion of the complex world (Gilpin and Hanski, 1991; Hanski and Gilpin,1997). The use of metapopulations has been somewhat more limited in epi-demiology due to the more complex within-patch dynamics. However, inrecent years this balances has begun to be redressed. Several key theoreticaland practical issues still need to be dealt with successfully to allow the subjectto develop further.
1. A better understanding of how the epidemiological and demographicparameters translate into the Levins-type metapopulation parameters ofextinction and colonization rates. The ability to translate stochasticwithin-patch population dynamics into a simple set of population levelstates would lead to a vast increase in computational speed and providepowerful insights into the spatiotemporal dynamics of disease spreadand extinction. Although moment-closure approximations and quasi-equilibrium solutions offer a likely approach, they have yet to be appliedto realistic seasonally forced dynamics.
2. More detailed simulations of heterogeneous patches with complexconnections (Chapter 4). So far the majority of studies have consideredequally sized local populations and global coupling. While this is anatural starting point, the real world is far more complex, anddeveloping models and intuition for such scenarios will be importantif spatially targeted control measures are to be applied most effectively.
3. A range of more powerful statistical and mathematical techniques arealso required to deal with coupling. First, there is the complex problemof how to estimate the coupling between communities from case reports.This estimation process is confounded by stochasticity, seasonality, andheterogeneities in demographic rates, although some progress has beenmade. Associated with this problem is developing mathematical rules forthe coupling between populations as a function of their separation. In ametapopulation of N patches, there are N(N � 1) coupling terms, hencein large systems estimating or even storing all the coupling rates becomesproblematic so analytical approximations become necessary. Developing
Chapter 17 11/17/03 3:15 PM Page 444

17. METAPOPULATION DYNAMICS OF INFECTIOUS DISEASES 445
gravity (Cliff and Hagget, 1988) and other formulations of the relation-ship between human movement and disease spread is an importantproblem for both fundamental population biology and applied epidemi-ology.
Although these three problems present formidable challenges, metapopula-tions are likely to see far more use in the future as the degree of realism andresolution required from models increases.
Chapter 17 11/17/03 3:15 PM Page 445

[AU1] Is 17.12, 17.13 needed in the Figures.
Chapter 17 11/17/03 3:15 PM Page 446

REFERENCES
Anderson, R.M. and May, R.M. 1991 Infectious Diseases of Humans. Ox-ford University Press.Appleby, A.B. 1980 The disappearance of plague: a continuing puzzle. Econ.
Hist. Rev. 33 161-173.Agur Z., Cojocaru L., Mazor G., Anderson R.M. and Danon Y.L. 1993 PulseMass Measles Vaccination Across Age Cohorts. Proc. Natl. Acad. Sci. 90
11698-11702.Bak, P., Chen, K., and Tang, C. 1990 A forest fire model and some thoughtson turbulence. Physics Letters A 147 297-300Bartlett, M.S. 1956 Deterministic and Stochastic Models for recurrent epi-demics Proc. of the Third Berkley Symp. on Math. Stats. and Prob. 4 81-108Bartlett, M.S. 1957 Measles periodicity and community size. J. R. Statisti-
cal Soc. A 120 48-70Bartlett, M.S. 1960 The critical community size for measles in the U.S. J.
R. Statistical Soc. A 123 37-44Black, F.L. 1966 Measles endemicity in insular populations: critical com-munity size and its evolutionary implications. J. Theo. Biol. 11 207-211Bjørnstad, O.N., Finkenstadt, B.F. and Grenfell, B.T. 2002a Dynamics ofmeasles epidemics I: Estimating scaling of transmission rates using a Timeseries SIR model. Ecol. Monogr. 72 169-184Bjørnstad, O.N., Peltonen, M., Liebhold, A.M. and Baltensweiler, W. 2002Waves of larch budmoth outbreaks in the European Alps. Science 298 1020-1023.Bolker, B. 1999 Analytic models for the patchy spread of plant disease. Bull.
Math. Biol. 61 849-874.Cliff, A.P., Haggett, P., Ord, J.K. and Versey, G.R. 1981 Spatial diffusion:
an historical geography of epidemics in an island community. CambridgeUniversity PressCliff A.D. and Haggett P. 1988 Atlas of Disease Distributions: Analytic Ap-
proaches to Epidemiologic Data. Basil Blackwell, Oxford.Cliff A.D., Haggett P. and Smallman-Raynor M. 1993 Measles: an histori-
cal geography of a major human viral disease from global expansion to local
retreat, 1840-1990. Blackwell, Oxford.Cornell, S.J., Isham, V.S. and Grenfell B.T. 2000 Drug-resistant parasitesand aggregated infection - early-season dynamics. J Math. Biol. 41 341-360.Earn D., Rohani P. and Grenfell B.T. 1998 Spatial dynamics and persistencein ecology and epidemiology. Proc. R. Soc. Lond B 265 7-10.Ferguson, N., Donnelly, C. and Anderson R. 2001 The Foot-and-MouthEpidemic in Great Britain: Pattern of Spread and Impact of Interventions.
1

Science 292 1155-1160Finkenstadt, B. and Grenfell, B. 2000 Time series modelling of childhooddiseases: a dynamical systems approach. J. Roy. Stat. Soc. C 49 187-205.Finkenstadt, B., Keeling, M.J.and Grenfell, B.T. 1998 Patterns of densitydependence in measles dynamics. Proc. Roy. Soc. Lond. B. 265 753-762Gilpin, M.E. and Hanski, I.A. 1991 Metapopulation Dynamics: Empirical
and Theoretical Investigations. Academic Press.Gog, J. R., Woodroffe, R. and Swinton, J 2002. Disease in EndangeredMetapopulations: The Importance of Alternative Hosts. Proc. Roy. Soc.
Lond. A 269 671-676.Grenfell, B.T., Bjørnstad, O.N. and Finkenstadt, B. 2002 Dynamics ofmeasles epidemics:Scaling noise, determinism and predictability with theTSIR model. Ecol. Monogr. 72 185-202.Grenfell, B.T., Bjørnstad, O.N. and Kappey J. 2001 Travelling waves andspatial hierarchies in measles epidemics. Nature 414 716-723Grenfell, B.T. and Bolker, B.M. 1998 Cities and villages: infection hierar-chies in a measles metapopulation. Ecology Letters 1 63-70Grenfell, B.T. and Dobson, A. 1995 Ecology of Infectious Diseases in Natu-
ral Populations. Cambridge University Press.Grenfell, B.T. and Harwood, J. 1997. (Meta)population dynamics of infec-tious diseases. Trends in Ecology and Evolution 12 395-99.Grenfell, B.T., Wilson, K., Finkenstdt, B.F., Coulson, T.N., Murray, S., Al-bon, S.D., Pemberton, J.M., Clutton-Brock, T.H. and Crawley, M.J. 1998Noise and determinism in synchronized sheep dynamics. Nature 394 674-677.Gupta S., Ferguson N. and Anderson R. 1998 Chaos, persistence, and evo-lution of strain structure in antigenically diverse infectious agents. Science
280 912-915.Gyllenberg, M. Hanski, I. and Hastings, A. 1997 Structured MetapopulationModels. In Metapopulation Biology. Ecology, Genetics and Evolution. (Eds.I.A. Hanski and M.E. Gilpin) Academic Press, San Diego. pp 93-122.Hanski, I.A. and Gilpin, M.E. 1997 Metapopulation Biology. Ecology, Ge-
netics and Evolution. Academic Press,San Diego.Harrison, S., and Quinn, J.F. 1989 Correlated environments and the persis-tence of metapopulations. Oikos 56 293-298.Henson, S.M., Cushing, J.M., Costantino, R.F., Dennis, B. and Desharnais,R.A. 1998 Phase switching in population cycles. Proc. Roy. Soc. Lond. B
265 2229-2234.Hess, G. 1996 Disease in metapopulations: implications for conservation.Ecology 77 1617-1632.
2

Hudson, P., Annapaola R., Grenfell, B., Heesterbeek, H. and Dobson, A.2002 The Ecology of Wildlife Diseases. Oxford University Press.de Jong, M., Diekmann, O. and Heesterbeek, H. 1995 How does transmis-sion of infection depend on population size? In Epidemic Models: Their
Structure and Relation to Data. (Ed. Mollison, D.) Cambridge UniversityPress.Keeling, M.J. 2000a Simple stochastic models and their power-law type be-haviour. Theor. Pop. Biol. 58 21-31.Keeling, M.J. 2000b Metapopulation moments: coupling, stochasticity andpersistence. J. Animal Ecology 69 725-736Keeling, M.J. and Gilligan, C.A. 2000a Metapopulation dynamics of bubonicplague. Nature 407 903-906.Keeling, M.J. and Gilligan, C.A. 2000b Bubonic Plague: A metapopulationmodel of a zoonosis. Proc. Roy. Soc. Lond. B 267 2219-2230.Keeling, M.J. and Grenfell, B.T. 1997 Disease Extinction and CommunitySize: Modeling the Persistence of Measles. Science 275 65-67Keeling, M.J. and Grenfell, B.T. 1999 Stochastic Dynamics and a PowerLaw for Measles Variability. Phil. Trans. Roy. Soc. Lond. B 354 768-776Keeling, M.J., Rohani, P. and Grenfell, B.T. 2001 Seasonally-forced DiseaseDynamics Explored as Switching Between Attractors. Physica D 148 317-335.Keeling, M.J. and Rohani, P. 2002 Estimating spatial coupling in epidemi-ological systems: a mechanistic approach. Ecology Letters 5 20-29.Keeling, M.J., Woolhouse, M.E.J., Shaw, D.J., Matthews, L., Chase-Topping,M, Haydon, D.T., Cornell, S.J., Kappey, J., Wilesmith, J. and Grenfell, B.T.2001 Dynamics of the 2001 UK Foot and Mouth Epidemic: Stochastic Dis-persal in a Heterogeneous Landscape. Science 294 813-817Kot, M., Lewis, M.A., and van den Driessche, P. 1996 Dispersal data andthe spread of invading organisms. Ecology 77 2027-2042.Lande, R., Engen, S. and Saether, B.E. 1998 Extinction times in finitemetapopulation models with stochastic local dynamics. Oikos 83 383-389.May, R.M. and Anderson, R.M. 1979 Population biology of infectious dis-eases part II. Nature 280 455-461.McCallum, H., Barlow, N. and Hone, J. 2001 How should pathogen trans-mission be modelled? Trends in Ecology and Evolution 16 295-300.Moran P.A.P. 1953 The statistical analysis of the Canadian lynx cycle. IISynchronization and meteorology. Aust. J. Zool. 1 291-298Nee, S. 1994. How populations persist. Nature 367 123-124.Noble, J.V. 1974 Geographic and temporal development of plagues. Nature
250 726-728.
3

Ovaskainen, O. and Grenfell, B. 2003 Mathematical tools for planning ef-fective intervention scenarios for sexually transmitted diseases. Sexually
Transmitted Diseases, (in press).Park, A.W., Gubbins, S. and Gilligan, C.A. 2001 Invasion and persistence ofplant parasites in a spatially structured host population. Oikos 94 162-174.Rand, D.A., Keeling, M.J. and Wilson, H.B. 1995 Invasion, stability andevolution to criticality in spatially extended, artificial host-pathogen ecolo-gies. Proc. R. Soc. Lond. B 259 55-63Ranta, E., Kaitala, V. and Lindstrom, J. 1997 Dynamics of canadian lynxpopulations in space and time. Ecography 20 454-460.Rohani, P., Earn, D.J.D. and Grenfell, B.T. 2000 Impact of immunisationon pertussis transmission in England and Wales. Lancet 355 285-286.Rohani, P., Keeling, M.J. and Grenfell, B.T. 2002 The Interplay BetweenDeterminism and Stochasticity in Childhood Diseases. Am. Nat. 159 469-481.Sattenspiel, L. and Dietz, K. 1995 A Structured Epidemic Model Incorpo-rating Geographic-Mobility Among Regions. Math. Biosci 128 71-91.Schenzle, D. 1984 An age-structured model of pre- and post-vaccinationmeasles transmission. I.M.A. J. Math. App. Med. Biol. 1 169-191Shrewsbury, J.F.D. 1970 A History of Bubonic Plague in the British Isles.
Cambridge University Press.Smith, D.L., Lucey, B., Waller, L.A., Childs, J.E. and Real, L.A. 2002Predicting the spatial dynamics of rabies epidemics on heterogeneous land-scapes. Proc. Nat. Acad. Sci. 99 3668-3672.Swinton, J., Harwood, J., Grenfell, B.T. and Gilligan, C.A. 1998 Persistencethresholds for phocine distemper virus infection in harbour seal Phoca vit-
ulina metapopulations. J. Animal Ecology 67 54-68.Tilman, D. 1999 The ecological consequences of changes in biodiversity: Asearch for general principles. Ecology 80 1455-1474.Wilson, H.B., and Hassell. M.P. 1997 Host-parasitoid spatial models: theinterplay of demographic stochasticity and dynamics. Proc. Roy. Soc. Lond.
B. 264 1189-1195.
4