Matsuzaki, M; Kulkarni, B; Kuper, H; Wells, JC; Ploubidis...
12
Matsuzaki, M; Kulkarni, B; Kuper, H; Wells, JC; Ploubidis, GB; Prabhakaran, P; Gupta, V; Walia, GK; Aggarwal, A; Prabhakaran, D; Davey Smith, G; Radhakrishna, KV; Ben-Shlomo, Y; Kinra, S (2017) Association of Hip Bone Mineral Density and Body Compo- sition in a Rural Indian Population: The Andhra Pradesh Children and Parents Study (APCAPS). PloS one, 12 (1). e0167114. ISSN 1932-6203 DOI: https://doi.org/10.1371/journal.pone.0167114 Downloaded from: http://researchonline.lshtm.ac.uk/3331570/ DOI: 10.1371/journal.pone.0167114 Usage Guidelines Please refer to usage guidelines at http://researchonline.lshtm.ac.uk/policies.html or alterna- tively contact [email protected]. Available under license: http://creativecommons.org/licenses/by/2.5/
Transcript of Matsuzaki, M; Kulkarni, B; Kuper, H; Wells, JC; Ploubidis...

Matsuzaki, M; Kulkarni, B; Kuper, H; Wells, JC; Ploubidis, GB;Prabhakaran, P; Gupta, V; Walia, GK; Aggarwal, A; Prabhakaran,D; Davey Smith, G; Radhakrishna, KV; Ben-Shlomo, Y; Kinra, S(2017) Association of Hip Bone Mineral Density and Body Compo-sition in a Rural Indian Population: The Andhra Pradesh Childrenand Parents Study (APCAPS). PloS one, 12 (1). e0167114. ISSN1932-6203 DOI: https://doi.org/10.1371/journal.pone.0167114
Downloaded from: http://researchonline.lshtm.ac.uk/3331570/
DOI: 10.1371/journal.pone.0167114
Usage Guidelines
Please refer to usage guidelines at http://researchonline.lshtm.ac.uk/policies.html or alterna-tively contact [email protected].
Available under license: http://creativecommons.org/licenses/by/2.5/
RESEARCH ARTICLE
Association of Hip Bone Mineral Density and
Body Composition in a Rural Indian
Population: The Andhra Pradesh Children and
Parents Study (APCAPS)
Mika Matsuzaki1*, Bharati Kulkarni2, Hannah Kuper3, Jonathan C. Wells4, George
B. Ploubidis5, Poornima Prabhakaran6, Vipin Gupta7, Gagandeep Kaur Walia6,
Aastha Aggarwal6, Dorairaj Prabhakaran8, George Davey Smith9, Kankipati
Vijaya Radhakrishna2, Yoav Ben-Shlomo9, Sanjay Kinra1
1 Department of Non-communicable Disease Epidemiology, London School of Hygiene and Tropical
Medicine, London, United Kingdom, 2 National Institute of Nutrition, Indian Council of Medical Research
Tarnaka, Jamai-Osmania, Hyderabad, India, 3 Department of Clinical Research, London School of Hygiene
and Tropical Medicine, London, United Kingdom, 4 Childhood Nutrition Research Centre, UCL Institute of
Child Health, London, United Kingdom, 5 Department of Population Health and Statistics Centre for
Longitudinal Studies, Institute of Education, University of London, London, United Kingdom, 6 Public Health
Foundation of India, Gurgaon, Haryana, India, 7 Department of Anthropology, University of Delhi, Delhi,
India, 8 Centre for Chronic Disease Control, Gurgaon, Haryana, India, 9 MRC Integrative Epidemiology Unit
(IEU) at the University of Bristol, School of Social and Community Medicine, University of Bristol, Bristol,
United Kingdom
Abstract
Background
Fat mass is variably associated with bone mass, possibly due to differential mechanical and
biological effects of fat mass. We examined the association of fat mass with bone mass in a
lean population.
Objective
To investigate association between hip bone mineral density and fat and lean mass in a
cross-sectional study from southern India.
Design
The Andhra Pradesh Children and Parents Study is a prospective cohort study in Hydera-
bad, India. In 2009–2012, the study collected data on anthropometric measures, bone min-
eral density (BMD), fat mass, and lean mass measured by dual-energy x-ray
absorptiometry, and socioeconomic data of the adult participants (n = 1760; mean age =
34.9 years old for women; 2130 and 32.3 for men).
Results
The median BMI (kg/m2) was 20.1 kg/m2. Women had relatively higher fat mass as com-
pared to men. In models adjusted for lean mass, there was an association between hip bone
PLOS ONE | DOI:10.1371/journal.pone.0167114 January 6, 2017 1 / 11
a1111111111
a1111111111
a1111111111
a1111111111
a1111111111
OPENACCESS
Citation: Matsuzaki M, Kulkarni B, Kuper H, Wells
JC, Ploubidis GB, Prabhakaran P, et al. (2017)
Association of Hip Bone Mineral Density and Body
Composition in a Rural Indian Population: The
Andhra Pradesh Children and Parents Study
(APCAPS). PLoS ONE 12(1): e0167114.
doi:10.1371/journal.pone.0167114
Editor: Mohan R Wani, National Center for Cell
Science, INDIA
Received: June 18, 2015
Accepted: November 9, 2016
Published: January 6, 2017
Copyright: © 2017 Matsuzaki et al. This is an open
access article distributed under the terms of the
Creative Commons Attribution License, which
permits unrestricted use, distribution, and
reproduction in any medium, provided the original
author and source are credited.
Data Availability Statement: We are unable to
provide our data due to ethical reasons, since
our participant consent forms state that ’the
data will only be shared with the investigators
or persons authorized by the investigators’.
However, all data related to the APCAPS cohort
is freely made available to all researchers
through a brief application to the cohort’s
Steering Group (form available from APCAPS
website, http://apcaps.lshtm.ac.uk, and
submitted to email: [email protected]).

mineral density and fat mass in women (β (95% confidence interval): premenopausal 0.025
(0.006 to 0.045); postmenopausal 0.045 (0.014 to 0.076)) but not in men (0.001 (-0.012 to
0.0014)). The association between hip BMD and fat mass was stronger in postmenopausal
than premenopausal women. Hip BMD was consistently associated with lean mass, in both
men and women.
Conclusions
In this relatively lean population, lean mass was more consistently associated with hip BMD
than fat mass. Weight gain through lean mass improvement may be a more reliable public
health strategy for strengthening bone health in transitional settings.
Introduction
Osteoporotic fractures are associated with morbidity and mortality [1]. A study estimated that
the number of hip fractures will rise to 6.3 million globally by 2050 [2]. Hip bone mineral den-
sity (BMD) is a predictor of overall risk of fractures in later life [3]. Body mass is one of the key
determinants of hip bone mineral density [4].
Fat mass is one of the main components of body mass. On one hand, sheer mechanical
loading of fat mass stimulates bone formation [5,6]. However, in vivo and in vitro studies
have suggested negative effects of fat on bone mass accrual through several biological mecha-
nisms [5–8]. Leptin, an adipocyte hormone, was shown to have an anti-osteogenic property
in mice [9]. Shared precursor stromal cells suggest competitive cell lineages between osteo-
genesis and adipogenesis [10]. Peroxisome proliferator-activated receptor (PPAR) γ pathway
is a key regulator of adipogenesis and also an inhibitor for osteoblastogenesis [7].
Epidemiological studies have shown inconsistent results on association between bone and
fat mass [11–14]. Many studies examined this association in the context of obesity and osteo-
porosis partially because of concerns for higher fracture rates among obese individuals [15].
However, it is possible that the balance between mechanical and biological mechanisms may
vary depending on the combination of body size and composition. Asians have been shown to
have higher proportion of fat mass at lower body mass index (BMI) [16]. The patterns of asso-
ciation between fat and bone mass in the Indian population may therefore be distinct from the
European and American populations. There have been few large-scale studies examining this
association in the Indian population.
The Andhra Pradesh Children and Parents Study (APCAPS) is a prospective cohort study
from southern India. The study population has been undergoing a nutritional and epidemio-
logical transition due to urbanization over the past decade; as a result, this population has a
wide variation in body sizes and compositions. The current study assessed how fat and bone
mass may be associated in this transitional rural population.
Methods
Ethics statement
The study received approvals from the ethics committees of the NIN (Hyderabad, India), the
Indian Council of Medical Research (ICMR), Centre for Chronic Disease Control, and Lon-
don School of Hygiene and Tropical Medicine (London, UK). Approval was also sought from
the village heads and their panchayats in each of the 29 villages. Written informed consent or
Hip BMD and Body Composition in a Rural Indian Population
PLOS ONE | DOI:10.1371/journal.pone.0167114 January 6, 2017 2 / 11
Funding: APCAPS 2nd and 3rd waves of data
collection was funded by the following
organizations: Wellcome Trust (www.wellcome.ac.
uk/) Grant 083707, Wellcome Trust Strategic
Award 084774, European Commission (http://ec.
europa.eu/index_en.htm) Strategic Award (FP-7).
PhD studentships were provided by Wellcome
Trust Award, Economic & Social Research Council
UK Award, Queensland University of Technology,
Australia ((https://www.qut.edu.au/), Wellcome
Trust Capacity Strengthening Strategic Award grant
084754, and Joint Japan/World Bank Graduate
Scholarship Program (http://web.worldbank.org).
GDS’ work is supported by the Medical Research
Council and the University of Bristol
MC_UU_12013/1-9. The funders had no role in
study design, data collection and analysis, decision
to publish, or preparation of the manuscript.
Competing Interests: The authors have declared
that no competing interests exist.

witnessed thumbprint if illiterate was obtained from the participants prior to their inclusion in
the study.
Study design
The analyses in this study used data from two waves of data collection (2009–2010; 2010–
2012) of the APCAPS study, a prospective cohort study established through long-term follow
up of the Hyderabad Nutrition Trial (HNT). The HNT studied impact of the Integrated
Child Development Services scheme, a national community outreach programme providing
food supplementation along with health, hygiene, and nutrition education, immunization,
anemia control, and basic health care to pregnant and lactating women and children under
the age of six years [17]. A detailed description of the initial trial (HNT) and the first wave of
data collection (the first follow-up of the HNT, 2003–2005) has previously been published
[17,18].
Since the second and third waves of data collection (W2/3) were conducted within a rela-
tively short period of time (2009–2012), the analyses in this manuscript used combined data
from these two waves of data collection. W2/3 examined markers for chronic diseases affecting
cardiovascular, musculoskeletal, and mental health. All consenting participants underwent
dual-energy x-ray absorptiometry (DXA) measurements at the National Institute of Nutrition
(NIN), Hyderabad and physical measurements at NIN (W2) or the village clinics (W3). In
cases where participants attended both waves of data collection, the data from the third wave
were used, unless there were major artifacts in the DXA scans from W3, which prompted the
use of data from W2. The current manuscript analyzed data on the adult participants only (18
years old and above).
Of the 7375 participants of the second/third wave of data collection whose age, sex, height,
and weight information were available, 4251 participants (58%) underwent DXA scans during
W2/3. Of those, scans without major artifacts were available in 4243 (99.8%) participants for
hip BMD. 97.5% of the DXA participants also had scans without major artifacts for whole-
body estimation of fat and lean mass. Information on the other descriptive variables were
available for�99% of the DXA participants. In total, 1200 premenopausal women, 560 post-
menopausal women, and 2130 men who had complete data for hip BMD, whole body compo-
sition and demographic data were include in the regression models.
Measurements
Questionnaire data. A semi-structured questionnaire was administered to all participants
by a trained interviewer. A subset of questions (14/29) from the Standard of Living Index (SLI)
in the National Health Family Survey-2, a summary measure of household level asset-based
scale devised for Indian surveys, was used to estimate socioeconomic position as joint family
structures are common in rural India [19]. We collected information on the quality of house,
toilet facilities, source of lighting and drinking water, ownership of clock, radio, television,
bicycle, motorcycle, car, refrigerator, telephone, and agricultural land. These items were
weighted to give a maximum score of 34, using weights developed by the International Insti-
tute of Population Science in India [19]. Occupation was classified into four categories: stu-
dents, manual employment, professional employment, and unemployment. Current tobacco
use was defined as smoking, chewing, or snuffing tobacco in the last 6 months. Menopausal
status was set as a binary variable (yes or no).
Anthropometric data. Weight was measured to the nearest 0.1kg with a digital SECA bal-
ance and standing height was measured to the nearest 1 mm with a plastic stadiometer
Hip BMD and Body Composition in a Rural Indian Population
PLOS ONE | DOI:10.1371/journal.pone.0167114 January 6, 2017 3 / 11

(Leicester height measure). Measurements were taken twice and the average of two values was
used in the analysis. Body mass index (BMI) was calculated as weight (kg) / height (m2).
DXA scanning. Bone density and body composition measures were made by DXA
using a Hologic Discovery A densitometer. The whole body scan was performed with the
participant supine on the scanning bed with their arms resting by their sides. Women sus-
pected of pregnancy were excluded from DXA scanning and the scans were taken only after
confirming the negative pregnancy by conducting urine pregnancy test. Standard Hologic
software options were used to define regions of the body (head, arms, trunk, and legs). The
coefficients of variation were determined to be 0.7% for hip bone mineral density (BMD),
1.3% for LS BMD, and 0.9% for whole-body BMD (n = 30). Scans were coded for artifacts
by a visual inspection and those hip scans with major movement and foreign objects as well
as incomplete scans were excluded from the analyses of hip BMD (g/cm2). Whole body
scans with major movements and incomplete scans were counted as artifacts and removed
from analysis with fat and lean mass. Bone mineral content (BMC in g) was calculated from
DXA-measured BMD (g/cm2) and bone area (cm2) for total hip. Fat to lean mass ratio
(FLR: fat mass / lean massx) was calculated using the allometric coefficients from sex-strati-
fied models regressing log-transformed fat mass upon log-transformed lean mass as x(x = 1.57 for women; 1.66 for men). FLR was multiplied by 100 to improve clarity. Total fat
and lean mass (kg) were estimated from whole-body scans. Osteopenia and osteoporosis
were defined based on the reference BMD values measured on Hologic DXA machines in
healthy Indian young adults (Hip BMD mean (sd): Women = 0.901 (0.111); Men = 0.988
(0.131)) [20].
Statistical analysis
Descriptive statistics were calculated for premenopausal women, postmenopausal women, and
men separately. Comparison between premenopausal and postmenopausal women and
women and men were made using Student t-test for the continuous variables with normal dis-
tributions (height, weight, lean mass, wbPA, and SLI), Wilcoxon rank-sum test for the contin-
uous variables with non-normal distributions (age, fat, FLR, and wbPA), and χ2 test for the
categorical variables (BMI categories, tobacco use, vegetarianism, and occupation) with appro-
priate degrees of freedom. Tukey’s honest significant difference test was also performed to
assess BMD differences between age groups within each sex group.
The associations between hip BMD and fat mass, lean mass, and FLR were examined in
multilevel regression models that accounted for household-level clusters. Three-level nested
multilevel models to adjust for both village and household-level clusters were considered but
the small intraclass correlations for the village level suggested that adjustment for the house-
hold-level clustering alone was sufficient. All models were stratified by sex. There was evidence
of an interaction between fat mass and menopausal status; therefore, regression models for
women were stratified by menopausal status. Fat mass (kg) was log-transformed as its distribu-
tion was positively skewed. Hat, PRESS, and Cook statistics were examined to remove outliers
for regression models.
Model 1 assessed association between hip BMD and fat mass, adjusting for lean mass, age,
height, SLI. Model 2 (S1 Table) examined association between hip BMD and FLR, adjusting
for age, height, and SLI. Model 3 (S1 Table) further adjusted Model 2 for weight. Further
adjustment for other potential confounders (vegetarianism and current tobacco use) did not
materially change the results and therefore parsimonious models are presented.
All analyses were conducted using R, version 3.1.1 and multilevel modeling was done with
nlme version 3.1–118.
Hip BMD and Body Composition in a Rural Indian Population
PLOS ONE | DOI:10.1371/journal.pone.0167114 January 6, 2017 4 / 11
Results
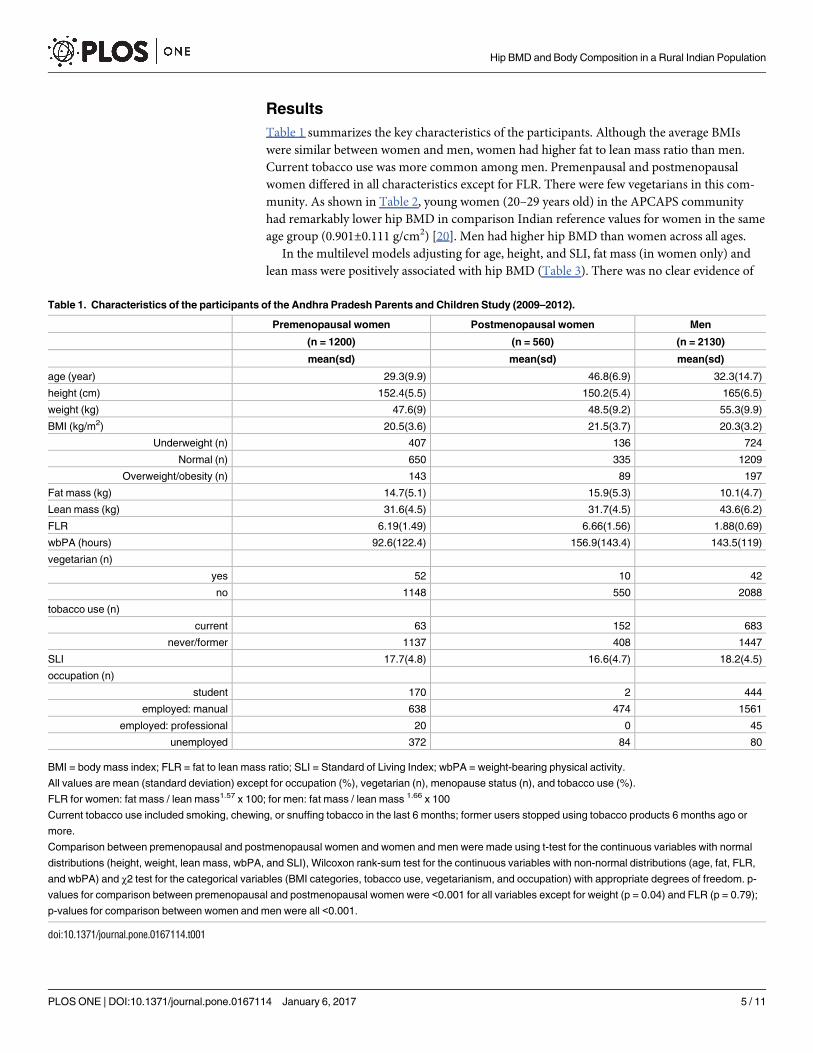
Table 1 summarizes the key characteristics of the participants. Although the average BMIs
were similar between women and men, women had higher fat to lean mass ratio than men.
Current tobacco use was more common among men. Premenpausal and postmenopausal
women differed in all characteristics except for FLR. There were few vegetarians in this com-
munity. As shown in Table 2, young women (20–29 years old) in the APCAPS community
had remarkably lower hip BMD in comparison Indian reference values for women in the same
age group (0.901±0.111 g/cm2) [20]. Men had higher hip BMD than women across all ages.
In the multilevel models adjusting for age, height, and SLI, fat mass (in women only) and
lean mass were positively associated with hip BMD (Table 3). There was no clear evidence of
Table 1. Characteristics of the participants of the Andhra Pradesh Parents and Children Study (2009–2012).
Premenopausal women Postmenopausal women Men
(n = 1200) (n = 560) (n = 2130)
mean(sd) mean(sd) mean(sd)
age (year) 29.3(9.9) 46.8(6.9) 32.3(14.7)
height (cm) 152.4(5.5) 150.2(5.4) 165(6.5)
weight (kg) 47.6(9) 48.5(9.2) 55.3(9.9)
BMI (kg/m2) 20.5(3.6) 21.5(3.7) 20.3(3.2)
Underweight (n) 407 136 724
Normal (n) 650 335 1209
Overweight/obesity (n) 143 89 197
Fat mass (kg) 14.7(5.1) 15.9(5.3) 10.1(4.7)
Lean mass (kg) 31.6(4.5) 31.7(4.5) 43.6(6.2)
FLR 6.19(1.49) 6.66(1.56) 1.88(0.69)
wbPA (hours) 92.6(122.4) 156.9(143.4) 143.5(119)
vegetarian (n)
yes 52 10 42
no 1148 550 2088
tobacco use (n)
current 63 152 683
never/former 1137 408 1447
SLI 17.7(4.8) 16.6(4.7) 18.2(4.5)
occupation (n)
student 170 2 444
employed: manual 638 474 1561
employed: professional 20 0 45
unemployed 372 84 80
BMI = body mass index; FLR = fat to lean mass ratio; SLI = Standard of Living Index; wbPA = weight-bearing physical activity.
All values are mean (standard deviation) except for occupation (%), vegetarian (n), menopause status (n), and tobacco use (%).
FLR for women: fat mass / lean mass1.57 x 100; for men: fat mass / lean mass 1.66 x 100
Current tobacco use included smoking, chewing, or snuffing tobacco in the last 6 months; former users stopped using tobacco products 6 months ago or
more.
Comparison between premenopausal and postmenopausal women and women and men were made using t-test for the continuous variables with normal
distributions (height, weight, lean mass, wbPA, and SLI), Wilcoxon rank-sum test for the continuous variables with non-normal distributions (age, fat, FLR,
and wbPA) and χ2 test for the categorical variables (BMI categories, tobacco use, vegetarianism, and occupation) with appropriate degrees of freedom. p-
values for comparison between premenopausal and postmenopausal women were <0.001 for all variables except for weight (p = 0.04) and FLR (p = 0.79);
p-values for comparison between women and men were all <0.001.
doi:10.1371/journal.pone.0167114.t001
Hip BMD and Body Composition in a Rural Indian Population
PLOS ONE | DOI:10.1371/journal.pone.0167114 January 6, 2017 5 / 11

association between hip BMD and fat mass in men adjusting for lean mass. There was clear
and consistent evidence for a positive association between hip BMD and lean mass. In models
examining association between hip BMD and fat to lean mass ratio (S1 Table), FLR was nega-
tively associated with hip BMD upon adjustment for total weight. Adjusting models for other
Table 2. Description of mean hip bone mineral density, osteopenia (%), and osteoporosis (%) by sex and age groups for the participants of the
Andhra Pradesh Parents and Children Study (2009–2012).
Women Men
age n BMD (g/cm2) osteopenia (%) osteoporosis (%) n BMD (g/cm2) osteopenia (%) osteoporosis (%) pa
20–29 666 0.84(0.1) 28.4 0.9 1164 0.95(0.11) 14.6 0.3 <0.001
30–39 204 0.86(0.1) 24.5 0.5 108 0.93(0.11) 25 0 <0.001
40–49 648 0.84(0.11) 30.9 1.1 253 0.92(0.12) 29.2 1.6 <0.001
50� 248 0.75(0.12) 51.2 14.9 516 0.89(0.12) 39.7 3.3 <0.001
BMD = bone mineral density (g/cm2).
All participants who had at least age and hip BMD data and were 20 years old or older were included in this table.
Osteopenia is defined as 1 to 2.5 standard deviations (sd) and osteoporosis as more than 2.5 sd below peak bone mass in a healthy Indian population for
each sex (reference hip BMD: women = 0.901±0.111; men = 0.988 ±0.131g/cm2).a Student t-test comparing hip BMD between sex within each age group was conducted.
Tukey’s honest significant difference test showed that hip BMD in the 20–30 and 30–40 year old groups were similar and higher than the�50 year old
groups for both men and women (p�0.001).
doi:10.1371/journal.pone.0167114.t002
Table 3. Association of hip bone mineral density (BMD) and fat and lean mass in the participants of
the Andhra Pradesh Parents and Children Study (2009–2012).
Model 1
β p
95% CI
Pre-menopausal women
Fat mass (kg) 0.025 0.01
(0.006 to 0.045)
Lean mass (kg) 0.009 <0.001
(0.008 to 0.011)
Post-menopausal women
Fat mass (kg) 0.045 0.008
(0.014 to 0.076)
Lean mass (kg) 0.01 <0.001
(0.007 to 0.012)
Men
Fat mass (kg) 0.001 0.92
(-0.012 to 0.014)
Lean mass (kg) 0.01 <0.001
(0.009 to 0.011)
Sample size: n = 1200 (pre-menopausal women); n = 560 (post-menopausal women); n = 2130 (men).
CI = confidence interval.
All models are multilevel models adjusting for household level clustering. εij and υj are errors terms for
multilevel regression models accounting for individual and household level differences:
Model: HIP BMD = β0 + β1 FAT MASS + β2 LEANMASS + β3 AGE + β4 HEIGHT + ε ij + υj
Age (years); Height (cm); Fat and lean mass (kg)
Fat mass (kg) has been log-transformed.
doi:10.1371/journal.pone.0167114.t003
Hip BMD and Body Composition in a Rural Indian Population
PLOS ONE | DOI:10.1371/journal.pone.0167114 January 6, 2017 6 / 11
potential confounders such as serum calcium and phosphorus levels, vegetarianism, tobacco
use, and parity (for women only) did not materially change the results on association between
hip BMD and fat mass.
Discussion
Hip bone mineral density was low in this relatively lean population in rural India. There was a
positive association between hip BMD and fat mass in women (who also had relatively higher
fat to lean mass ratio), but not in men. Higher hip BMD was consistently associated with
greater lean mass in this population.
Comparison to previous studies
A number of epidemiological studies have examined the association between bone and fat
mass: some showed no clear evidence of association while both positive and negative associ-
ations were also suggested [12,13,21–26]. As with many of the previous studies, we saw more
consistent evidence for a positive effect of lean mass than fat mass [24,27]. Previous studies
on Asian populations have shown attenuation of the association between BMD and fat mass
upon adjustment for lean mass, similarly to our findings [24,25,27–29]. Our study also
showed that for a given body size, lower fat to lean mass ratio may be associated with higher
hip BMD, which suggests that both body mass and composition may be important determi-
nants of healthy bone mass accrual. A large DXA study from China examined association
between bone mass and body composition in a similarly lean population [12]. In unadjusted
models, fat mass was positively associated with hip BMD, but on adjustment for body
weight, fat mass became negatively associated with hip BMD, similar to the findings from
our study.
Fat may have opposing effects on bone mass accrual through mechanical and biological
mechanisms. Positive association between mechanical loading and bone mass accrual have
been shown consistently in studies examining the effects of body mass and weight-bearing
physical activity [4,6,30–33]. The mechanostat theory suggests that weight causes structural
adaptation through local mechanical strain, which was supported by direct measurement of
mechanical strain in live animals and humans [5,33]. On the other hand, in vitro and in vivostudies have suggested several biological mechanisms underlying the association between fat
and bone mass. Osteoblasts and adipocytes originate in common stromal cells in bone mar-
row, suggesting plasticity between these two cell lineages [34]. Insufficiency in PPAR γ, a key
regulator for adipocyte differentiation, increased osteoblastogenesis in vitro and bone mass invivo [7]. Leptin is a hormone produced by adipocytes, regulating both fat distribution and
bone turnover through the hypothalamic neural networks [26].
The combined effect of mechanical and biological properties of fat on bone mass accrual
is not well-established in epidemiological studies [35] and may differ depending on sex,
menopausal status, and ethnicity. [36–38]. In our study, hip BMD was positively associated
with fat mass in women, but not in men. Certain fat hormones suggested to be beneficial for
bone mass accrual may be more strongly associated with bone mass accrual in women [23].
Another potential explanation may be that the amount of fat mass in men in this lean popu-
lation was too low to detect its contribution to hip BMD in the presence of lean mass. In an
Australian study, fat mass was also associated with hip BMD more consistently among
women than men [39]. Interestingly, the positive association was only seen in lean men
(BMI <25kg/m2); however, the male participants in this study, on average, had higher fat
mass (24.9±9.3kg/m2) than our study population (10.3±9kg/m2) [39]. Such distinct combi-
nations of body size and composition may have contributed to varying degrees of association
Hip BMD and Body Composition in a Rural Indian Population
PLOS ONE | DOI:10.1371/journal.pone.0167114 January 6, 2017 7 / 11
between bone and fat mass in our study population and the Australian population. A study
from the United States, where the men on average had greater fat mass and BMI than the
men in this study population, showed no strong evidence for a positive association between
BMD and fat mass and leptin in men while in women, adjustment for leptin attenuated the
association between BMD and fat mass [23]. These studies suggest that sexual dimorphism
may contribute to the varying degrees of association between fat and bone mass between
women and men.
The association between hip BMD and fat mass was also slightly greater in postmenopausal
than premenopausal women. Several studies have shown greater positive effects of fat mass in
postmenopausal women although underlying biological mechanisms are not well-understood
[38,40]. Adipose tissue is a key site for estrogen production in postmenopausal women [41].
Since estrogen has been suggested to play a role in the association between bone and fat mass,
this may partially explain the difference in the strengths of the association between premeno-
pausal and postmenopausal women [41,42].
It is important to note that this population had low hip BMD when compared to the values
in a healthier Indian population [20]. One potential explanation for this finding is that
although this rural community has become more developed and has been experiencing a
nutritional transition over the past decade, modest gain in weight and lean mass during mid to
late adulthood may not be able to fully mitigate adverse effects of undernutrition at younger
ages when the majority of bone mass accrual occurs. Our previous study showed that gain in
weight and lean mass in late adolescence and young adulthood was positively associated with
bone mass (unpublished data) but it is currently unknown how long the window of opportu-
nity to improve bone mass lasts.
Strengths and limitations
This study is one of the few large-scale DXA studies examining the Indian population. The
study subjects reside in an urbanizing rural community where there is a wide range of combi-
nations in body sizes and compositions, allowing assessment of the association between hip
BMD and fat mass in both underweight and overweight populations. The use of DXA provides
more accurate estimation of fat and lean mass than anthropometric measurements.
There are some limitations in this study as well. The cross-sectional nature of the study
does not allow causal inference. This community has been experiencing a nutritional transi-
tion due to urbanization over the past decade. There may be risk factors from the past that are
contributing to current bone mass, although, in young adults, our previous studies did not
find strong evidence for longitudinal effects of early life [43] and adolescent undernutrition
[44] on bone mass during adulthood after controlling for current body mass. The study popu-
lation was also lean compared to higher income countries [45]; therefore, our findings may
not be generalizable to other populations but the findings may be of interest to other lean pop-
ulations whose body compositions are more similar to this study population in India. Another
limitation is the lack of data on fractures and fat hormones, which would be of clinical and bio-
medical importance.
Conclusions
In this relatively lean population, hip BMD was associated with lean mass in both men and
women, but hip BMD was associated with fat mass in women only. Weight gain through lean
mass improvement may be a more reliable public health strategy for strengthening bone health
in transitional settings.
Hip BMD and Body Composition in a Rural Indian Population
PLOS ONE | DOI:10.1371/journal.pone.0167114 January 6, 2017 8 / 11

Supporting Information
S1 Table. Multilevel regression models examining association between hip bone mineral
density and fat to lean mass ratio in the participants of the Andhra Pradesh Parents and
Children Study (2009–2012).
(PDF)
Acknowledgments
We thank our dedicated field teams led by Santhi Bogadi and the study participants who made
this study possible. GDS’ work is supported by the Medical Research Council and the Univer-
sity of Bristol MC_UU_12013/1-9.
Author Contributions
Conceptualization: MM.
Formal analysis: MM.
Funding acquisition: HK KVR YBS SK.
Investigation: HK SK YBS GDS DP KVR.
Methodology: BK HK JCW GBP PP VG GKW AA DP GDS KVR YBS SK.
Project administration: HK SK KVR PP VG GKW AA.
Supervision: SK.
Writing – original draft: MM.
Writing – review & editing: MM BK HK JCW GBP PP VG GKW AA DP GDS KVR YBS SK.
References1. Braithwaite RS, Col NF, Wong JB. Estimating Hip Fracture Morbidity, Mortality and Costs. J Am Geriatr
Soc. 2003; 51: 364–370. PMID: 12588580
2. Cooper C, Campion G, M DLJ Iii. Hip fractures in the elderly: A world-wide projection. Osteoporos Int.
1992; 2: 285–289. PMID: 1421796
3. Johnell O, Kanis JA, Oden A, Johansson H, De Laet C, Delmas P, et al. Predictive Value of BMD for Hip
and Other Fractures. J Bone Miner Res. 2005; 20: 1185–1194. doi: 10.1359/JBMR.050304 PMID:
15940371
4. Felson DT, Zhang Y, Hannan MT, Anderson JJ. Effects of weight and body mass index on bone mineral
density in men and women: the Framingham study. J Bone Miner Res Off J Am Soc Bone Miner Res.
1993; 8: 567–573.
5. Frost HM. The Utah paradigm of skeletal physiology: an overview of its insights for bone, cartilage and
collagenous tissue organs. J Bone Miner Metab. 2000; 18: 305–316. PMID: 11052462
6. Hughes JM, Petit MA. Biological underpinnings of Frost’s mechanostat thresholds: the important role of
osteocytes. J Musculoskelet Neuronal Interact. 2010; 10: 128–135. PMID: 20516629
7. Akune T, Ohba S, Kamekura S, Yamaguchi M, Chung U-I, Kubota N, et al. PPARgamma insufficiency
enhances osteogenesis through osteoblast formation from bone marrow progenitors. J Clin Invest.
2004; 113: 846–855. doi: 10.1172/JCI19900 PMID: 15067317
8. Pei L, Tontonoz P. Fat’s loss is bone’s gain. J Clin Invest. 2004; 113: 805–806. doi: 10.1172/JCI21311
PMID: 15067310
9. Takeda S, Elefteriou F, Levasseur R, Liu X, Zhao L, Parker KL, et al. Leptin regulates bone formation
via the sympathetic nervous system. Cell. 2002; 111: 305–317. PMID: 12419242
10. Parhami F, Morrow AD, Balucan J, Leitinger N, Watson AD, Tintut Y, et al. Lipid Oxidation Products
Have Opposite Effects on Calcifying Vascular Cell and Bone Cell Differentiation : A Possible
Hip BMD and Body Composition in a Rural Indian Population
PLOS ONE | DOI:10.1371/journal.pone.0167114 January 6, 2017 9 / 11
Explanation for the Paradox of Arterial Calcification in Osteoporotic Patients. Arterioscler Thromb Vasc
Biol. 1997; 17: 680–687. PMID: 9108780
11. Liu J-M, Zhao H-Y, Ning G, Zhao Y-J, Zhang L-Z, Sun L-H, et al. Relationship between body composi-
tion and bone mineral density in healthy young and premenopausal Chinese women. Osteoporos Int.
2004; 15: 238–242. doi: 10.1007/s00198-003-1536-7 PMID: 14727013
12. Hsu Y-H, Venners SA, Terwedow HA, Feng Y, Niu T, Li Z, et al. Relation of body composition, fat mass,
and serum lipids to osteoporotic fractures and bone mineral density in Chinese men and women. Am J
Clin Nutr. 2006; 83: 146–154. PMID: 16400063
13. Reid IR. Relationships between fat and bone. Osteoporos Int. 2008; 19: 595–606. doi: 10.1007/s00198-
007-0492-z PMID: 17965817
14. Nguyen TV, Howard GM, Kelly PJ, Eisman JA. Bone mass, lean mass, and fat mass: same genes or
same environments? Am J Epidemiol. 1998; 147: 3–16. PMID: 9440393
15. Compston JE, Watts NB, Chapurlat R, Cooper C, Boonen S, Greenspan S, et al. Obesity Is Not Protec-
tive against Fracture in Postmenopausal Women: GLOW. Am J Med. 2011; 124: 1043–1050. doi: 10.
1016/j.amjmed.2011.06.013 PMID: 22017783
16. Wang J, Thornton JC, Russell M, Burastero S, Heymsfield S, Pierson RN. Asians have lower body
mass index (BMI) but higher percent body fat than do whites: comparisons of anthropometric measure-
ments. Am J Clin Nutr. 1994; 60: 23–28. PMID: 8017333
17. Kinra S, Krishna KR, Kuper H, Sarma KR, Prabhakaran P, Gupta V, et al. Cohort Profile: Andhra Pra-
desh Children and Parents Study (APCAPS). Int J Epidemiol. 2013; dyt128.
18. Kinra S, Rameshwar Sarma KV, Ghafoorunissa, Mendu VVR, Ravikumar R, Mohan V, et al. Effect of
integration of supplemental nutrition with public health programmes in pregnancy and early childhood
on cardiovascular risk in rural Indian adolescents: long term follow-up of Hyderabad nutrition trial. BMJ.
2008; 337: a605. doi: 10.1136/bmj.a605 PMID: 18658189
19. The International Institute for Population Sciences. India National Family Health Survey 1998–99
(NFHS-2) [Internet]. [cited 11 Sep 2015]. http://dhsprogram.com/pubs/pdf/FRIND2/FRIND2.pdf
20. Mukherjee A, Mathur A. Population based reference standards of peak bone mineral density of indian
males and females. ICMR Bull. 2011; http://www.thefreelibrary.com/Population+based+reference
+standards+of+peak+bone+mineral+density+of. . .-a0274521389
21. Reid IR, Ames RW, Evans MC, Sharpe SJ, Gamble GD. Determinants of the rate of bone loss in normal
postmenopausal women. J Clin Endocrinol Metab. 1994; 79: 950–954. doi: 10.1210/jcem.79.4.
7962303 PMID: 7962303
22. Blum M, Harris SS, Must A, Naumova EN, Phillips SM, Rand WM, et al. Leptin, Body Composition and
Bone Mineral Density in Premenopausal Women. Calcif Tissue Int. 2003; 73: 27–32. PMID: 14506951
23. Thomas T, Burguera B, Melton LJ III, Atkinson EJ, O’Fallon WM, Riggs BL, et al. Role of serum leptin,
insulin, and estrogen levels as potential mediators of the relationship between fat mass and bone min-
eral density in men versus women. Bone. 2001; 29: 114–120. PMID: 11502471
24. Douchi T, Kuwahata R, Matsuo T, Uto H, Oki T, Nagata Y. Relative contribution of lean and fat mass
component to bone mineral density in males. J Bone Miner Metab. 2003; 21: 17–21. doi: 10.1007/
s007740300003 PMID: 12491089
25. Ho-Pham LT, Nguyen ND, Lai TQ, Nguyen TV. Contributions of lean mass and fat mass to bone mineral
density: a study in postmenopausal women. BMC Musculoskelet Disord. 2010; 11: 59. doi: 10.1186/
1471-2474-11-59 PMID: 20346165
26. Rosen CJ, Klibanski A. Bone, Fat, and Body Composition: Evolving Concepts in the Pathogenesis of
Osteoporosis. Am J Med. 2009; 122: 409–414. doi: 10.1016/j.amjmed.2008.11.027 PMID: 19375545
27. Wang MC, Bachrach LK, Van Loan M, Hudes M, Flegal KM, Crawford PB. The relative contributions of
lean tissue mass and fat mass to bone density in young women. Bone. 2005; 37: 474–481. doi: 10.
1016/j.bone.2005.04.038 PMID: 16040285
28. Namwongprom S, Rojanasthien S, Mangklabruks A, Soontrapa S, Wongboontan C, Ongphiphadhana-
kul B. Effect of fat mass and lean mass on bone mineral density in postmenopausal and perimen-
opausal Thai women. Int J Womens Health. 2013; 5: 87–92. doi: 10.2147/IJWH.S41884 PMID:
23467695
29. Ho-Pham LT, Nguyen UDT, Nguyen TV. Association Between Lean Mass, Fat Mass, and Bone Mineral
Density: A Meta-analysis. J Clin Endocrinol Metab. 2013; 99: 30–38. doi: 10.1210/jc.2013-3190 PMID:
24384013
30. Hannan MT, Felson DT, Dawson-Hughes B, Tucker KL, Cupples LA, Wilson PWF, et al. Risk Factors
for Longitudinal Bone Loss in Elderly Men and Women: The Framingham Osteoporosis Study. J Bone
Miner Res. 2000; 15: 710–720. doi: 10.1359/jbmr.2000.15.4.710 PMID: 10780863
Hip BMD and Body Composition in a Rural Indian Population
PLOS ONE | DOI:10.1371/journal.pone.0167114 January 6, 2017 10 / 11

31. Taaffe DR, Snow-Harter C, Connolly DA, Robinson TL, Brown MD, Marcus R. Differential effects of
swimming versus weight-bearing activity on bone mineral status of eumenorrheic athletes. J Bone
Miner Res Off J Am Soc Bone Miner Res. 1995; 10: 586–593.
32. Bailey DA, McKay HA, Mirwald RL, Crocker PR, Faulkner RA. A six-year longitudinal study of the rela-
tionship of physical activity to bone mineral accrual in growing children: the university of Saskatchewan
bone mineral accrual study. J Bone Miner Res. 1999; 14: 1672–1679. doi: 10.1359/jbmr.1999.14.10.
1672 PMID: 10491214
33. Meakin LB, Price JS, Lanyon LE. The Contribution of Experimental in vivo Models to Understanding the
Mechanisms of Adaptation to Mechanical Loading in Bone. Front Endocrinol. 2014; 5.
34. Nuttall ME, Patton AJ, Olivera DL, Nadeau DP, Gowen M. Human trabecular bone cells are able to
express both osteoblastic and adipocytic phenotype: implications for osteopenic disorders. J Bone
Miner Res Off J Am Soc Bone Miner Res. 1998; 13: 371–382.
35. Lanyon LE, Sugiyama T, Price JS. Regulation of bone mass: Local control or systemic influence or
both? IBMS BoneKEy. 2009; 6: 218–226.
36. Lu H, Fu X, Ma X, Wu Z, He W, Wang Z, et al. Relationships of percent body fat and percent trunk fat
with bone mineral density among Chinese, black, and white subjects. Osteoporos Int. 2011; 22: 3029–
3035. doi: 10.1007/s00198-010-1522-9 PMID: 21243336
37. Reid IR, Plank LD, Evans MC. Fat mass is an important determinant of whole body bone density in pre-
menopausal women but not in men. J Clin Endocrinol Metab. 1992; 75: 779–782. doi: 10.1210/jcem.75.
3.1517366 PMID: 1517366
38. Douchi T, Oki T, Nakamura S, Ijuin H, Yamamoto S, Nagata Y. The effect of body composition on bone
density in pre- and postmenopausal women. Maturitas. 1997; 27: 55–60. PMID: 9158078
39. Zhu K, Hunter M, James A, Lim EM, Walsh JP. Associations between body mass index, lean and fat
body mass and bone mineral density in middle-aged Australians: The Busselton Healthy Ageing Study.
Bone. 2015; 74: 146–152. doi: 10.1016/j.bone.2015.01.015 PMID: 25652209
40. Aloia JF, Vaswani A, Ma R, Flaster E. To what extent is bone mass determined by fat-free or fat mass?
Am J Clin Nutr. 1995; 61: 1110–1114. PMID: 7733036
41. Nelson LR, Bulun SE. Estrogen production and action. J Am Acad Dermatol. 2001; 45: S116–124.
PMID: 11511861
42. Riggs BL, Khosla S, Melton LJ. A unitary model for involutional osteoporosis: estrogen deficiency
causes both type I and type II osteoporosis in postmenopausal women and contributes to bone loss in
aging men. J Bone Miner Res Off J Am Soc Bone Miner Res. 1998; 13: 763–773.
43. Matsuzaki M, Kuper H, Kulkarni B, Radhakrishna K, Viljakainen H, Taylor AE, et al. Life-course determi-
nants of bone mass in young adults from a transitional rural community in India: the Andhra Pradesh
Children and Parents Study (APCAPS). Am J Clin Nutr. 2014; 99: 1450–1459. doi: 10.3945/ajcn.113.
068791 PMID: 24695898
44. Matsuzaki M, Kuper H, Kulkarni B, Ploubidis GB, Wells JC, Radhakrishna KV, et al. Adolescent under-
nutrition and early adulthood bone mass in an urbanizing rural community in India. Arch Osteoporos.
2015; 10: 232. doi: 10.1007/s11657-015-0232-5 PMID: 26323265
45. Flegal KM, Shepherd JA, Looker AC, Graubard BI, Borrud LG, Ogden CL, et al. Comparisons of per-
centage body fat, body mass index, waist circumference, and waist-stature ratio in adults. Am J Clin
Nutr. 2009; 89: 500–508. PMID: 19116329
Hip BMD and Body Composition in a Rural Indian Population
PLOS ONE | DOI:10.1371/journal.pone.0167114 January 6, 2017 11 / 11