Maths for Biology
32
Maths for Biology January 9 th 2016 ASE Carys Hughes Christian Bokhove Hilary Otter Rebecca D’Silva Nicky Miller
-
Upload
christian-bokhove -
Category
Education
-
view
307 -
download
0
Transcript of Maths for Biology
Maths for Biology
January 9th 2016 ASE
Carys HughesChristian Bokhove
Hilary OtterRebecca D’Silva
Nicky Miller
Introductions
• Carys Hughes• Christian Bokhove• Hilary Otter• Rebecca D’Silva• Nicky Miller
This study
• Design a CPD course on Maths for A level Biology
• Involve teachers in its design• Implement the day• Evaluate impact of the two groups of
teachers.

Why this day
• Changes in the A level Biology curriculum• More maths• Maths used interdisciplinary• Principles– Instruction but also hands-on tasks– Collaborative, doing it together, ask questions– Want to customise the course to where you
need support
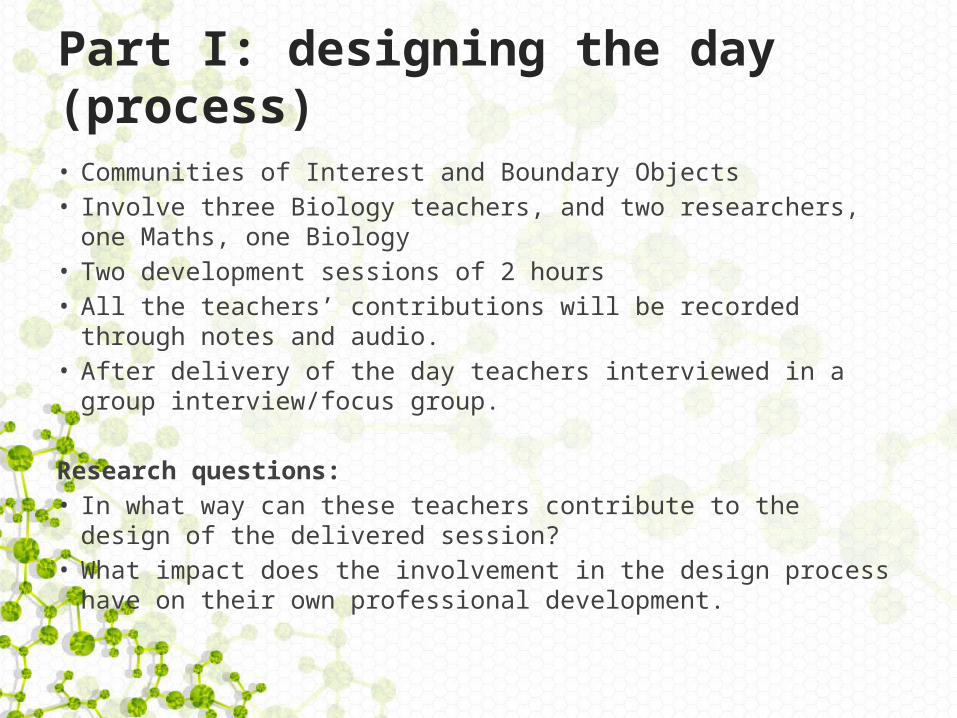
Part I: designing the day (process)• Communities of Interest and Boundary Objects• Involve three Biology teachers, and two researchers, one Maths,
one Biology• Two development sessions of 2 hours• All the teachers’ contributions will be recorded through notes
and audio.• After delivery of the day teachers interviewed in a group
interview/focus group.
Research questions:• In what way can these teachers contribute to the design of the
delivered session?• What impact does the involvement in the design process have
on their own professional development.

Part 2: delivery of the CPD day (product)• 20-30 teachers• Whole day, free• Focus on exponentials/logarithms and statistics
(came from the design part with teachers)• Data collection: maths confidence, evaluation,
impact
Research question:• What impact does a CPD day on maths for the new
Biology A-level curriculum have on participant’s maths confidence and teaching practice?

• Update and strengthen knowledge on some topics for the new Biology A level curriculum;– Exponential growth and decay, logarithms– Statistical tests
• Hear and discuss ideas for teaching them;• Want to hear your opinions for
improvements;• You leave with:– Ideas, knowledge and some resources

Example of data collectionFocus group questions• What, in your view, did you manage to contribute to the design of
the CPD session?• What impact, in your opinion, did the involvement in the design
process have on their own professional development. – Did have an impact on your confidence in teaching Biology?– And the maths component in particular? (engagement,
confidence, liking, valuing)• What impact, in your opinion, did the participation in the whole
project (including the actual CPD day) have on their own professional development.– Did have an impact on your confidence in teaching Biology?– And the maths component in particular? (engagement,
confidence, liking, valuing)• Did you feel the whole process has had an impact on students?
– Engagement with maths? Confidence in maths? Liking maths? – Valuing maths?
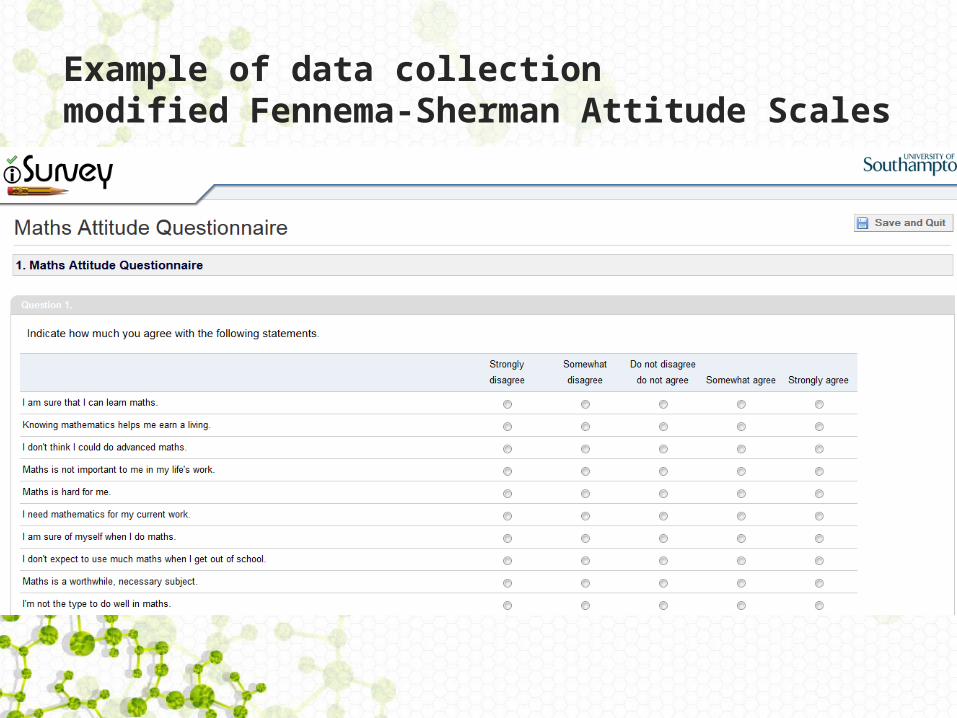
Example of data collectionmodified Fennema-Sherman Attitude Scales

Tentative findings: process
• Usefulness of the Community of Interest• Knowledge acquisition• Improved confidence in teaching the
maths in A level biology• Better understanding of the processes
involved in the calculations
Tentative findings: product/day• Valued content exponentials/logarithms• More confident statistics but worthwhile to
compare and discuss pedagogy• On confidence:– They think they can learn maths– They think it's important and worthwhile– They need maths for their work– But it's hard!– So need support.
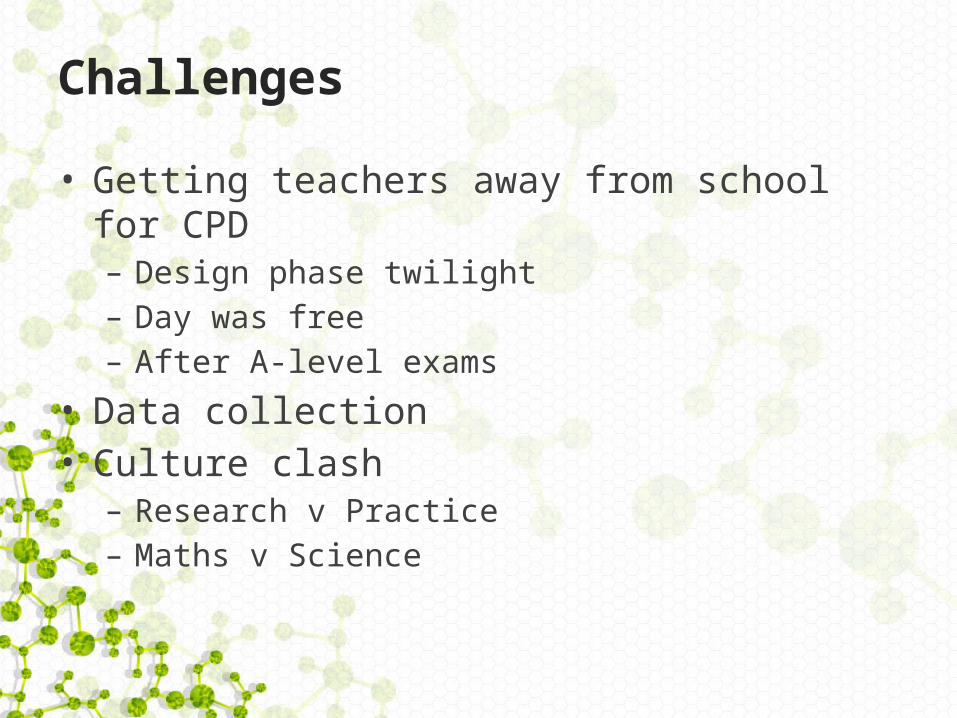
Challenges
• Getting teachers away from school for CPD– Design phase twilight– Day was free– After A-level exams
• Data collection• Culture clash– Research v Practice– Maths v Science

Taster from the CPD day

Powers and exponential
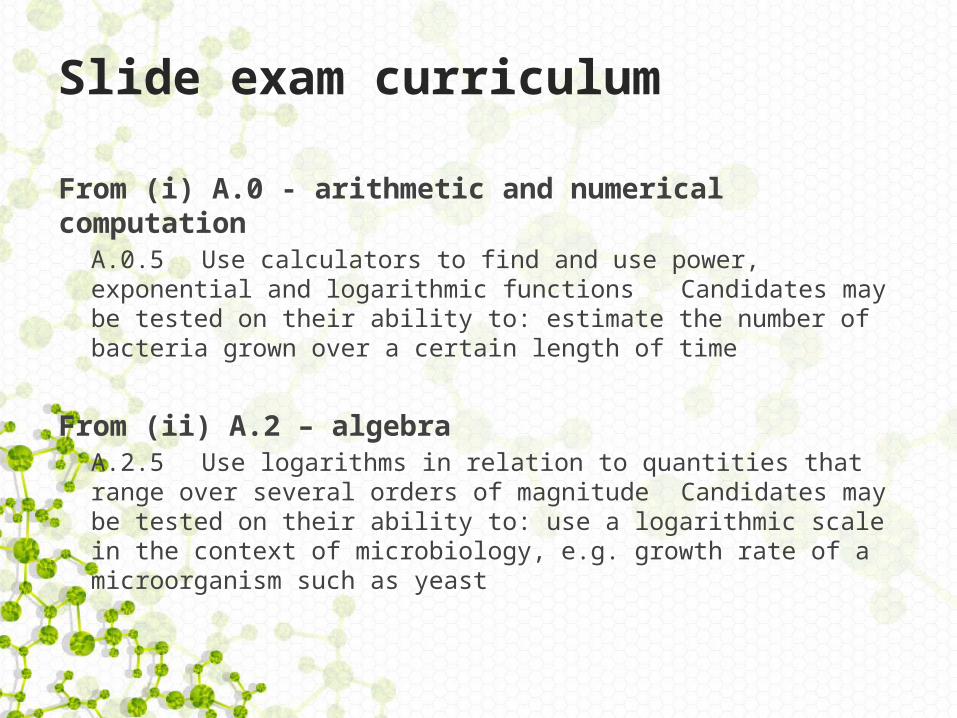
Slide exam curriculum
From (i) A.0 - arithmetic and numerical computation
A.0.5 Use calculators to find and use power, exponential and logarithmic functions Candidates may be tested on their ability to: estimate the number of bacteria grown over a certain length of time
From (ii) A.2 – algebra A.2.5 Use logarithms in relation to quantities that range over several orders of magnitude Candidates may be tested on their ability to: use a logarithmic scale in the context of microbiology, e.g. growth rate of a microorganism such as yeast
Powers of 10Movie on youtube
Ther
e is
a ne
wer
ver
sion
calle
d Co
smic
Voy
age,
nar
rate
d by
M
orga
n Fr
eem
an. I
t, ho
wev
er, d
oes n
ot h
ave
the
stan
dard
not
ation
in
clud
ed.

17
ACTIVITY
Exponentials
Take an A4 sheet of paper.
How many times can you fold it in half?

MYTHBUSTERS
Movie on youtube

19
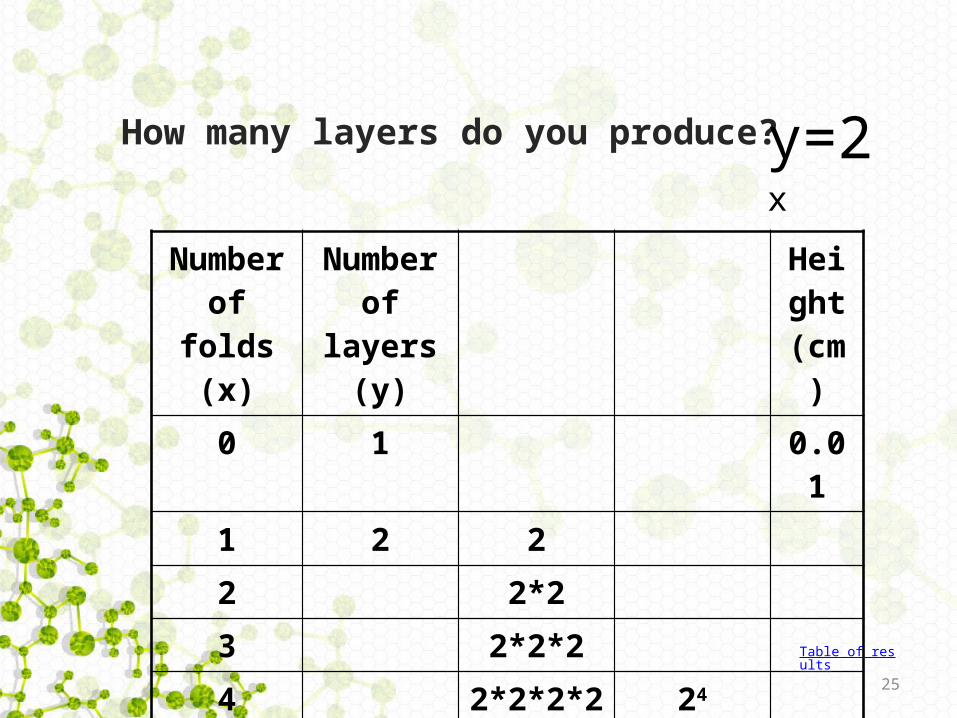
How many layers do you produce? HANDOUT
Number of folds
(x)
Number of layers
(y)
Mult Power Height
(cm)0 1 0.011 2 22 2*23 2*2*24 2*2*2*2 24
5
Table of results
H

20
Plot your values on graph paper:
- 3 - 2 - 1 1 2 3 4 5 6 7 8
- 100
100
200
300
x
y
- 3 - 2 - 1 1 2 3 4 5 6 7 8
- 100
100
200
300
x
y

21
Exponential growth
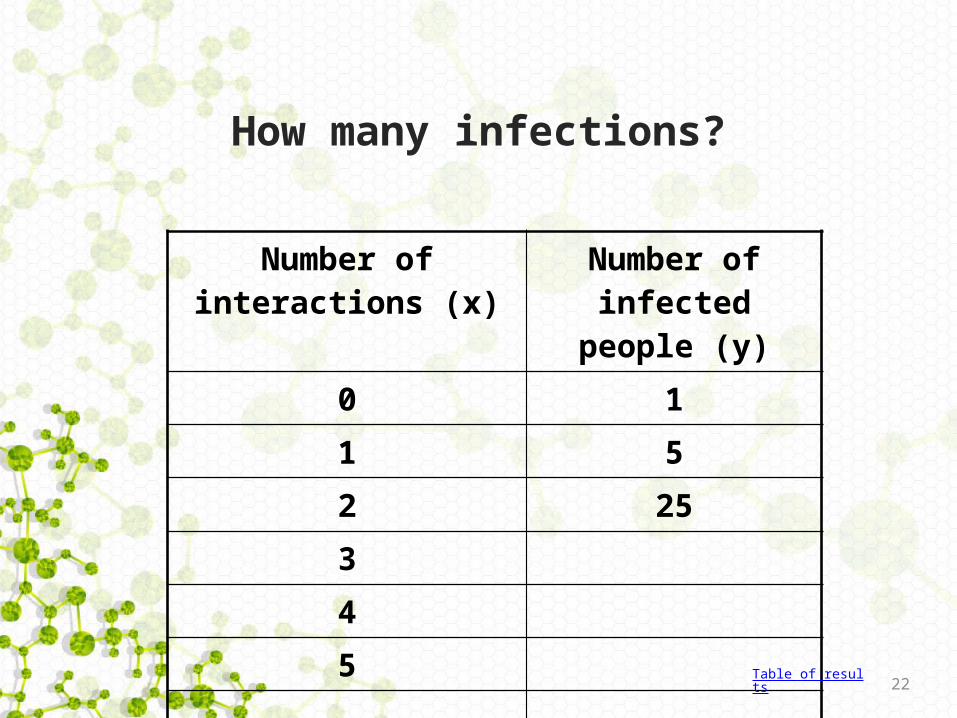
Imagine you contracted a virus (such as SARS) where you infected the first five people that you met, and they each infected the first five people that they met and so on…. There are 186,701 people living in Southampton. How many interactions would it take until everyone was infected?
22
How many infections?
Number of interactions (x)
Number of infected people (y)
0 11 52 25345
Table of results

23
General form:
y=bt
where b is the base and x is the power (or exponent)

24
The exponential graph
- 2 2 4 6 8
- 200
200
400
x
y
ACTIVITY: Use Desmos or Geogebra online to graph
25
How many layers do you produce?
Number of folds
(x)
Number of layers
(y)
Height
(cm)0 1 0.011 2 22 2*23 2*2*24 2*2*2*2 24
5
Table of results
y=2x

26
Common features of y=bx
all curves pass through (0,1)exponential growth (and decay) takes place very rapidlyb > 0b 0b 1b > 1 has a positive gradient (PLOT THIS!)0 < b < 1 has a negative gradient (PLOT THIS!)
https://www.desmos.com/calculator/auubsaje fh
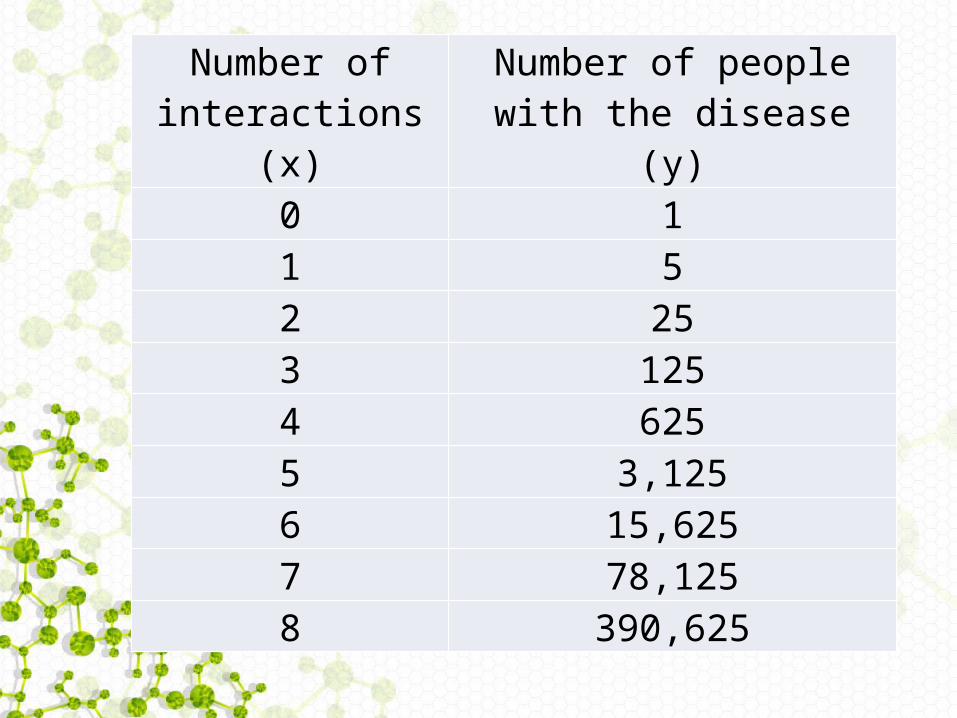
Number of interactions (x)
Number of people with the disease (y)
0 11 52 253 1254 6255 3,1256 15,6257 78,1258 390,625

Statistics
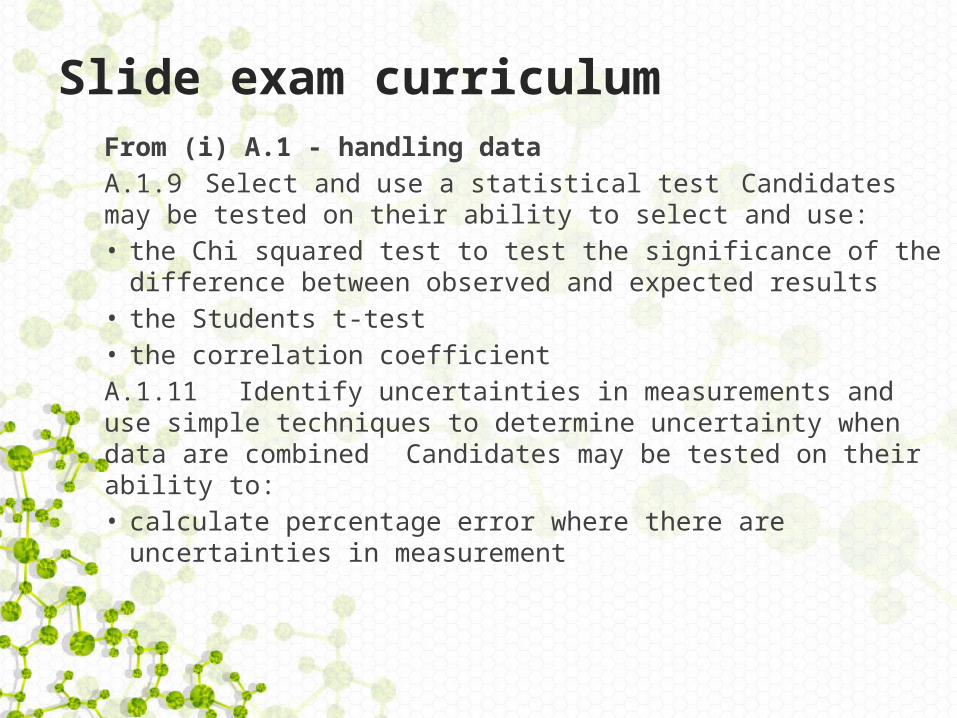
Slide exam curriculumFrom (i) A.1 - handling data A.1.9 Select and use a statistical test Candidates may be tested on their ability to select and use: • the Chi squared test to test the significance of the
difference between observed and expected results • the Students t-test • the correlation coefficient A.1.11 Identify uncertainties in measurements and use simple techniques to determine uncertainty when data are combined Candidates may be tested on their ability to: • calculate percentage error where there are uncertainties
in measurement

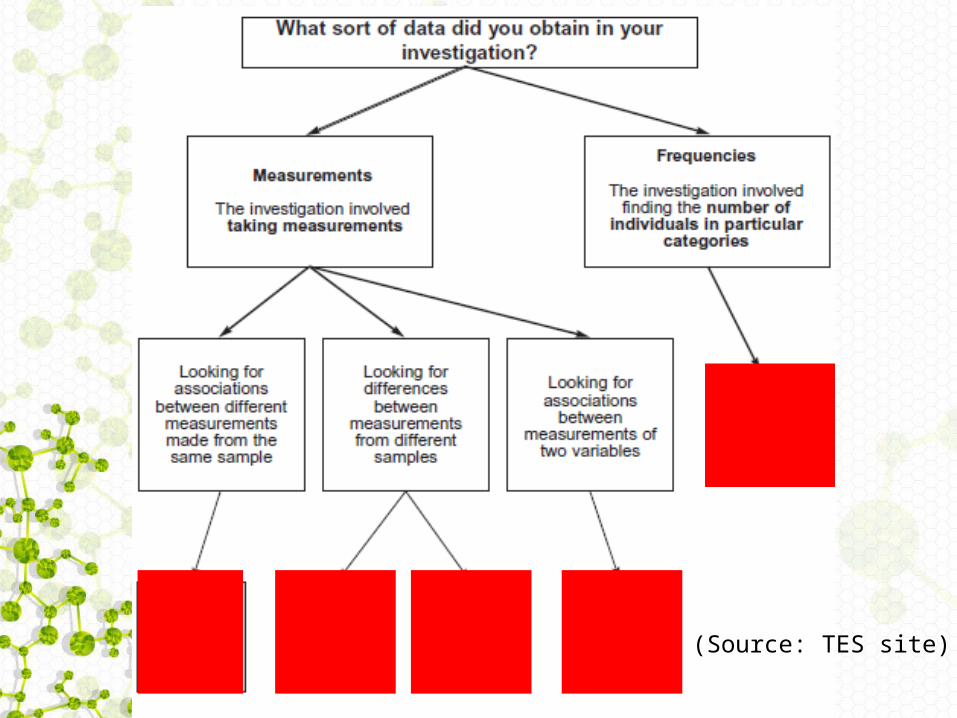
Statistical tests
• Type of data collected– Measurements– Frequencies
• What are you looking for?– Associations– Differences
(Source: TES site)
(Source: TES site)
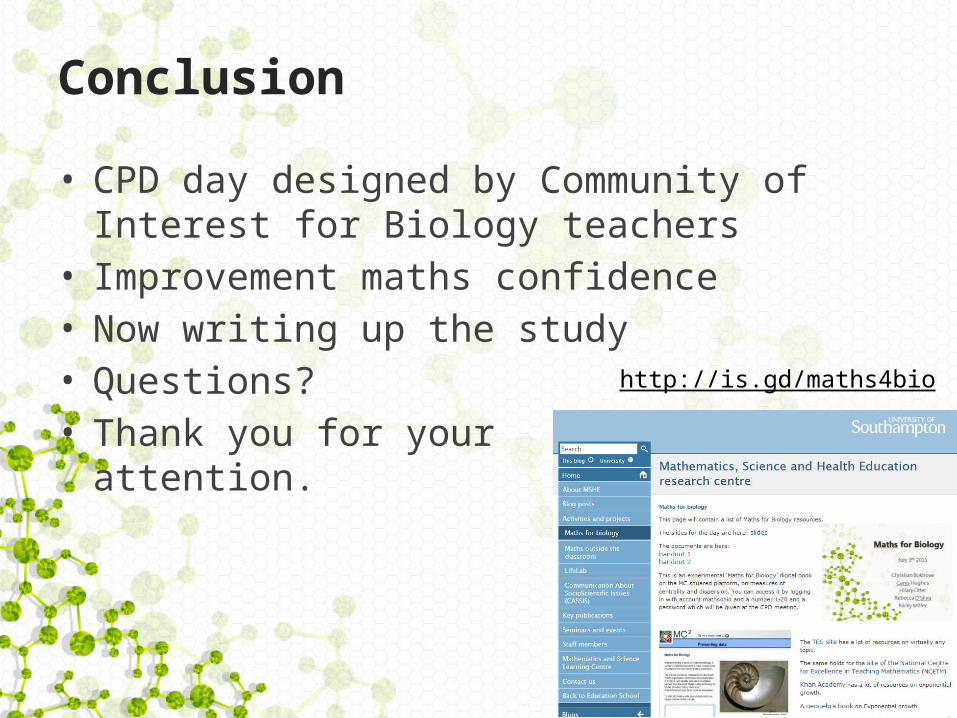
Conclusion
• CPD day designed by Community of Interest for Biology teachers
• Improvement maths confidence• Now writing up the study• Questions?• Thank you for your
attention.
http://is.gd/maths4bio