MATHEMATICS PARENT GUIDE - Medinah School … PARENT GUIDE - Grade 74.pdfConstruct viable arguments...
39
MATHEMATICS PARENT GUIDE SEVENTH GRADE Medinah School District # 11
Transcript of MATHEMATICS PARENT GUIDE - Medinah School … PARENT GUIDE - Grade 74.pdfConstruct viable arguments...

MATHEMATICS PARENT GUIDE
SEVENTH GRADE
Medinah School District # 11

TABLE OF CONTENTS
Mathematics Philosophy………………………………………………………………………….2
Best Practices - Characteristics of Mathematically Proficient Students……….…….….3
Progressions of Concepts…………………………………………………………………………4
Grade-Level Introductory Letters..…………………………………………………………….. 5
Grade-Level Vocabulary…………………………………………………………………………6
Kindergarten First Grade Second Grade Third Grade Fourth Grade Fifth Grade Sixth Grade Seventh Grade Eighth Grade Grade Level Standards – Core Essentials……………………..……………………….…..….7
Kindergarten First Grade Second Grade Third Grade Fourth Grade Fifth Grade Sixth Grade Seventh Grade Eighth Grade Assessment………………………………………………………..…………………………………8

Philosophy
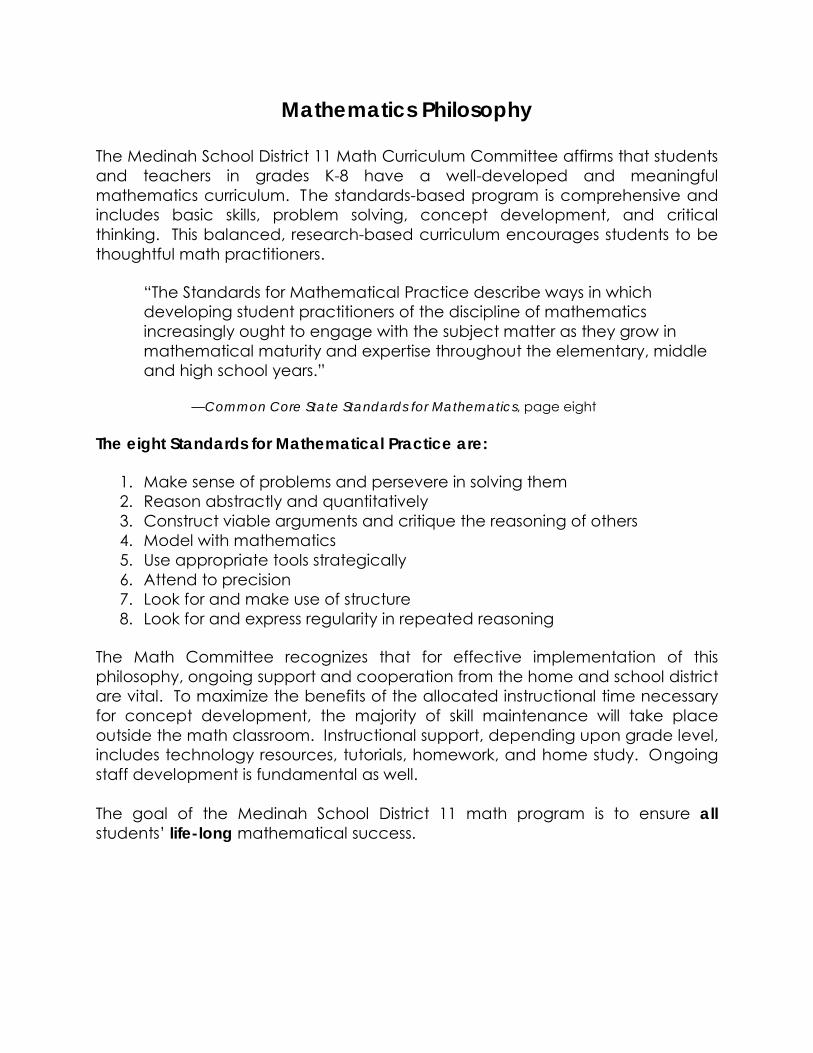
Mathematics Philosophy
The Medinah School District 11 Math Curriculum Committee affirms that students and teachers in grades K-8 have a well-developed and meaningful mathematics curriculum. The standards-based program is comprehensive and includes basic skills, problem solving, concept development, and critical thinking. This balanced, research-based curriculum encourages students to be thoughtful math practitioners.
“The Standards for Mathematical Practice describe ways in which developing student practitioners of the discipline of mathematics increasingly ought to engage with the subject matter as they grow in mathematical maturity and expertise throughout the elementary, middle and high school years.”
—Common Core State Standards for Mathematics, page eight
The eight Standards for Mathematical Practice are:
1. Make sense of problems and persevere in solving them 2. Reason abstractly and quantitatively 3. Construct viable arguments and critique the reasoning of others 4. Model with mathematics 5. Use appropriate tools strategically 6. Attend to precision 7. Look for and make use of structure 8. Look for and express regularity in repeated reasoning
The Math Committee recognizes that for effective implementation of this philosophy, ongoing support and cooperation from the home and school district are vital. To maximize the benefits of the allocated instructional time necessary for concept development, the majority of skill maintenance will take place outside the math classroom. Instructional support, depending upon grade level, includes technology resources, tutorials, homework, and home study. Ongoing staff development is fundamental as well. The goal of the Medinah School District 11 math program is to ensure all students’ life-long mathematical success.

Best
Practices

Characteristics of Mathematically Proficient Students1
Standards for Mathematical
Practice
Student Characteristics
1. Make sense of problems and persevere in solving them.
Mathematically proficient students can o Explain the meaning of a problem and restate it in their
words. o Analyze given information to develop possible strategies
for solving the problem. o Identify and execute appropriate strategies to solve the
problem. o Evaluate progress toward the solution and make revisions
if necessary. o Check for accuracy and reasonableness of work,
strategy and solution. o Understand and connect strategies used by others to
solve problems.
2. Reason abstractly and quantitatively.
Mathematically proficient students can o Translate given information to create a mathematical
representation for a concept. o Manipulate the mathematical representation by showing
the process considering the meaning of the quantities involved.
o Recognize the relationships between numbers/quantities within the process to evaluate a problem.
o Review the process for reasonableness within the original context.
3. Construct viable arguments and critique the reasoning of others.
Mathematically proficient students can o Use observations and prior knowledge (stated
assumptions, definitions, and previous established results) to make conjectures and construct arguments.
o Compare and contrast logical arguments and identify which one makes the most sense.
o Justify (orally and in written form) the approach used, including how it fits in the context from which the data arose.

o Listen, understand, analyze, and respond to the arguments of others.
o Identify and explain both correct and flawed logic. o Recognize and use counterexamples to refine
assumptions or definitions and dispute or disprove an argument.
4. Model with mathematics.
Mathematically proficient students can o Use a variety of methods to model, represent, and solve
real-world problems. o Simplify a complicated problem by making assumptions
and approximations. o Interpret results in the context of the problem and revise
the model if necessary. o Choose a model that is both appropriate and efficient to
arrive at one or more desired solutions.
5. Use appropriate tools strategically.
Mathematically proficient students can o Identify mathematical tools and recognize their strengths
and weaknesses. o Select and use appropriate tools to best model/solve
problems. o Use estimation to predict reasonable solutions and/or
detect errors. o Identify and successfully use external mathematical
resources to pose or solve problems. o Use a variety of technologies, including digital content,
to explore, confirm, and deepen conceptual understanding.
6. Attend to precision. Mathematically proficient students can o Understand symbols and use them consistently within the
context of a problem. o Calculate answers efficiently and accurately and label
them appropriately. o Formulate precise explanations (orally and in written
form) using both mathematical representations and words.
o Communicate using clear mathematical definitions, vocabulary, and symbols.

7. Look for and make use of structure.
Mathematically proficient students can o Look for, identify, and accept patterns or structure within
relationships. o Use patterns or structure to make sense of mathematics
and connect prior knowledge to similar situations and extend to novel situations.
o Analyze a complex problem by breaking it down into smaller parts.
o Reflect on the problem as a whole and shift perspective as needed.
8. Look for and express regularity in repeated reasoning.
Mathematically proficient students can o Recognize similarities and patterns in repeated trials
with a process. o Generalize the process to create a shortcut which
may lead to developing rules or creating a formula. o Evaluate the reasonableness of results throughout the
mathematical process while attending to the details.
1http://www.ocde.us/CommonCoreCA/Documents/mathematicalpractices _characteristicsofproficientstudent_wisconson.pdf

Progression of
Concepts

KDG
1st
2nd
3rd
4th
5th
6th
7th
8th
Coun
ting
and
Card
inal
ity
K-8
M
ATH
Prog
ress
ion
of C
once
pts
Ratio
s and
Pro
port
iona
l Rel
atio
nshi
ps
Num
bers
and
Ope
ratio
ns: F
ract
ions
Num
bers
and
Ope
ratio
ns in
Bas
e Te
n
The
Num
ber S
yste
ms
Func
tion
Mea
sure
men
t and
Dat
aSt
atis
tics a
nd P
roba
bilit
y
Ope
ratio
ns a
nd A
lgeb
raic
Thi
nkin
g
Expr
essi
ons a
nd E
quat
ions
Geo
met
ry

Introductory Letter
by Grade Level

Seventh Grade
CMP 3 MATH Common Core
CMP3 Math Common Core is a focused and coherent mathematics curriculum that provides in-depth instruction on a limited number of important categories of mathematics content. The program revolves around Big Ideas in mathematics that children need to know, and shows how these ideas are related. To convey the power of Big Ideas to students, they are translated into student-friendly Essential Questions presented at the beginning of each topic. Throughout the topic, numerous smaller ideas (called Essential Understandings) are linked into a coherent whole. Application of the eight math practices are weaved into every topic.
CMP3 MATH Topic 1 Accentuate the Negative:
Integers and Rational Numbers
Topic 2 Stretching and Shrinking: Understanding Similarity
Topic 3 Comparing and Scaling: Ratios, Rates, Percents & Proportions
Topic 4 Moving Straight Ahead: Linear Relationships
Topic 5 What Do you Expect?: Probability and Expected Value
Home School Connection:
Parent tutorial: http://mypearsontraining.com/products/pearsonrealize/tutorials.asp?page=students
Parents and students will also have online access to math videos, manipulatives, quizzes, and other resources. Look for upcoming information from your child’s teacher that includes a username and password. www.pearsonrealize.com
Standards for Mathematical Practice
Make sense of problems and persevere in solving them.
Reason abstractly and quantitatively. Construct viable arguments and
critique the reasoning of others. Model with mathematics. Use appropriate tools strategically. Attend to precision. Look for and make use of structure. Look for and express regularity in
repeated reasoning.

Vocabulary

Common Core Vocabulary Grade 7
Accentuate the Negative: Integers and Rational Numbers
• Absolute Value • Additive Inverses • Commutative Property • Distributive Property • Expanded Form • Factored Form • Integers • Multiplicative Identity • Multiplicative Inverse • Negative Number • Number Sentence • Opposites • Order of Operation • Positive Number • Rational Number
Stretching and Shrinking: Understanding Similarity
• Adjacent Sides • Corresponding Angles • Corresponding Sides • Equivalent Ratios • Image • Midpoint • Nested Triangle • Proportion • Ratio • Rep-Tile • Scale Drawing • Scale Factor • Similar
Comparing and Scaling: Ratios, Rates, Percents & Proportions
• Commission • Constant of Proportionality • Equation • Part-to-Part Ratio
Comparing and Scaling: Ratios, Rates, Percents & Proportions cont.
• Part-to-Whole Ratio • Proportion • Rate • Rate Table • Ratio • Unit Rate
Moving Straight Ahead: Linear Relationships
• Coefficient • Dependent Variable • Equivalent Expressions • Independent Variable • Inequality • Linear Relationship • Point of Intersection • Properties of Equality • Slope • Solution of an Equation • X-Intercept • Y-Intercept
What Do You Expect?: Probability and Expected Value
• Area Model • Binomial Probability • Compound Event • Equally Likely • Expected Value • Experimental Probability • Fair Game • Favorable Outcome • Outcome • Probability • Relative Frequency • Sample Space • Simulation • Theoretical Probability • Tree Diagram • Trial

Core
Essentials

Seventh Grade Math: Core Essentials
CMP3 Shapes and Designs
Properties of Polygons: Understand the properties of polygons that affect their shape
Goal Standard
Explore the ways that polygons are sorted into families according to the number and length of their sides and the size of their angles
Explore the patterns among interior and exterior angles of a polygon
Explore the patterns among side lengths in a polygon
Investigate the symmetries of a shape—rotation or reflection
Determine which polygons fit together to cover a flat surface and why
Reason about and solve problems involving various polygons
Relationships Among Angles: Understand special relationships among angles
Goal Standard
Investigate techniques for estimating and measuring angles
Use tools to sketch angles
Reason about the properties of angles formed by parallel lines and transversals
Use information about supplementary, complementary, vertical, and adjacent angles in a shape to solve for an unknown angle in a multi-step problem
Constructing Polygons: Understand the properties needed to construct polygons
Goal Standard
Draw or sketch polygons with given conditions by using various tools and techniques such as freehand, use of a ruler and protractor, and use of technology
Determine what conditions will produce a unique polygon, more than one polygon, or no polygon, particularly triangles and quadrilaterals
Recognize the special properties of polygons, such as angle sum, side-length relationships, and symmetry, that make them useful in building, design, and

nature
Solve problems that involve properties of shapes
List of Common Core Standards in Shapes and Designs: 7.EE.A.2 Understand that rewriting an expression in different forms in a problem context can shed light on the problem and how the quantities in it are related. Investigation 2
7.EE.B.4 Use variables to represent quantities in a real-world or mathematical problem, and construct simple equations and inequalities to solve problems by reasoning about the quantities. Investigation 2
7.G.A.2 Draw (freehand, with ruler and protractor, and with technology) geometric shapes with given conditions. Focus on constructing triangles from three measures of angles or sides, noticing when the conditions determine a unique triangle, more than one triangle, or no triangle. Investigations 1, 2, and 3
7.G.B.5 Use facts about supplementary, complementary, vertical, and adjacent angles in a multi-step problem to write and solve simple equations for an unknown angle in a figure. Investigations 1, 2, and 3

CMP3 Accentuate the Negative
Rational Numbers: Develop an understanding that rational numbers consist of positive numbers, negative numbers, and zero
Goal Standard
Explore relationships between positive and negative numbers by modeling them on a number line
Use appropriate notation to indicate positive and negative numbers
Compare and order positive and negative rational numbers (integers, fractions, decimals, and zero) and locate them on a number line
Recognize and use the relationship between a number and its opposite (additive inverse) to solve problems
Relate direction and distance to the number line
Use models and rational numbers to represent and solve problems
Operations With Rational Numbers: Develop understanding of operations with rational numbers and their properties
Goal Standard
Develop and use different models (number line, chip model) for representing addition, subtraction, multiplication, and division
Develop algorithms for adding, subtracting, multiplying, and dividing integers
Recognize situations in which one or more operations of rational numbers are needed
Interpret and write mathematical sentences to show relationships and solve problems
Write and use related fact families for addition/subtraction and multiplication/division to solve simple equations
Use parentheses and the Order of Operations in computations
Understand and use the Commutative Property for addition and multiplication
Apply the Distributive Property to simplify expressions and solve problems
List of Common Core Standards in Accentuate the Negative:

7.NS.A.1 Apply and extend previous understandings of addition and subtraction to add and subtract rational numbers; represent addition and subtraction on a horizontal or vertical number line. Investigations
1, 2, and 4
7.NS.A.1a Describe situations in which opposite quantities combine to make 0. For example, a hydrogen atom has 0 charge because its two constituents are oppositely charged. Investigations 1 and 2
7.NS.A.1b Understand p+q as a number located a distance |q| from p, in a positive or negative direction depending on whether q is positive or negative. Show that a number and its opposite have a sum of zero. Interpret sums of rational numbers by describing real-world contexts. Investigations 1 and 2
7.NS.A.1c Understand subtraction of rational numbers as adding the inverse, p−q=p+(−q). Show that the distance between two rational numbers on the number line is the absolute value of their difference, and apply this principle in real-world contexts. Investigations 1 and 2
7.NS.A.1d Apply properties of operations as strategies to add or subtract rational numbers. Investigations 2
and 4
7.NS.A.2 Apply and extend previous understandings of multiplication and division of fractions to divide rational numbers. Investigations 3 and 4
7.NS.A.2a Understand that multiplication is extended from fractions to rational numbers by requiring that operations continue to satisfy the properties of operations, particularly the distributive property, leading to products such as (–1)(–1) =1 and the rules for multiplying signed numbers. Interpret products of rational numbers by describing real-world contexts. Investigations 3 and 4
7.NS.A.2b Understand that integers can be divided provided that the divisor is not zero, and every quotient of integers (with non-zero divisor) is a rational number. If p and q are integers, then −(p/q)=(−p)/q=p/(−q). Interpret quotients of rational numbers by describing real-world contexts. Investigation 3
7.NS.A.2c Apply properties of operations as strategies to multiply and divide rational numbers. Investigations 3 and 4
7.NS.A.2d Convert a rational number to a decimal using long division; know that the decimal form of a rational number terminates in 0s or eventually repeats.Investigation 3
7.NS.A.3 Solve real-world problems involving the four operations with rational numbers. Investigations 1, 2,
3, and 4
7.EE.B.3 Solve multi-step and real-life mathematical problems posed with positive and negative rational numbers in any form (whole numbers, fractions, and decimals), using tools strategically. Apply properties of

operations to calculate with numbers in any form; convert between forms as appropriate; and assess the reasonableness of answers using mental computation and estimation strategies. Investigations 2, 3, and 4
7.EE.B.4 Use variables to represent quantities in a real-world or mathematical problem, and construct simple equations and inequalities to solve problems by reasoning about the quantities. Investigation 1
7.EE.B.4b Solve word problems leading to inequalities of the form px+q>ror px+q<r, where p, q, and r are specific rational numbers. Graph the solution set of the inequality and interpret it in the context of the problem. Investigation 1

CMP3 Stretching and Shrinking
Similar Figures: Understand what it means for figures to be similar
Goal Standard
Identify similar figures by comparing corresponding sides and angles
Use scale factors and ratios to describe relationships among the side lengths, perimeters, and areas of similar figures
Generalize properties of similar figures
Recognize the role multiplication plays in similarity relationships
Recognize the relationship between scale factor and ratio in similar figures
Use informal methods, scale factors, and geometric tools to construct similar figures (scale drawings)
Compare similar figures with non similar figures
Distinguish algebraic rules that produce similar figures from those that produce non similar figures
Use algebraic rules to produce similar figures
Recognize when a rule shrinks or enlarges a figure
Explore the effect on the image of a figure if a number is added to the x- or y‑coordinates of the figure’s vertices
Reasoning With Similar Figures Develop strategies for using similar figures to solve problems
Goal Standard
Use the properties of similarity to find distances and heights that cannot be measured directly
Predict the ways that stretching or shrinking a figure will affect side lengths, angle measures, perimeters, and areas
Use scale factors or ratios to find missing side lengths in a pair of similar figures
Use similarity to solve real-world problems

List of Common Core Standards in Stretching and Shrinking: 7.RP.A.2 Recognize and represent proportional relationships between quantities. Investigations 1, 2, 3, and 4
7.RP.A.2a Decide whether two quantities are in a proportional relationship, e.g., by testing for equivalent ratios in a table or graphing on a coordinate plane and observing whether the graph is a straight line through the origin. Investigations 2, 3, and 4
7.RP.A.2b Identify the constant of proportionality (unit rate) in tables, graphs, equations, diagrams, and verbal descriptions of proportional relationships. Investigations 1, 2, 3, and 4
7.RP.A.3 Use proportional relationships to solve multistep ratio and percent problems.Investigation 4
7.EE.B.3 Solve multi step real-life and mathematical problems posed with positive and negative rational numbers in any form (whole numbers, fractions, and decimals), using tools strategically. Apply properties of operations to calculate with numbers in any form; convert between forms as appropriate; and assess the reasonableness of answers using mental computation and estimation strategies. Investigation 4
7.EE.B.4 Use variables to represent quantities in a real-world or mathematical problem, and construct simple equations and inequalities to solve problems by reasoning about the quantities. Investigation 4
Note: During this Investigation, students use variables to represent quantities and reason about unknown amounts. They are not directly asked to construct simple equations and inequalities in this Unit. 7.G.A.1 Solve problems involving scale drawings of geometric figures, including computing actual lengths and areas from a scale drawing and reproducing a scale drawing at a different scale. Investigations 1, 2, 3, and 4
7.G.A.2 Draw (freehand, with ruler and protractor, and with technology) geometric shapes with given conditions. Focus on constructing triangles from three measures of angles or sides, noticing when the conditions determine a unique triangle, more than one triangle, or no triangle. Investigations 1 and 3
7.G.B.6 Solve real-world and mathematical problems involving area, volume, and surface area of two- and three-dimensional objects composed of triangles, quadrilaterals, polygons, cubes, and right prisms. Investigations 1, 2, 3, and 4
Note: The development in this Unit is primarily with two-dimensional objects. Three-dimensional objects are further developed in Filling and Wrapping. Essential for 7.EE.B.4a Solve word problems leading to equations of the form px + q = r and p(x + q) = r, where p, q, and r are specific rational numbers. Solve equations of these forms fluently. Compare an algebraic solution to an arithmetic solution, identifying the sequence of the operations used in each approach. Investigations 2, 3,
and 4

CMP3 Comparing and Scaling
Ratios, Rates, and Percents: Understand ratios, rates, and percents
Goal Standard
Use ratios, rates, fractions, differences, and percents to write statements comparing two quantities in a given situation
Distinguish between and use both part-to-part and part-to-whole ratios in comparisons
Use percents to express ratios and proportions
Recognize that a rate is a special ratio that compares two measurements with different units
Analyze comparison statements made about quantitative data for correctness and quality
Make judgments about which kind of comparison statements are most informative or best reflect a particular point of view in a specific situation
Proportionality: Understand proportionality in tables, graphs, and equations
Goal Standard
Recognize that constant growth in a table, graph, or equation is related to proportional situations
Write an equation to represent the pattern in a table or graph of proportionally related variables
Relate the unit rate and constant of proportionality to an equation, graph, or table describing a proportional situation
Reasoning Proportionally: Develop and use strategies for solving problems that require proportional reasoning
Goal Standard
Recognize situations in which proportional reasoning is appropriate to solve the problem
Scale a ratio, rate, percent, or fraction to make a comparison or find an equivalent representation

Use various strategies to solve for an unknown in a proportion, including scaling, rate tables, percent bars, unit rates, and equivalent ratios
Set up and solve proportions that arise from real-world applications, such as finding discounts and markups and converting measurement units
List of Common Core Standards in Comparing and Scaling: 7.RP.A.1 Compute unit rates associated with ratios of fractions, including ratios of lengths, areas and other quantities measured in like or different units. Investigations 2 and 3
7.RP.A.2 Recognize and represent proportional relationships between quantities. Investigations 1, 2, and 3
7.RP.A.2a Decide whether two quantities are in a proportional relationship, e.g., by testing for equivalent ratios in a table or graphing on a coordinate plane and observing whether the graph is a straight line through the origin. Investigations 1, 2, and 3
7.RP.A.2b Identify the constant of proportionality (unit rate) in tables, graphs, equations, diagrams, and verbal descriptions of proportional relationships. Investigations 2 and 3
7.RP.A.2c Represent proportional relationships by equations. Investigations 1, 2, and 3
7.RP.A.2d Explain what a point (x, y) on the graph of a proportional relationship means in terms of the situation, with special attention to the points (0, 0) and (1,r) where r is the unit rate. Investigations 2 and 3
7.RP.A.3 Use proportional relationships to solve multistep ratio and percent problems. Investigations 1, 2,
and 3
7.NS.A.3 Solve real-world and mathematical problems involving the four operations with rational numbers. Investigation 3
7.EE.B.3 Solve multi step real-life and mathematical problems posed with positive and negative rational numbers in any form (whole numbers, fractions, and decimals), using tools strategically. Apply properties of operations to calculate with numbers in any form; convert between forms as appropriate; and assess the reasonableness of answers using mental computation and estimation strategies. Investigation 3
7.EE.B.4 Use variables to represent quantities in a real-world or mathematical problem, and construct simple equations and inequalities to solve problems by reasoning about the quantities. Investigations 1, 2,
and 3
7.EE.B.4a Solve word problems leading to equations of the form px+q=rand p(x+q)=r, where p, q, and r are specific rational numbers. Solve equations of these forms fluently. Compare an algebraic solution to an arithmetic solution, identifying the sequence of the operations used in each approach. Investigations 2 and
3

CMP3 Moving Straight Ahead
Linear Relationships: Recognize problem situations in which two variables have a linear relationship
Goal Standard
Identify and describe the patterns of change between the independent and dependent variables for linear relationships represented by tables, graphs, equations, or contextual settings
Construct tables, graphs, and symbolic equations that represent linear relationships
Identify the rate of change between two variables and the x‑ and y‑intercepts from graphs, tables, and equations that represent linear relationships
Translate information about linear relationships given in a contextual setting, a table, a graph, or an equation to one of the other forms
Write equations that represent linear relationships given specific pieces of information, and describe what information the variables and numbers represent
Make a connection between slope as a ratio of vertical distance to horizontal distance between two points on a line and the rate of change between two variables that have a linear relationship
Recognize that y=mx represents a proportional relationship
Solve problems and make decisions about linear relationships using information given in tables, graphs, and equations
Equivalence: Understand that the equality sign indicates that two expressions are equivalent
Goal Standard
Recognize that the equation y=mx+b represents a linear relationship and means that mx+b is an expression equivalent to y
Recognize that linear equations in one unknown, k=mx+b or y=m(t)+b, where k, t, m, and b are constant numbers, are special cases of the equation y=mx+b
Recognize that finding the missing value of one of the variables in a linear relationship, y=mx+b, is the same as finding a missing coordinate of a point (x,y) that lies on the graph of the relationship
Solve linear equations in one variable using symbolic methods, tables, and graphs

Recognize that a linear inequality in one unknown is associated with a linear equation
Solve linear inequalities using graphs or symbolic reasoning
Show that two expressions are equivalent
Write and interpret equivalent expressions
List of Common Core Standards in Moving Straight Ahead: 7.RP.A.2 Recognize and represent proportional relationships between quantities. Investigation 1
7.RP.A.2a Decide whether two quantities are in a proportional relationship, e.g., by testing for equivalent ratios in a table or graphing on a coordinate plane and observing whether the graph is a straight line through the origin. Investigation 1
7.RP.A.2b Identify the constant of proportionality (unit rate) in tables, graphs, equations, diagrams, and verbal descriptions of proportional relationships. Investigations 1 and 2
7.RP.A.2c Represent proportional relationships by equations. Investigations 1 and 2
7.RP.A.2d Explain what a point (x,y) on the graph of a proportional relationship means in terms of the situation, with special attention to the points (0,0) and (1,y), where r is the unit rate. Investigations 2 and 4
7.EE.A.1 Apply properties of operations as strategies to add, subtract, factor, and expand linear expressions with rational coefficients. Investigations 3 and 4
7.EE.A.2 Understand that rewriting an expression in different forms in a problem context can shed light on the problem and how the quantities in it are related. Investigations 3 and 4
7.EE.B.3 Solve multi-step real-life and mathematical problems posed with positive and negative rational numbers in any form (whole numbers, fractions, and decimals), using tools strategically. Apply properties of operations to calculate with numbers in any form; convert between forms as appropriate; and assess the reasonableness of answers using mental computation and estimation strategies. Investigations 1, 2, 3, and 4
7.EE.B.4 Use variables to represent quantities in a real-world or mathematical problem, and construct simple equations and inequalities to solve problems by reasoning about the quantities. Investigations 1, 2, 3, and 4
7.EE.B.4a Solve word problems leading to equations of the form px+q=rand p(x+q)=r, where p, q, and r are specific rational numbers. Solve equations of these forms fluently. Compare an algebraic solution to an arithmetic solution, identifying the sequence of the operations used in each approach. Investigations 1, 2, 3,
and 4

7.EE.B.4b Solve word problems leading to inequalities of the form px+q>ror px+q<r, where p, q, and r are specific rational numbers. Graph the solution set of the inequality and interpret it in the context of the problem. Investigation 3

CMP3 What Do You Expect?
Experimental and Theoretical Probabilities: Understand experimental and theoretical probabilities
Goal Standard
Recognize that probabilities are useful for predicting what will happen over the long run
For an event described in everyday language, identify the outcomes in a sample space that compose the event
Interpret experimental and theoretical probabilities and the relationship between them and recognize that experimental probabilities are better estimates of theoretical probabilities when they are based on larger numbers
Distinguish between outcomes that are equally likely or not equally likely by collecting data and analyzing experimental probabilities
Realize that the probability of simple events is a ratio of favorable outcomes to all outcomes in the sample space
Recognize that the probability of a chance event is a number between 0 and 1 that expresses the likelihood of the event occurring
Approximate the probability of a chance event by collecting data on the chance process that produces it and observing its long-run relative frequency, and predict the approximate relative frequency given the probability
Determine the fairness of a game
Reasoning With Probability: Explore and develop probability models by identifying possible outcomes and analyze probabilities to solve problems
Goal Standard
Develop a uniform probability model by assigning equal probability to all outcomes, and use the model to determine probabilities of events
Develop a probability model (which may not be uniform) by observing frequencies in data generated from a chance process
Represent sample spaces for simple and compound events and find probabilities using organized lists, tables, tree diagrams, area models, and simulation
Realize that, just as with simple events, the probability of a compound event is a ratio of favorable outcomes to all outcomes in the sample space

Design and use a simulation to generate frequencies for simple and compound events
Analyze situations that involve two or more stages (or actions) called compound events
Use area models to analyze the theoretical probabilities for two-stage outcomes
Analyze situations that involve binomial outcomes
Use probability to calculate the long-term average of a game of chance
Determine the expected value of a probability situation
Use probability and expected value to make a decision
List of Common Core Standard in What Do You Expect?: 7.RP.A.2 Recognize and represent proportional relationships between quantities. Investigations 1, 2, 3, 4,
and 5
7.RP.A.2a Decide whether two quantities are in a proportional relationship. Investigations 1, 2, 3, 4, and 5
7.RP.A.3 Use proportional relationships to solve multistep ratio and percent problems. Investigations 1, 2,
3, 4, and 5
7.SP.C.5 Understand that the probability of a chance event is a number between 0 and 1 that expresses the likelihood of the event occurring. Larger numbers indicate greater likelihood. A probability near 0 indicates an unlikely event, a probability around 1/2 indicates an event that is neither unlikely nor likely, and a probability near 1 indicates a likely event. Investigations 2, 3, 4, and 5
7.SP.C.6 Approximate the probability of a chance event by collecting data on the chance process that produces it and observing its long-run relative frequency, and predict the approximate relative frequency given the probability. Investigations 1, 2, 3, and 4
7.SP.C.7 Develop a probability model and use it to find probabilities of events. Compare probabilities from a model to observed frequencies; if the agreement is not good, explain possible sources of the discrepancy. Investigations 2, 3, 4 and 5
7.SP.C.7a Develop a uniform probability model by assigning equal probability to all outcomes, and use the model to determine probabilities of events. Investigations 1, 3, 4 and 5
7.SP.C.7b Develop a probability model (which may not be uniform) by observing frequencies in data generated from a chance process. Investigations 1, 2, 3 and 4

7.SP.C.8 Find probabilities of compound events using organized lists, tables, tree diagrams, and simulation. Investigations 2, 3, 4 and 5
7.SP.C.8a Understand that, just as with simple events, the probability of a compound event is the fraction of outcomes in the sample space for which the compound event occurs. Investigations 2, 3, 4, and 5
7.SP.C.8b Represent sample spaces for compound events using methods such as organized lists, tables and tree diagrams. For an event described in everyday language (e.g., “rolling double sixes”), identify the outcomes in the sample space which compose the event. Investigations 2, 4, and 5
7.SP.C.8c Design and use a simulation to generate frequencies for compound events. Investigations 4 and
5

CMP3 Filling and Wrapping
Surface Areas and Volumes of Polygonal Prisms and Cylinders: Understand surface areas and volumes of prisms and cylinders and how they are related
Goal Standard
Describe prisms by using their vertices, faces, and edges
Visualize three-dimensional shapes and the effects of slicing those shapes by planes
Deepen understanding of volumes and surface areas of rectangular prisms
Estimate and calculate surface areas and volumes of polygonal prisms by relating them to rectangular prisms
Explore the relationships between the surface areas and volumes of prisms
Relate surface areas and volumes for common figures, especially optimization of surface area for fixed volume
Predict the effects of scaling dimensions on linear, surface area, and volume measures of prisms, cylinders, and other figures
Investigate the relationship between volumes of prisms and volumes of cylinders as well as the relationship between surface areas of prisms and surface areas of cylinders
Use volumes and surface areas of prisms to develop formulas for volumes and surface areas of cylinders
Discover that volumes of prisms and cylinders can be calculated as the product of the area of the base and the height
Solve problems involving surface areas and volumes of solid figures
Areas and Circumferences of Circles: Understand the areas and circumferences of circles and how they are related
Goal Standard
Relate area of a circle to covering a figure and circumference to surrounding a figure
Estimate and calculate areas and circumferences of circles
Explore the relationship between circle radius (or diameter) and circumference

Explore the relationship between circle radius (or diameter) and area
Investigate the connection of π to area calculation by estimating the number of radius squares needed to cover a circle
Investigate the relationship between area and circumference of a circle
Solve problems involving areas and circumferences of circles
Volumes of Spheres and Cones: Understand the relationships between the volumes of cylinders and the volumes of cones and spheres
Goal Standard
Relate volumes of cylinders to volumes of cones and spheres
Estimate and calculate volumes of spheres and cones
Solve problems involving surface areas and volumes of spheres and cones
List of Common Core Standards in Filling and Wrapping: 7.RP.A.2 Recognize and represent proportional relationships between quantities. Investigation 1 7.NS.A.3 Solve real-world and mathematical problems involving the four operations with rational numbers. Investigations 2, 3, and 4 7.EE.A.1 Apply properties of operations as strategies to add, subtract, factor, and expand linear expressions with rational coefficients. Investigation 3 7.EE.A.2 Understand that rewriting an expression in different forms in a problem context can shed light on the problem and how the quantities in it are related. Investigations 1 and 3 7.G.A.1 Solve problems involving scale drawings of geometric figures, including computing actual lengths and area from a scale drawing and reproducing a scale drawing at a different scale. Investigation 1
7.G.A.3 Describe the two-dimensional figures that result from slicing three-dimensional figures, as in plane sections of right rectangular prisms and right rectangular pyramids. Investigation 2 7.G.B.4 Know the formulas for the area and circumference of a circle and use them to solve problems; give an informal derivation of the relationship between the circumference and area of a circle. Investigations 3
and 4

7.G.B.6 Solve real-world and mathematical problems involving area, volume, and surface area of two- and three-dimensional objects composed of triangles, quadrilaterals, polygons, cubes, and right prisms. Investigations 1, 2, 3, and 4

CMP3 Samples and Populations
The Process of Statistical Investigation: Deepen the understanding of the process of statistical investigation and apply this understanding to samples
Goal Standard
Pose questions, collect data, analyze data, and interpret data to answer questions
Analysis of Samples: Understand that data values in a sample vary and that summary statistics of samples, even same-sized samples, taken from the same population also vary
Goal Standard
Choose appropriate measures of center (mean, median, or mode) and spread (range, IQR, or MAD) to summarize a sample
Choose appropriate representations to display distributions of samples
Compare summary statistics of multiple samples drawn from either the same population or from two different populations and explain how the samples vary
Design and Use of Simulations: Understand that simulations can model real-world situations
Goal Standard
Design a model that relies on probability concepts to obtain a desired result
Use the randomly generated frequencies for events to draw conclusions
Predictions and Conclusions About Populations: Understand that summary statistics of a representative sample can be used to gain information about a population
Goal Standard
Describe the benefits and drawbacks to various sampling plans
Use random-sampling techniques to select representative samples
Apply concepts from probability to select random samples from populations
Explain how sample size influences the reliability of sample statistics and resulting conclusions and predictions

Explain how different sampling plans influence the reliability of sample statistics and resulting conclusions and predictions
Use statistics from representative samples to draw conclusions about populations
Use measures of center, measures of spread, and data displays from more than one random sample to compare and draw conclusions about more than one population
Use mean and MAD, or median and IQR, from random samples to assess whether the differences in the samples are due to natural variability or due to meaningful differences in the underlying populations
List of Common Core Standards in Samples and Populations: 7.RP.A.2 Recognize and represent proportional relationships between quantities. Investigation 3
7.NS.A.1 Apply and extend previous understandings of addition and subtraction to add and subtract rational numbers; represent addition and subtraction on a horizontal or vertical number line diagram. Investigations 1 and 3
7.NS.A.1b Understand p+q as the number located a distance |q| from p, in the positive or negative direction depending on whether q is positive or negative . . . Interpret sums of rational numbers by describing real-world contexts. Investigations 1 and 3
7.SP.A.1 Understand that statistics can be used to gain information about a population by examining a sample of the population; generalizations about a population from a sample are valid only if the sample is representative of that population. Understand that random sampling tends to produce representative samples and support valid inferences. Investigations 2 and 3
7.SP.A.2 Use data from a random sample to draw inferences about a population with an unknown characteristic of interest. Generate multiple samples (or simulated samples) of the same size to gauge the variation in estimates or predictions. Investigations 2 and 3
7.SP.B.3 Informally assess the degree of visual overlap of two numerical data distributions with similar variabilities, measuring the difference between the centers by expressing it as a multiple of a measure of variability. Investigations 1 and 3
7.SP.B.4 Use measures of center and measures of variability for numerical data from random samples to draw informal comparative inferences about two populations. Investigations 1 and 3
7.SP.C.5 Understand that the probability of a chance event is a number between 0 and 1 that expresses the likelihood of the event occurring. Larger numbers indicate greater likelihood. A probability near 0

indicates an unlikely event, a probability around 1/2 indicates an event that is neither unlikely nor likely, and a probability near 1 indicates a likely event. Investigation 3
7.SP.C.7 Develop a probability model and use it to find probabilities of events. Compare probabilities from a model to observed frequencies; if the agreement is not good, explain possible sources of the discrepancy. Investigations 2 and 3
7.SP.C.7a Develop a uniform probability model by assigning equal probability to all outcomes, and use the model to determine probabilities of events. Investigations 2 and 3

Assessments

KDG 1st 2nd 3rd 4th 5th 6th 7th 8th
Testing Seasons: FALL, WINTER, SPRING
Operations and Algebraic ThinkingThe Real and Complex Number Systems
GeometryStatistics and Probability
Operations and Algebraic ThinkingNumber and OperationsMeasurement and Data
Geometry
MEASURES of ACADEMIC PROGRESS (MAP)
Measures of Academic Progress (MAP) are state-aligned computerized adaptive tests that reflect the instructional level of each student and measure growth over time.
The assessment itself is unique in that it adapts to the student’s ability, accurately measuring what a student knows and needs to learn. In addition, MAP tests measure academic growth over time, independent of grade level or age. Most importantly, the results educators receive have practical application to teaching and learning.
Students in Medinah take the mathematics and reading assessments in the fall, winter and spring from grades 1 thru 8. Each student is provided with a Rausch Unit Interval (RIT) score after testing. They are then given a RIT Target goal for the next assessment session.
Parents receive a summary of their student’s progress in mathematics and reading. The report includes a growth chart, current test scores compared to a National perspective, and the projected RIT goal for students next session of testing.

The Power of CBM
• Brief: Can be administered frequently without disrupting instruction.
• Predictive: Provides accurate predictions of reading and math achievement.
• Sensitive to Improvement: An increase in ability will be reflected in rising scores on the measure.
• Easy to administer and score: Can be used accurately by a wide range of education personnel.
• A valid measure of skills that are central to the domain being measured (reading, math)
• Standardized and reliable: Producing consistent results across time or testing conditions.
KDG 1st 2nd 3rd 4th 5th 6th 7th 8th
• Tests of Early Numeracy
(1st Grade Only)
*Administered for progress monitoring only
• Math Computation• Concepts and Applications
AIMSWEB At the foundation of Aimsweb is general outcome measurement, a form of curriculum-based measurement (CBM), used for universal screening and progress monitoring. This form of brief assessment measures overall performance of key foundational skills at each grade level and draws upon over thirty years of scientific research that demonstrates both its versatility to provide prediction or reading and math achievement as well as its sensitivity to growth.
Educators and researchers will tell you CBM is their assessment of choice for progress monitoring and Response to Intervention (RTI) because this method of general outcome measurement is:
• Available in multiple equivalent forms to reduce practice effects on retesting (up to 33 forms per measure, per grade)
Medinah School District #11 utilizes AIMSWeb assessments for both benchmarking of student performance in Fall, Winter, and Spring, and progress monitoring of targeted students, weekly or bi-weekly, throughout the school year. The chart below indicates specific test administration information for students in grade K-8. Unless otherwise noted, the AIMSweb tests are administered for both benchmarking and progress monitoring.
Testing Seasons: FALL, WINTER, SPRING